Introduction
Recurrent genomic aberrations are common in acute
myeloid leukemia (AML). The mixed lineage leukemia (MLL)
gene (also known as lysine methyltransferase 2A) is a
histone 3 lysine 4 (H3K4) methyltransferase involved in
hematopoiesis. Rearrangement of the MLL gene is present in
5–10% of AML cases in adults and in 35–50% of infant patients with
AML (1,2). Patients with MLL
rearrangements are generally classified as a high-risk group by the
World Health Organization (3). The
N-terminus of the MLL gene is fused to >60 different
genes via chromosome translocations in cancer, and the most common
fusion partner is MLLT3, super elongation complex subunit
(AF9) (4). Leukemia with
MLL-rearrangements has lower frequency of somatic mutations
compared with other cancer types, as revealed by genome-scale
sequencing (5). However,
deregulated chromatin signatures and gene transcription are
characteristic of leukemia cases exhibiting MLL-rearrangements.
A previous study demonstrated that MLL fusion
proteins recruit DOT1 like histone lysine methyltransferase (DOT1L)
to target loci resulting in elevated levels of histone H3
dimethylation at lysine 79 (H3K79me2) (6). Another study revealed that specific
MLL-AF9 target genes were all marked by H3K79me2, histone H3
acetylation at lysine 27 (H3K27ac) and histone H3 trimethylation at
lysine 4 (H3K4me3) (7). These
studies performed chromatin immunoprecipitation (ChIP) to identify
the aberrant pattern of chromatin signatures in leukemia cells with
MLL-rearrangements; however, this was not compared with normal
hematopoietic cells. Ji et al (8) proposed the use of differential
principal component analysis (dPCA) for efficiently analyzing
differential chromatin signatures from large amounts of
ChIP-sequencing (Seq) data between two biological conditions.
The present study aimed to identify differentially
expressed genes (DEGs) and differential chromatin signatures in
MLL-AF9 binding sites between MLL-AF9 leukemia cells and normal
hematopoietic cells via bioinformatic methods. The association of
differential chromatin signatures with DEGs was assessed to obtain
a better understanding of deregulated transcriptome and epigenome
in MLL-AF9 leukemia cells. The current study provided new potential
targets for AML therapy.
Materials and methods
Acquisition of gene expression
datasets and ChIP-Seq data
The National Center of Biotechnology Information
(NCBI) Gene Expression Omnibus (GEO) database (ncbi.nlm.nih.gov/geo) was searched and microarray
expression data (GSE68643) and RNA-Seq data (GSE73457) were
downloaded for comparing MLL-AF9 retrovirus infected and wild-type
(WT) mouse bone marrow cells. Unprocessed data sets for microarray
(.cel files) and RNA-Seq (.sra files) were used for further
analysis.
DEG analysis
DEGs were identified using GEO2R (ncbi.nlm.nih.gov/geo/geo2r/) from a microarray
dataset (GSE68643). The probe was annotated as an official gene
symbol by the corresponding annotation files (GPL16570). For
RNA-Seq data (GSE73457), sra files were converted into the fastq
format using the SRA Toolkit version 2.9.1 (ncbi.nlm.nih.gov/Traces/sra/?view=software). Reads
were aligned to the mouse Ensemble (GRCm38.p6) reference genome
using HISAT2 version 2.0.4 (ccb.jhu.edu/software/hisat2/index.shtml) (9). Aligned reads were counted using HTSeq
version 0.5.4p3 (htseq.readthedocs.io/en/release_0.10.0/) and
summarized at the gene level guided by the gene annotation file in
GTF format from Ensembl (ftp://ftp.ensembl.org/pub/release-94/gtf/mus_musculus)
(10). The expression levels of
genes was calculated using cufflinks version 2.2.0
(cole-trapnell-lab.github.io/cufflinks/) and normalized to reads
per kilobase per million (RPKM) (11). DESeq2version 1.18.1 (bioconductor.org/packages/release/bioc/html/DESeq2.html)
was applied to analyze the differential expression of genes
(12). Only those genes with a
log2 fold change (FC)>1 and Benjamini and Hochberg
adjusted P<0.05 were recognized as significantly differentially
expressed in microarray and RNA-Seq data. Pearson's correlation
coefficient of log2FC was used to measure common DEGs reliability
between two expression datasets (GSE68643 and GSE73457).
Gene Ontology (GO) and Kyoto
Encyclopedia of Genes and Genomes (KEGG) pathway analysis
The Database for Annotation, Visualization and
Integrated Discovery (DAVID) database was used to detect GO
categories and KEGG pathways with significant over-representation
in DEGs compared with the whole genome (13). The significantly enriched
biological processes and KEGG were identified as Benjamini-Hochberg
adjusted P<0.05.
Identification of MLL-AF9 and WT MLL
binding sites in MLL-AF9 leukemia
To identify the binding sites of MLL-AF9 and WT MLL,
ChIP-Seq data obtained using antibodies against the N-terminus of
MLL-1 and the C-terminus of AF9 in various GEO datasets (GSE89336,
GSE79899, GSE54344 and GSE83671) were downloaded. Model-based
Meta-analysis of ChIP (MM-ChIP) software (http://liulab.dfci.harvard.edu/MM-ChIP/MMChIP-1.0.tar.gz)
was applied in the cross-study integrative analysis of MLL and AF9
ChIP-Seq data (14). The MLL and
AF9 binding peaks were overlapped to identify considerable
MLL-AF9-binding peaks using the mergePeaks function from
Hypergeometric Optimization of Motif EnRichment (HOMER) version 4.8
(homer.ucsd.edu/homer/) software
(15). MLL binding peaks without
AF9 signal were defined as MLL WT binding sites.
Analysis of differential chromatin
patterns at the WT MLL and MLL-AF9 binding sites
The ChIP-Seq data of histone modifications
downloaded from the GEO database are summarized in Table I. Using dPCA (www.biostat.jhsph.edu/dpca), the present study
analyzed differential levels of H3K4me3, H3K27ac and H3K79me2 at WT
MLL and MLL-AF9 binding sites in MLL-AF9 leukemia cells and normal
hematopoietic cells. Differential principal components (dPCs) with
high signal-to-noise ratio (SNR) were considered reliable dPCs to
report. The cut-off SNR value (SNR>5) was based on a previous
study (8). dPCA calculated the
false discovery rate (FDR) and log2 FC of the ChIP-Seq
binding signal of each dPC. Differential sites of reliable dPCs
were defined at a 5% FDR level. Genome regions with differential
ChIP-Seq binding signals were annotated by HOMER software.
 | Table I.Chromatin immunoprecipitation-Seq
data of histone modifications downloaded from GEO database. |
Table I.
Chromatin immunoprecipitation-Seq
data of histone modifications downloaded from GEO database.
| GEO Sample ID | Cell type | Experiment
type |
|---|
| GSM1313528 | Hematopoietic
stem/progenitor cells | H3K79me2 |
| GSM486702 | Hematopoietic
stem/progenitor cells | Input |
| GSM486709 | Hematopoietic
stem/progenitor cells | H3K4me3 |
| GSM486711 | Hematopoietic
stem/progenitor cells | H3K4me3 |
| GSM537629 | Hematopoietic
stem/progenitor cells | H3K4me3 |
| GSM537652 | Hematopoietic
stem/progenitor cells | H3K4me3 |
| GSM537662 | Hematopoietic
stem/progenitor cells | Input |
| GSM621404 | Hematopoietic
stem/progenitor cells | H3K4me3 |
| GSM621437 | Hematopoietic
stem/progenitor cells | H3K4me3 |
| GSM621439 | Hematopoietic
stem/progenitor cells | H3K4me3 |
| GSM621456 | Hematopoietic
stem/progenitor cells | Input |
| GSM621665 | Hematopoietic
stem/progenitor cells | H3K4me3 |
| GSM621667 | Hematopoietic
stem/progenitor cells | H3K4me3 |
| GSM621689 | Hematopoietic
stem/progenitor cells | Input |
| GSM669929 | Hematopoietic
stem/progenitor cells | Input |
| GSM669943 | Hematopoietic
stem/progenitor cells | H3K4me3 |
| GSM669961 | Hematopoietic
stem/progenitor cells | Input |
| GSM706846 | Hematopoietic
stem/progenitor cells | Input |
| GSM706847 | Hematopoietic
stem/progenitor cells | Input |
| GSM772870 | Hematopoietic
stem/progenitor cells | H3K27ac |
| GSM772885 | Hematopoietic
stem/progenitor cells | H3K27ac |
| GSM772894 | Hematopoietic
stem/progenitor cells | H3K27ac |
| GSM772950 | Hematopoietic
stem/progenitor cells | Input |
| GSM773041 | Hematopoietic
stem/progenitor cells | H3K4me3 |
| GSM773044 | Hematopoietic
stem/progenitor cells | Input |
| GSM773045 | Hematopoietic
stem/progenitor cells | Input |
| GSM773048 | MLL-AF9 leukemia
cells | Input |
| GSM1313524 | MLL-AF9 leukemia
cells | H3K4me3 |
| GSM1313525 | MLL-AF9 leukemia
cells | H3K79me2 |
| GSM1313530 | MLL-AF9 leukemia
cells | Input |
| GSM2108046 | MLL-AF9 leukemia
cells | H3K27ac |
| GSM2108047 | MLL-AF9 leukemia
cells | H3K4me3 |
| GSM2108048 | MLL-AF9 leukemia
cells | H3K79me2 |
| GSM2366240 | MLL-AF9 leukemia
cells | H3K4me3 |
| GSM2366241 | MLL-AF9 leukemia
cells | H3K4me3 |
| GSM2366243 | MLL-AF9 leukemia
cells | H3K4me3 |
| GSM2366245 | MLL-AF9 leukemia
cells | H3K4me3 |
| GSM2366246 | MLL-AF9 leukemia
cells | H3K4me3 |
| GSM2366247 | MLL-AF9 leukemia
cells | H3K4me3 |
| GSM2366248 | MLL-AF9 leukemia
cells | H3K4me3 |
| GSM721210 | MLL-AF9 leukemia
cells | H3K79me2 |
Validation of potential direct targets
of MLL-AF9 genes
The gene expression data were downloaded from the
UCSC genome browser database (https://xenabrowser.net/datapages/?cohort=TCGA%20TARGET%20GTEx&removeHub=https%3A%2F%2Fxena.treehouse.gi.ucsc.edu%3A443),
which contained RNA-seq data from three large cohorts, such as TCGA
(https://portal.gdc.cancer.gov/), TARGET
(https://ocg.cancer.gov/programs/target) and GETx
(https://commonfund.nih.gov/GTEx/).
Differential expression between AML samples with
MLL-AF9 translocation and normal blood samples was performed using
DESeq2 version 1.18.1 (bioconductor.org/packages/release/bioc/html/DESeq2.html).
All of the input parameters were default values.
Generation of MLL-AF9 leukemia
models
Bone marrow transplantation studies were performed
as previously described (16).
Briefly, C57BL/6 female mice (12 week old; Shanghai SLAC laboratory
Animal Co., Ltd.) were used as donors and recipients. A total of 22
recipients mice were housed in specific pathogen-free (SPF)
conditions under a 12 h light-dark cycle at 22±1°C, humidity of
50–60% with free access to food and water. The mice were randomly
divided into control and MLL-AF9 model groups (n=11 in each group;
weight, ~20 g). The donor mice were sacrificed and lineage negative
hematopoietic progenitors were obtained from femurs and tibias
using Lineage Cell Depletion mouse kit and LS MACS columns
(Miltenyi Biotec, Inc.) and cultured in RPMI-1640 medium (Hyclone;
GE Healthcare Life Sciences) supplemented with 20% fetal bovine
serum (Gibco; Thermo Fisher Scientific, Inc.), 100 ng/ml stem cell
factor, 10 ng/ml interleukin (IL)-3 and 10 ng/ml IL-6 (R&D
Systems, Inc.). Retrovirus was produced following infection of 293T
cells (The Institution of Biochemistry and Cell Biology, Chinese
Academy of Sciences) with retroviral construct pMIG-FLAG-MLL-AF9
(Addgene plasmid 71443; Addgene, Inc.) along with the helper
plasmid pCL-ECO (Addgene plasmid 12371; Addgene, Inc.) and the
virus supernatants was harvested 48 h after transfection, filtered
through a 0.45 µm syringe filter. The lineage negative
hematopoietic progenitors were infected by spinfection (657 g for 2
h at 32°C; 4 µg/µl polybrene). pMIG-FLAG-MLL-AF9 was a gift from
Professor Daisuke Nakada (Addgene plasmid no. 71443; http://n2t.net/addgene:71443; RRID, Addgene_71443)
(17). pCL-Eco was a gift from
Professor Inder Verma (Addgene plasmid no. 12371; http://n2t.net/addgene:12371; RRID, Addgene_12371)
(18). Infection efficiency was
shown to be 20–25% as assessed by GFP expression using flow
cytometry (BD FACSVerse; BD Biosciences; Becton, Dickinson and
Company). Recipient C57BL/6 mice were transferred from SPF
conditions to the RS 2000 biological irradiator (Rad Source
Technologies, Inc). The X-ray-irradiation lasted 5 min and 52 sec
with a total dose rate of 7.5 Gy. After irradiation, the animals
were placed back to their cages under SPF conditions. The infected
cells were intravenously injected via the tail vein into
X-ray-irradiated recipient C57BL/6 mice 48 h after infection
(106 transduced cells per mouse). All recipient mice
were housed in a specific pathogen-free environment and fed
autoclaved water (pH 2.0). Retroviral construct pMIG-FLAG-MLL-AF9
co-expressed MLL-AF9 along with a green fluorescent protein (GFP)
reporter gene, thus GFP-positive cells indicated effective MLL-AF9
virus infection. Peripheral blood was collected into Eppendorf
tubes from the mouse tail with EDTA anticoagulant, incubated with
red blood lysis buffer (Beijing Solarbio Science & Technology
Co., Ltd.) and subjected to flow cytometry analysis. The recipients
were evaluated for the percentage of GFP-positive cells in
peripheral blood 3 weeks after injection using flow cytometry (BD
FACSVerse; BD Biosciences; Becton, Dickinson and Company). The
control recipients received the same dose of radiation and were
intravenously injected with normal lineage negative hematopoietic
progenitors via the tail vein. The percentage of GFP-positive cells
increased with time in MLL-AF9 model mice.
Reverse transcription-quantitative
polymerase chain reaction (RT-qPCR) analysis
Total RNA samples harvested from the whole bone
marrow cells of sacrificed MLL-AF9 mice and WT C57BL/6 mice were
extracted using TRIzol reagent (Invitrogen; Thermo Fisher
Scientific, Inc.). cDNA was synthesized using Takara PrimeScript RT
Master Mix (cat. no. RR036A; Takara Biotechnology Co., Ltd.)
according to the manufacturer's protocols. The RT reaction was
performed as follows: 15 min at 37°C followed by an incubation at
85°C for 5 sec. qPCR was performed with SYBR Premix Ex Taq (cat.
no. DRR041A; Takara Biotechnology Co., Ltd.) using an Applied
Biosystems 7500 Real-Time PCR system (Thermo Fisher Scientific,
Inc.) following manufacturer's protocols. The thermocycling
conditions were as follows: Initial denaturation at 95°C for 30
sec, followed by 40 cycles of 95°C for 5 sec and 60°C for 30 sec.
Gene expression was normalized to the levels of mouse GAPDH mRNA.
Relative mRNA expression was calculated using the 2−ΔΔCq
method (19). Primer sequences are
listed in Table II.
| Table II.Primer for reverse
transcription-quantitative polymerase chain reaction. |
Table II.
Primer for reverse
transcription-quantitative polymerase chain reaction.
| Gene | Sequence |
|---|
| HOXA9 | Sense:
5′-CCCCGACTTCAGTCCTTGC-3′ |
|
| Antisense:
5′-GATGCACGTAGGGGTGGTG-3′ |
| HOXA5 | Sense:
5′-CTCATTTTGCGGTCGCTATCC-3′ |
|
| Antisense:
5′-ATCCATGCCATTGTAGCCGTA-3′ |
| HOXA10 | Sense:
5′-CCTGCCGCGAACTCCTTTT-3′ |
|
| Antisense:
5′-GGCGCTTCATTACGCTTGC-3′ |
| GNB4 | Sense:
5′-CAGGAGGCTGAACAGCTTCG-3′ |
|
| Antisense:
5′-GGCCCACGGAGTCCATATTA-3′ |
| SESN3 | Sense:
5′-CGGAAGGACAAAAGAATCCGA-3′ |
|
| Antisense:
5′-GTTCATCCGCCGTATTTGCT-3′ |
| PBX3 | Sense:
5′-CGAGGCGCAAGCAAAGAAAC-3′ |
|
| Antisense:
5′-TGCCAAAAGCATATTGTCCAGT-3′ |
| PLSCR1 | Sense:
5′-GGTATCCCCCTCCGTATCCAC-3′ |
|
| Antisense:
5′-GCCACCACCTGCATAACCT-3′ |
| DAPK1 | Sense:
5′-ATGACTGTGTTCAGGCAGGAA-3′ |
|
| Antisense:
5′-CCGGTACTTTTCTCACGACATTT-3′ |
Data analysis and statistics
Kaplan-Meier survival analysis and log-rank test
were performed to determine the overall survival of MLL-AF9 mice
and WT C57BL/6 mice. Leukemic burden in peripheral blood and
splenomegaly between groups were compared using Student's t-test.
Statistical analyses were performed using statistical software R
(version 3.3.3; www.r-project.org/) and survival package. P<0.05
was considered to indicate a statistically significant
difference.
Results
Study overview
The present study identified DEGs from two
independent datasets and mapped them to GO and KEGG pathways to
identify significantly enriched functional terms. Histone
modification changes in MLL-AF9 binding sites were further profiled
based on public ChIP-Seq datasets. The potential direct targets of
MLL-AF9 were identified by comparing alterations in histone
modifications with changes in gene expression. The differential
expression of potential direct targets of MLL-AF9 was validated in
the public AML project TARGET and by RT-qPCR in an MLL-AF9 mouse
model. A flowchart of presenting the study design is shown in
Fig. 1.
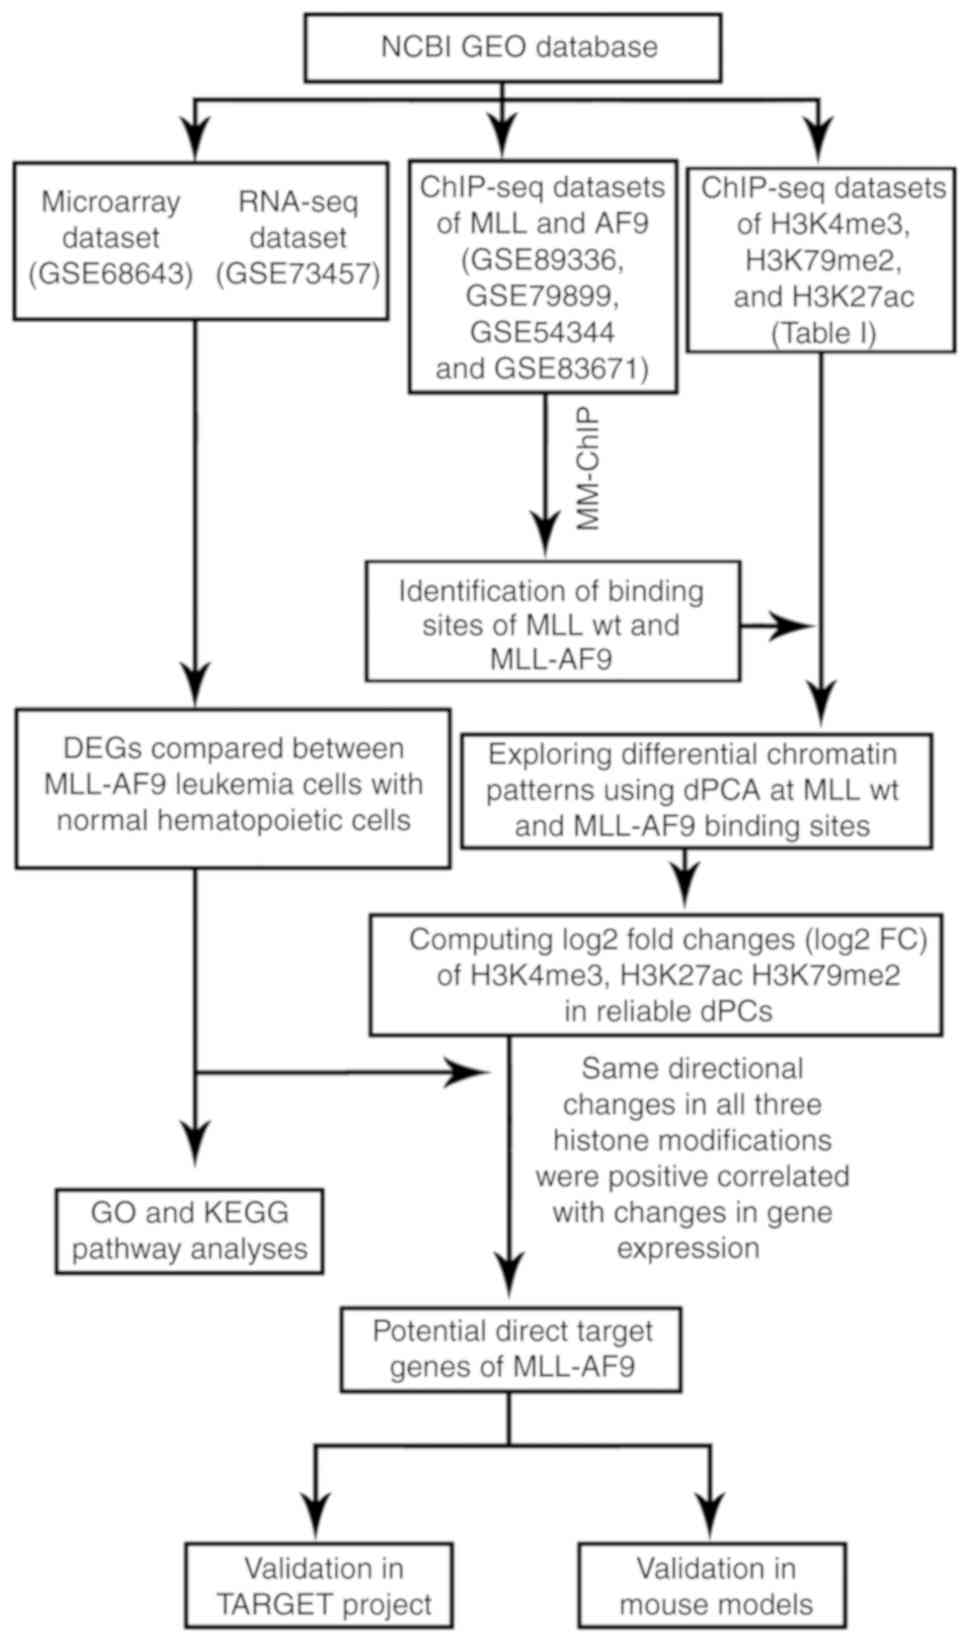 | Figure 1.Study schematic. NCBI, National
Center for Biotechnology Information; GEO, Gene Expression Omnibus;
ChIP, chromatin immunoprecipitation; MLL, mixed lineage leukemia;
AF9, MLLT3, super elongation complex subunit; H3K4me3, histone 3
lysine 4 trimethylation; H3K79me2, histone 3 lysine 79
dimethylation; H3K27ac, histone 3 lysine 27 acetylation; wt,
wild-type; DEGs, differentially expressed genes; dPCA, differential
principal component analysis; dPCs, differential principal
components; GO, Gene Ontology; KEGG, Kyoto Encyclopedia of Genes
and Genomes; TARGET, the Therapeutically Applicable Research to
Generate Effective Treatments project. |
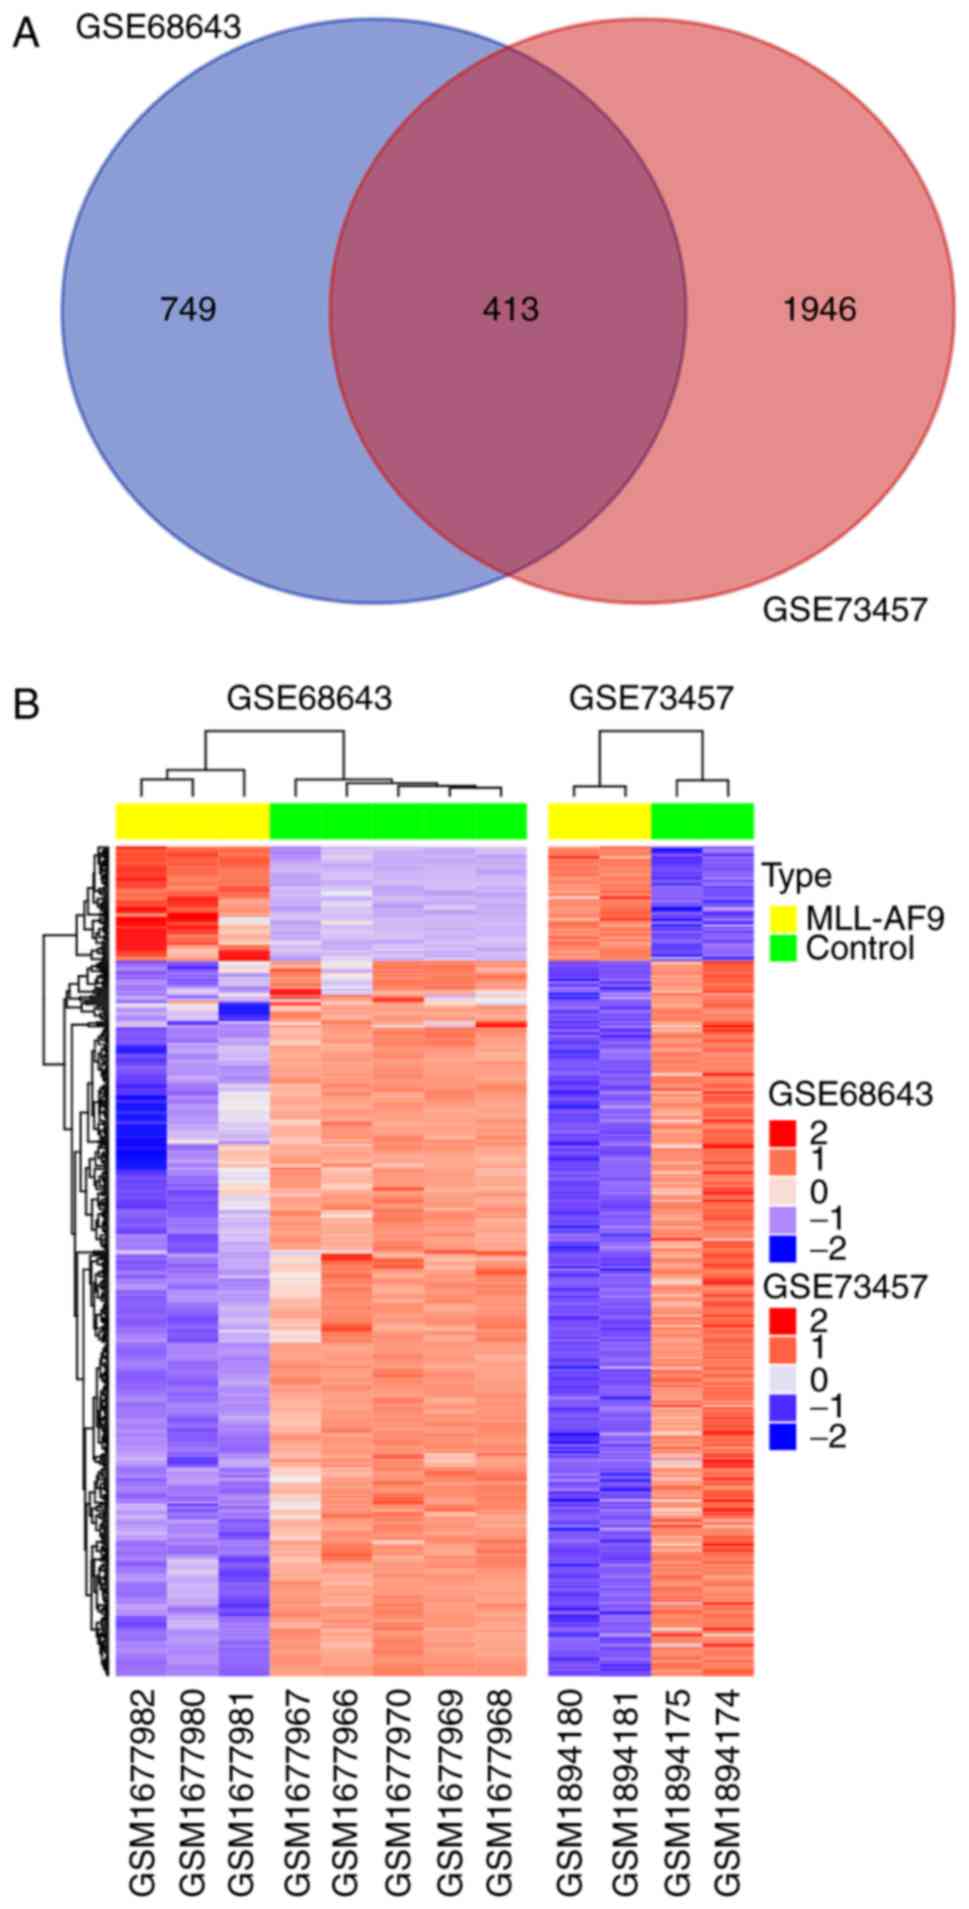
DEGs in MLL-AF9 AML
To identify DEGs associated with MLL-AF9, two
independent datasets (GSE68643 and GSE73457) were analyzed and
murine MLL-AF9 leukemia cells were compared with normal
hematopoietic cells to detect common genes across these datasets.
The analyses revealed that 413 genes were consistently identified
as being differentially expressed (adjusted P<0.05) with ≥2-fold
differential expression between the groups (Fig. 2A). The log2FC of common DEGs
exhibited a high correlation (Pearson's correlation coefficient
value=0.78) between these two independent experiments. Of these, 57
and 356 genes were upregulated and downregulated, respectively
(Fig. 2B). There were various
genes previously demonstrated to be associated with MLL-AF9,
including the homeobox A (HOXA) cluster genes,
Meis homeobox 1, β3 integrin and runt related
transcription factor 2. These results suggested that the
datasets used in the present study were suitable for MLL-AF9 gene
analysis.
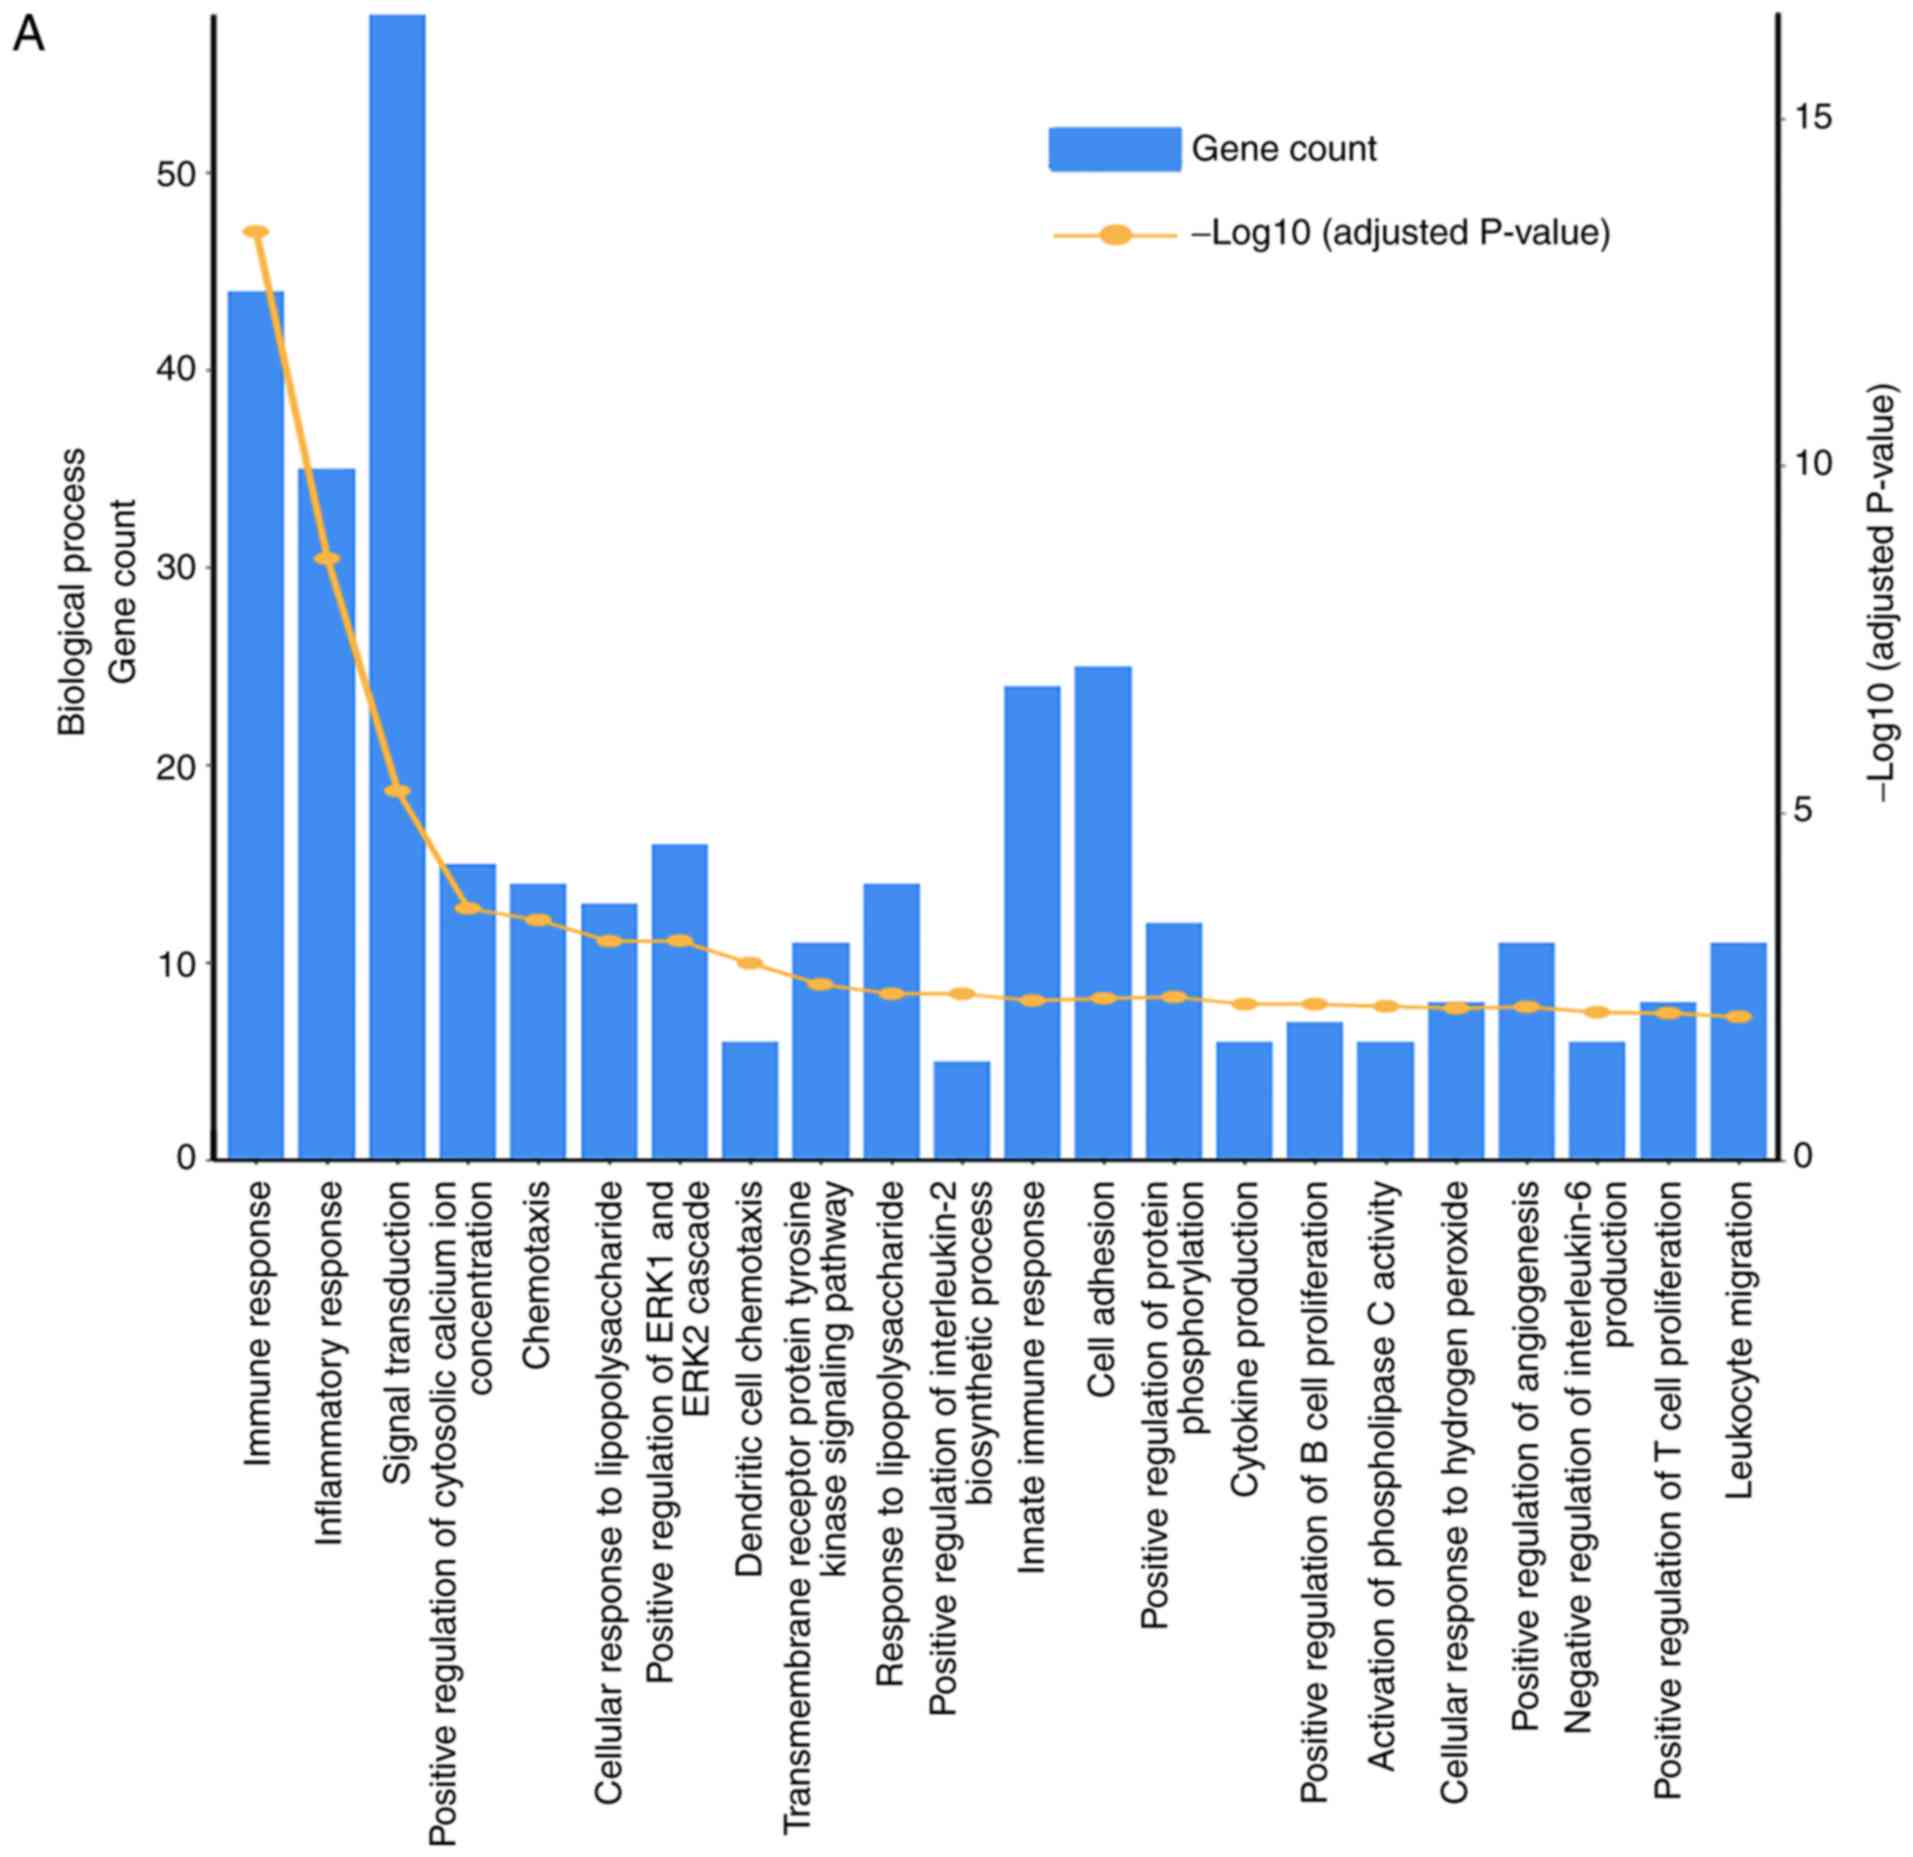
GO and KEGG functional enrichment
analysis of common DEGs
The common DEGs were then subjected to enrichment
analysis in DAVID. The common DEGs in blood were enriched in
biological processes of ‘immune system process’, ‘inflammatory
response’, ‘immune response’, ‘signal transduction’, ‘innate immune
response’, ‘adaptive immune response’, ‘chemotaxis’, ‘positive
regulation of ERK1 and ERK2 cascade’, ‘positive regulation of T
cell proliferation’, ‘positive regulation of cell migration’,
‘embryonic skeletal system morphogenesis’, ‘negative regulation of
inflammatory response’, ‘positive regulation of angiogenesis’ and
‘response to lipopolysaccharide’ (Fig.
3A). KEGG enrichment analysis revealed that DEGs were enriched
in pathways including the ‘nuclear factor-κB (NF-κB) signaling
pathway’, ‘tumor necrosis factor (TNF) signaling pathway’,
‘cytokine-cytokine receptor interaction’, hematopoietic cell
lineage’, ‘sphingolipid signaling pathway’, ‘T cell receptor
signaling pathway’, ‘transcriptional misregulation in cancer’ and
‘measles’ (Fig. 3B).
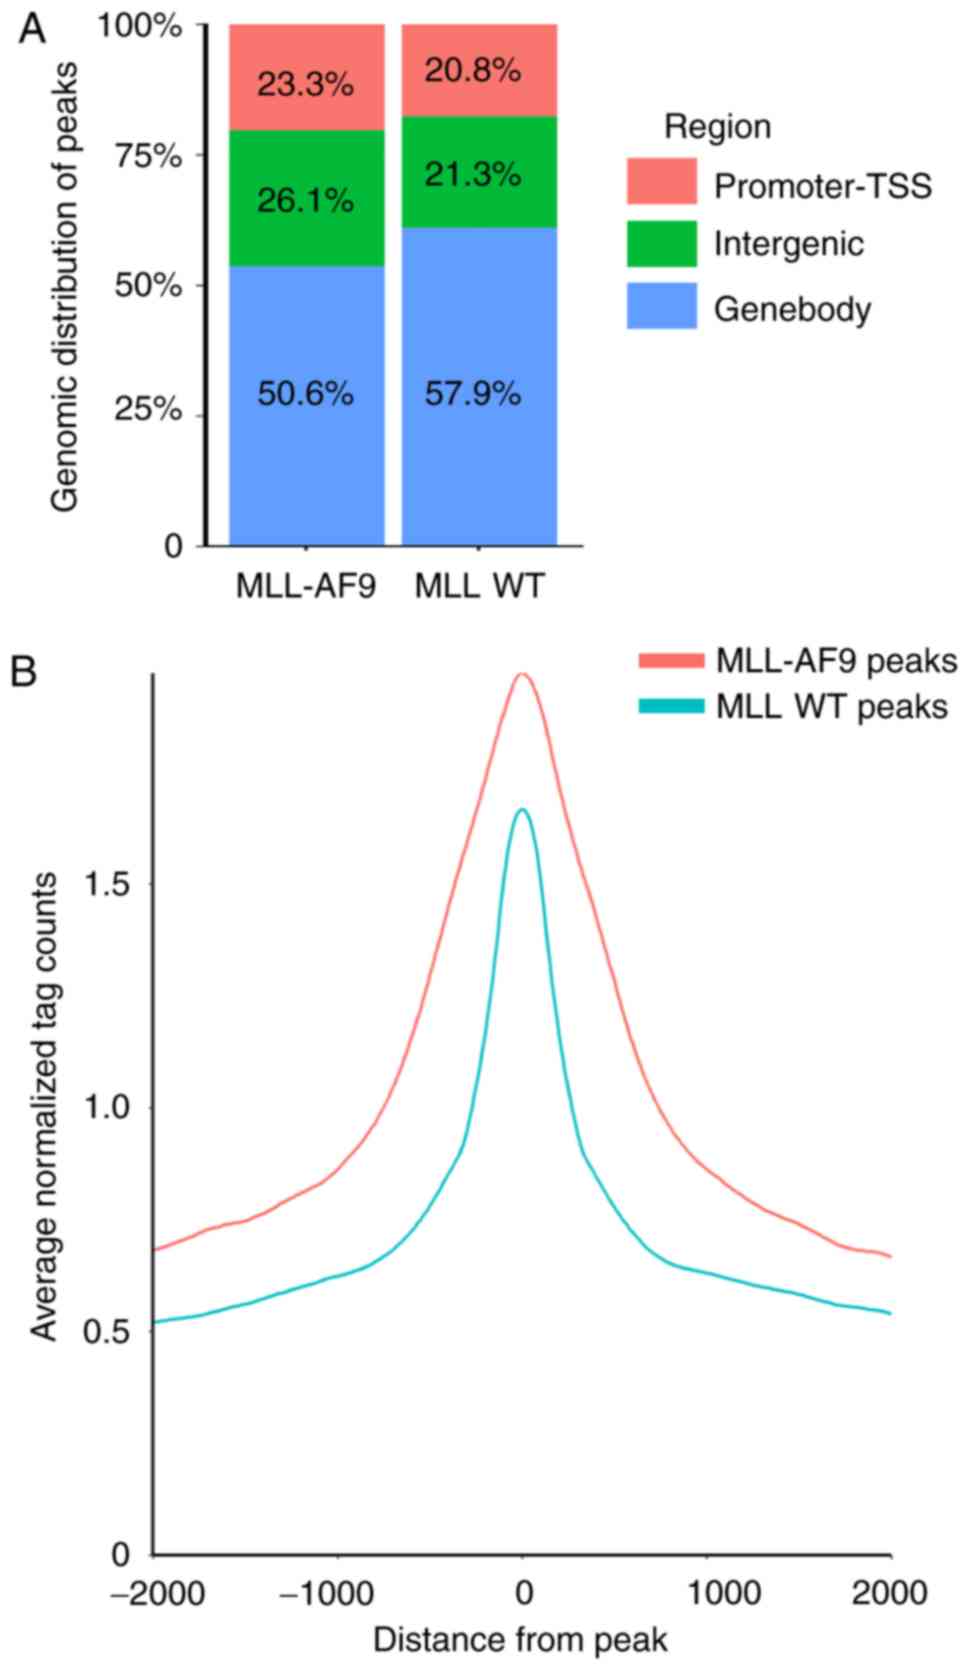
Identification of MLL-AF9 and MLL WT
binding peaks
Using MM-ChIP for integrative peaks analysis and
HOMER software for overlapping peaks. The present study identified
10,464 MLL-AF9 occupied regions and 11,722 WT MLL occupied regions.
There was no significant difference in genomic distribution between
the MLL-AF9 and MLL WT peaks (Fig.
4A). However, MLL-AF9 peaks exhibited a higher signal than the
MLL WT peaks (Fig. 4B).
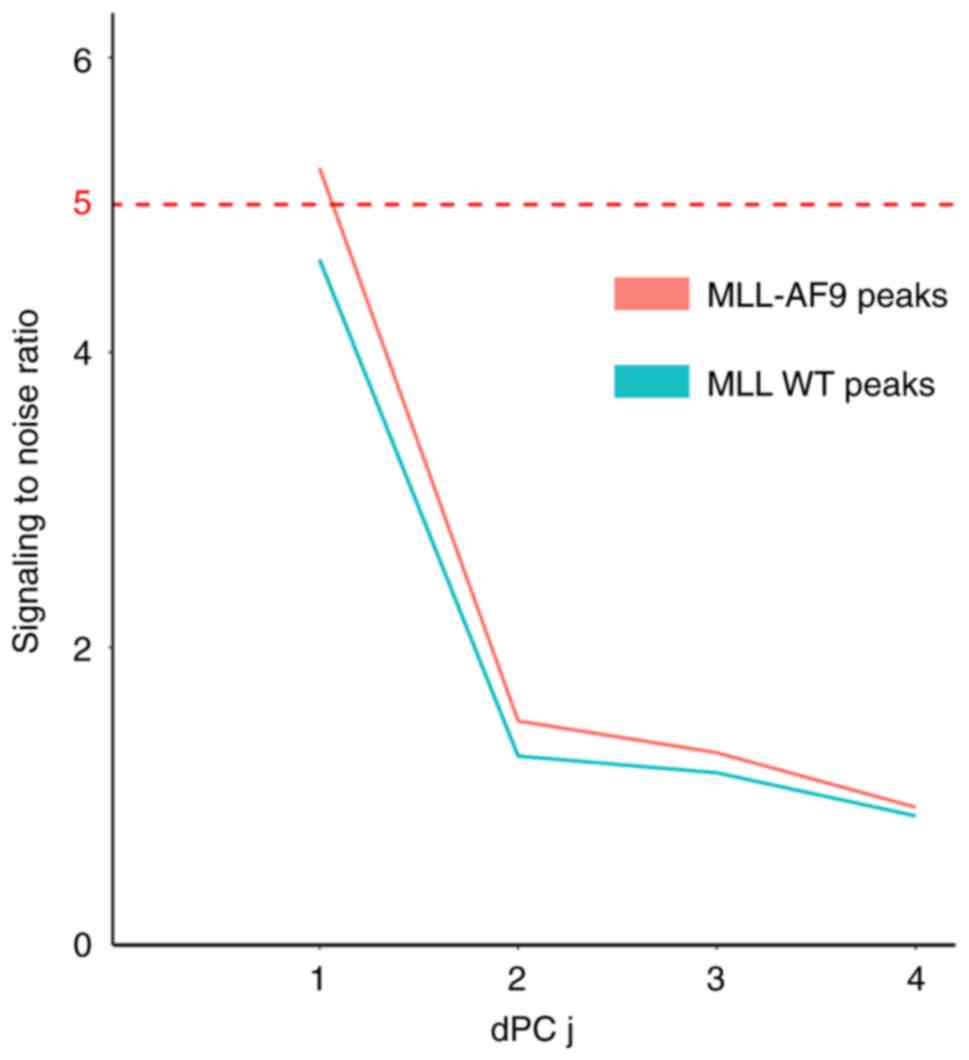
Identification of differential histone
modifications at MLL-AF9 binding sites between MLL-AF9 leukemia
cells and normal hematopoietic cells
To systematically investigate the aberrant histone
modifications involved in MLL-AF9, ChIP-Seq data of histone
modifications in MLL-AF9 leukemia cells and normal hematopoietic
progenitor cells were downloaded from NCBI GEO datasets, including
H3K4me3, H3K79me2 and H3K27ac. dPCA was applied to explore
differential chromatin patterns at the MLL-AF9 peaks and MLL-WT
peaks (Table I). The top dPCs in
MLL-AF9 exhibited SNR >5, while the SNR in dPCs of MLL-WT peaks
displayed SNR <5 (Fig. 5).
Thus, only significant histone modifications differences were
observed in MLL-AF9 binding sites. At the 5% FDR level, dPCA
reported 4,166 differential histone modifications sites.
Correlation between DEGs and
differential chromatin signatures
A total of 390 differential histone modifications
sites were associated with 220 MLL-AF9 DEGs, accounting for 53.3%
of all DEGs. As H3K4me3, H3K27ac and H3K79me2 are known as active
transcription activities, the same directional changes in all three
histone modifications were associated with an increase in gene
expression. As presented in Fig.
6, a specific epigenetic signature was identified and the
expression difference of 14 genes was highly associated with the
log2FC of H3K4me3, H3K27ac and H3K79me2 binding signals
in promoter-transcription start site regions when comparing MLL-AF9
leukemia cells and normal hematopoietic cells. These 14 genes were
identified as potential direct targets of MLL-AF9.
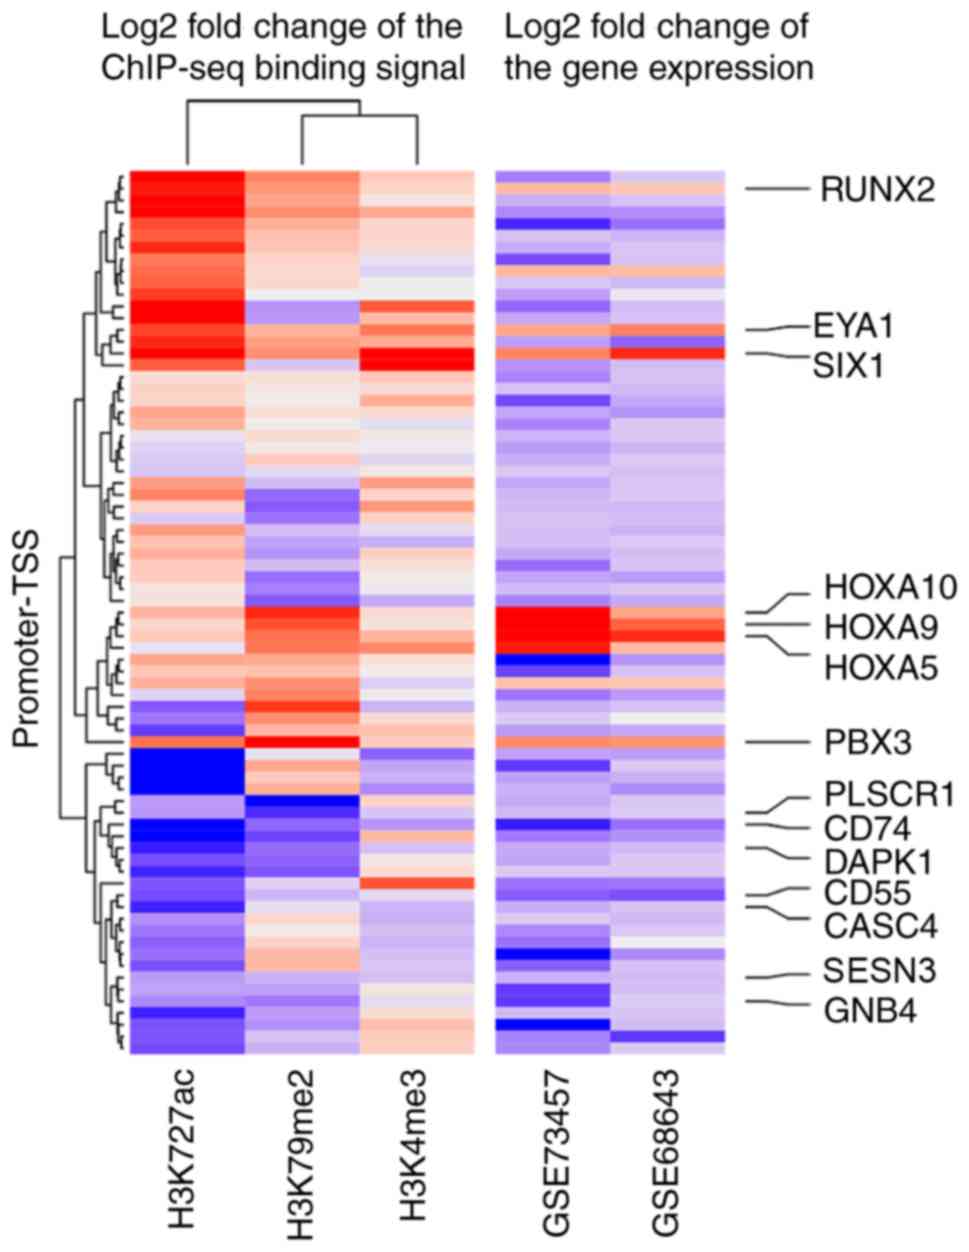 | Figure 6.Log2 fold change of DEGs and the log2
fold change of H3K4me3, H3K27ac and H3K79me2 binding signals in
promoter-TSS regions. TSS, transcriptional start site; RUNX2, runt
related transcription factor 2; EYA1, EYA transcriptional
coactivator and phosphatase 1; SIX1, SIX homeobox 1; HOXA, homeobox
A; PBX3, PBX homeobox 3; PLSCR1, phospholipid scramblase 1; DAPK1,
death associated protein kinase 1; CASC4, cancer susceptibility 4;
SESN3, sestrin 3; GNB4, G protein subunit β 4; H3K27ac, histone 3
lysine 27 acetylation; H3K79me2, histone 3 lysine 79 dimethylation;
H3K4me3, histone 3 lysine 4 trimethylation. |
Validation of expression profiles of
potential direct target genes of MLL-AF9 in the TARGET
database
The present study validated the epigenetic-regulated
genes by comparing the gene expression profiles of AML samples with
MLL-AF9 translocation and normal blood samples. The comparisons
indicated that 8 of the 14 epigenetic-regulated genes were
confirmed to be differentially expressed in AML patients with
MLL-AF9 translocation (Fig.
7).
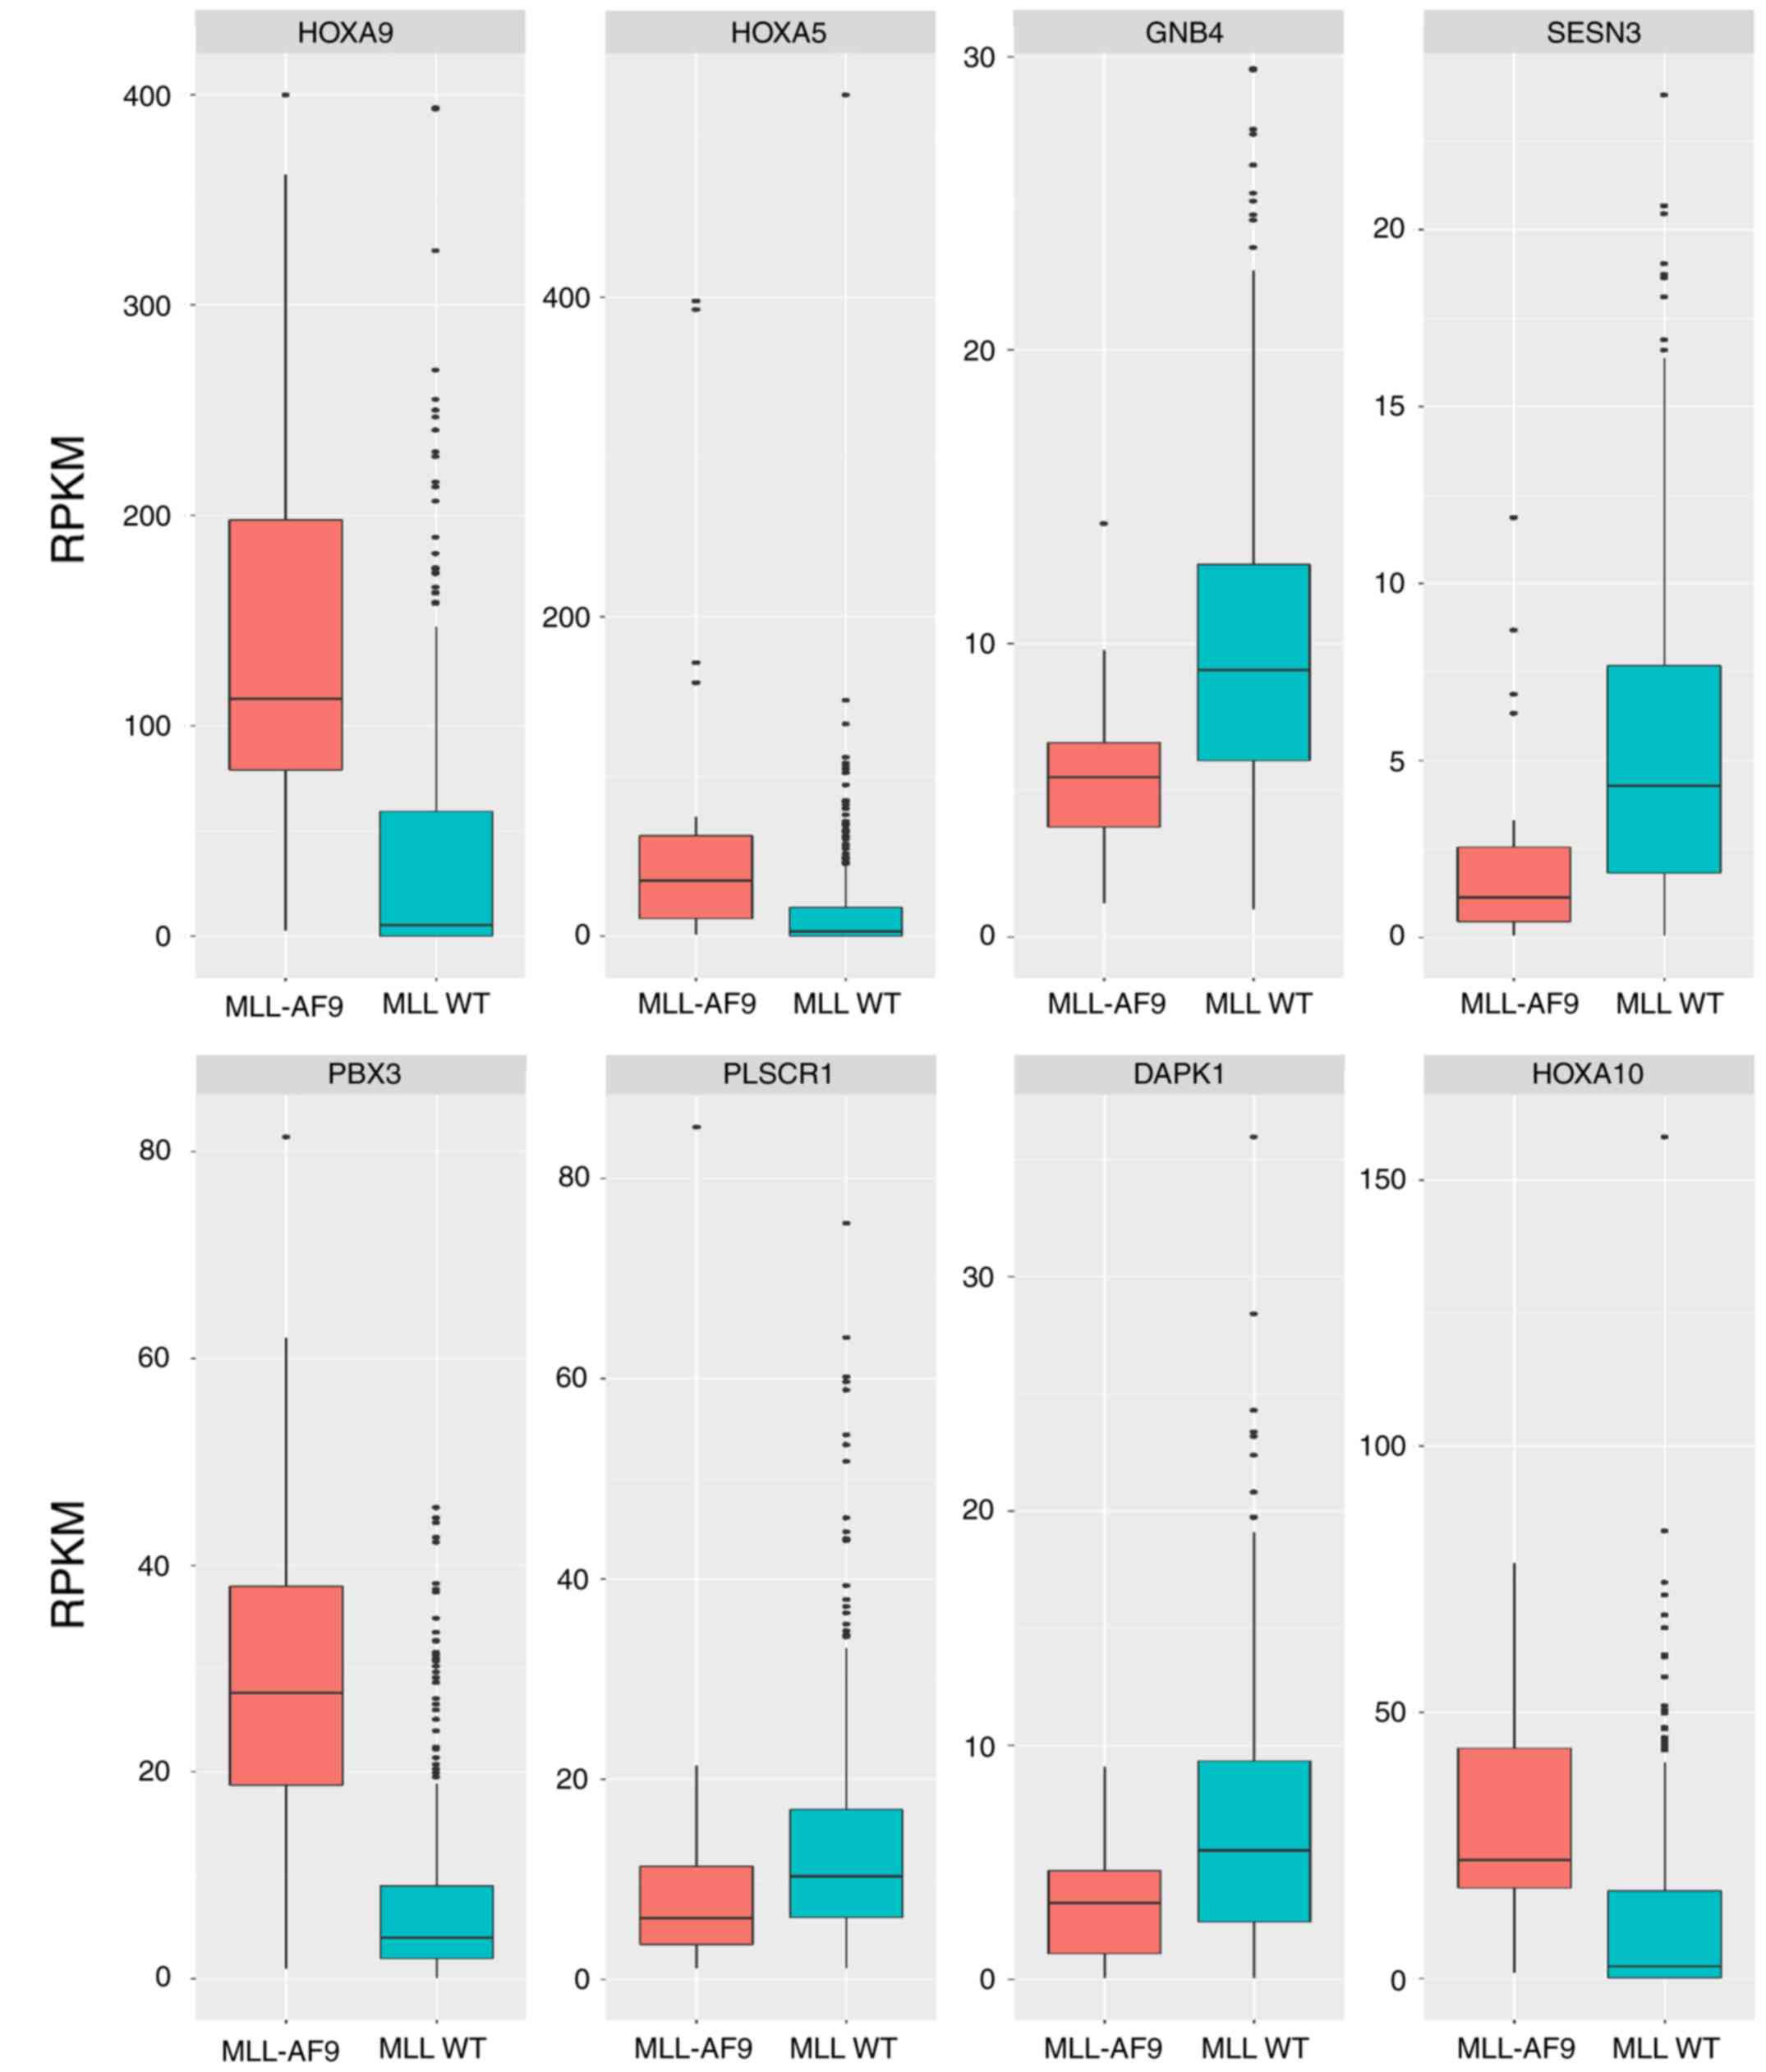 | Figure 7.Validation of expression profiles of
potential direct target genes of MLL-AF9 in the TCGA-TARGET-GTEx
cohort database comparing acute myeloid leukemia samples with
MLL-AF9 translocation and normal blood samples. FPKM, fragments per
kilobase per million; HOXA, homeobox A; MLL, mixed lineage
leukemia; AF9, MLLT3, super elongation complex subunit; GNB4, G
protein subunit β 4; SESN3, sestrin 3; PBX3, PBX homeobox 3;
PLSCR1, phospholipid scramblase 1; DAPK1, death associated protein
kinase 1; AML, acute myeloid leukemia; TCGA, The Cancer Genome
Atlas; TARGET, Therapeutically Applicable Research to Generate
Effective Treatments; GTEx, Genotype-Tissue Expression project. |
Generation of MLL-AF9 leukemia models
and RT-qPCR analysis
The present study constructed a murine AML model by
transducing lineage negative hematopoietic progenitors with a
retroviral vector encoding human MLL-AF9 and transplanting the
infected cells into 7.5 Gy X-ray-irradiated C57BL/6 mice via the
tail vein (Fig. 8A). The recipient
mice developed leukemia with an average life span of ~6 weeks
(Fig. 8B). The transplanted mice
exhibited similar leukemic burden by analysis of GFP+ cells in
peripheral blood (Fig. 8C).
Leukemic mice were sacrificed and splenomegaly was evaluated when
the tumor burden in peripheral blood was ≥90% (Fig. 8D). The expression levels of
potential direct target genes of MLL-AF9 were validated by RT-PCR,
and the results supported the microarray and RNA-Seq DEG results
(GSE68643, GSE73457; Fig. 8E).
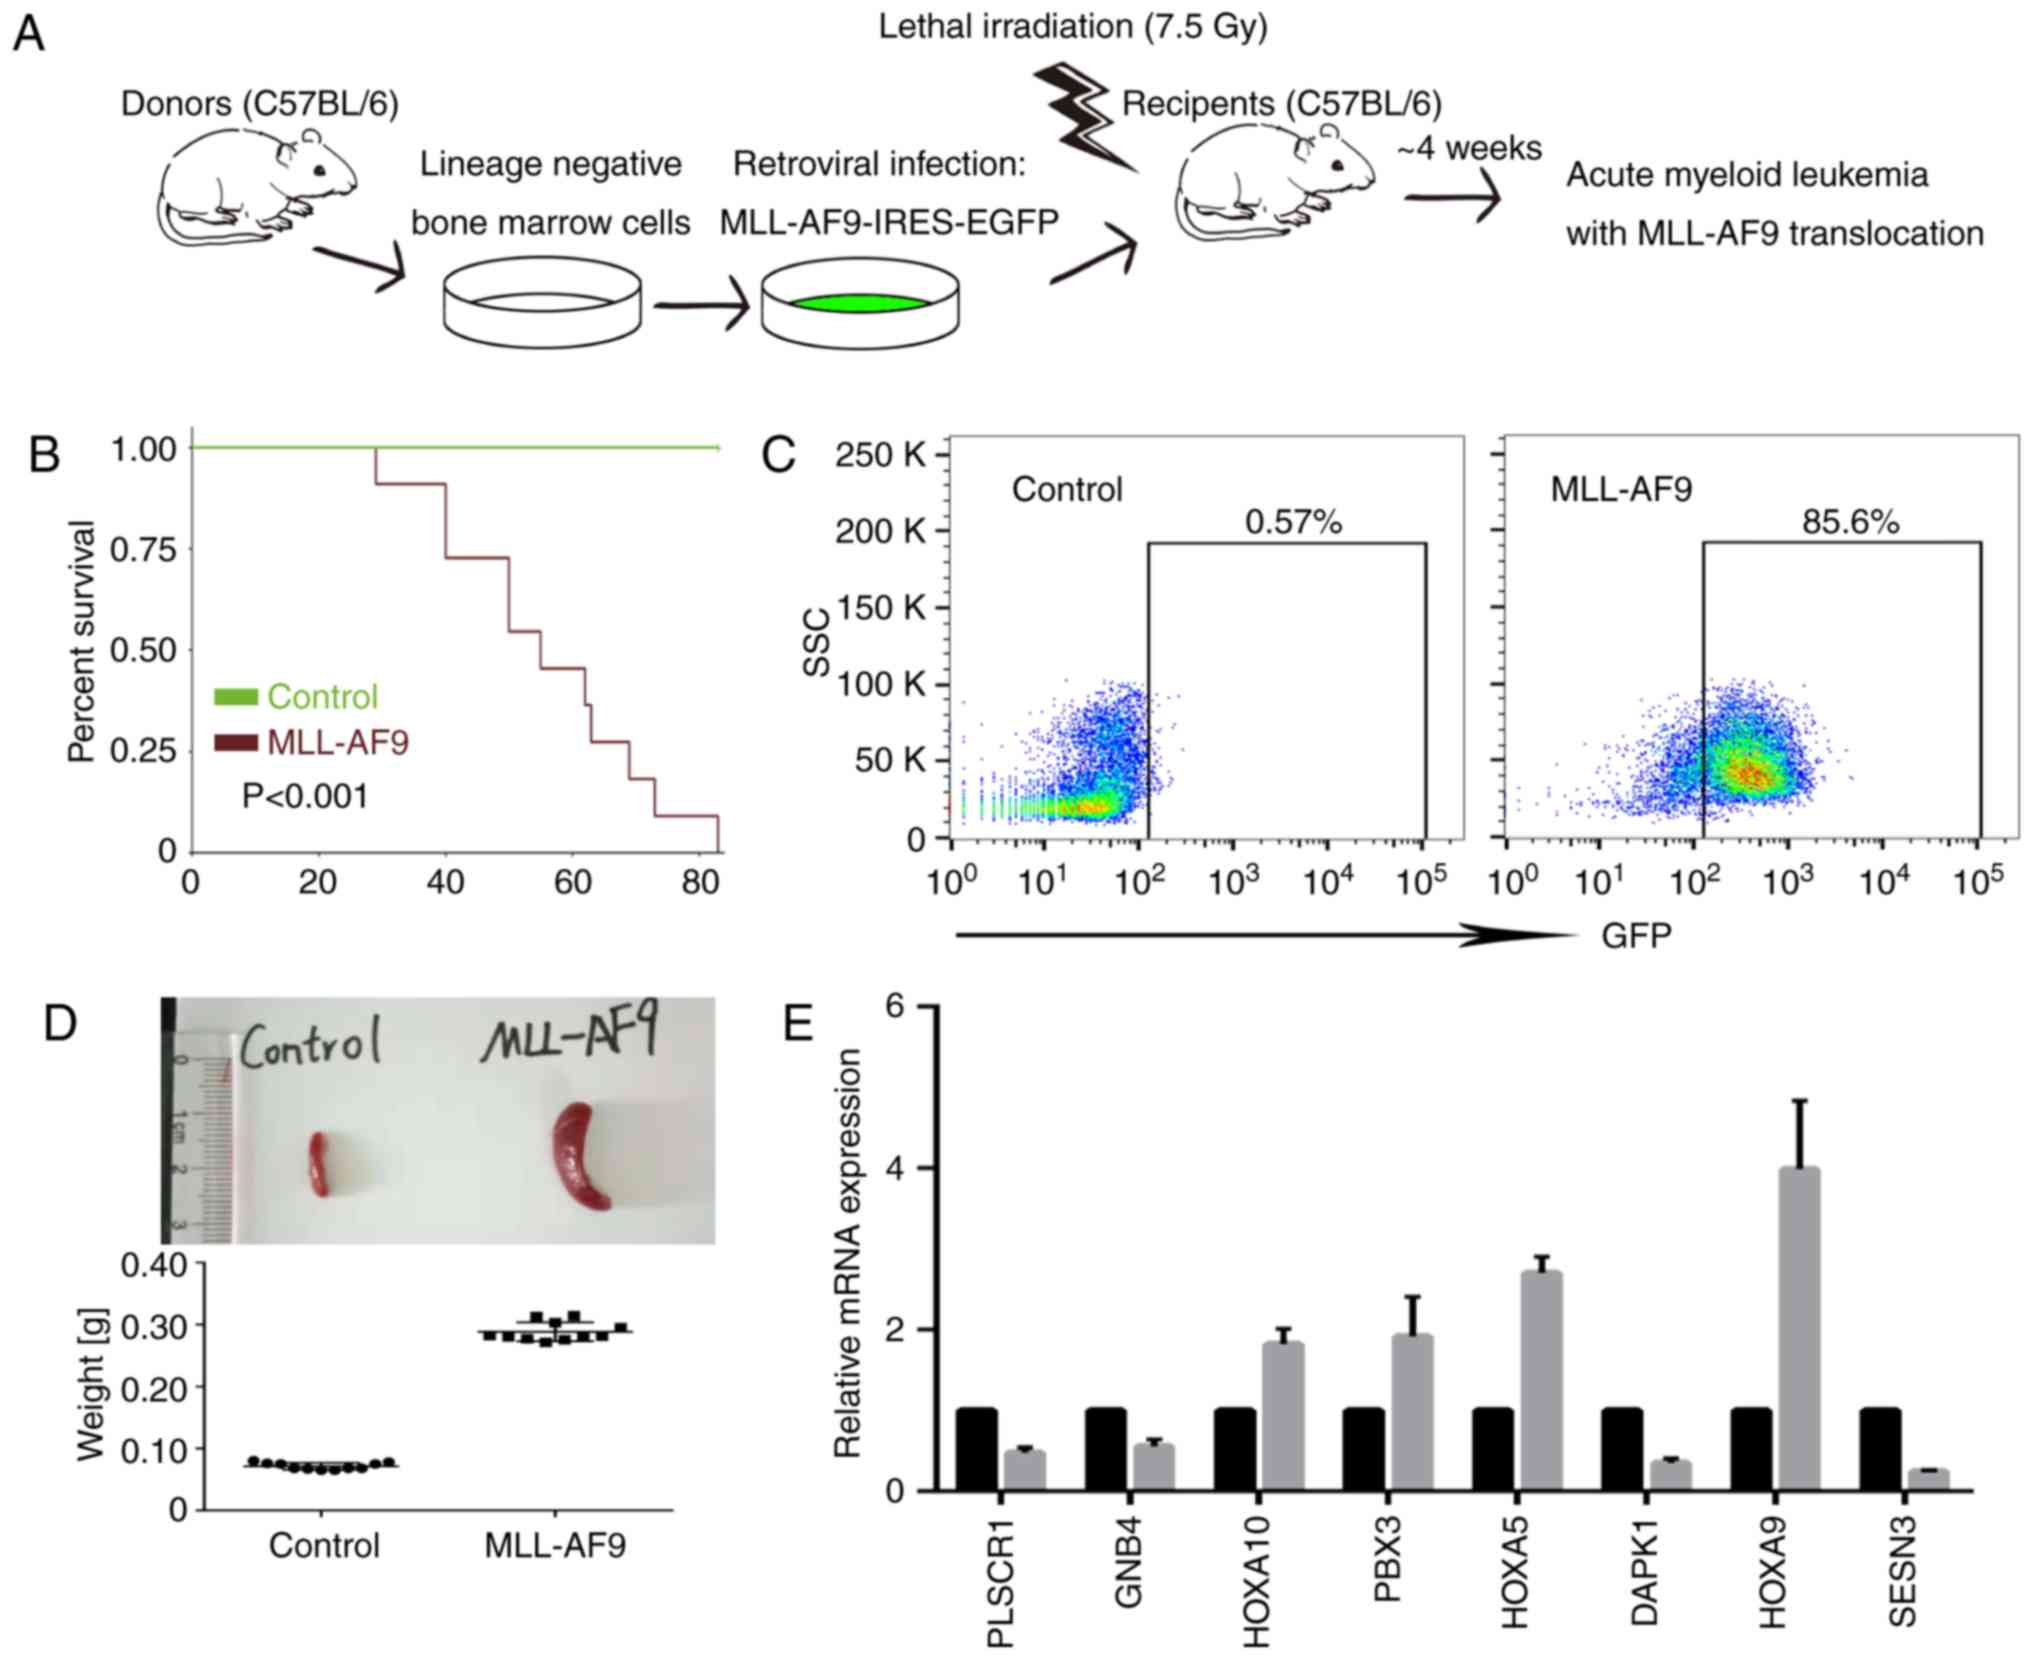 | Figure 8.Validation in mouse models. (A) Flow
diagram of the animal study. (B) Overall survival of transplanted
mice. (C) Representative flow cytometric analysis of GFP-positive
cells in the peripheral blood of MLL-AF9 model mice. (D) Sizes and
weights of spleens of MLL-AF9 model mice and normal control. (E)
The relative mRNA levels of eight potential direct target genes of
MLL-AF9. MLL, mixed lineage leukemia; AF9, MLLT3, super elongation
complex subunit; SSC, side scatter; GFP, green fluorescent protein;
PLSCR1, phospholipid scramblase 1; GNB4, G protein subunit β 4;
HOXA, homeobox A; PBX3, PBX homeobox 3; DAPK1, death associated
protein kinase 1; SESN3, sestrin 3. |
Discussion
AML is a common form of leukemia with an incidence
of ~3/100,000 per year (15,20).
Patients with MLL-AF9 translocation are defined as a subset of AML
with an unfavorable prognosis (21). Epigenetic regulation had been
demonstrated to be associated with tumorigenesis in MLL-AF9
leukemia cells. However, previous studies focused on chromatin
signatures in MLL-AF9 leukemia cells without comparing them with
normal hematopoietic cells (7,22,23).
The present study integrated the differential transcriptome and
epigenome signatures between MLL-AF9 leukemia cells and normal
hematopoietic cells to define the epigenetic-regulated genes in
MLL-AF9 leukemia, which would improve understanding of the
molecular mechanism in MLL-AF9 leukemia.
Several leukemia-associated biological processes
were enriched in the present study, including ‘leukocyte
migration’, ‘positive regulation of angiogenesis’, ‘immune
response’, ‘positive regulation of the ERK1 and ERK2 cascades’,
‘cell adhesion’ and ‘transmembrane receptor protein tyrosine kinase
signaling pathway’. ITGB3, which is involved in integrin-mediated
adhesion, was highly expressed in MLL-AF9 leukemia cells and was
determined to be essential for leukemogenesis and chemosensitivity
(24). Enriched KEGG terms
included, the ‘NF-κB signaling pathway’, ‘TNF signaling pathway’,
‘cytokine-cytokine receptor interaction’, ‘hematopoietic cell
lineage’ and ‘transcriptional misregulation in cancer’ were closely
associated with the initiation and progression of leukemia. The
crosstalk mediated by cytokines alters the functional
characteristics of the mesenchymal stem cells and these effects
supported the leukemia cell proliferation and contributed to
chemosensitivity (25). The
transcription factor NF-κB, which is constitutively activated in
the majority of AML cases, controls the expression of genes
involved in immune responses and can lead to development of
leukemia (26). Furthermore,
constitutive NF-κB activation in the murine MLL-AF9, lysine
acetyltransferase 6A-nuclear receptor coactivator 2 or nucleoporin
98-HOXA9 AML models is dependent on autocrine TNF-α signaling
(27).
Previous studies have addressed the gene expression
changes associated with MLL-AF9 in leukemia cell lines and mouse
models. Certain studies focused their research on histone
modification in MLL-AF9 leukemia cells (7,22,28,29).
The present study differs from the majority of previous reports, as
it integrated multiple large-scale histone modification data and
compared the chromatin signatures in MLL-AF9 leukemia cells with
those in normal hematopoietic cells. The present study identified
epigenetic-regulated genes by exploring the association between
gene expression and histone modification changes.
Deregulated transcription of HOXA members (HOXA5,
HOXA9 and HOXA10) has been identified as a hallmark of MLL
rearrangement leukemia (30–32).
It was demonstrated that induced expression of PBX homeobox 3 was
sufficient for malignant transformation of normal mouse
hematopoietic stem/progenitor cells (33,34).
Sestrin 3 has been reported to repress ribosomal protein S6 kinase
(S6K1) activity by reducing its phosphorylation, which affected the
mechanistic target of rapamycin kinase pathway and suppressed
leukemic progenitor colony formation in breakpoint cluster
region-ABL proto-oncogene 1, non-receptor tyrosine kinase leukemia
cell lines (35). It was
demonstrated that inhibition of S6K1 activity impaired self-renewal
and improved the survival of mice bearing MLL-AF9 leukemia cells
(36). Death associated protein
kinase 1 (DAPK1), a tumor suppressor, is involved in the
pro-apoptotic activity of TNF-α and interferon-γ via the NF-κB
signaling pathway (37).
Significant suppression of DAPK1 transcription expression levels
was observed in primary AML blasts with fms related tyrosine kinase
3-internal tandem duplication or MLL translocation (38). Previous studies reported that
phospholipid scramblase 1 has an antagonistic role in leukemia
development through the regulation of the cell cycle and cell
differentiation (39,40). EYA transcriptional coactivator and
phosphatase 1 (EYA1) and SIX homeobox 1 (SIX1) were reported to be
associated with leukemogenesis in MLL-MLLT1, super elongation
complex subunit AML (28). The
present study identified that the average RPKM of EYA1 and SIX1
were 1.34 and 66.04 in mouse bone marrow (GSE73457). However, the
average RPKM of EYA1 and SIX1 were 0.06 and 0.01, respectively, in
tumor samples of patients with AML (TARGET project). These two
genes may have roles in leukemogenesis in a mouse model, but were
expressed at low levels in human hematopoietic cells.
Limitations of the present study must be
acknowledged. Additional experiment validation, such as ChIP, is
required in future studies. The transcriptomic and epigenetic data
analyses revealed that a small subset of DEGs are
epigenetic-regulated and these genes may be critical in the
leukemogenesis of AML with MLL-AF9 translocation. The results of
the present study have provided further insight into the
association of chromatin signatures with gene expression. However,
further studies are warranted to validate these findings.
Acknowledgements
The authors would like to thank Professor Daisuke
Nakada (Department of Molecular and Human Genetics, Baylor College
of Medicine) and Professor Inder Verma (Laboratory of Genetics, The
Salk Institute) for providing pMIG-FLAG-MLL-AF9 and pCL-Eco
plasmids.
Funding
The present study was supported by the Ministry of
Science and Technology of China (grant no 2016YEE0107200), the
National Natural Science Foundation of China (grant no. 81400111)
and the Science and Technology Commission of Shanghai Municipality
(grant nos. 15411968900 and 15XD1503300).
Availability of data and materials
The datasets used and/or analyzed during the current
study are available from the corresponding authors on reasonable
request.
Authors' contributions
WZ and AL designed the study. FW and ZL performed
most of the statistical analyses and drafted the initial
manuscript. GW, XT, JZ, WY, LD, JL, JX and ZF contributed to the
study design, collected datasets, performed data analysis and
revised the paper. The final version of the manuscript was read and
approved by all authors.
Ethics approval and consent to
participate
All the animal experiments were performed in
accordance with institutional guidelines for Animal Care at Tongji
University School of Medicine and received ethical approval from
The Animal Ethics Committee of Tongji University (approval no.
TJLAC-018-027).
Patient consent for publication
Not applicable.
Competing interests
The authors declare that they have no competing
interests.
References
|
1
|
Huret JL, Dessen P and Bernheim A: An
atlas of chromosomes in hematological malignancies. Example: 11q23
and MLL partners. Leukemia. 15:987–989. 2001. View Article : Google Scholar : PubMed/NCBI
|
|
2
|
Biondi A, Cimino G, Pieters R and Pui CH:
Biological and therapeutic aspects of infant leukemia. Blood.
96:24–33. 2000. View Article : Google Scholar : PubMed/NCBI
|
|
3
|
Sabattini E, Bacci F, Sagramoso C and
Pileri SA: WHO classification of tumours of haematopoietic and
lymphoid tissues in 2008: An overview. Pathologica. 102:83–87.
2010.PubMed/NCBI
|
|
4
|
Marschalek R: Mixed lineage leukemia:
Roles in human malignancies and potential therapy. FEBS J.
277:1822–1831. 2010. View Article : Google Scholar : PubMed/NCBI
|
|
5
|
Andersson AK, Ma J, Wang J, Chen X, Gedman
AL, Dang J, Nakitandwe J, Holmfeldt L, Parker M, Easton J, et al:
The landscape of somatic mutations in infant MLL-rearranged acute
lymphoblastic leukemias. Nat Genet. 47:330–337. 2015. View Article : Google Scholar : PubMed/NCBI
|
|
6
|
Biswas D, Milne TA, Basrur V, Kim J,
Elenitoba-Johnson KS, Allis CD and Roeder RG: Function of
leukemogenic mixed lineage leukemia 1 (MLL) fusion proteins through
distinct partner protein complexes. Proc Natl Acad Sci USA.
108:15751–15756. 2011. View Article : Google Scholar : PubMed/NCBI
|
|
7
|
Prange KHM, Mandoli A, Kuznetsova T, Wang
SY, Sotoca AM, Marneth AE, van der Reijden BA, Stunnenberg HG and
Martens JHA: MLL-AF9 and MLL-AF4 oncofusion proteins bind a
distinct enhancer repertoire and target the RUNX1 program in 11q23
acute myeloid leukemia. Oncogene. 36:3346–3356. 2017. View Article : Google Scholar : PubMed/NCBI
|
|
8
|
Ji H, Li X, Wang QF and Ning Y:
Differential principal component analysis of ChIP-seq. Proc Natl
Acad Sci USA. 110:6789–6794. 2013. View Article : Google Scholar : PubMed/NCBI
|
|
9
|
Kim D, Langmead B and Salzberg SL: HISAT:
A fast spliced aligner with low memory requirements. Nat Methods.
12:357–360. 2015. View Article : Google Scholar : PubMed/NCBI
|
|
10
|
Anders S, Pyl PT and Huber W: HTSeq--a
python framework to work with high-throughput sequencing data.
Bioinformatics. 31:166–169. 2015. View Article : Google Scholar : PubMed/NCBI
|
|
11
|
Trapnell C, Roberts A, Goff L, Pertea G,
Kim D, Kelley DR, Pimentel H, Salzberg SL, Rinn JL and Pachter L:
Differential gene and transcript expression analysis of RNA-seq
experiments with tophat and cufflinks. Nat Protoc. 7:562–578. 2012.
View Article : Google Scholar : PubMed/NCBI
|
|
12
|
Love MI, Huber W and Anders S: Moderated
estimation of fold change and dispersion for RNA-seq data with
DESeq2. Genome Biol. 15:5502014. View Article : Google Scholar : PubMed/NCBI
|
|
13
|
Dennis G Jr, Sherman BT, Hosack DA, Yang
J, Gao W, Lane HC and Lempicki RA: DAVID: Database for annotation,
visualization, and integrated discovery. Genome Biol. 4:P32003.
View Article : Google Scholar : PubMed/NCBI
|
|
14
|
Chen Y, Meyer CA, Liu T, Li W, Liu JS and
Liu XS: MM-ChIP enables integrative analysis of cross-platform and
between-laboratory ChIP-chip or ChIP-seq data. Genome Biol.
12:R112011. View Article : Google Scholar : PubMed/NCBI
|
|
15
|
Heinz S, Benner C, Spann N, Bertolino E,
Lin YC, Laslo P, Cheng JX, Murre C, Singh H and Glass CK: Simple
combinations of lineage-determining transcription factors prime
cis-regulatory elements required for macrophage and B cell
identities. Mol Cell. 38:576–589. 2010. View Article : Google Scholar : PubMed/NCBI
|
|
16
|
Somervaille TC and Cleary ML:
Identification and characterization of leukemia stem cells in
murine MLL-AF9 acute myeloid leukemia. Cancer Cell. 10:257–268.
2006. View Article : Google Scholar : PubMed/NCBI
|
|
17
|
Saito Y, Chapple RH, Lin A, Kitano A and
Nakada D: AMPK protects leukemia-initiating cells in myeloid
leukemias from metabolic stress in the bone marrow. Cell Stem Cell.
17:585–596. 2015. View Article : Google Scholar : PubMed/NCBI
|
|
18
|
Naviaux RK, Costanzi E, Haas M and Verma
IM: The pCL vector system: Rapid production of helper-free,
high-titer, recombinant retroviruses. J Virol. 70:5701–5705.
1996.PubMed/NCBI
|
|
19
|
Livak KJ and Schmittgen TD: Analysis of
relative gene expression data using real-time quantitative PCR and
the 2(-Delta Delta C(T)) method. Methods. 25:402–408. 2001.
View Article : Google Scholar : PubMed/NCBI
|
|
20
|
Dohner H, Weisdorf DJ and Bloomfield CD:
Acute myeloid leukemia. N Engl J Med. 373:1136–1152. 2015.
View Article : Google Scholar : PubMed/NCBI
|
|
21
|
Muntean AG and Hess JL: The pathogenesis
of mixed-lineage leukemia. Ann Rev Pathol. 7:283–301. 2012.
View Article : Google Scholar
|
|
22
|
Bernt KM, Zhu N, Sinha AU, Vempati S,
Faber J, Krivtsov AV, Feng Z, Punt N, Daigle A, Bullinger L, et al:
MLL-rearranged leukemia is dependent on aberrant H3K79 methylation
by DOT1L. Cancer Cell. 20:66–78. 2011. View Article : Google Scholar : PubMed/NCBI
|
|
23
|
Marneth AE, Prange KHM, Al Hinai ASA,
Bergevoet SM, Tesi N, Janssen-Megens EM, Kim B, Sharifi N, Yaspo
ML, Kuster J, et al: C-terminal BRE overexpression in
11q23-rearranged and t(8;16) acute myeloid leukemia is caused by
intragenic transcription initiation. Leukemia. 32:828–836. 2018.
View Article : Google Scholar : PubMed/NCBI
|
|
24
|
Miller PG, Al-Shahrour F, Hartwell KA, Chu
LP, Järås M, Puram RV, Puissant A, Callahan KP, Ashton J, McConkey
ME, et al: In vivo RNAi screening identifies a leukemia-specific
dependence on integrin beta 3 signaling. Cancer Cell. 24:45–58.
2013. View Article : Google Scholar : PubMed/NCBI
|
|
25
|
Reikvam H, Brenner AK, Hagen KM, Liseth K,
Skrede S, Hatfield KJ and Bruserud Ø: The cytokine-mediated
crosstalk between primary human acute myeloid cells and mesenchymal
stem cells alters the local cytokine network and the global gene
expression profile of the mesenchymal cells. Stem Cell Res.
15:530–541. 2015. View Article : Google Scholar : PubMed/NCBI
|
|
26
|
Cilloni D, Martinelli G, Messa F,
Baccarani M and Saglio G: Nuclear factor kB as a target for new
drug development in myeloid malignancies. Haematologica.
92:1224–1229. 2007. View Article : Google Scholar : PubMed/NCBI
|
|
27
|
Kagoya Y, Yoshimi A, Kataoka K, Nakagawa
M, Kumano K, Arai S, Kobayashi H, Saito T, Iwakura Y and Kurokawa
M: Positive feedback between NF-κB and TNF-α promotes
leukemia-initiating cell capacity. J Clin Invest. 124:528–542.
2014. View Article : Google Scholar : PubMed/NCBI
|
|
28
|
Wang QF, Wu G, Mi S, He F, Wu J, Dong J,
Luo RT, Mattison R, Kaberlein JJ, Prabhakar S, et al: MLL fusion
proteins preferentially regulate a subset of wild-type MLL target
genes in the leukemic genome. Blood. 117:6895–6905. 2011.
View Article : Google Scholar : PubMed/NCBI
|
|
29
|
Chen L, Sun Y, Wang J, Jiang H and Muntean
AG: Differential regulation of the c-Myc/Lin28 axis discriminates
subclasses of rearranged MLL leukemia. Oncotarget. 7:25208–25223.
2016.PubMed/NCBI
|
|
30
|
Armstrong SA, Staunton JE, Silverman LB,
Pieters R, den Boer ML, Minden MD, Sallan SE, Lander ES, Golub TR
and Korsmeyer SJ: MLL translocations specify a distinct gene
expression profile that distinguishes a unique leukemia. Nat Genet.
30:41–47. 2002. View
Article : Google Scholar : PubMed/NCBI
|
|
31
|
Milne TA, Martin ME, Brock HW, Slany RK
and Hess JL: Leukemogenic MLL fusion proteins bind across a broad
region of the Hox a9 locus, promoting transcription and multiple
histone modifications. Cancer Res. 65:11367–11374. 2005. View Article : Google Scholar : PubMed/NCBI
|
|
32
|
Kawagoe H, Humphries RK, Blair A,
Sutherland HJ and Hogge DE: Expression of HOX genes, HOX cofactors,
and MLL in phenotypically and functionally defined subpopulations
of leukemic and normal human hematopoietic cells. Leukemia.
13:687–698. 1999. View Article : Google Scholar : PubMed/NCBI
|
|
33
|
Li Z, Chen P, Su R, Hu C, Li Y, Elkahloun
AG, Zuo Z, Gurbuxani S, Arnovitz S, Weng H, et al: PBX3 and MEIS1
cooperate in hematopoietic cells to drive acute myeloid leukemias
characterized by a core transcriptome of the MLL-Rearranged
disease. Cancer Res. 76:619–629. 2016. View Article : Google Scholar : PubMed/NCBI
|
|
34
|
Guo H, Chu Y, Wang L, Chen X, Chen Y,
Cheng H, Zhang L, Zhou Y, Yang FC, Cheng T, et al: PBX3 is
essential for leukemia stem cell maintenance in MLL-rearranged
leukemia. Int J Cancer. 141:324–335. 2017. View Article : Google Scholar : PubMed/NCBI
|
|
35
|
Vakana E, Arslan AD, Szilard A, Altman JK
and Platanias LC: Regulatory effects of sestrin 3 (SESN3) in
BCR-ABL expressing cells. PLoS One. 8:e787802013. View Article : Google Scholar : PubMed/NCBI
|
|
36
|
Ghosh J, Kobayashi M, Ramdas B, Chatterjee
A, Ma P, Mali RS, Carlesso N, Liu Y, Plas DR, Chan RJ and Kapur R:
S6K1 regulates hematopoietic stem cell self-renewal and leukemia
maintenance. J Clin Invest. 126:2621–2625. 2016. View Article : Google Scholar : PubMed/NCBI
|
|
37
|
Yoo HJ, Byun HJ, Kim BR, Lee KH, Park SY
and Rho SB: DAPk1 inhibits NF-κB activation through TNF-α and
INF-γ-induced apoptosis. Cell Signal. 24:1471–1477. 2012.
View Article : Google Scholar : PubMed/NCBI
|
|
38
|
Shanmugam R, Gade P, Wilson-Weekes A,
Sayar H, Suvannasankha A, Goswami C, Li L, Gupta S, Cardoso AA,
Baghdadi TA, et al: A noncanonical Flt3ITD/NF-κB signaling pathway
represses DAPK1 in acute myeloid leukemia. Clin Cancer Res.
18:360–369. 2012. View Article : Google Scholar : PubMed/NCBI
|
|
39
|
Chen Y, Hui H, Yang H, Zhao K, Qin Y, Gu
C, Wang X, Lu N and Guo Q: Wogonoside induces cell cycle arrest and
differentiation by affecting expression and subcellular
localization of PLSCR1 in AML cells. Blood. 121:3682–3691. 2013.
View Article : Google Scholar : PubMed/NCBI
|
|
40
|
Huang Y, Zhao Q, Zhou CX, Gu ZM, Li D, Xu
HZ, Wiedmer T, Sims PJ, Zhao KW and Chen GQ: Antileukemic roles of
human phospholipid scramblase 1 gene, evidence from inducible
PLSCR1-expressing leukemic cells. Oncogene. 25:6618–6627. 2006.
View Article : Google Scholar : PubMed/NCBI
|