Introduction
Epstein Barr-virus (EBV) is a highly prevalent γ
herpes virus in humans, and was also the first identified human
tumor-associated virus (1). EBV is
frequently implicated in the etiology of a number of malignancies,
including nasopharyngeal carcinoma (NPC) (1). NPC, particularly poorly
differentiated or undifferentiated NPC, is closely associated with
EBV. Latent membrane protein 1 (LMP1) is known to be a oncogenic
protein encoded by the EBV genome, as it has an important role in
EBV-mediated B-cell proliferation and immortalization (2); however, the mechanism of
LMP1-mediated epithelial cell transformation remains unclear. LMP1
is a 386 amino acid transmembrane glycoprotein, which consists of a
short cytoplasmic N-terminal domain (residues 1–23), six
transmembrane domains (residues 24–186), and a long cytoplasmic
C-terminal domain (residues 187–386), which is known as the
carboxyl terminal activation region (CTAR) (3). Currently, three CTARs have been
reported, CTAR1 (residues 194–232), CTAR2 (residues 351–386) and
CTAR3 (residues 275–330) (4).
CTAR1 engages tumor necrosis factor receptor-associated factors to
induce low-level nuclear factor-κB (NF-κB) activation (5). CTAR2 interacts with TRA death domain
protein to mediate high-level NF-κB activation and also induces
c-Jun N-terminal kinases/activator protein-1 (AP-1) activation
(6). Gires et al (7) first reported the CTAR3 of LMP1 and
confirmed the region was associated with the JAK3/signal transducer
and activator of transcription (STAT) signaling pathway; however,
its function in epithelial cells requires further analysis.
Materials and methods
Plasmids
NF-κB luciferase (LUC) reporter and β-galactosidase
plasmids were received from Dr David Goeddel (Tularik, Inc., San
Francisco, CA, USA). AP-1 LUC reporter (with four AP-1 sites) was
received from Dr Zhi-Gang Dong (University of Minnesota, Austin,
MN, USA). pLNSX retroviral vector, pLNSX-LMP1WT
retroviral vector (wild type with the full-length LMP1 gene) and
pGL2 plasmids were received from Dr Liang Cao (University of Hong
Kong, Hong Kong SAR, China).
Cell lines
The SV40-immortalized nasopharyngeal epithelial cell
line NP69 was a generous gift from Dr Sai Wah Tsao (University of
Hong Kong). NP69 cells were cultured in serum-free keratinocyte
medium (K-SFM; Gibco; Thermo Fisher Scientific, Inc., Waltham, MA,
USA) in humidified 5% (v/v) CO2 atmosphere at 37°C.
Retrovirus packaging cell line PA317, immortalized lymphocyte cells
and 293 cells were obtained from the American Type Culture
Collection (Manassas, VA, USA), and routinely maintained in
Dulbecco's modified Eagle's medium (Gibco; Thermo Fisher
Scientific, Inc.) with 15% fetal calf serum (Gibco; Thermo Fisher
Scientific, Inc.).
Reagents and primers
The mouse anti-human monoclonal antibody S12 for
LMP1 (1:50) obtained from a hybridoma was a generous gift from Dr
Liang Cao (University of Hong Kong, SAR, China). Immobilized pH
gradient (IPG) strisp (pH 3-10NL, 24 cm) were obtained from GE
Healthcare (Chicago, IL, USA). Polymerase chain reaction (PCR)
primers (Table I) were designed
using Primer5 software (version 5.00; Premier Biosoft
International, Palo Alto, CA, USA) and synthesized by Invitrogen
(Thermo Fisher Scientific, Inc.).
 | Table I.Primer sequences used in fluorescent
reverse transcription-quantitative polymerase chain reaction. |
Table I.
Primer sequences used in fluorescent
reverse transcription-quantitative polymerase chain reaction.
| Primers | Sequence
(5′-3′) | Product size
(bp) |
|---|
| Ribosomal protein
P0 | Sense
AAGGCTGTGGTGCTGATG | 132 |
|
| Antisense
GTCCTCCTTGGTGAACACA |
|
| Annexin A2 | Sense
ATCTCTATGACGCTGGAGTGAA | 121 |
|
| Antisense
GGGCTGTAACTCTTGTACCTATCA |
|
| Heterogeneous
nuclear ribonucleoprotein A/B | Sense
CTGGATGGCCGTGTCATT | 143 |
|
| Antisense
GCCTCAATCTCCCCAAACT |
|
| Isocitrate
dehydrogenase 3 | Sense
TGCAGAGTATCAAGCTCATCAC | 143 |
|
| Antisense
TAGAAAAAGCCCATCTGACATC |
|
| G protein | Sense
GGGTCACTCCCACTTTGTTAG | 149 |
|
| Antisense
TCAGCACATCCTTGGTATGG |
|
| β-actin (internal
control) | Sense
ACCGTGGAGAAGAGCTACGA | 309 |
|
| Antisense
GTACTTGCGCTCAGAAGGAG |
|
Reorganization of the
pLNSX-LMP1Δ232-351 plasmid and pGL2/Janus kinase 3
(JAK3)-LUC plasmid
To construct an pLNSX-LMP1Δ232-351
plasmid expressing a product with deleted amino acid residues at
positions 232 to 351 in the CTAR3 region, plasmid
pLNSX-LMP1WT with full-length LMP1WT gene as
a template and four primers (p1, 5′CTCGGCCTCTGAGCTATTCC3′; p2,
5′GCCGCCATGGGCTCCACTCACTCACGAGCAG3′; p3,
5′AGTGGAGCCCATGGCGGCGGTGACCCA3′ and p4, 5′CGAGAAGCGAACTGATTGGT3′)
were put into the PCR instrument (Eppendorf, Hamburg, Germany). The
50 µl PCR reaction was carried out using a PCR amplification kit
(Promega (Beijing) Biotech Co., Ltd, Beijing, China) according to
the manufacturer's protocol. PCR was performed for 30 cycles and
consisted of denaturation at 94°C for one minute, annealing at 58°C
for 1 min and extension at 72°C for 1 min. The PCR product and the
pLNSX retroviral vector containing XbaI and HindIII sites were
mixed in 10 µl PCR reaction system at 1:1 ratio. The connection
reaction was run overnight at 16°C. The
pLNSX-LMP1Δ232-351 was confirmed by DNA sequencing. In
addition, to construct the JAK3 LUC reporter plasmid, genomic DNA
of immortalized lymphocyte cells was used as the PCR template with
upstream primer (5′CCGCTCGAGGTGCCCAACTCACACATGCTACAGAT3′, the
XhoI site denoted by bold font) and downstream primer
(5′CCCAAGCTTAGAGGAAAGTCCCACTCGGCTCCTT3′, the HindIII site
denoted by bold font). PCR was performed for 35 cycles consisting
of denaturation at 94°C for one minute, annealing at 63°C for 1 min
and extension at 72°C for 30 sec. Subsequently, the PCR product was
digested with HindIII and XhoI and cloned into the
luciferase reporter plasmid pGL2. The pGL2/JAK3-LUC plasmid was
obtained and confirmed by DNA sequencing.
Retrovirus-mediated gene transfer and
detection of the expressed proteins
PA317 cells were transfected with
pLNSX-LMP1WT and pLNSX-LMP1Δ232-351 at 300
ng/well, to produce amphotropic retroviruses at a density of
5×10⁴ cells per well in 6-well plates. After 24 h of
transfection, the transfected PA317 cells were selected with G418
(500 mg/ml, Invitrogen; Thermo Fisher Scientific, Inc.). After 2–3
weeks, the resistant cells were collected and cultured as the
virus-producing cell lines. NP69 cells, which were inoculated onto
6-well plates in triplicate at 5×10⁴ cells/well, were
transduced with Rv-LMP1WT,
Rv-LNSX-LMP1Δ232-351 retroviruses (MOI=30). After 48 h,
the successfully infected cells were selected by G418 (400 µg/ml)
for 2 weeks, and the resistant clones were pooled and designated as
NP69-LMP1WT and NP69-LMP1Δ232-351 cells. The
stable expression of LMP1 in the resistant clones was determined by
western blotting and immunofluorescence assay with LMP1 antibody
S12.
Immunofluorescence assay
Cell slides were prepared, fixed with methanol and
acetone (1:1) at 4°C for 30 min, washed, dried, and labeled with
anti-LMP1 monoclonal antibody S12 (1:50) for 1 h at 37°C. After
washing, the cells were incubated with a FITC-labeled goat
anti-mouse secondary antibody (1:500; cat. no. A-11029; Zymed;
Thermo Fisher Scientific, Inc.) for 1 h at 37°C, washed and then
oil sealed and observed under a fluorescence microscope at 778 nm
(EVOS® FL Auto; Thermo Fisher Scientific, Inc.).
Cell growth curve analysis
For growth curve analysis, transduced NP69 cells
were seeded onto 96-well plates in triplicate wells at
1×10⁴ cells/well at 24 h after viral infection. The
number of viable cells was determined every 48 h using the MTT
method. After incubation with MTT in a humidified 5% (v/v)
CO2 atmosphere at 37°C incubator for 4 h, the cell
culture supernatant was removed, 150 µl of DMSO was added to fully
dissolve the crystals and the OD value of each well was measured at
a wavelength of 490 nm using an ELX800 microplate reader (BioTek
China, Beijing, China). Growth curves were produced by plotting the
mean and standard deviation of three independent experiments.
Soft agar clone formation assay
To determine the anchorage-independence ability of
NP69 cells, LMP1 cells that had been transduced for 24 h were
seeded into semisolid agar K-SFM medium [base layer, 0.6% (w/v);
upper layer, 0.3% (w/v)] at a density of 5×10⁴ cells per
well in 6-well plates. Three independent experiments with duplicate
wells for each cell line were performed. After 3–4 weeks of
incubation at 37°C with 5% (v/v) CO2, the number and
size of colonies (≥50 cells was classed as one colony) were
observed under an inverted microscope (TS100; Nikon Corporation,
Tokyo, Japan), and 10 low power fields (×4) were randomly selected
for each group. The experiments were conducted in triplicate.
Preparation of the total protein
sample
Harvested cells were washed twice with ice-cold PBS,
and lysed in lysis buffer [7 mol/l urea, 2 mol/l thiourea, 2% (v/v)
NP-40, 1% (v/v) Triton X-100, 100 mmol/l dithiothreitol (DTT), 5
mmol/l PMSF, 4% (w/v) CHAPS, 0.5 mmol/l EDTA, 40 mmol/l Tris, 1
mg/ml DNase I]. The cell lysates were incubated at 4°C for 30 min
and then centrifuged at 4°C and 21,130 × g for 10 min. The
supernatant constituted the total protein solution. The
concentration of the total proteins was assayed with a 2D
Quantification kit (GE Healthcare).
IPG-2D PAGE and image analysis
IPG-2D PAGE was performed according to the
manufacturer's protocols (GE Healthcare). Protein samples (1.0 mg)
were diluted to 450 µl with rehydration solution [8 mol/l urea, 2%
(w/v) CHAPS, 0.5% (v/v) pH 3–10 IPG buffer and trace bromophenol
blue], and applied for isoelectric focusing (IEF) using Immobiline
IPG strips (pH 3–10; L 240×3×0.5 mm). The strips were rehydrated at
30 V for 14 h and proteins were focused successively for 1 h at 500
V, 1 h at 1,000 V and 8.5 h at 8,000 V to produce a total of 69,920
Vh on an IPGphor (Amersham Biosciences, Uppsala, Sweden). Following
IEF, the IPG strips were equilibrated for 15 min at room
temperature in a buffer containing 50 mM Tris-HCl (pH 8.8), 30%
(v/v) glycerol, 6 M urea, 2% (w/v) SDS and 1% (w/v) DTT, followed
by further treatment in a similar buffer [containing 2.5% (w/v)
iodoacetamide instead of DTT] for 15 min, and then directly applied
on to 12.5% (w/v) homogeneous SDS-PAGE gels for electrophoresis
using a the Ettan DALT II system (Amersham Biosciences, Uppsala,
Sweden) according to the manufacturer's protocols. The separated
proteins were visualized after 13 h Coomassie Brilliant Blue G-250
staining at room temperature. The stained 2D gels were scanned with
MagicScan software (version 6.0; Kenxen Limited, Hong Kong, SAR,
China) on an Imagescanner (Amersham Biosciences, Uppsala, Sweden)
with 300 DPI resolution. The scanned data were then analyzed using
PDQuest 2D gel analysis software (version 7.1; Bio-Rad
Laboratories, Inc., Hercules, CA, USA). To ensure experiment
reproducibility, the 2D gel of each cell line was repeated in
triplicate. The gel spot pattern of each gel was summarized in a
standard following spot matching. Thus, one standard gel for each
cell line was established. The criteria to determine differential
protein spots were that spot intensity increased or decreased more
than two-fold between the comparison groups. Statistical analysis
was performed using SPSS, version 18.0 (SPSS, Inc. Chicago, IL,
USA).
Matrix assisted laser
desorption/ionization-time of flight mass spectrometry (MALDI-TOF
MS)
A total of 39 differential protein spots were
excised from preparative 2D gels using biopsy punches and
transferred to a 1.5 ml siliconized Eppendorf tube. Each spot was
first washed with 50 µl deionized water 3 times, each time for 2
min. A further 50 µl of decolorizing solution (100 mmol/l
NH4HCO3, 30% CAN; 1:1) was added at 37°C for
30 min. The spot was then repeatedly rinsed with deionized water
until the color had completely faded. A 300 µl volume of 100% CAN
was added to dehydrate the sample before it was drained. A 5 µl
volume of trypsin working solution (0.02 µg/µl) was added to each
tube to digest the sample at 4°C for 45 min. After the solution had
been completely absorbed by micelles, 30 µl of
NH4HCO3 (40 mmol/l) was added and the sample
was incubated at 37°C overnight. The supernatant was transferred to
a new tube, and 30 µl extraction liquid (60% CAN, 5% TFA; 1:1) was
added to the original tube, the extraction was repeated twice at
37°C for 60 min. After extraction and enzymolysis the supernatants
were combined and lyophilized to prepare the protein sample. The
protein samples were analyzed by Applied Biosystems Voyager System
4307 MALDI-TOF mass spectrometer (Applied Biosystems; Thermo Fisher
Scientific, Inc.). The parameters were set up as follows: Positive
ion-reflector mode, accelerating voltage 20 kV, grid voltage 64.5%,
mirror voltage ratio 1.12, N2 laser wavelength 337 nm,
pulse width 3 nsec, the number of laser shots 50, acquisition mass
range 1,000–3,000 Da, delay 100 nsec and vacuum degree
4×10⁻⁷ Torr. A trypsin-fragment peak served as internal
standard for mass calibration. A list of the corrected mass peaks
was termed the peptide mass fingerprint (PMF). Proteins were
identified from PMF data by searching the UniProt database
(http://www.uniprot.org/uniprot) using
the software MASCOT (version 2.5.1, Matrix Science, Ltd., London,
UK). Subcellular location and function information was derived from
the NCBI database (http://www.ncbi.nlm.nih.gov).
Protein extraction and western blot
analysis
Cells were extracted in lysis buffer (0.5% Nonidet
P-40, 5% sodium deoxycholate, 50 µM NaCl, 10 µM Tris-HCl, pH 7.5,
1% bovine serum albumin) and centrifuged at 4°C and 18,407 × g for
15 min. The supernatant was mixed with 2X loading buffer and boiled
for 5 min, and then the samples were separated via 10% SDS-PAGE
gels and transferred to polyvinylidene difluoride membranes. The
membranes were blocked with 5% fat-free milk at room temperature
for 1 h, incubated at 4°C overnight with antibodies S12 for LMP1
(1:50), anti-β-actin (1:10,000; cat. no. A1978; Sigma-Aldrich;
Merck KGaA, Darmstadt, Germany), anti-G protein (1:500; cat. no.
371818; Sigma-Aldrich; Merck KGaA) and anti-heterogeneous nuclear
ribonucleoprotein A/B (1:500; cat. no. sc-376411; Santa Cruz
Biotechnology, Inc., Dallas, TX, USA), washed, and then incubated
with peroxidase-conjugated secondary antibody (1:2,000; cat. no.
sc-11001; Santa Cruz Biotechnology, Inc.). Immune complexes were
detected using an Amersham ECL Western Blotting Detection kit
(Amersham Pharmacia Biotech, Little Chalfont, UK) and gel imaging
analysis (Cool Imager; Viagene Biotech, Inc). To confirm the
expression levels of each protein examined in LMP1-transfected
cells, western blotting for each protein was performed in
triplicate.
RNA extraction and reverse
transcription-quantitative polymerase chain reaction (RT-qPCR)
analysis
The gene expression of the differential proteins was
quantitated by RT-qPCR using Roche Light Cycler system (Roche
Diagnostics GmbH, Mannheim, Germany) and SYBR premix Ex Taq kit
(Takara Bio, Inc., Otsu, Japan). The expression levels of β-actin
served as an internal control. Total cellular RNA was isolated from
NP69-LMPlWT and NP69-LMPlΔ232-351 cells using
TRIzol® (Thermo Fisher Scientific, Inc.), according to
the manufacturer's protocol. RNA integrity was observed by
electrophoresis with 1% agarose gel containing ethidium bromide. A
total of 2 µg DNase-treated RNA underwent RT to produce cDNA and 1
µl RT product was used to amplify gene fragments. First-strand cDNA
was synthesized from DNase-treated total RNA with oligo-dT primer
and Super-Script II reverse transcriptase (Takara Bio, Inc.) for 60
min at 42°C and 10 min at 72°C, followed by qPCR amplification
using the corresponding specific primers (Table I). The qPCR cycling conditions were
as follows: 95°C for 3 min followed by 50 cycles of 95°C for 30
sec, 62°C (ribosomal protein P0 and isocitrate dehydrogenase 3) or
65°C (annexin A2, heterogeneous nuclear ribonucleoprotein A/B and G
protein) for 30 sec, and then 72°C for 30–40 sec. The relative fold
change method (8) was used to
determine the relative quantitative gene expression for each gene
studied compared with the β-actin control. The relative fold change
or relative gene expression value 2−ΔΔCq, where
ΔΔCq=[(CqTarget[LMPWT 1] -
Cqβ-actin [LMP1WT]) -
(CqTarget[LMP1Δ232-351] -
Cqβ-actin [LMP1Δ232-351])].
CqTarget [LMPWT] = quantification
cycle of the target gene examined in the LMP1-expressing cells;
Cqβ-actin[LMPWT] = quantification
cycle of the β-actin gene in the LMP1-expressing cells;
CqTarget [LMP1Δ232-351] =
quantification cycle of the target gene examined in the
LMP1Δ232-351-expressing cells; and Cqβ-actin
[LMP1Δ232-351] = quantification cycle
of the β-actin gene in the LMP1Δ232-351-expressing
cells. RT-qPCR analyses independently were performed in
triplicate.
Transcription activity analysis
For each transfection, 293 cells were seeded into
6-well dishes at 1×10⁵ cells/well. The indicated amounts
(500, 150, 300, 450 or 600 ng/well) of pLNSX, pLNSX-LMP1 or
pLNSX-LMP1Δ232-351 plasmids were co-transfected with
β-gal (200 ng/well) and reporter plasmids (200 ng/well) of NF-κB,
AP-1 or JAK3, respectively. Vector pLNSX was supplemented to a
total amount of 1 µg DNA for every well. Transfection was conducted
with transfection reagent Lipofectamine® 2000
(Invitrogen; Thermo Fisher Scientific, Inc.). Cell lysates were
collected 24 h later and were examined with a luciferase assay
system (Promega Corporation, Madison, WI, USA) according to the
manufacturer's protocol, to obtain the relative activities of the
promoter. Relative LUC values were calculated as the ratio of LUC
vs. β-galactosidase activity. A total of three independent
experiments were performed, and each experiment was performed in
triplicate.
Statistical analysis
Data are presented as the mean ± standard deviation
for ≥3 separate experiments. Statistical analyses were carried out
with SPSS (version 10.01; SPSS, Inc., Chicago, IL, USA).
Statistical analysis was performed using a Student's t-test or
one-way analysis of variance followed by the Tukey multiple
comparison test. P<0.05 was considered to indicate a
statistically significant difference.
Results
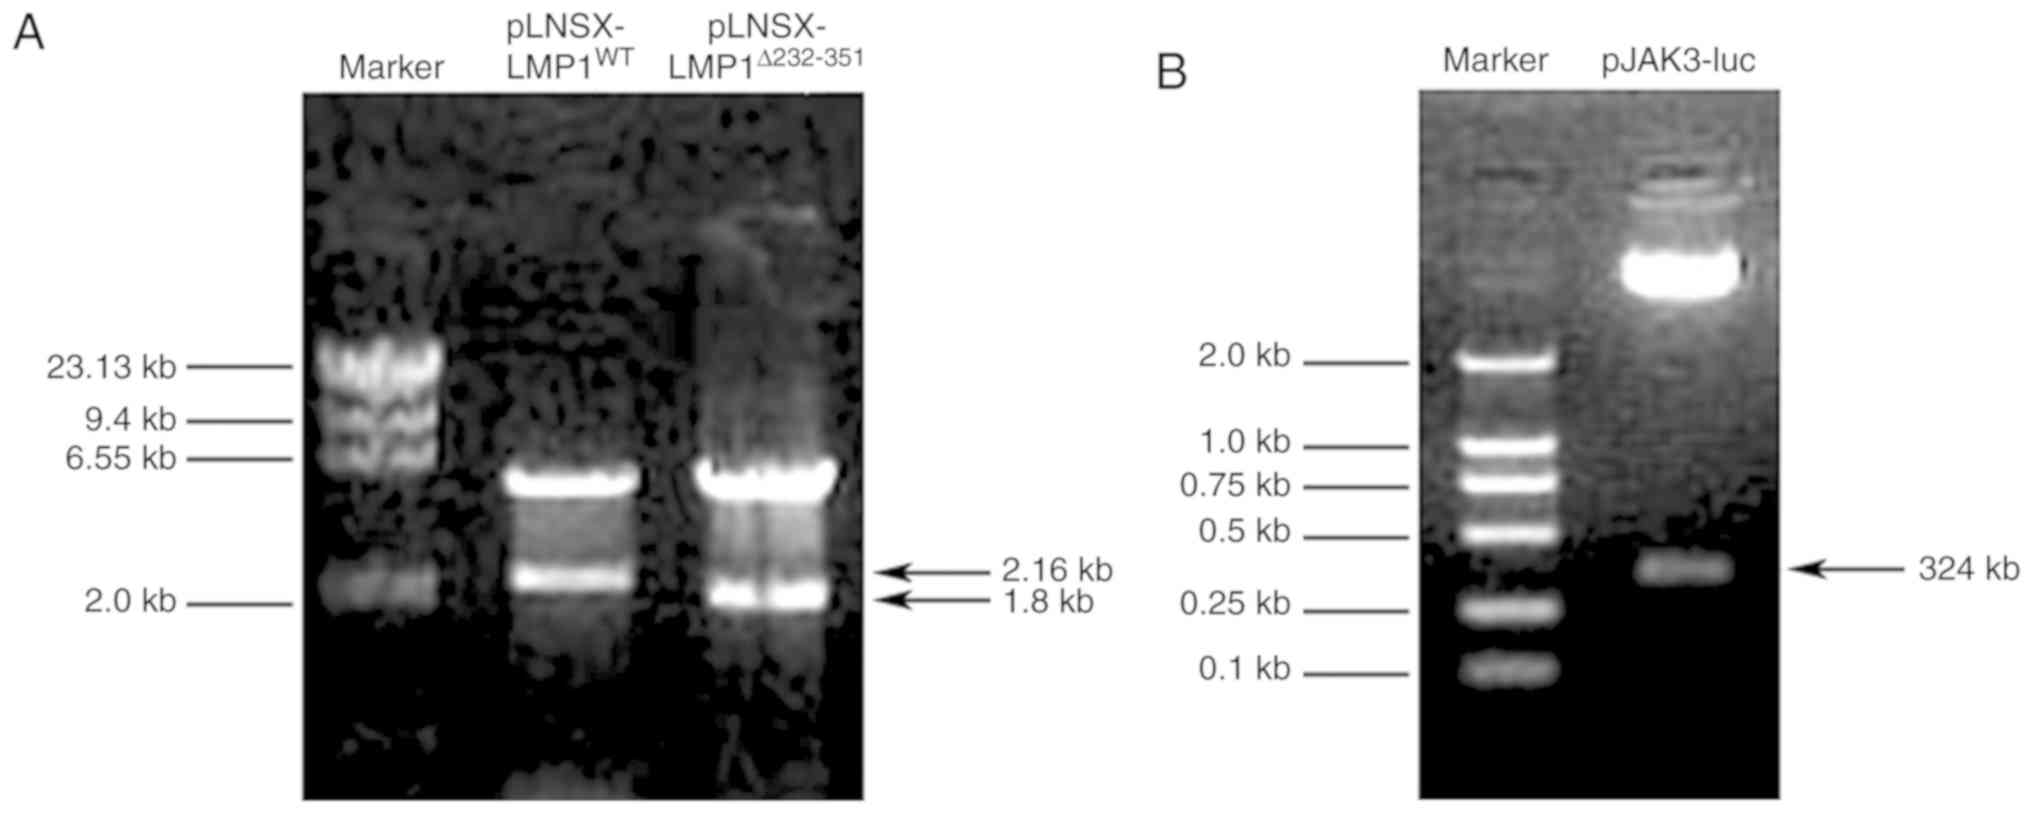
Identification of
pLNSX-LMP1Δ232-351 and pGL2/JAK3-LUC plasmids
To investigate the role of the CTAR3 binding site in
LMP1-mediated JAK3 signaling, mutant LMP1Δ232-351, LMP1
with amino acid residue deletion from 232 to 351, was constructed
as described, and a JAK3 promoter reporter system was generated
using qPCR. The construction of these plasmids was confirmed by
enzyme digestion and agarose gel electrophoresis (Fig. 1). The resultant sequence was fully
verified by sequencing (data not shown).
Lack of LMP1 CTAR3 reduces the
proliferation and growth of NP69 cells
In the present study, the two cell lines,
NP69-LMP1WT and NP69-LMP1Δ232-351 (Fig. 2A) were established. Then, the
expression levels of LMP1 in NP69-LMP1WT and
NP69-LMP1Δ232-351 cells were detected by
immunofluorescence with antibody against LMP1 S12 (Fig. 2B). In addition, the growth curves
of NP69-LMP1WT and NP69-LMP1Δ232-351 (n=3,
P<0.05; Fig. 2C) were examined.
NP69-LMP1WT cells exhibited a relatively faster growth
rate with ~7–8 population doublings by day 8 compared with in
control (NP69-pLNSX) cells. Conversely,
NP69-LMP1Δ232-351 cells only exhibited a growth rate of
~4–5 population doublings by day 8 (P<0.05 vs.
NP69-LMP1WT). The anchorage-independent growth ability
of NP69-LMP1WT and NP69-LMP1Δ232-351 cells
was also compared. LMP1WT and LMP1Δ232-351
expression induced anchorage-independent growth in NP69 cells;
however, the cloning efficiency of NP69-LMP1WT cells
(256±14 clones) was ~3-fold higher than that of the
NP69-LMP1Δ232-351 cells (88±7 clones; n=3, P<0.05;
Table II). In addition to the
difference in cloning efficiency, there was a marked difference in
size and morphology of the soft agar clones between
NP69-LMP1WT and NP69-LMP1Δ232-351 cells. The
NP69-LMP1WT soft agar clones were larger, less compact
in organization and more irregular in shape, while the
NP69-LMP1Δ232-351 clones were smaller, closely packed
and round in shape (Fig. 2D).
These results suggested that the CTAR3 of LMP1 has an important
role on the proliferation and growth of NP69 cells.
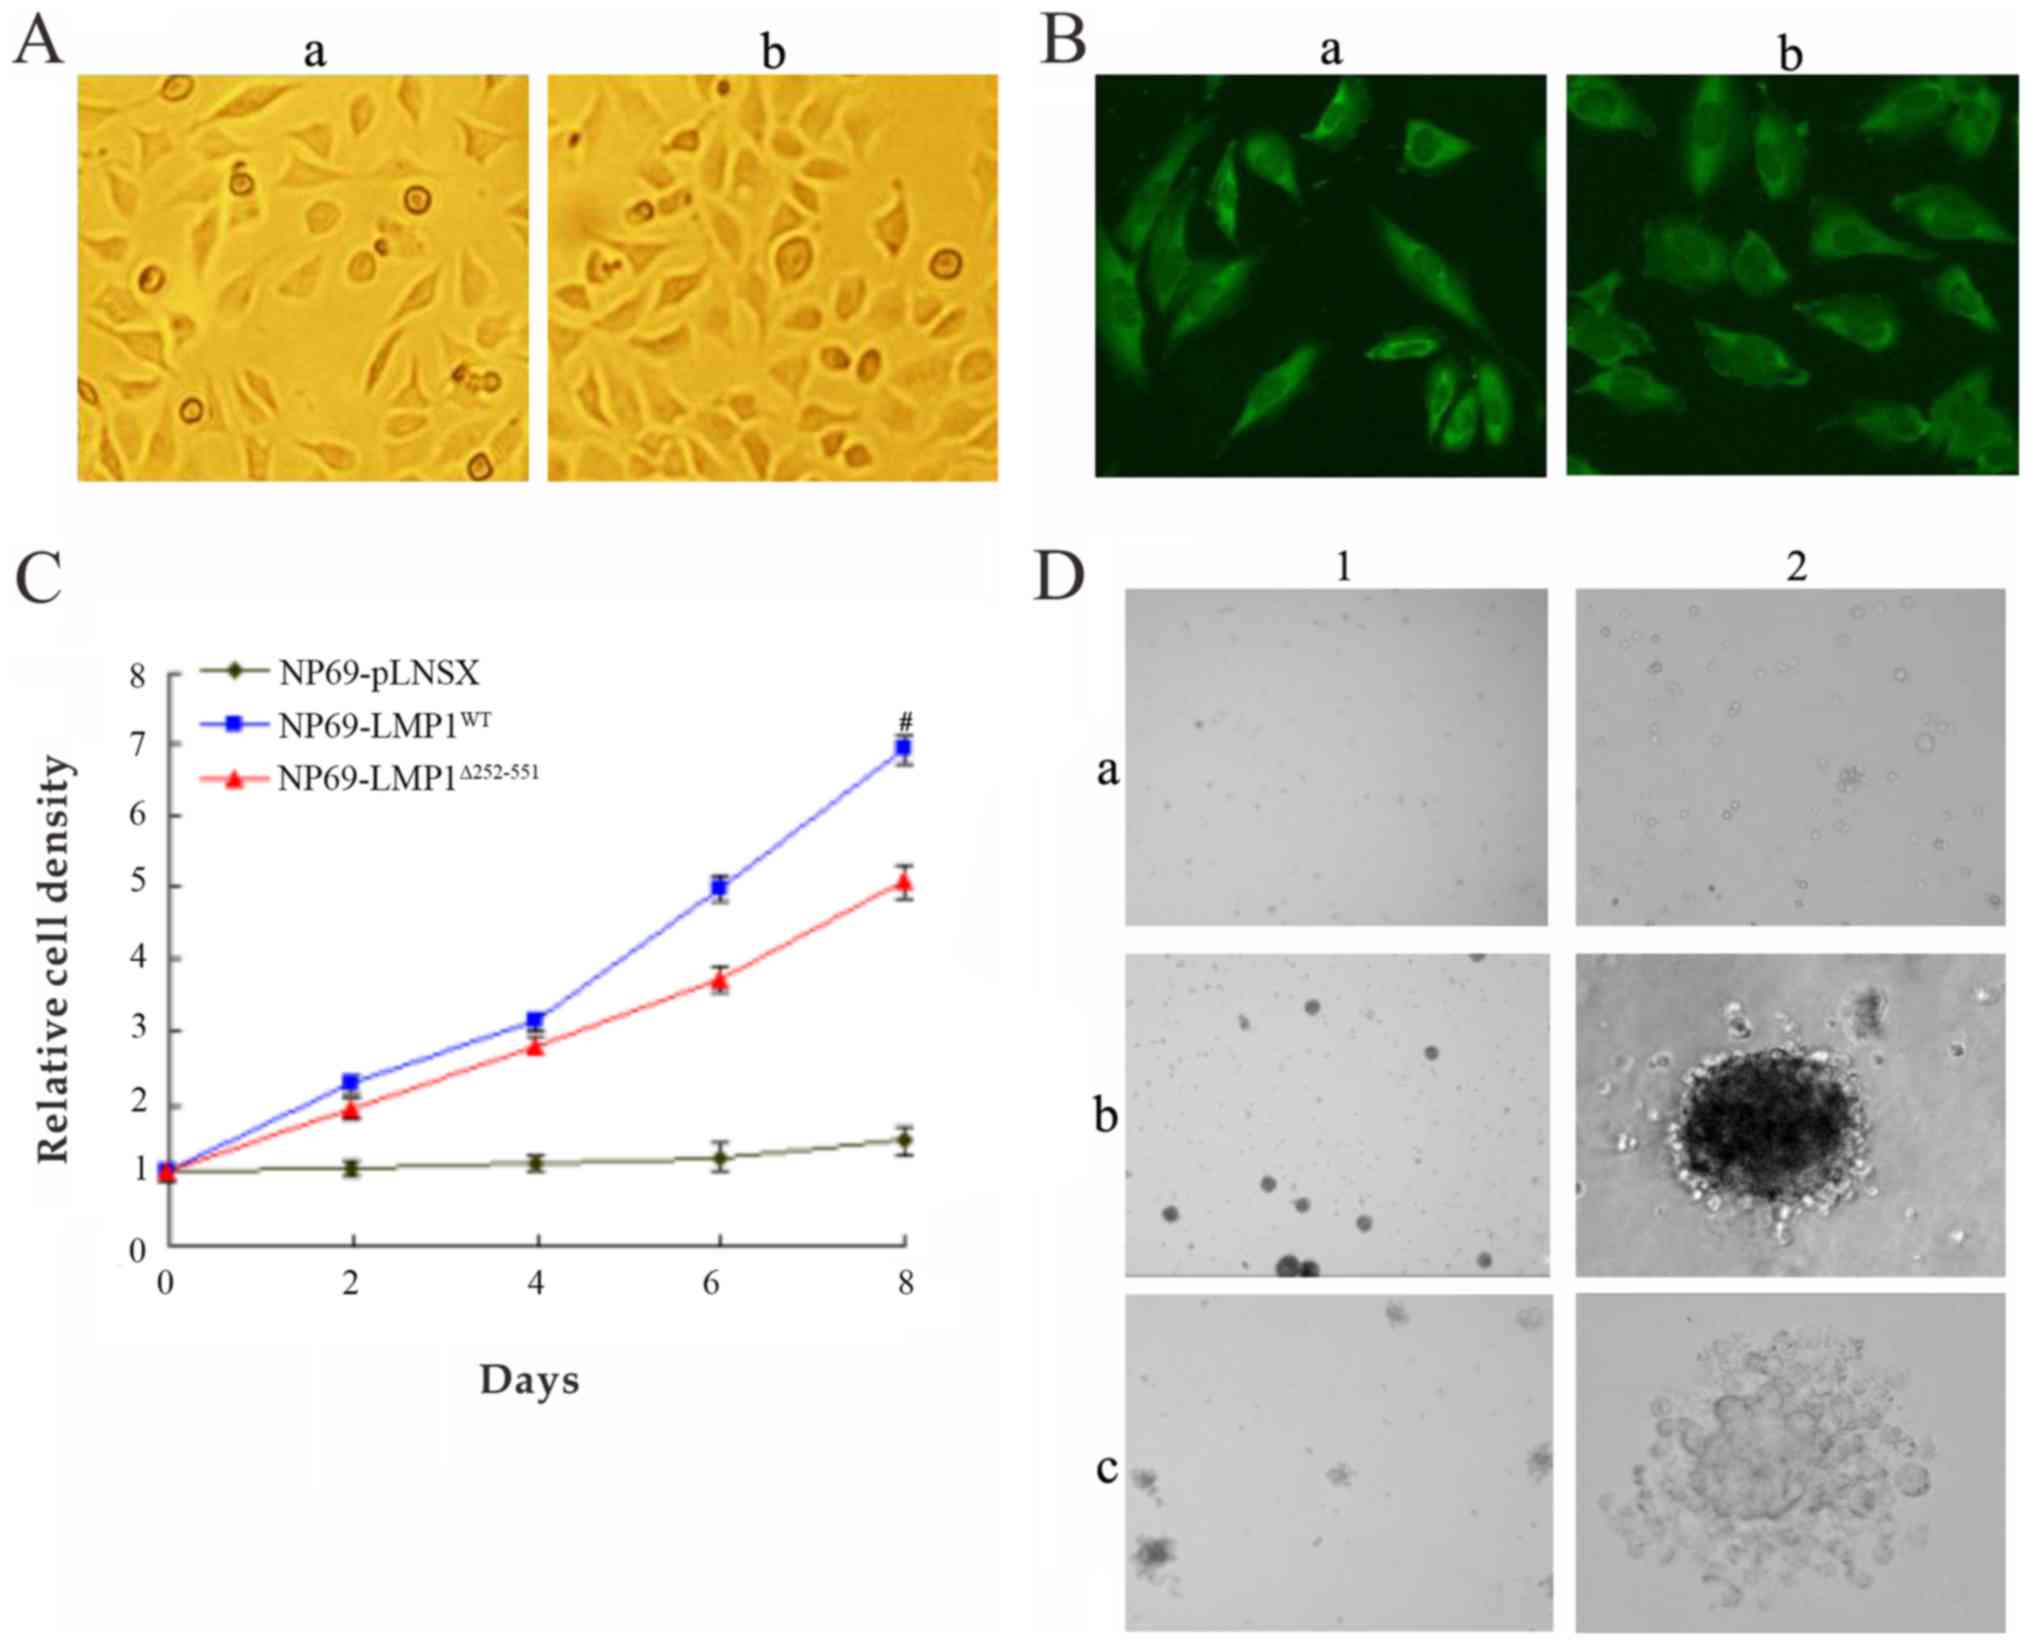 | Figure 2.Biological properties of
NP69-LMP1WT and NP69-LMP1Δ232-351 cell lines
(magnification ×400). (A) Morphologies of LMP1-expressed NP69
cells. (A-a) NP69-LMP1WT exhibited elongated and
fibroblast-like shape. (A-b) NP69-LMP1Δ232-351 exhibited
similar with fibroblast-like shape. (B) Expression of LMP1 in NP69
cells was detected by immunofluorescence. (B-a)
NP69-LMP1WT revealed green fluorescence, demonstrating
LMP1 protein expression within the cellular membrane and cytoplasm.
(B-b) NP69-LMP1Δ232-351 also exhibited LMP1 protein
expression. (C) Proliferation of NP69 cell lines expressing
LMP1WT and LMP1Δ232-351. The
NP69-LMP1WT cells proliferated faster than
NP69-LMP1Δ232-351 cells. (D) Colonies of NP69 cells in
soft agar. There was a marked difference in size and morphology of
the soft agar clones between NP69-LMP1WT and NP69-LMP1Δ232-351
cells. (D-a1, a2) NP69-pLNSX cells form very few colonies in soft
agar. (D-b1, b2) The NP69-LMP1WT soft agar clones were
larger, less compact in organization and more irregular in shape.
(D-c1, c2) The NP69-LMP1Δ232-351 clones were smaller,
closely packed and round in shape. Values are presented as the mean
± standard deviation (n=3, #P<0.05 vs.
NP69-LMP1Δ232-351). LMP1, latent membrane protein 1; WT,
wild type; LMP1Δ232-351, mutant type LMP1. |
| Table II.Cell culture transformation analysis
of NP69-pLNSX, NP69-LMP1 WT and
NP69-LMP1Δ232-351. |
Table II.
Cell culture transformation analysis
of NP69-pLNSX, NP69-LMP1 WT and
NP69-LMP1Δ232-351.
| Cells | Foci-forming
number |
|---|
|
NP69-LMP1Δ232-351 | 88±7a |
|
NP69-LMP1WT | 256±14 |
|
NP69-pLNSX | 3±1 |
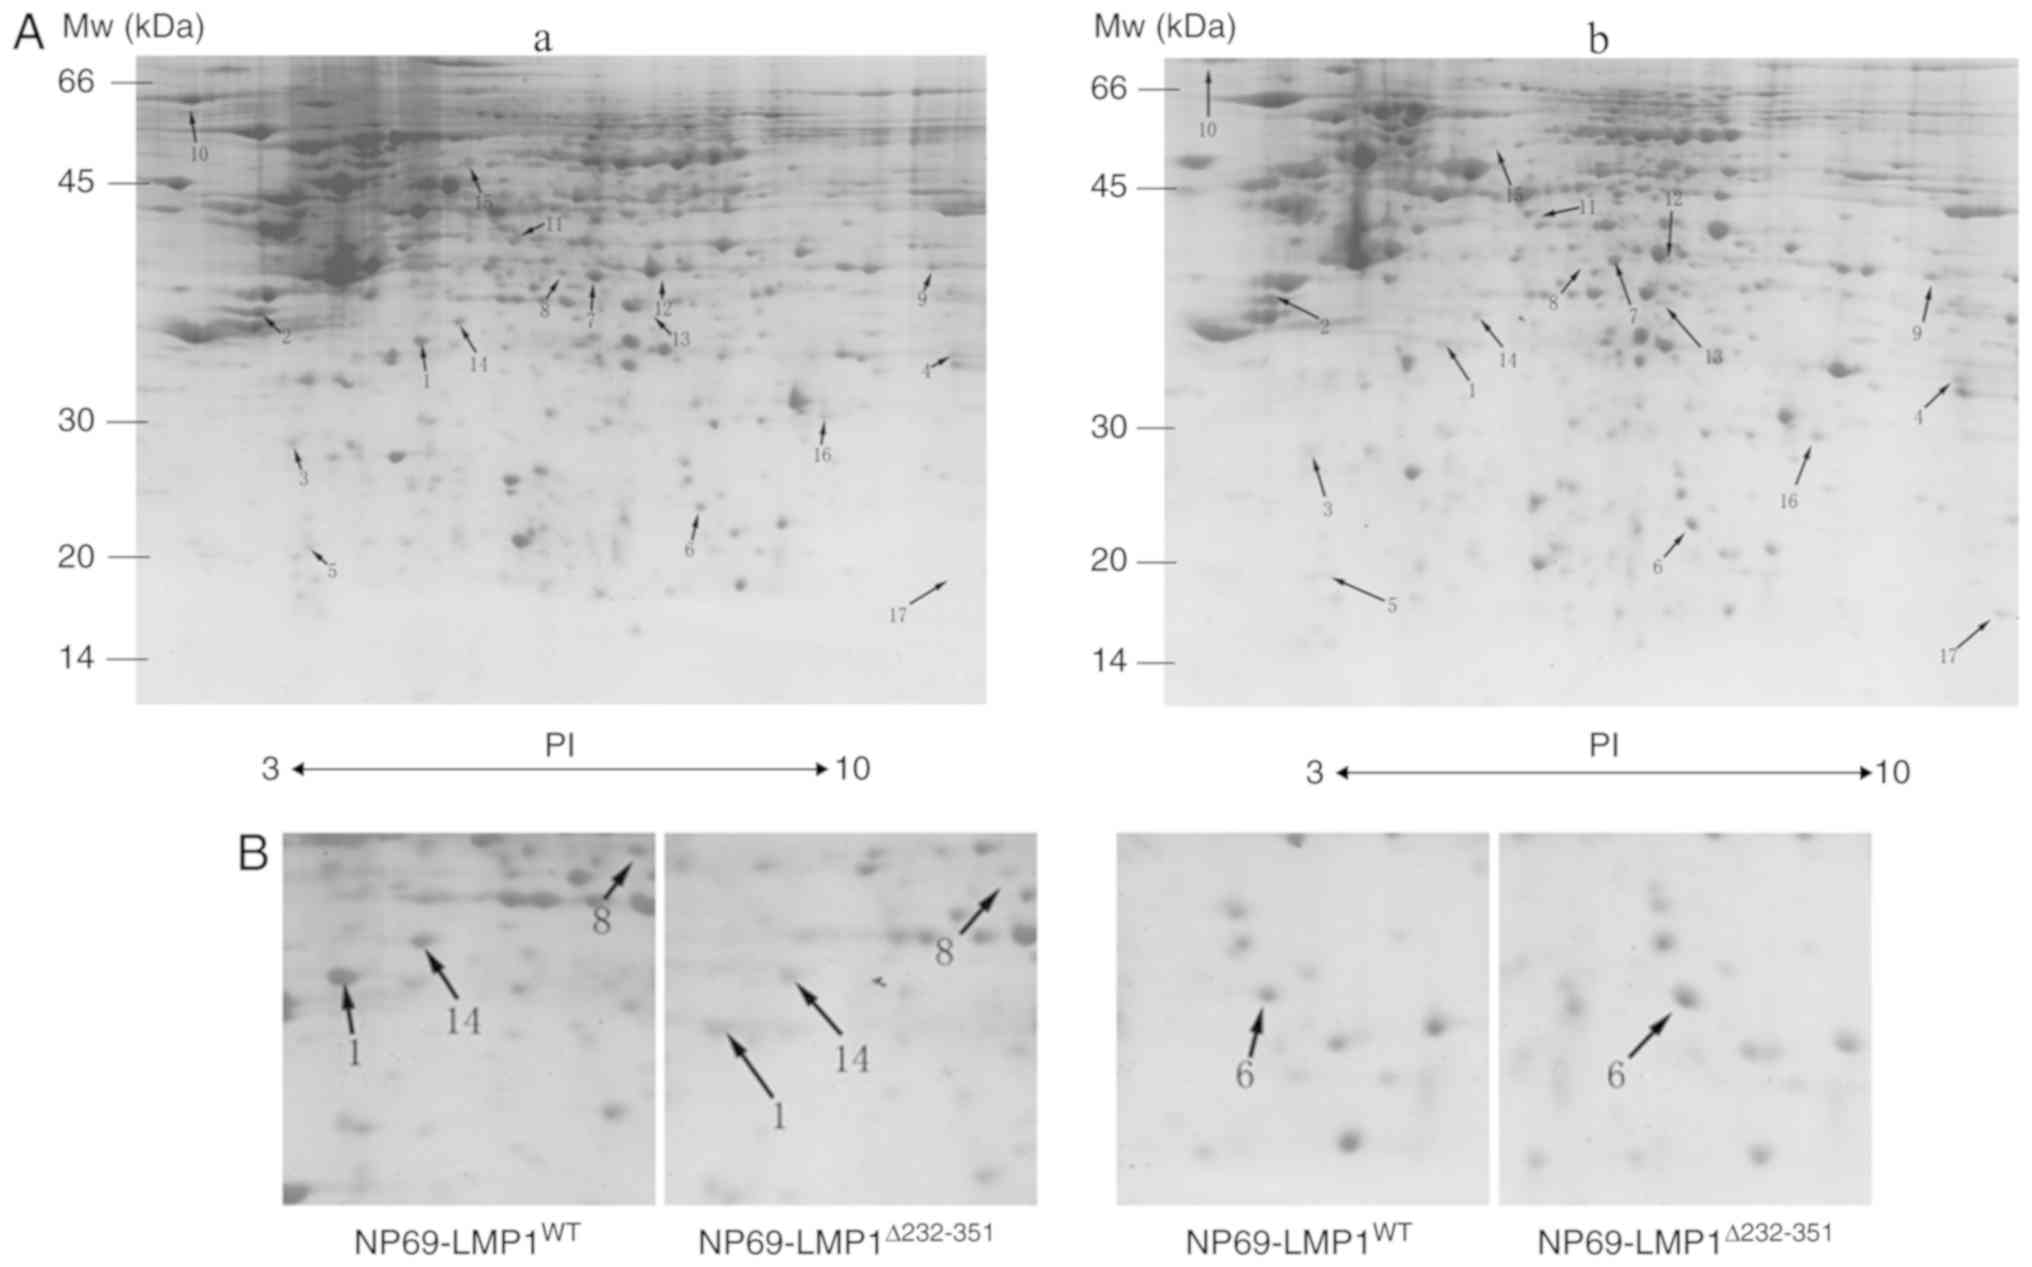
Differential protein expression
identified using IPG-2D PAGE in NP69-LMP1WT and
NP69-LMP1Δ232-351 cell lines
In the present study, two reproducible 2D gels for
each transduced NP69 cell line were obtained. In the pH range 3–10,
there were 1,088±43 and 1,142±46 protein spots observed in
NP69-LMP1WT and NP69-LMP1Δ232-351,
respectively. For the matched counter-spots, the same position of
spots was identified in the two images, which greatly facilitated
the following comparison, as presented in magnified views of the 2D
gel map. These differential protein spots were marked with arrows
(Fig. 3A). Magnified regions of
the gels revealed differential expression proteins (Fig. 3B). The quantification of the
protein spots, analyzed by PDQuest software, revealed that some
protein spots exhibited variable expression levels in the two cell
lines, as indicated by staining intensities. A total of 17 protein
spots exhibited >2-fold change in
NP69-LMP1Δ232-351-expressing cells compared with
NP69-LMP1WT-transduced cells.
Identification of differential protein
spots
Following spot excising and tryptic digestion,
identification of the protein of interest was performed using
MALDI-TOF MS. The expectation value for proteins was determined via
PMF by using the MASCOT program. The 17 differential protein spots
between NP69-LMP1WT and NP69-LMP1Δ232-351
were identified with details summarized in Table III; 8 upregulated and 9
downregulated proteins were associated with structural proteins,
metabolic enzymes, repair of DNA damage, energy and electron
transport, transcription and translation, molecular chaperone,
immunoregulation and calcium-binding, according to UNIPROT and NCBI
database.
| Table III.Identified differential protein spots
between NP69-LMP1Δ232-351 and NP69-LMP1WT
cell lines. |
Table III.
Identified differential protein spots
between NP69-LMP1Δ232-351 and NP69-LMP1WT
cell lines.
| Spot | Fold change
expressed in NP69-LMP1WT | AC | Protein | pI | Molecular weight
(kDa) | Coverage (%) | Subcellular
location | Function |
|---|
| 1 | ↑6.43 | P05388 | Ribosomal protein
P0 | 5.42 | 34.424 | 50 | Cytoplasm | Transcription and
translation |
| 2 | ↑3.25 | P21964 | Catechol
O-methyltransferase | 5.26 | 30.474 | 52 | Cytoplasm | Metabolic
enzymes |
| 3 | ↓4.32 | P36551 | Coproporphyrinogen
III oxidase | 8.59 | 50.941 | 28 | Mitochondrion | Metabolic
enzymes |
| 4 | ↓2.98 | P07355 | Annexin A2 | 8.53 | 40.671 | 47 | Cell membrane | Signal
transduction |
| 5 | ↑7.75 | Q99729 | Heterogeneous
nuclear ribonucleoprotein A/B | 6.49 | 36.059 | 37 | Nucleus | Transcription and
translation |
| 6 | ↓4.68 | P60174 | Triosephosphate
isomerase1 | 6.45 | 26.91 | 80 | Cytoplasm | Metabolic
enzymes |
| 7 | ↑3.12 | P55795 | Heterogeneous
nuclear ribonucleoprotein A/B | 5.89 | 49.517 | 39 | Nucleus | Transcription and
translation |
| 8 | ↑2.47 | P01892 | MHC class I
histocompatibility antigen HLA-A alpha chain | 6.32 | 41.171 | 47 | Cell membrane |
Immunoregulation |
| 9 | ↓3.26 | P22695 | Cytochrome b-c1
complex subunit 2, mitochondrial | 8.74 | 48.584 | 22 | Mitochondrion | Electron and energy
transport |
| 10 | ↓2.28 | P14625 | Tumor rejection
antigen (gp96) 1 | 4.77 | 92.567 | 41 | Endoplasmic
reticulum | Molecular
chaperone |
| 11 | ↑2.04 | P31930 | Cytochrome c
reductase core protein I | 5.94 | 53.297 | 50 | Mitochondrion | Electron and energy
transport |
| 12 | ↓3.45 | P31943 | Heterogeneous
nuclear ribonucleoprotein H | 5.79 | 49.384 | 45 | Nucleus | Transcription and
translation |
| 13 | ↓3.10 | Q9NR45 | N-acetylneuraminic
acid phosphate synthase | 6.29 | 40.738 | 45 | Cytoplasm | Metabolic
enzymes |
| 14 | ↑3.28 | P50213 | Isocitrate
dehydrogenase 3 (NAD+) | 6.47 | 40.022 | 26 | Mitochondrion | Metabolic
enzymes |
| 15 | ↑2.43 | P13674 | Prolyl
4-hydroxylase | 5.7 | 61.157 | 44 | Endoplasmic
reticulum | Metabolic
enzymes |
| 16 | ↓2.68 | P63244 | Guanine nucleotide
binding protein (G protein) | 7.6 | 35.511 | 65 | Cytoplasm | Signal
transduction |
| 17 | ↓3.02 | P23528 | Cofilin 1 | 8.22 | 18.719 | 56 | Nucleus and
cytoplasm | Constitutive
protein |
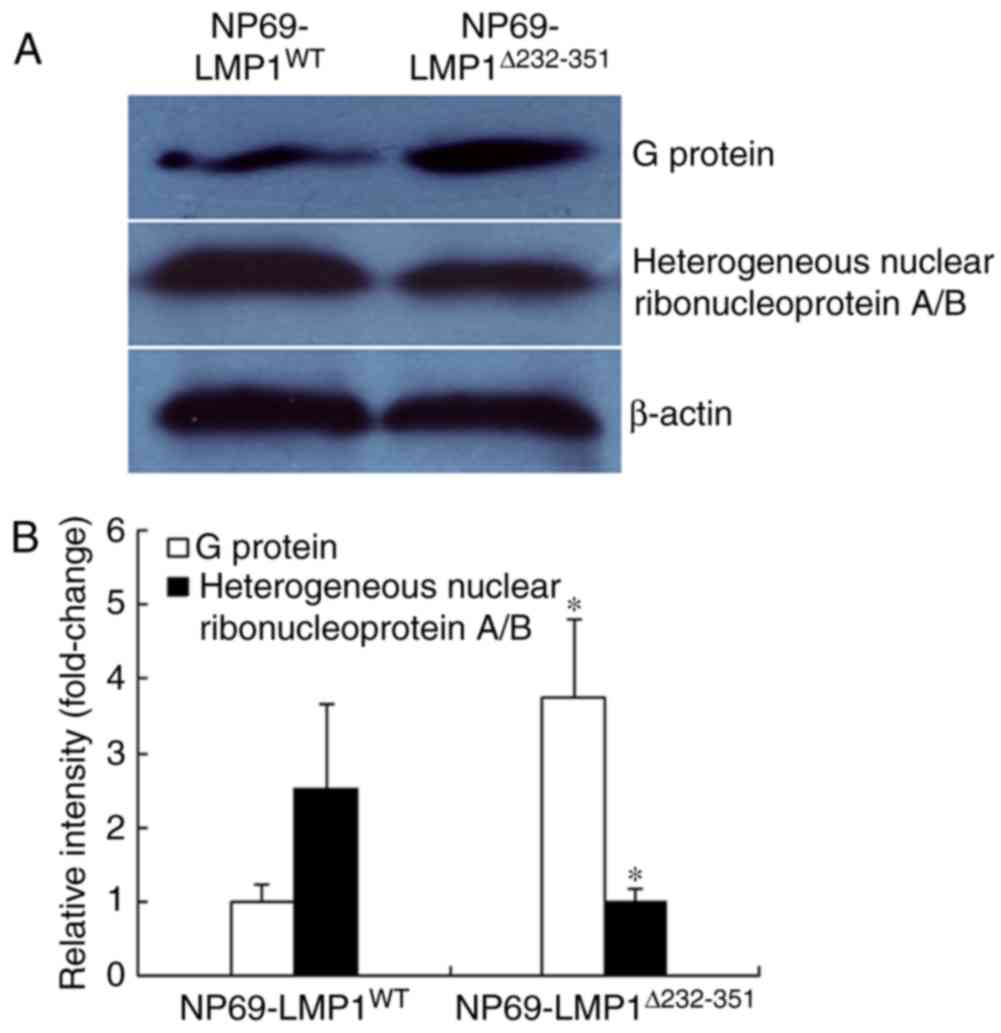
Validation of the results of partial
identified proteins by RT-qPCR and western blotting
The mRNA expression levels of differentially
expressed proteins were confirmed by RT-qPCR analysis (data not
shown). The results of RT-qPCR analysis coincided with the data of
the 2D gel. Within NP69-LMP1WT-transduced cells, the
mRNA expression levels of ribosomal protein P0 and heterogeneous
nuclear ribonucleoprotein A/B were increased by 5.31- and
6.45-fold, respectively (Table
IV), compared with NP69-LMP1Δ232-351. Two proteins,
heterogeneous nuclear ribonucleoprotein A/B (greatest fold change
increase) and G protein (2.07-fold change) were selected from the
list of differentially expressed proteins for validation by western
blotting, which reflected a similar pattern of expression to those
observed in the IPG-2D gel analysis. Compared with
NP69-LMP1Δ232-351, NP69-LMP1WT exhibited a
significant increase in heterogeneous nuclear ribonucleoprotein A/B
and decrease of G protein (n=3; P<0.05; Fig. 4). These results validated the
expression pattern of proteins identified from the 2D gel
analysis.
| Table IV.Relative mRNA expression level in
cancer-associated proteins differentially expressed between
NP69-LMP1WT and NP69-LMP1Δ232-351 cell
lines. |
Table IV.
Relative mRNA expression level in
cancer-associated proteins differentially expressed between
NP69-LMP1WT and NP69-LMP1Δ232-351 cell
lines.
| Gene | Fold
changea expressed in
NP69-LMP1WT |
|---|
| Ribosomal protein
P0 | 5.31±0.23 fold
increase |
| Annexin A2 | 2.30±1.20 fold
decrease |
| Heterogeneous
nuclear ribonucleo protein A/B | 6.45±0.49 fold
increase |
| Isocitrate
dehydrogenase 3 | 2.21±0.13 fold
increase |
| G protein | 2.07±0.47 fold
decrease |
CTAR3 of LMP1 activates the JAK3
signaling pathway
To investigate the mechanism by which LMP1 may
regulate the JAK3 signaling pathway, the NF-κB, AP-1 or JAK3
luciferase reporters were co-transfected with wild type LMP1 or
mutant LMP1Δ232-351 plasmid into 293 cells. The results
demonstrated that the ability of mutant LMP1Δ232-351 in
inducing transcriptional activity of NF-κB or AP-1 LUC reporter
plasmids was similar to wild type LMP1 (Fig. 5A and B). Additionally, the
transcriptional activity of the JAK3 promoter was upregulated by
wild type LMP1, and the extent of upregulation was associated with
the concentration of wild type LMP1; however, mutant
LMP1Δ232-351 was almost defective in activation of JAK3
reporter transcription (Fig. 5C).
The results of the present study suggested that LMP1 may
participate in the activation of the JAK3 signaling pathway,
associated with JAK3 promoter activation via LMP1. Therefore, the
results indicated that the CTAR3 of LMP1 may be a key domain
required for activating the JAK3 promoter.
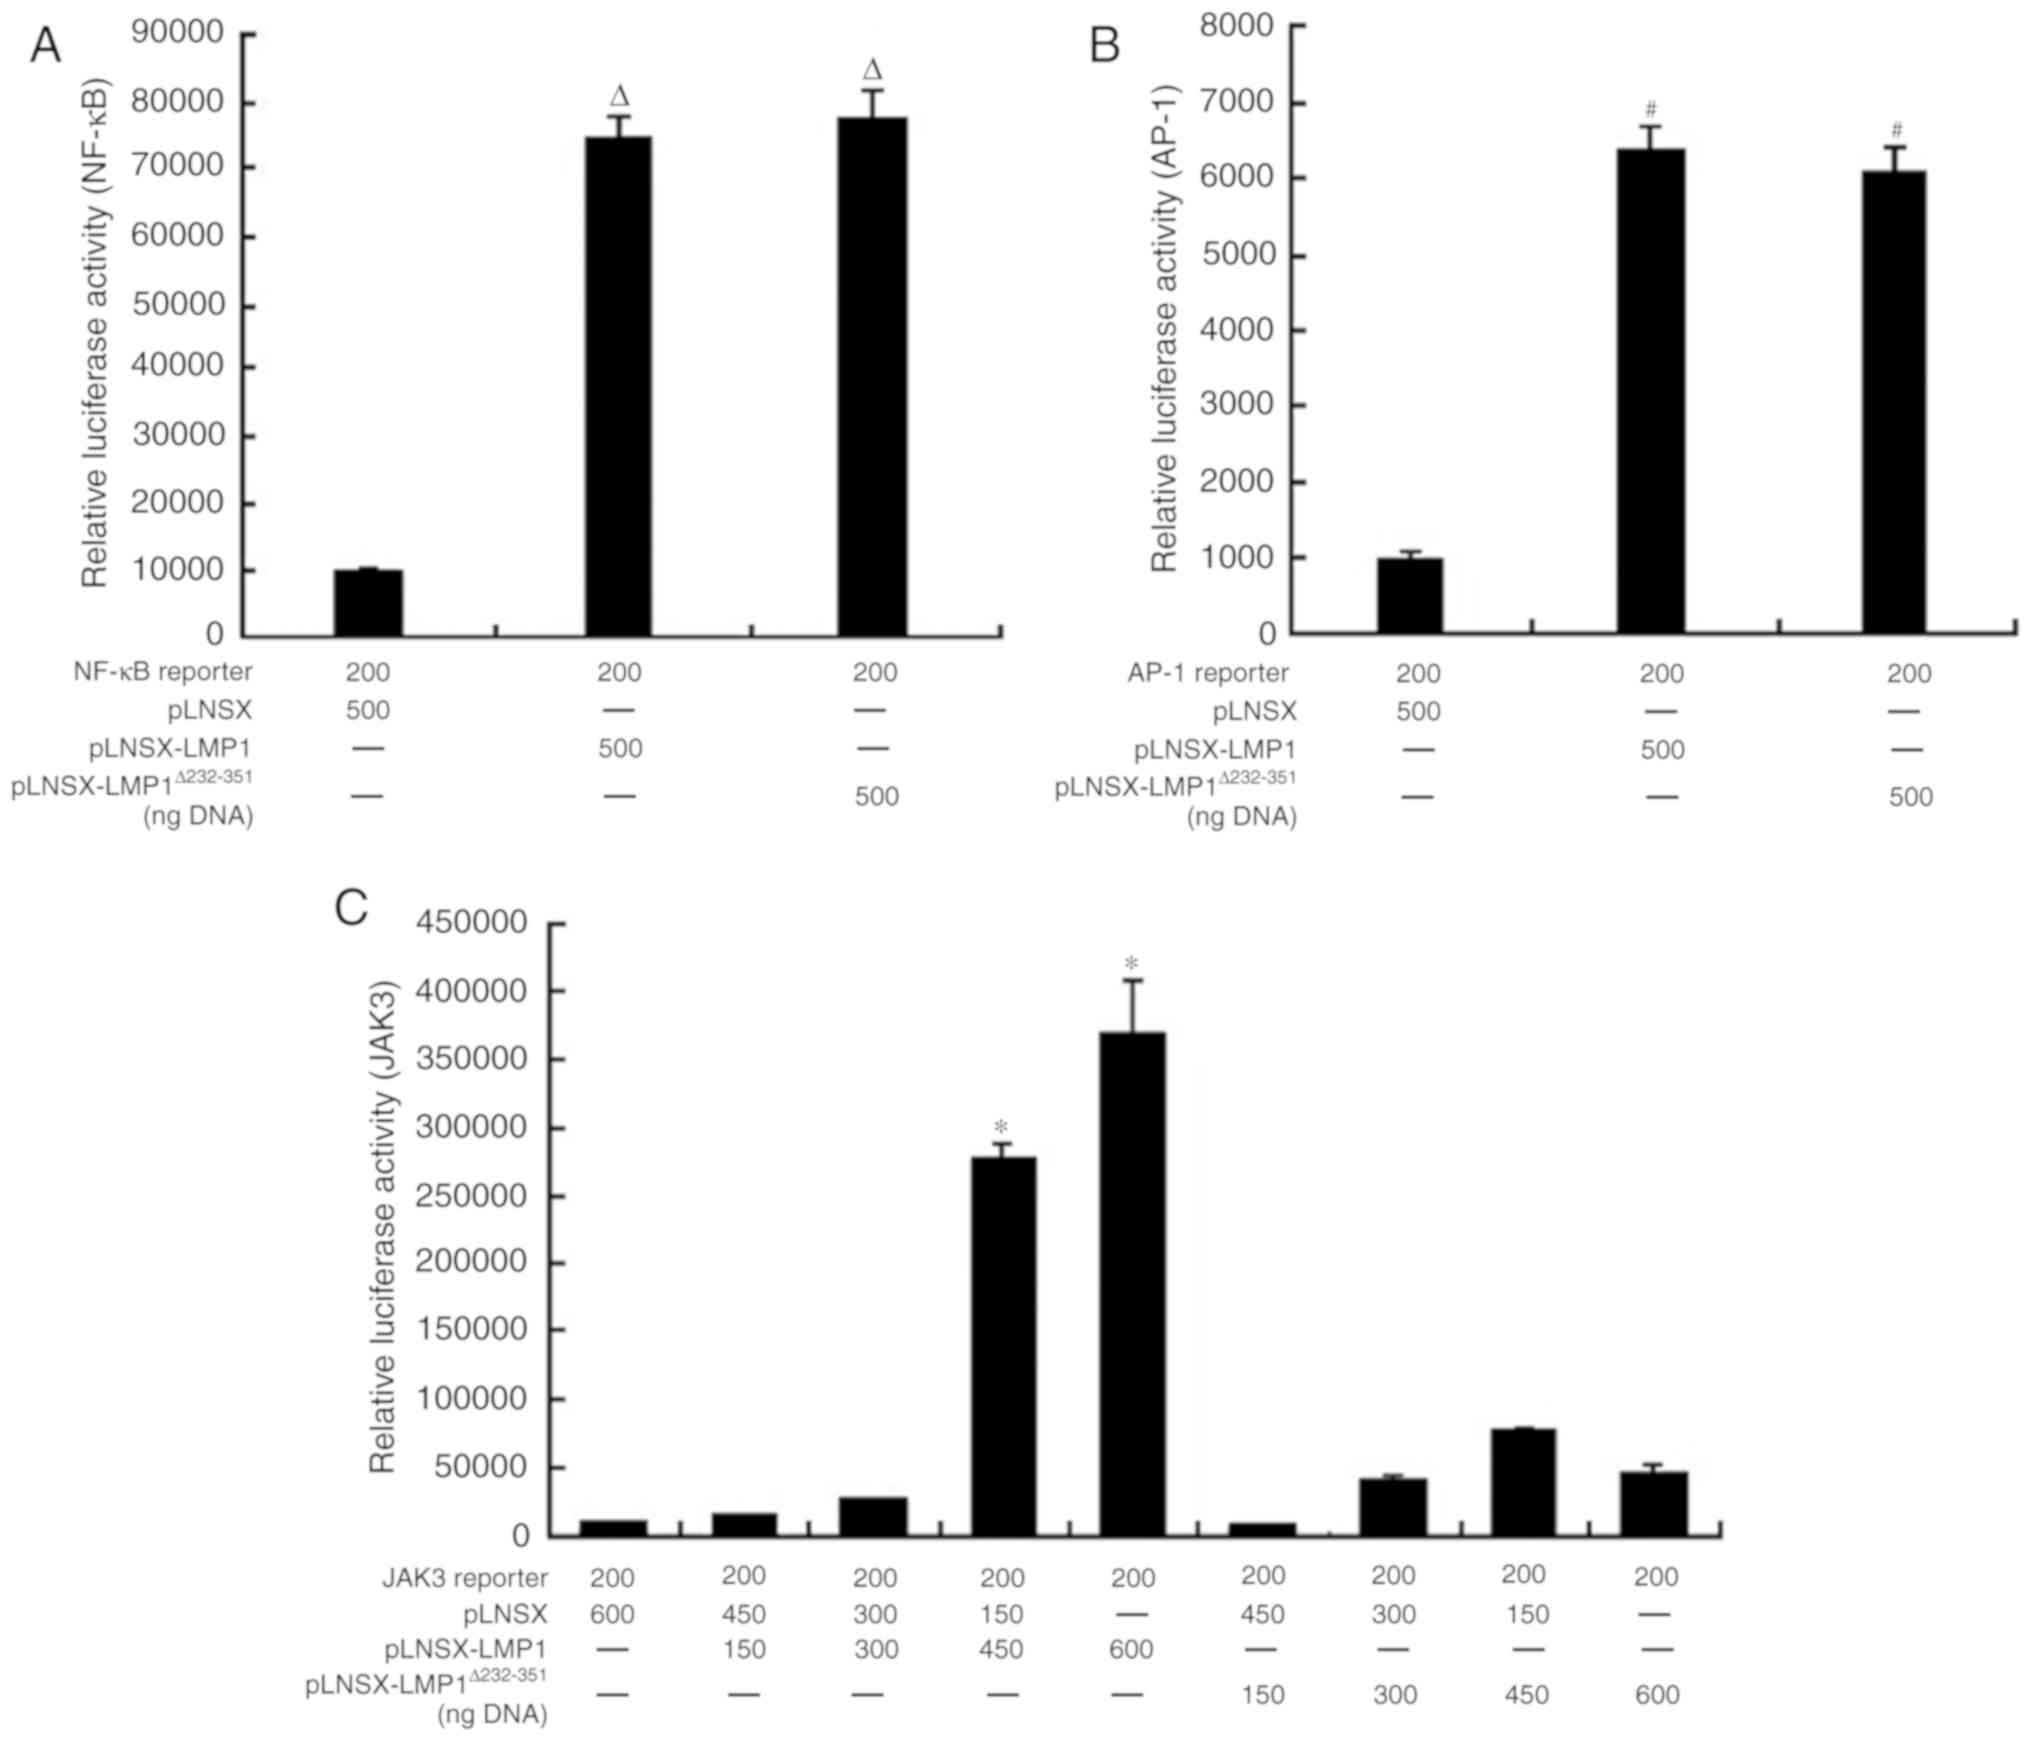 | Figure 5.Ability of LMP1 protein to activate
transcriptional activity of NF-κB, AP-1 and JAK3 promoters (A)
Mutant LMP1Δ232-351 and LMP1WT-induced
expression of the NF-κB reporter in 293 cells (n=3,
ΔP<0.05 vs. pLNSX). (B) Mutant
LMP1Δ232-351 and LMP1WT-induced expression of
the AP-1 reporter in 293 cells (n=3, #P<0.05 vs.
pLNSX). (C) Mutant LMP1Δ232-351 did not significantly
induce the transcription of the JAK3 reporter within 293 cells,
compared with LMP1WT (n=3, *P<0.05 vs. pLNSX and
pLNSX-LMP1Δ232-351). Values are presented as the mean ±
standard deviation. NF-κB, nuclear factor-κB; LMP1, latent membrane
protein 1; WT, wild type; LMP1Δ232-351, mutant type
LMP1; AP-1, activator protein-1; JAK3, Janus kinase 3. |
Discussion
EBV is a highly prevalent g herpes virus associated
with NPC and Burkett's lymphoma, and LMP1 was known generally for
critical oncogenic protein coded by EBV genome (1,9,10).
The studies that verified the expression of LMP1 in the majority of
NPC tissues suggested that LMP1 may be closely associated with NPC
genesis and invasion; however, further investigation is required
(11,12). Tsao et al and Lo et
al established the NP69 normal immortalization nasopharyngeal
epithelium cell line in vitro, and reported that the cell
generated a serial malignant phenotype when a LMP1 eukaryotic
expression vector was introduced into the NP69 cell line (13,14).
Gires et al (7) first
reported the CTAR3 of LMP1 and confirmed the region was associated
with the JAK3/signal transducer and activator of transcription
(STAT) signaling pathway; however, its function in epithelial cells
requires further analysis. To further investigate the functional
activity of LMP1-CTAR3, a retrovirus was used to establish an NP69
cell line with stable expression of mutant LMP1Δ232-351
and wild type LMP1WT, respectively named
NP69-LMP1Δ232-351 and NP69-LMP1WT cells in
the present study. Subsequently, the biological properties of
transfected NP69 cells were observed. Collectively, the results of
the present study supported the findings of Tsao et al
(13), which demonstrated that
LMP1 promoted NP69 cell proliferation and transformation, increased
cell growth velocity and increased multiple clone formation.
Previously, numerous studies reported the role of
LMP1 transforming animal, human fibroblasts and some
immortalization epithelial cells (14–16).
In the present study, the results further supported the hypothesis
that LMP1 may be associated with several malignancies of epithelium
origin, such as NPC. In the current study, the ability of mutant
LMP1Δ232-351 to promote proliferation was notably
reduced compared with LMP1WT. These results suggested
that CTAR3 may participate in the regulation of LMP1 associated
with cell proliferation; however, whether CTAR3 is involved in
JAK3/STAT3 signaling pathway requires further investigation. It has
been reported that the phosphorylation of JAK3 mediates the
regulation of cell proliferation (17). Therefore, LMP1-CTAR3 may activate
the JAK3/STAT signaling pathway in nasopharynx epithelial
cells.
Studies have reported on the role of LMP1 in the
promotion of cell transformation (18,19),
however to elucidate the underlying mechanism will require further
research. In addition, the signaling pathway of interest, in
particular the function and feature of CTAR3, lacked unified
recognition and conclusion. In the present study, the protein
molecule network associated with wild type LMP1WT and
mutant LMP1Δ232-351 transformed NP69 cells were
investigated by proteomic analysis. The results of the present
study revealed that 17 proteins were variably expressed in
NP69-LMP1Δ232-351-transduced cells compared with
NP69-LMP1WT-transduced cells. These results may provide
notable information and insight for further research. Additionally,
these differential proteins were associated with cellular
metabolism, signal conduction, molecular chaperones, cellular
structure, immunoregulation, transcription and translation, energy
and electron, molecular chaperone, as reported in the present
study. Furthermore, proteins were mainly located in the
endochylema, cytochondriome, endoplasmic reticulum, nucleus and
cell membrane. To investigate the expression levels of differential
proteins, several proteins were analyzed by western blotting and
RT-qPCR. The results were similar with outcomes identified by
proteomics methods in the present study (Table III and IV).
G protein, namely guanosine 5′-triphosphate-binding
protein, is an important protein associated with the regulation of
cellular signal transduction. Zhou et al (20) demonstrated that G protein
phosphorylation and modification accelerated cellular apoptosis. In
the present study, compared with NP69-LMP1WT, the
expression levels of G protein were significantly increased within
NP69-LMP1Δ232-351 cells. Therefore, LMP1 may
downregulate the expression of G proteins to induce minor
activating proteins involved in apoptosis of NP69-LMP1WT
cells. Hence, LMP1 may mediate cell proliferation associated with
the expression of G proteins.
Heterogeneous nuclear ribonucleoprotein (hnRNP) was
first described as a family of proteins that bind RNA polymerase II
and is transcribed to form hnRNP particles. The hnRNP A/B proteins
are among the most abundant RNA-binding proteins, forming the core
of the ribonucleoprotein complex that connects with nascent
transcripts in eukaryotic cells. They also recruit regulatory
proteins connected with pathways related to DNA and RNA metabolism
(21). He et al (22). have shown that hnRNP A/B proteins
are dysregulated in a large number of epithelial cancer cells In
the present study, compared with NP69-LMP1WT, the
expression levels of G protein were significantly decreased within
NP69-LMP1Δ232-351 cells. This suggests that LMP1 may
upregulate the expression of G proteins to induce activation of
proteins involved in the proliferation of NP69-LMP1WT
cells.
Isocitrate dehydrogenase is a rate-limiting enzyme
of the tricarboxylic acid cycle and a key enzyme of cell energy
metabolism, cell growth and proliferation (23). In the present study, the expression
of isocitrate dehydrogenase was higher in NP69-LMP1WT
than that in NP69-LMP1Δ232-351. The cell growth and
proliferation of NP69-LMP1WT was faster than
NP69-LMP1Δ232-351. The results of the present study
suggest that LMP1-CTAR3 may mediate the regulation of isocitrate
dehydrogenase expression, and affect cell metabolism and synthesis,
which serves an important role in promoting cell proliferation and
transformation (24).
Collectively, the findings of the present study
suggested that LMP1 serves an important role in the transformation
and proliferation of nasopharyngeal epithelial cells. The data of
differential proteins was reported and 17 differential proteins
were identified between NP69-LMP1WT and
NP69-LMP1Δ232-351-transduced cells. These differential
proteins, associated with LMP1 and the domain of CTAR3, may be
involved in the regulation of cell proliferation and transformation
of nasopharynx epithelial cells. The findings provide novel insight
for further NPC research and may be valuable for investigating the
mechanism of LMP1-associated tumors. However, how LMPI and its
CTAR3 active region regulate the expression of these differential
proteins, as well as the mechanisms by which these differentially
expressed proteins promote epithelial cell growth, proliferation
and transformation, requires further investigation.
Acknowledgements
The authors would like to thank Dr Sai Wah Tsao
(University of Hong Kong, Hong Kong, SAR, China) for NP69 cell
lines.
Funding
The present study was supported by the Hunan
Provincial Innovation Foundation For Postgraduate (grant no.
CX2016B478), National Natural Science Foundation of China (grant
no. 30470668) and Health Department Scientific Research Foundation
of Hunan Province (grant no. B2006-100).
Availability of data and materials
All data generated or analyzed during this study are
included in this published article.
Authors' contributions
ZWZ and HLZ performed the majority of the
experiments in this work. YHY, ZCC and YMO performed research and
analyzed the data. ZWZ, HLZ and ZMH wrote the manuscript. XSH and
ZMH conceived the experimental design, were responsible for
financial support and wrote the manuscript. All authors read and
approved the final manuscript.
Ethics approval and consent to
participate
Not applicable.
Patient consent for publication
Not applicable.
Competing interests
The authors declare that they have no competing
interests.
References
|
1
|
Thompson MP and Kurzrock R: Epstein-Barr
virus and cancer. Clin Cancer Res. 10:803–821. 2004. View Article : Google Scholar : PubMed/NCBI
|
|
2
|
Ma SD, Tsai MH, Romero-Masters JC, Ranheim
EA, Huebner SM, Bristol JA, Delecluse HJ and Kenney SC: Latent
membrane protein 1 (LMP1) and LMP2A collaborate to promote
Epstein-Barr virus-induced B cell lymphomas in a cord
blood-humanized mouse model but are not essential. J Virol.
91:e01928–16. 2017. View Article : Google Scholar : PubMed/NCBI
|
|
3
|
Pandya J and Walling DM: Oncogenic
activity of Epstein-Barr virus latent membrane protein 1 (LMP-1) is
down-regulated by lytic LMP-1. J Virol. 80:8038–8046. 2006.
View Article : Google Scholar : PubMed/NCBI
|
|
4
|
Lavorgna A and Harhaj EW: EBV LMP1: New
and shared pathways to NF-kB activation. Proc Natl Acad Sci USA.
109:2188–2189. 2012. View Article : Google Scholar : PubMed/NCBI
|
|
5
|
Ikeda O, Miyasaka Y, Yoshida R, Mizushima
A, Oritani K, Sekine Y, Kuroda M, Yasui T, Fujimuro M, Muromoto R,
et al: BS69 cooperates with TRAF3 in the regulation of Epstein-Barr
virus-derived LMP1/CTAR1-induced NF-kappaB activation. FEBS Lett.
584:865–872. 2010. View Article : Google Scholar : PubMed/NCBI
|
|
6
|
Shkoda A, Town JA, Griese J, Romio M,
Sarioglu H, Knöfel T, Giehler F and Kieser A: The germinal center
kinase TNIK is required for canonical NF-κB and JNK signaling in
B-cells by the EBV oncoprotein LMP1 and the CD40 receptor. PLoS
Biol. 10:e10013762012. View Article : Google Scholar : PubMed/NCBI
|
|
7
|
Gires O, Kohlhuber F, Kilger E, Baumann M,
Kieser A, Kaiser C, Zeidler R, Scheffer B, Ueffing M and
Hammerschmidt W: Latent membrane protein 1 of Epstein-Barr virus
interacts with JAK3 and activates STAT proteins. EMBO J.
18:3064–3073. 1999. View Article : Google Scholar : PubMed/NCBI
|
|
8
|
Livak KJ and Schmittgen TD: Analysis of
relative gene expression data using real-time quantitative PCR and
the 2(-Delta Delta C(T)) method. Methods. 25:402–408. 2001.
View Article : Google Scholar : PubMed/NCBI
|
|
9
|
Farrell PJ: Epstein-Barr virus and cancer.
Annu Rev Pathol. 14:29–53. 2019. View Article : Google Scholar : PubMed/NCBI
|
|
10
|
Kilger E, Kieser A, Baumann M and
Hammerschmidt W: Epstein-Barr virus-mediated B-cell proliferation
is dependent upon latent membrane protein 1, which simulates an
activated CD40 receptor. EMBO J. 17:1700–1709. 1998. View Article : Google Scholar : PubMed/NCBI
|
|
11
|
Shair KH, Schnegg CI and Raab-Traub N: EBV
latent membrane protein 1 effects on plakoglobin, cell growth, and
migration. Cancer Res. 68:6997–7005. 2008. View Article : Google Scholar : PubMed/NCBI
|
|
12
|
Tu C, Zeng Z, Qi P, Li X, Guo C, Xiong F,
Xiang B, Zhou M, Liao Q, Yu J, et al: Identification of genomic
alterations in nasopharyngeal carcinoma and nasopharyngeal
carcinoma-derived Epstein-Barr virus by whole-genome sequencing.
Carcinogenesis. 39:1517–1528. 2018. View Article : Google Scholar : PubMed/NCBI
|
|
13
|
Tsao SW, Wang X, Liu Y, Cheung YC, Feng H,
Zheng Z, Wong N, Yuen PW, Lo AK, Wong YC and Huang DP:
Establishment of two immortalized nasopharyngeal epithelial cell
lines using SV40 large T and HPV16E6/E7 viral oncogenes. Biochim
Biophys Acta. 1590:150–158. 2002. View Article : Google Scholar : PubMed/NCBI
|
|
14
|
Lo AK, Liu Y, Wang XH, Huang DP, Yuen PW,
Wong YC and Tsao GS: Alterations of biologic properties and gene
expression in nasopharyngeal epithelial cells by the Epstein-Barr
virus-encoded latent membrane protein 1. Lab Invest. 83:697–709.
2003. View Article : Google Scholar : PubMed/NCBI
|
|
15
|
Ahsan N, Kanda T, Nagashima K and Takada
K: Epstein-Barr virus transforming protein LMP1 plays a critical
role in virus production. J Virol. 79:4415–4424. 2005. View Article : Google Scholar : PubMed/NCBI
|
|
16
|
Xin B, He Z, Yang X, Chan CP, Ng MH and
Cao L: TRADD domain of Epstein-Barr virus transforming protein LMP1
is essential for inducing immortalization and suppressing
senescence of primary rodent fibroblasts. J Virol. 75:3010–3015.
2001. View Article : Google Scholar : PubMed/NCBI
|
|
17
|
Gallardo-Vera F, Diaz D, Tapia-Rodriguez
M, Fortoul van der Goes T, Masso F, Rendon-Huerta E and Montaño LF:
Vanadium pentoxide prevents NK-92MI cell proliferation and IFNg
secretion through sustained JAK3 phosphorylation. J Immunotoxicol.
13:27–37. 2016. View Article : Google Scholar : PubMed/NCBI
|
|
18
|
Smirnova KV, Diduk SV, Senyuta NB and
Gurtsevitch VE: Molecular biological properties of the Epstein-Barr
virus LMP1 gene: Structure, function and polymorphism. Vopr
Virusol. 60:5–13. 2015.(In Russian). PubMed/NCBI
|
|
19
|
Uchida J, Yasui T, Takaoka-Shichijo Y,
Muraoka M, Kulwichit W, Raab-Traub N and Kikutani H: Mimicry of
CD40 signals by Epstein-Barr virus LMP1 in B lymphocyte responses.
Science. 286:300–303. 1999. View Article : Google Scholar : PubMed/NCBI
|
|
20
|
Zhou C, Dai X, Chen Y, Shen Y, Lei S, Xiao
T, Bartfai T, Ding J and Wang MW: G protein-coupled receptor GPR160
is associated with apoptosis and cell cycle arrest of prostate
cancer cells. Oncotarget. 7:12823–12839. 2016.PubMed/NCBI
|
|
21
|
He Y and Smith R: Nuclear functions of
heterogeneous nuclear ribonucleoproteins A/B. Cell Mol Life Sci.
66:1239–1256. 2009. View Article : Google Scholar : PubMed/NCBI
|
|
22
|
He Y, Brown MA, Rothnagel JA, Saunders NA
and Smith R: Roles of heterogeneous nuclear ribonucleoproteins A
and B in cell proliferation. J Cell Sci. 118:3173–3183. 2005.
View Article : Google Scholar : PubMed/NCBI
|
|
23
|
Lu HC, Ma J, Zhuang Z, Qiu F, Cheng HL and
Shi JX: Exploring the regulatory role of isocitrate dehydrogenase
mutant protein on glioma stem cell proliferation. Eur Rev Med
Pharmacol Sci. 20:3378–3384. 2016.PubMed/NCBI
|
|
24
|
Bentz GL, Whitehurst CB and Pagano JS:
Epstein-Barr virus latent membrane protein 1 (LMP1)
C-terminal-activating region 3 contributes to LMP1-mediated
cellular migration via its interaction with Ubc9. J Virol.
85:10144–10153. 2011. View Article : Google Scholar : PubMed/NCBI
|