Introduction
Polycystic ovary syndrome (PCOS) is a main
hyperandrogenic disorder in which women present with unbalanced
hormone levels (1). It is
generally acknowledged as the most prevalent disorder in the female
endocrine systems at the reproductive age, with still undefined
diagnostic criteria and limited sample methodology (2). Up to 10% of women at the reproductive
age develop PCOS, which is a main cause of infertility, obstetrical
complications, cardiovascular disease, type 2 diabetes mellitus and
eating disorders (3). Apart from
that, women with PCOS, to a large extent, exhibit symptoms of
anxiety and depression, which lead to an impaired health-related
quality of life (4). Clomiphene
citrate has been used as the first-line oral medication therapy to
benefit fertility, followed by gonadotrophins and laparoscopic
ovarian surgery or possibly metformin as the second-line treatment
for clomiphene citrate-resistant PCOS women (5). More recently, vitamin D was found to
be effective for women diagnosed with PCOS by improving their
menstrual frequency and glucose metabolism (6). Insulin resistance, obesity and
increased cardiometabolic risk factors are some of the risks
associated with PCOS (7), thus
making the enrollment of obese (OB)-PCOS patients in our study
important. Additionally, the association between the melatonin
receptor 1A (MTNR1A) gene polymorphism and PCOS has already been
indicated (8). Therefore, the
present study was designed to combine the elements of the MTNR
polymorphism with obesity to ascertain whether they are related in
PCOS.
Melatonin (N-acetyl-5-methoxytryptamine), the
neurohormone of the pineal gland, which is also produced by many
other tissues and cells, acts through G protein-coupled receptors
and is present in peripheral tissues and in different areas of the
central nervous system (9). The
MTNR1A receptor is one of the many melatonin receptors that may
influence the risk of calcium nephrolithiasis (10). The effects of MTNR1A polymorphisms
on the fertility rate after artificial insemination (AI) treatment
in Sarda sheep was also previously evaluated (11), which paved the way for exploring
the relationship between MTNR1A and PCOS. The symptom of
infertility was associated with an elevated risk of type 2 diabetes
(T2DM), which could result from glycolipid metabolism disorder
(12,13). In addition, previous evidence also
revealed that a common variant in MTNR1B is related to an increased
risk of T2DM (14). Furthermore,
the actions of melatonin were reported to be mainly regulated by
interacting with specific receptors bound to the membrane, MT1 and
MT2, of which the MT1 receptor has been found to be expressed in
ovary tissues (15). Intriguingly,
Slominski et al (16) found
that intracellular reactive oxygen species exposed to ultraviolet B
(UVB) were greatly decreased in cells treated with melatonin or its
metabolites, which is a process that is independent of the specific
receptors bound to the membrane. As one of the risk factors
(already mentioned above) for PCOS occurrence, infertility, which
is possibly caused by disordered glycolipid metabolism, could be
involved in PCOS development. The present study was performed to
ascertain whether MTNR1A (rs2119882) and MTNR1B (rs10830963)
polymorphisms are protective or harmful for obese PCOS
patients.
Materials and methods
Ethics statement
This study was approved by the Ethics Committee of
Dongying People's Hospital, and all experimental procedures were
conducted under the strict supervision of the committee. Written
informed consent was obtained from all patients or their parents or
guardians.
Study subjects
From March 2013 to May 2015, a total of 359 patients
diagnosed with PCOS and receiving treatment at Dongying People's
Hospital were enrolled in our study. The diagnostic criteria for
PCOS were in line with the revised 2003 Rotterdam
ESHRE/ASRM-Sponsored PCOS consensus (17): i) female patients demonstrating
sporadic ovulation and (or) anovulation; ii) female patients
demonstrating clinical and (or) biochemical indices of heightened
androgen levels with no other pathogenic factors such as Cushing's
syndrome or ovarian tumors; and iii) female patients demonstrating
polycystic ovarian change along with 12 2- to 9-mm ovarian
follicles in at least one ovary. Three months before the
experiment, all included subjects did not take any medicine that
could affect their reproductive hormones or glycolipid metabolism.
A body mass index (BMI) ≥25 kg/m2 was used as the
standard for classifying obesity (18), according to which the selected
patients were classified into the obese PCOS patients (OB-PCOS)
group or the nonobese PCOS patients (NOB-PCOS) group. There were
168 patients in the OB-PCOS group and 191 in the NOB-PCOS group,
and 215 oviduct infertile patients with normal ovulation comprised
the control group. The average age of the three groups were,
respectively, 25.7±4.1, 25.3±3.7 and 25.1±3.2 years.
Analysis of the clinical features
Patients in the OB-PCOS and NOB-PCOS groups were
examined to ascertain whether they had abnormal menstruation or
infertility. At the same time, the Ferriman-Galley score and the
Rosenfield acne score were calculated (19,20).
Based on the Ferriman-Galley test, patients with an F-G score <7
were considered normal and those with an F-G score >9 were
considered hirsute. After fasting for 12 h, venous blood was drawn
from patients in each group on the 3rd-5th day of menstruation or
at a time when patients who suffered from abnormal menstruation or
amenorrhea showed no dominant follicles. Chemiluminescent enzyme
immunoassay was used to detect follicle stimulating hormone (FSH),
luteinizing hormone (LH), testosterone and estradiol levels, and a
Roche automatic biochemical analyzer was used for detecting the
total cholesterol (TC), triglycerides, high density lipoprotein
(HDL) and low density lipoprotein (LDL) of patients in both groups.
On the same day of blood drawing, the weight, height, waistline and
hipline of each patient were measured, recorded and used to
calculate the BMI and the waist-to-hip ratio (WHR) according to the
following formulas: BMI=weight (kg)/height (m); WHR=waistline
(cm)/hipline (cm). From the drawn venous blood, 2 ml was removed
combined with ethylenediaminetetraacetic acid (EDTA) for
anticoagulation, and preserved at a temperature of −80°C.
Gene extraction, amplification and
sequencing
A total of 2 ml of frozen EDTA anticoagulant was
thawed at room temperature. The total DNA of the drawn blood was
extracted using a DNA extraction kit (Omega Bio-Tek, Inc.,
Norcross, GA, USA) following the manufacturer's instructions.
Subsequently, SYBR Green polymerase chain reaction (PCR; ABI
Company, Oyster Bay, NY, USA) amplification and analysis of the
dissolving curve were carried out, with the amplification
conditions as follows: 10 µl reaction system, predenaturation at
95°C for 5 min, denaturation at 95°C for 15 sec, and annealing at
60°C for 30 sec; the cycle was repeated 30 times. The analysis
conditions were as follows: 95°C for 15 sec, 60°C for 60 sec, 95°C
for 15 sec, and 60°C for 15 sec. Next, 6% of the DNA samples was
selected for direct sequencing following the subsequent conditions
for the PCR: Predenaturation at 95°C for 5 min, 35 cycles of
denaturation at 95°C for 30 sec, annealing at 60°C for 30 sec, and
extension at 72°C for 7 min. After the PCR, analysis of the
dissolving curve was carried out, and when the dissolving curve
displayed a single peak, the PCR was determined as successful and
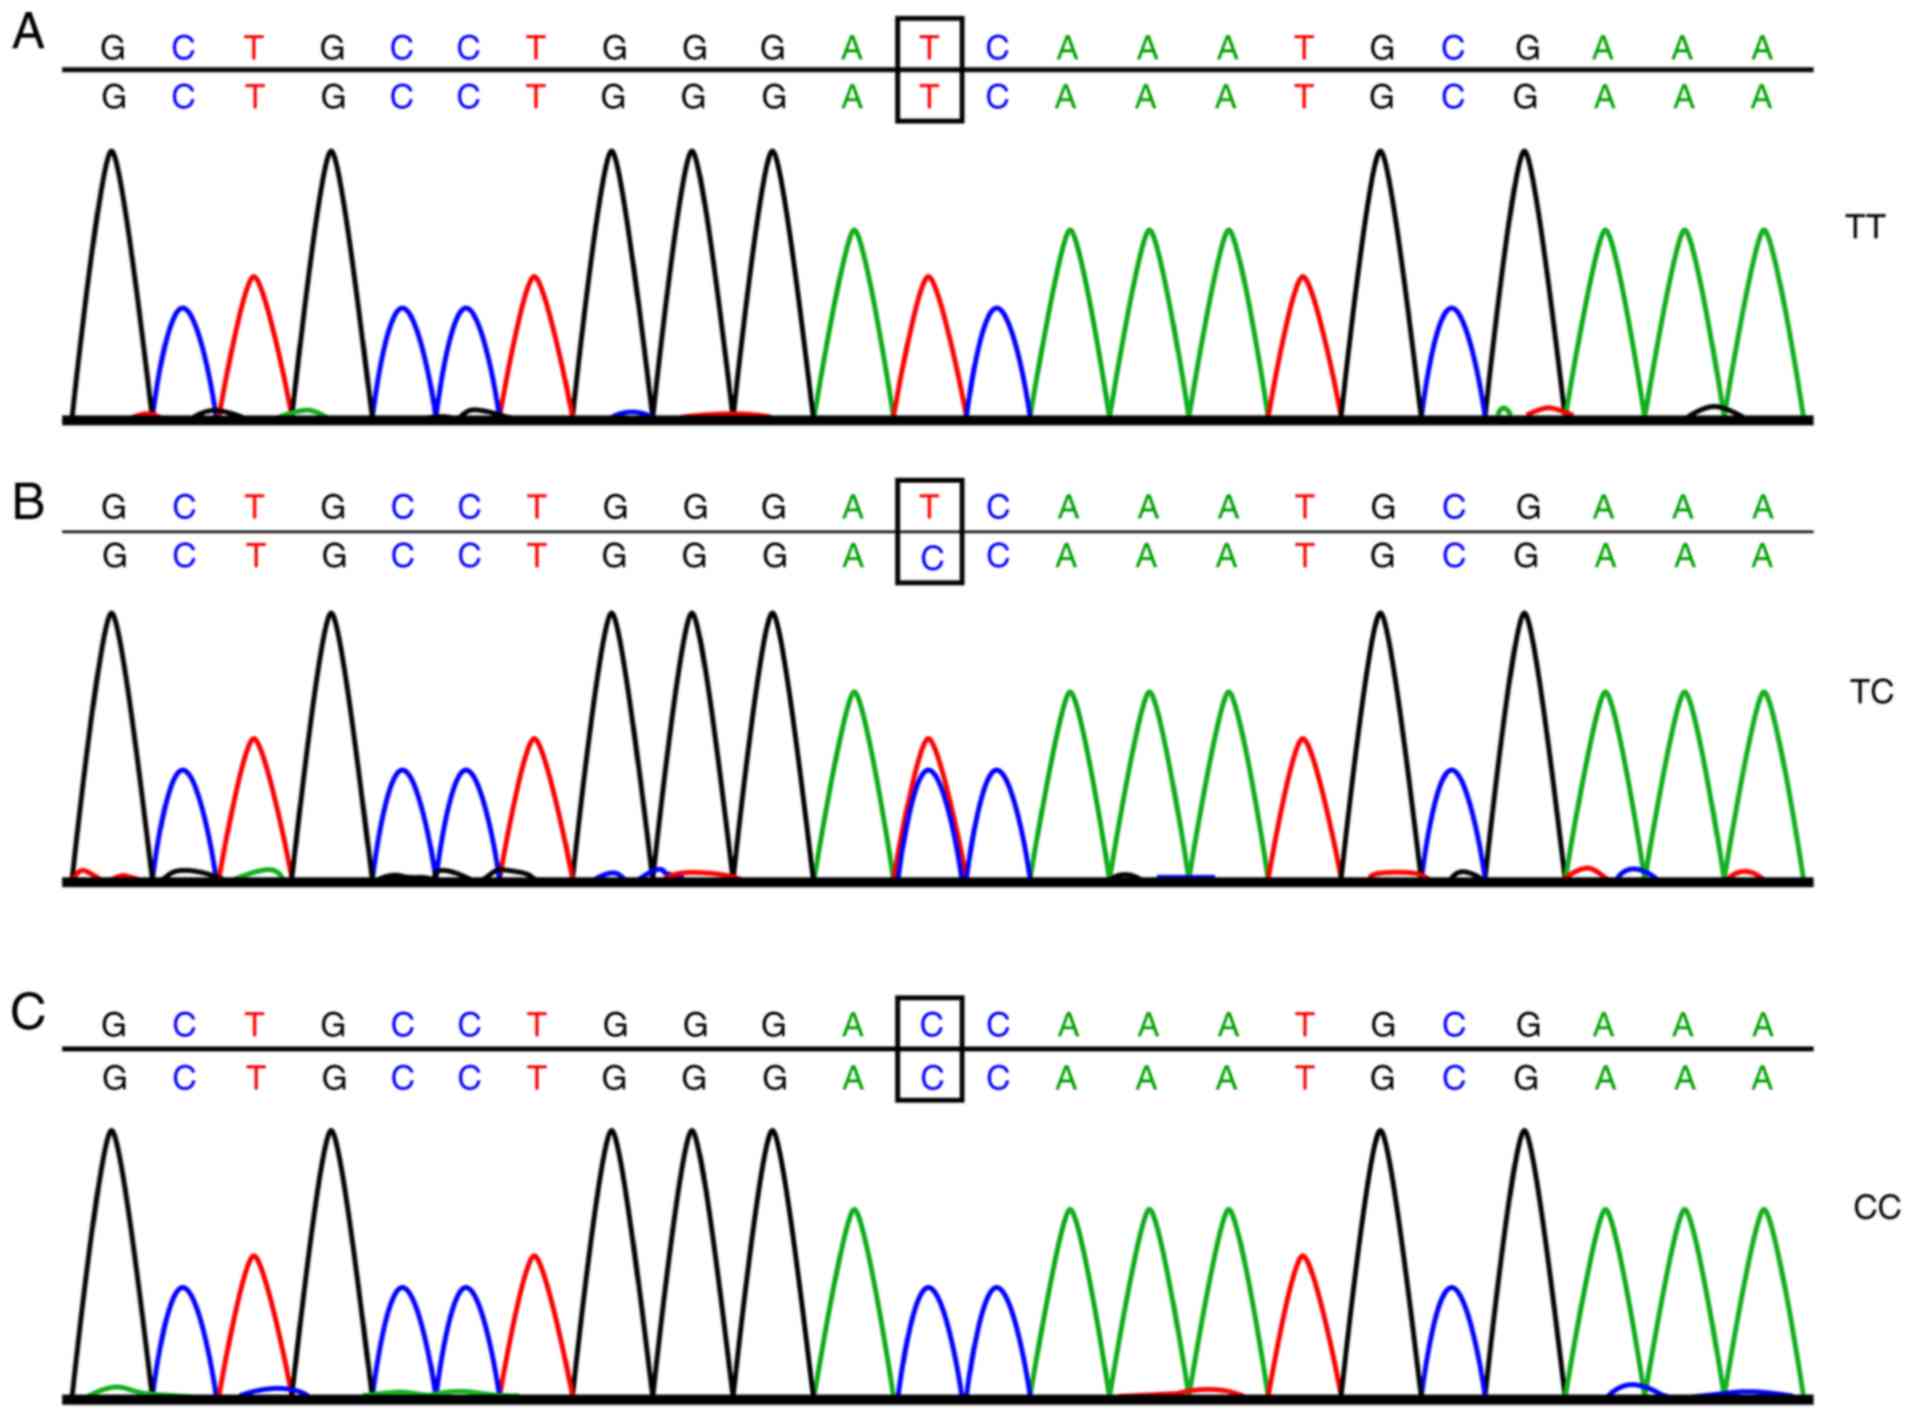
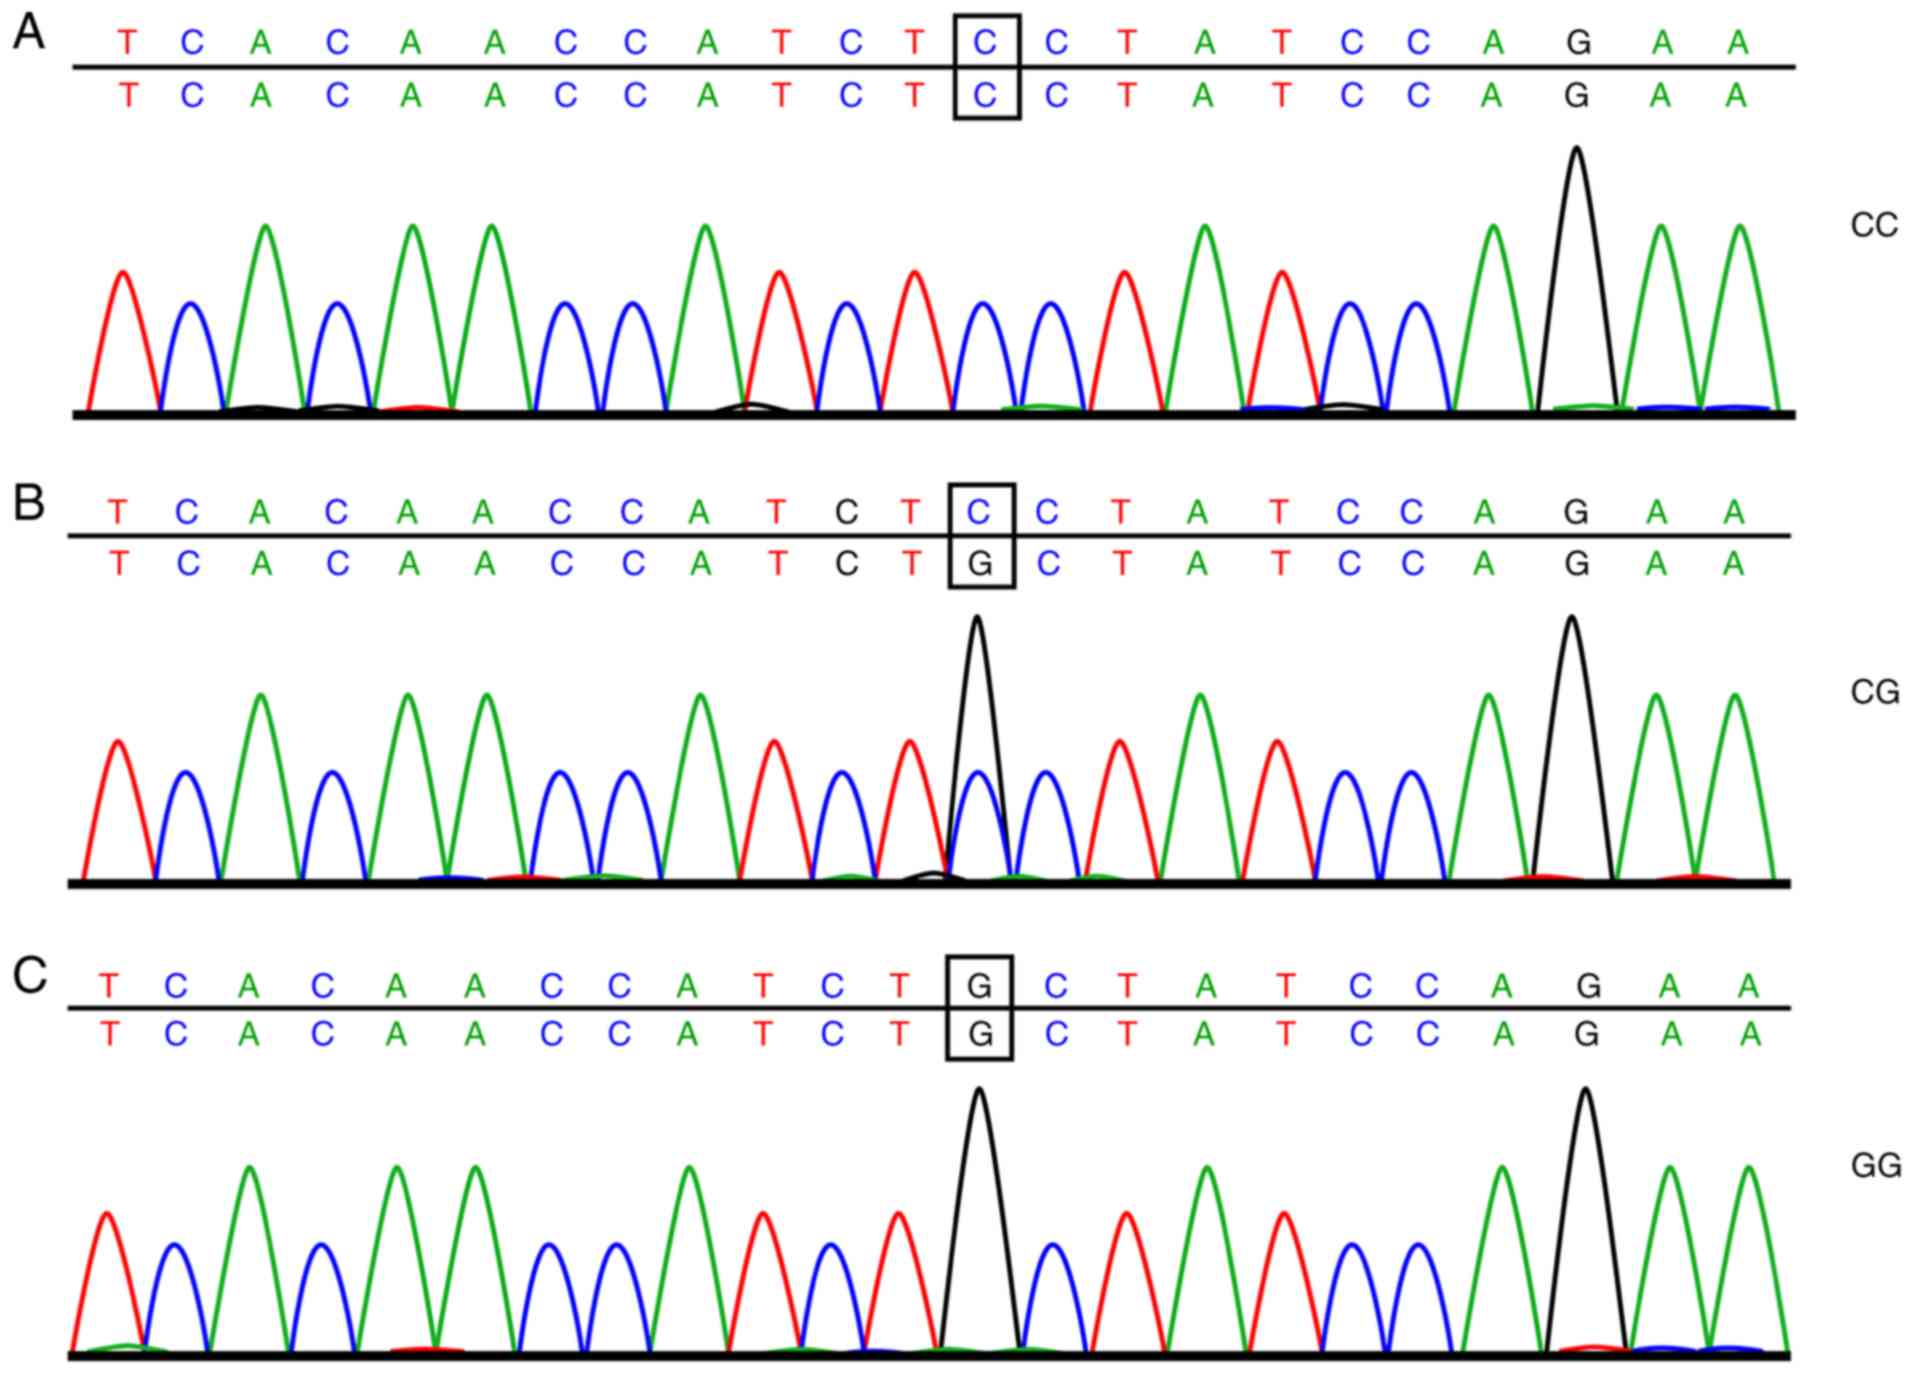
the purification and sequencing could be carried out. The sample
was purified by ethanol and then dissolved in 10 µl deionized
formamide to undergo sequencing. The results of the sample
sequencing are shown in Figs. 1
and 2. The amplification primer of
SYBR Green PCR and the sequencing primers were both synthesized by
Shanghai Bioengineering Technology Co., Ltd., (Shanghai, China)
with the detailed sequence displayed in Table I.
 | Table I.Primer sequences for the SNP
sites. |
Table I.
Primer sequences for the SNP
sites.
| Site |
| Primer sequence
(5′-3′) |
|---|
| rs2119882 | SYBR green PCR | Forward
CTCTCTGGGATGGGACTTTTCACC |
|
|
| Reverse
CGCGGGCAGGGCGGCCTAATCTCATTTCGCATTGGG |
|
|
| Reverse
TGCGGGCCTAATCTCATTTCGCATTGGA |
|
| Sequencing
primers | Forward
GCCTGCGTCCTCATCTTCAC |
|
|
| Reverse
GTTCCGATACACCGACAGGAT |
| rs10830963 | SYBR green PCR | Forward
GCCCCCAGTGATGCTAAGAATTCA |
|
|
| Reverse
GGCGGGCAGGCAGTTACTGGTTCTGGATCGC |
|
|
| Reverse
CGCGGGCAGGGCGGCAGGCAGTTACTGGTTCTGGATCGG |
|
| Sequencing
primers | Forward
GATCCAGGTGGGTAGAAGGTC |
|
|
| Reverse
CCCCTGCAAACTTCGTCCT |
Detection of endocrine hormone
Chemiluminescent enzyme immunoassay was used to
detect the levels of hormones, including FSH, LH, testosterone, and
estradiol, in patients with different genotypes in the PCOS groups.
In brief, the patient's sample and alkaline phosphate-coupled
hormone were incubated in a bead (Biolabs Technology Co., Ltd.,
Beijing, China)-containing reaction tube for 60 min at 37°C. Then
the unbounded enzyme-labeled conjugates and unbounded samples were
removed by centrifugation at 37°C at 225 × g for 10 min. Substrates
were added and the reaction tube was incubated at 37°C for 5 min.
The photon number was measured by photomultiplier tube (PTM). The
binding complex measured by a luminometer and the photon number are
inversely proportional to the concentration of hormones.
Detection of lipid metabolism
Fasting venous blood was drawn from patients in the
two groups in the early morning and was centrifuged at 1,610 × g
for 15 min to collect the serum. Levels of TC, TG, HDL, and LDL in
the serum of patients with different genotypes were measured in the
PCOS groups. Fasting blood lipid levels of patients were detected
using an automatic biochemical analyzer (AU640; Olympus, Hamburg,
Germany) and Olympus special test paper.
Detection of glycometabolism index and
homeostasis model assessment-insulin resistance index
(HOMA-IRI)
PCOS patients were administered an oral glucose
tolerance test (OGTT) to measure their glycometabolism. Three to
seven days before the experiment, PCOS patients stopped taking all
medication that could affect sugar tolerance (increase or decrease
in blood sugar), such as acyeterion, diuretics, β-adrenergic
blocking agents, phenytoin, and nicotinic acid. Three days before
the experiment, patients consumed more than 300 g of carbohydrate
in their diets. On the first day of the experiment, venous blood
was extracted from patients after fasting for 10–14 h. The glucose
oxidase method (using special reagents from Olympus) was used to
detect the plasma glucose content, and the chemiluminescence method
(Beckman Coulter, Inc., Brea, CA, USA) was used for plasma insulin
detection. Within 5 min of the blood draw, patients were asked to
consume 300 ml of glucose water containing 75 g glucose powder. At
0.5, 1, 2 and 3 h after glucose water consumption, venous blood was
extracted to measure its content of glucose and insulin. During the
entire experiment, the enrolled patients did not drink tea or
coffee, smoke, or do any strenuous exercise. The OGTT area under
the glucose curve and the area under the insulin curve were
calculated according to the trapezoid method (21): Area under the glucose curve = (G0 +
G180)/2 + G30 + G60 + G120 and the area under the insulin curve =
(S0 + S180)/2 + S30 + S60 + S120 (G0, G30, G60, and G120 were the
blood sugar values at different time points; S0, S30, S60, S120,
and S180 were the insulin values detected at different time
points). According to the levels of fasting blood sugar and fasting
insulin, the values of HOMA-IRI, pancreatic islet β-cell function
(HOMA-β%), and insulin sensitivity index (HOMA-ISI) were calculated
and compared (22). HOMA-IRI = FBG
× FINS/22.5; HOMA-ISI = 1/FBG × FINS; and HOMA-β% = 20 ×
FINS/(FBG-3.5).
Statistical analysis
Statistical analysis was performed using SPSS 21.0
software (IBM Corporation Armonk, NY, USA). Data are presented as
the mean ± standard deviation. Comparisons between two groups were
conducted by t-tests; comparisons among multiple groups were
assessed by one-way analysis of variance (ANOVA) for variance
analysis and significance test. Data are presented as ratios or
percentages and were compared and analyzed by the Chi-square test.
Logistic regression analysis was performed to analyze the risk
factors associated with the occurrence of PCOS and OB-PCOS, and
P<0.05 was considered to indicate a statistically significant
result.
Results
Comparison of general data among the
OB-PCOS, NOB-PCOS and control groups
A total of 215 patients were included in the control
group, with an average age of 25.1±3.2 years; there were 191
patients in the NOB-PCOS group, with a mean age of 25.3±3.7 years,
and there were 168 patients in the OB-PCOS group, with an average
age of 25.7±4.1 years. The above information shows that there was
no difference in age among the patients in the three groups
(P>0.05). Patients in the OB-PCOS and NOB-PCOS groups had more
cases of abnormal menstruation, hirsutism, acne, and infertility;
higher levels of LH, testosterone, and estradiol; and lower levels
of FSH than patients in the control group (P<0.05). Patients in
the OB-PCOS group exhibited higher BMIs, WHRs, TC, TG and LDL than
patients in the NOB-PCOS and control groups did, the lowest HDL
levels exhibited in the NOB-PCOS and control groups (P<0.05;
Table II).
| Table II.Higher levels of BMI, WHR, TC, TG and
LDL but a lower HDL level in the OB-PCOS group when compared with
these levels in the NOB-PCOS and control groups. |
Table II.
Higher levels of BMI, WHR, TC, TG and
LDL but a lower HDL level in the OB-PCOS group when compared with
these levels in the NOB-PCOS and control groups.
| Items | Control group
(n=215) | NOB-PCOS group
(n=191) | OB-PCOS group
(n=168) |
P-valuea |
P-valueb |
P-valuec |
|---|
| Age (years) | 25.1±3.2 | 25.3±3.7 | 25.7±4.1 | 0.559 | 0.109 | 0.332 |
| BMI
(kg/m2) | 21.02±2.14 | 21.16±2.08 | 25.05±2.49 | 0.505 | <0.001 | <0.001 |
| WHR | 0.73±0.05 | 0.74±0.06 | 0.77±0.12 | 0.068 | <0.001 | 0.003 |
| Abnormal
menstruation (yes/no) | 11/204 | 30/161 | 28/140 | <0.001 | <0.001 | 0.805 |
| Hairiness
(yes/no) | 17/198 | 92/99 | 80/88 | <0.001 | <0.001 | 0.917 |
| Acne (yes/no) | 25/190 | 104/87 | 91/77 | <0.001 | <0.001 | 0.957 |
| Infertile
(yes/no) | 12/203 | 31/160 | 29/139 | 0.001 | <0.001 | 0.794 |
| FSH (IU/l) | 7.50±2.12 | 5.44±1.67 | 5.36±1.62 | <0.001 | <0.001 | 0.646 |
| LH (IU/l) | 8.03±2.35 | 13.05±4.22 | 13.21±4.27 | <0.001 | <0.001 | 0.722 |
| Testosterone
(nmol/l) | 1.13±0.21 | 1.71±0.47 | 1.73±0.48 | <0.001 | <0.001 | 0.691 |
| Estradiol
(ng/ml) | 41.18±3.99 | 54.63±4.73 | 55.15±4.69 | <0.001 | <0.001 | 0.297 |
| TC (mmol/l) | 2.28±0.39 | 2.35±0.37 | 2.54±0.45 | 0.065 | <0.001 | <0.001 |
| TG (mmol/l) | 0.83±0.05 | 0.84±0.06 | 0.88±0.12 | 0.068 | <0.001 | <0.001 |
| HDL (mmol/l) | 1.57±0.23 | 1.54±0.24 | 1.32±0.22 | 0.199 | <0.001 | <0.001 |
| LDL (mmol/l) | 1.25±0.11 | 1.27±0.19 | 1.67±0.42 | 0.189 | <0.001 | <0.001 |
rs2119882 C allele carrier or
rs10830963 G allele carrier has increased risk for the occurrence
of PCOS
A goodness-of-fit test was conducted for the
Hardy-Weinberg equilibrium test, and the result showed that the
genotype distribution of rs2119882 in the MTNR1A gene and
rs10830963 in the MTNR1B gene was in line with Hardy-Weinberg
equilibrium (P>0.05). The research samples used were random
samples with representative characteristics of the group.
The genotype of rs2119882 and the frequency
distribution of allele genes were notably different among the
control, NOB-PCOS and OB-PCOS groups. The CC genotype of OB-PCOS
patients displayed a higher percentage than that of the NOB-PCOS
patients (42.26 vs. 28.80%), and the TC + CC genotype of NOB-PCOS
patients was higher than that of the patients in the control group
(79.06 vs. 67.91%), which revealed that carrying a C allele in the
human gene can possibly increase the risk of PCOS [odds ratio
(OR)=1.411; 95% confidence interval (CI)=1.070–1.860, P=0.015] and
increase the risk of PCOS patients developing obesity (OR=1.442,
95% CI=1.069–1.945, P=0.016). The genotype of rs10830963 and the
frequency distribution of allele genes in the control and NOB-PCOS
groups were significantly different, with patients in the NOB-PCOS
group exhibiting a markedly higher ratio of the GG genotype and G
allele than patients in the control group (16.23 vs. 4.65% and
39.01 vs. 25.81%, respectively), thus showing that patients
carrying the G allele are at greater risk of developing PCOS
(OR=1.838, 95% CI=1.364–2.476, P<0.001). In addition, it was
shown that the genotype of rs10830963 and the frequency
distribution of allele genes in the NOB-PCOS and OB-PCOS group were
not significantly different (P>0.05; Tables III and IV).
| Table III.Comparisons of genotype and allele
frequency distribution in rs2119882 of MTNR1A and rs10830963
of MTNR1B between the NOB-PCOS group and the control
group. |
Table III.
Comparisons of genotype and allele
frequency distribution in rs2119882 of MTNR1A and rs10830963
of MTNR1B between the NOB-PCOS group and the control
group.
| SNP | Control group
(n=215) | NOB-PCOS group
(n=191) | P-value | OR (95% CI) |
|---|
| rs2119882 |
|
|
|
|
| TT | 69 (32.09) | 40 (20.94) | Ref |
|
| TC | 97 (45.12) | 96 (50.26) | 0.029a | 1.707
(1.055–2.762) |
| CC | 49 (22.79) | 55 (28.80) | 0.018a | 1.936
(1.120–3.349) |
|
TC+CC | 146 (67.91) | 151 (79.06) | 0.011a | 1.784
(1.136–2.801) |
| T | 235 (54.65) | 176 (46.07) | Ref |
|
| C | 195 (43.35) | 206 (53.93) | 0.015a | 1.411
(1.070–1.860) |
| rs10830963 |
|
|
|
|
| CC | 114 (53.02) | 73 (38.22) | Ref |
|
| CG | 91 (42.33) | 87 (45.55) | 0.058 | 1.493
(0.985–2.262) |
| GG | 10 (4.65) | 31 (16.23) |
<0.001a | 4.841
(2.239–10.470) |
|
CG+GG | 101 (46.98) | 118 (61.78) | 0.003a | 1.824
(1.228–2.712) |
| C | 319 (74.19) | 233 (60.99) | Ref |
|
| G | 111 (25.81) | 149 (39.01) |
<0.001a | 1.838
(1.364–2.476) |
| Table IV.Comparisons of genotype and allele
frequency distribution in rs2119882 of MTNR1A and rs10830963
of MTNR1B between the NOB-PCOS group and the OB-PCOS
group. |
Table IV.
Comparisons of genotype and allele
frequency distribution in rs2119882 of MTNR1A and rs10830963
of MTNR1B between the NOB-PCOS group and the OB-PCOS
group.
| SNP | NOB-PCOS group
(n=191) | OB-PCOS group
(n=168) | P-value | OR (95% CI) |
|---|
| rs2119882 |
|
|
|
|
| TT | 40 (20.94) | 28 (16.67) | Ref |
|
| TC | 96 (50.26) | 69 (41.07) | 0.928 | 1.027
(0.579–1.822) |
| CC | 55 (28.80) | 71 (42.26) | 0.044a,b | 1.844
(1.014–3.353) |
| TC +
CC | 151 (79.06) | 140 (83.33) | 0.302 | 1.325
(0.776–2.262) |
| T | 176 (46.07) | 125 (37.20) | Ref |
|
| C | 206 (53.93) | 211 (62.80) | 0.016a,b | 1.442
(1.069–1.945) |
| rs10830963 |
|
|
|
|
| CC | 73 (38.22) | 52 (30.95) | Ref |
|
| CG | 87 (45.55) | 82 (48.81) | 0.239 | 1.323
(0.829–2.110) |
| GG | 31 (16.23) | 34 (20.24) | 0.159 | 1.540
(0.843–2.814) |
| CG +
GG | 118 (61.78) | 116 (69.05) | 0.149 | 1.380
(0.890–2.140) |
| C | 233 (60.99) | 186 (55.36) | Ref |
|
| G | 149 (39.01) | 150 (44.64) | 0.126 | 1.261
(0.937–1.698) |
Differences in endocrine index and
index of lipid metabolism between NOB-PCOS and OB-PCOS patients
carrying the TC + CC genotype
NOB-PCOS patients carrying the TC + CC genotype
presented significantly decreased FSH levels; notably increased
levels of LH, testosterone and estradiol (P<0.05); and
nonsignificant differences in glycometabolism, lipid metabolism and
insulin homeostasis indices when compared with the NOB-PCOS
patients carrying the TT genotype in the rs2119882 gene
(P>0.05). Compared with patients carrying the CC genotype in
rs10830963, patients with the CG + GG genotype demonstrated no
significant differences in any of the above indices (all P>0.05;
Table V).
| Table V.NOB-PCOS patients carrying the TC +
CC genotype have decreased FSH level and significantly increased
levels of LH, testosterone and estradiol. |
Table V.
NOB-PCOS patients carrying the TC +
CC genotype have decreased FSH level and significantly increased
levels of LH, testosterone and estradiol.
|
| rs2119882 | rs10830963 |
|---|
|
|
|
|
|---|
|
| TT | TC + CC | P-value | CC | CG + GG | P-value |
|---|
| FSH (IU/l) | 5.92±1.96 | 5.31±1.57 | 0.039a | 5.34±1.72 | 5.50±1.64 | 0.521 |
| LH (IU/l) | 10.53±4.89 | 13.72±3.77 |
<0.001a | 12.98±3.88 | 13.09±4.43 | 0.862 |
| Testosterone
(nmol/l) | 1.56±0.48 | 1.75±0.46 | 0.022a | 1.66±0.50 | 1.74±0.45 | 0.254 |
| Estradiol
(ng/ml) | 50.21±3.86 | 55.80±4.23 |
<0.001a | 55.45±4.49 | 54.12±4.82 | 0.059 |
| TC (mmol/l) | 2.41±0.38 | 2.33±0.37 | 0.228 | 2.37±0.36 | 2.34±0.38 | 0.589 |
| TG (mmol/l) | 0.85±0.07 | 0.84±0.06 | 0.367 | 0.85±0.06 | 0.84±0.06 | 0.264 |
| HDL (mmol/l) | 1.51±0.24 | 1.55±0.24 | 0.349 | 1.52±0.25 | 1.55±0.23 | 0.398 |
| LDL (mmol/l) | 1.29±0.15 | 1.27±0.20 | 0.556 | 1.28±0.18 | 1.27±0.19 | 0.719 |
| Glucose
(mmol/l) |
|
|
|
|
|
|
| OGTT 0
min | 4.76±0.37 | 4.74±0.42 | 0.784 | 4.73±0.38 | 4.75±0.43 | 0.745 |
| OGTT 30
min | 7.81±1.52 | 7.85±1.56 | 0.885 | 7.61±1.59 | 7.98±1.51 | 0.109 |
| OGTT 60
min | 9.25±1.33 | 9.33±1.51 | 0.761 | 9.27±1.42 | 9.33±1.50 | 0.784 |
| OGTT120
min | 6.70±1.46 | 6.42±1.56 | 0.308 | 6.35±1.53 | 6.56±1.55 | 0.362 |
| OGTT
180 min | 4.90±1.37 | 5.09±1.51 | 0.472 | 5.09±1.49 | 5.03±1.48 | 0.786 |
| Insulin (mU/l) |
|
|
|
|
|
|
| OGTT 0
min | 8.37±1.56 | 8.70±1.42 | 0.202 | 8.82±1.22 | 8.51±1.57 | 0.152 |
| OGTT 30
min | 59.37±25.42 | 60.84±17.85 | 0.675 | 60.10±16.92 | 60.79±21.17 | 0.814 |
| OGTT 60
min | 66.43±21.13 | 74.01±22.47 | 0.056 | 76.37±23.44 | 69.97±21.39 | 0.054 |
| OGTT
120 min | 56.04±1.46 | 56.69±13.83 | 0.767 | 57.50±13.39 | 55.96±13.69 | 0.447 |
| OGTT
180 min | 24.75±1.37 | 25.75±9.91 | 0.526 | 24.67±10.03 | 26.08±9.39 | 0.327 |
| HOMA-IRI | 1.57±0.45 | 1.59±0.37 | 0.772 | 1.61±0.39 | 1.58±0.39 | 0.606 |
| HOMA-β% | 3.07±0.57 | 3.03±0.62 | 0.713 | 3.05±0.63 | 3.03±0.60 | 0.826 |
| HOMA-ISI | 162.20±37.85 | 171.09±36.75 | 0.178 | 171.92±8.29 | 167.57±36.34 | 0.432 |
Compared with the OB-PCOS patients carrying the TT
genotype in rs2119882, OB-PCOS patients carrying the TC + CC
genotype had no significantly different endocrine indices (FSH, LH,
testosterone, and estradiol) or indices of lipid metabolism (TC,
TG, LDL and HDL) (P>0.05); increased fasting glucose levels and
insulin levels from the OGTT at 30, 60 and 120 min and OGTT area
under the glucose curve (P<0.05); no significantly different
glucose levels from the OGTT at 30, 60, 120 and 180 min
(P>0.05); markedly increased HOMA-IRI; and significantly
decreased levels of HOMA-β% and HOMA-ISI (P<0.05). Compared with
patients carrying the CC genotype in rs10830963, patients with the
CG + GG genotype had no significantly different endocrine indices
(FSH, LH, testosterone, and estradiol) or indices of lipid
metabolism (TC, TG, LDL and HDL) (P>0.05), with an increased
HOMA-IRI level and significantly decreased levels of HOMA-β% and
HOMA-ISI (all P<0.05; Table
VI).
| Table VI.OB-PCOS patients carrying the TC + CC
genotype have increased fasting glucose level, insulin level, OGTT
area under the glucose curve, HOMA-IRI, and decreased levels of
HOMA-β% and HOMA-ISI. |
Table VI.
OB-PCOS patients carrying the TC + CC
genotype have increased fasting glucose level, insulin level, OGTT
area under the glucose curve, HOMA-IRI, and decreased levels of
HOMA-β% and HOMA-ISI.
|
| rs2119882 | rs10830963 |
|---|
|
|
|
|
|---|
|
| TT | TC + CC | P-value | CC | CG + GG | P-value |
|---|
| FSH (IU/l) | 5.47±1.52 | 5.34±1.64 | 0.699 | 5.30±1.48 | 5.39±1.68 | 0.739 |
| LH (IU/l) | 12.23±4.17 | 13.41±4.28 | 0.183 | 12.32±4.87 | 13.61±3.93 | 0.07 |
| Testosterone
(nmol/l) | 1.67±0.44 | 1.74±0.49 | 0.484 | 1.80±0.56 | 1.70±0.44 | 0.214 |
| Estradiol
(ng/ml) | 54.58±5.70 | 55.26±4.48 | 0.486 | 55.45±4.49 | 55.14±4.65 | 0.969 |
| TC (mmol/l) | 2.63±0.36 | 2.52±0.47 | 0.244 | 2.53±0.41 | 2.55±0.47 | 0.791 |
| TG (mmol/l) | 0.90±0.14 | 0.87±0.12 | 0.242 | 0.90±0.16 | 0.87±0.11 | 0.16 |
| HDL (mmol/l) | 1.36±0.20 | 1.31±0.22 | 0.267 | 1.33±0.22 | 1.31±0.22 | 0.587 |
| LDL (mmol/l) | 1.57±0.47 | 1.69±0.41 | 0.169 | 1.68±0.47 | 1.67±0.40 | 0.888 |
| Glucose
(mmol/l) |
|
|
|
|
|
|
| OGTT 0
min | 4.66±0.80 | 5.01±0.56 | 0.006a | 5.04±0.56 | 4.91±0.64 | 0.208 |
| OGTT 30
min | 9.27±1.33 | 9.58±1.69 | 0.362 | 9.59±1.68 | 9.50±1.63 | 0.744 |
| OGTT 60
min | 9.44±1.56 | 9.92±1.47 | 0.12 | 9.67±1.54 | 9.91±1.47 | 0.337 |
| OGTT
120 min | 7.74±1.40 | 7.31±1.54 | 0.173 | 7.28±1.71 | 7.42±1.43 | 0.582 |
| OGTT
180 min | 5.50±1.30 | 5.22±1.31 | 0.303 | 5.23±1.17 | 5.29±1.37 | 0.784 |
| Insulin (mU/l) |
|
|
|
|
|
|
| OGTT 0
min | 8.35±2.08 | 9.78±1.67 |
<0.001a | 9.71±1.82 | 9.47±1.82 | 0.431 |
| OGTT 30
min | 60.68±23.77 | 74.47±23.42 | 0.005a | 71.44±23.41 | 72.50±24.31 | 0.792 |
| OGTT 60
min | 67.06±29.84 | 87.94±22.92 |
<0.001a | 85.67±23.57 | 83.92±26.18 | 0.68 |
| OGTT
120 min | 58.88±14.53 | 74.21±14.52 |
<0.001a | 74.53±14.99 | 70.37±15.71 | 0.109 |
| OGTT
180 min | 28.96±10.31 | 29.98±8.65 | 0.582 | 28.20±8.93 | 30.53±8.86 | 0.118 |
| HOMA-IRI | 2.34±0.57 | 2.73±0.56 | 0.001a | 2.39±0.58 | 2.79±0.54 |
<0.001a |
| HOMA-β% | 2.57±0.43 | 2.20±0.45 |
<0.001a | 2.46±0.52 | 2.17±0.41 |
<0.001a |
| HOMA-ISI | 97.24±15.95 | 85.22±13.39 |
<0.001a | 93.64±14.84 | 84.34±13.46 |
<0.001a |
Haplotype TC decreases the occurrence
of PCOS in normal individuals
SHEs is software (http://analysis.bio-x.cn/myAnalysis.php) was used to
analyze the rs2119882 site in the MTNR1A gene and the rs10830963
site in the MTNR1B gene concerning their linkage disequilibrium and
haplotype. As shown in the results, there was rather intensive
linkage disequilibrium between the two sites, and the haplotype
analysis was carried out. The TC haplotype was found to be able to
decrease the risk of PCOS in normal individuals (OR=0.709, 95%
CI=0.538–0.935, P=0.015), while the CG haplotype increased the risk
of PCOS in normal individuals (OR=1.838, 95% CI=1.364–2.476,
P<0.001; Table VII). Among
all the three haplotypes from rs2119882 and rs10830963, the TC
haplotype decreased the risk of PCOS in normal individuals
(OR=0.693, 95% CI=0.514–0.935, P=0.016), with the other three
haplotypes demonstrating no relationship with the occurrence of
OB-PCOS (Table VIII).
| Table VII.Haplotype analysis of rs2119882 site
of the MTNR1A gene and rs10830963 site of the MTNR1B gene in
the control and NOB-PCOS groups. |
Table VII.
Haplotype analysis of rs2119882 site
of the MTNR1A gene and rs10830963 site of the MTNR1B gene in
the control and NOB-PCOS groups.
| Haplotype | Control group
(n=215) | NOB-PCOS group
(n=191) | χ2 | P-value | OR (95% CI) |
|---|
| CC | 84 (0.195) | 57 (0.149) | 3.001 | 0.083 | 0.722
(0.500–1.045) |
| CG | 111 (0.258) | 149 (0.390) | 16.172 | <0.001 | 1.838
(1.364–2.476) |
| TC | 235 (0.547) | 176 (0.461) | 5.955 | 0.015 | 0.709
(0.538–0.935) |
| Table VIII.Haplotype analysis of rs2119882 site
of the MTNR1A gene and rs10830963 site of the MTNR1B
gene in OB-PCOS and NOB-PCOS patients. |
Table VIII.
Haplotype analysis of rs2119882 site
of the MTNR1A gene and rs10830963 site of the MTNR1B
gene in OB-PCOS and NOB-PCOS patients.
| Haplotype | NOB-PCOS group
(n=136) | OB-PCOS group
(n=108) | χ2 | P-value | OR (95% CI) |
|---|
| CC | 57 (0.149) | 61 (0.182) | 1.361 | 0.243 | 1.265
(0.852–1.878) |
| CG | 149 (0.390) | 150 (0.446) | 2.338 | 0.126 | 1.261
(0.937–1.698) |
| TC | 176 (0.461) | 125 (0.372) | 5.778 | 0.016 | 0.693
(0.514–0.935) |
The rs2119882 TT genotype and the
rs10830963 CC genotype are crucial protective factors for PCOS
Dichotomous logistic regression analysis was
conducted to analyze the risk factors for NOB-PCOS and OB-PCOS,
including BMI, WHR, FSH, LH, testosterone, estradiol, TC, TG, HDL,
LDL, abnormal menstruation, hirsutism, acne, infertility and the
polymorphism of the rs2119882 site and the rs10830963 site. The
results showed that FSH, LH, testosterone, estradiol, abnormal
menstruation, and polymorphisms at the rs2119882 and rs10830963
sites were significantly correlated with PCOS occurrence, among
which the TT genotype in rs2119882 and the CC genotype in
rs10830963 were important protective factors for PCOS, and
increased levels of LH, testosterone, estradiol and abnormal
menstruation were key risk factors for PCOS (all P<0.05;
Table IX).
| Table IX.TT genotype in the rs2119882 site and
the CC genotype in the rs10830963 site are protective for NOB-PCOS
but increased levels of LH, testosterone and estradiol 2 are risk
factors for NOB-PCOS. |
Table IX.
TT genotype in the rs2119882 site and
the CC genotype in the rs10830963 site are protective for NOB-PCOS
but increased levels of LH, testosterone and estradiol 2 are risk
factors for NOB-PCOS.
|
|
|
|
|
|
| 95% CI for Exp
(B) |
|---|
|
|
|
|
|
|
|
|
|---|
| Factor | B | SE | Wald | Sig. | Exp (B) | Lower | Upper |
|---|
| FSH | −0.528 | 0.198 | 7.128 | 0.008 | 0.59 | 0.4 | 0.869 |
| LH | 0.269 | 0.115 | 5.439 | 0.02 | 1.308 | 1.044 | 1.639 |
| Testosterone | 3.33 | 1.262 | 6.966 | 0.008 | 27.928 | 2.356 | 331.042 |
| Estradiol | 1.074 | 0.224 | 22.966 | <0.001 | 2.928 | 1.887 | 4.542 |
| Irregular
period | 2.819 | 1.358 | 4.308 | 0.038 | 16.752 | 1.17 | 239.84 |
| rs2119882 | 2.291 | 0.9 | 6.473 | 0.011 | 9.885 | 1.692 | 57.733 |
| rs10830963 | −1.975 | 0.875 | 5.097 | 0.024 | 0.139 | 0.025 | 0.771 |
Values of BMI, WHR, TC, TG, HDL, and LDL along with
the polymorphism of the rs2119882 site were notably associated with
OB-PCOS. Specifically, high values for BMI, WHR, TC, TG and LDL
were significant risk factors for OB-PCOS, and the TT genotype at
the rs2119882 site was the key protective factor for OB-PCOS (all
P<0.05; Table X).
| Table X.Increased levels of BMI, WHR, TC, TG
and LDL are risk factors for OB-PCOS occurrence while the TT
genotype in the rs2119882 site is a protective factor for
OB-PCOS. |
Table X.
Increased levels of BMI, WHR, TC, TG
and LDL are risk factors for OB-PCOS occurrence while the TT
genotype in the rs2119882 site is a protective factor for
OB-PCOS.
|
|
|
|
|
|
| 95% CI for exp
(B) |
|---|
|
|
|
|
|
|
|
|
|---|
| Factor | B | SE | Wald | Sig. | Exp (B) | Lower | Upper |
|---|
| BMI | 0.198 | 0.076 | 6.822 | 0.009 | 1.219 | 1.051 | 1.415 |
| WHR | 4.937 | 2.178 | 5.139 | 0.023 | 139.374 | 1.951 | 9,954.773 |
| TC | 2.11 | 0.452 | 21.749 | <0.001 | 8.244 | 3.397 | 20.008 |
| TG | 5.747 | 2.103 | 7.467 | 0.006 | 313.363 | 5.078 | 19,336.553 |
| HDL | −5.313 | 0.81 | 42.975 | <0.001 | 0.005 | 0.001 | 0.024 |
| LDL | 5.303 | 0.687 | 59.579 | <0.001 | 201.032 | 52.289 | 772.893 |
| rs2119882 | −0.807 | 0.389 | 4.3 | 0.038 | 0.446 | 0.208 | 0.957 |
Discussion
Polycystic ovary syndrome (PCOS) is one of the most
prevalent endocrinopathies in women of child-bearing age and is
characterized by hyperinsulinemia, hyperandrogenemia and disordered
adipokine secretion of adipose tissue (23). Generally, efficient therapies for
PCOS include the use of hormonal treatments, the intake of oral
contraceptives and other medicines, and the performance of hormone
replacement, yet all of these treatments have been found to result
in certain side effects such as increasing the severity of diabetes
and changing the patient's lifestyle (24). For this reason, developing a better
understanding of the risk factors for PCOS as well as trying to
determine more efficient and safer methods to treat and diagnose
PCOS is urgent. Therefore, the present study was conducted to
ascertain whether polymorphisms of the MTNR genes would be
protective or harmful for obese (OB)-PCOS patients.
From the comparison of the general measurement data
between patients in the OB-PCOS and NOB-PCOS group, it was noted
that abnormal menstruation, hirsutism, acne, infertility and
elevated levels of LH, testosterone and estradiol were biomarkers
for PCOS. As one of the causes for irregular menstruation, PCOS is
also characterized by its high occurrence (25). Previous research has demonstrated
that women with PCOS are more likely to suffer from hirsutism and
acne and are even at greater risk of developing diabetes and cancer
(26). Previous studies have also
confirmed the relationship between BMI, LH, FSH and the clinical
symptoms of PCOS patients (27,28).
It is possible that women diagnosed with PCOS may present increased
levels of estradiol and testosterone when compared with
eumenorrheic ovulatory women (29). Our study also revealed that
patients in the OB-PCOS group had significantly higher values for
BMI, WHR, TC, TG and LDL but lower HDL than women in the NOB-PCOS
group. Njelekela et al discovered in their study that obese
women would likely have notably higher mean serum TG, TC, and LDL-C
and an increased prevalence of dyslipidemia (30). In addition, BMI, WHR and waist
circumference were known as three important identifiers of PCOS
patients (31). Additionally,
another study demonstrated that PCOS patients demonstrate the most
prevalent MS components such as central obesity, decreased HDL-C,
and increased TG, BP and fasting glucose levels, which was
consistent with our results (32).
Melatonin is the essential hormone secreted by the pineal gland in
both humans and mammals and plays a critical part in regulating
circadian rhythm, sleep and reproduction (33). It is known that epidermal melatonin
production varies with sex, age, and race and that the melatonin
produced locally could regulate the peripheral clock, thus
influencing melanocytic activities (34). In mammals, melatonin metabolism is
cell type-dependent and could occur directly at the production
site; the production of 6-hydroxymelatonin is relatively high in
normal epidermal melanocytes (35).
In our study, the OB-PCOS group was found to have a
higher percentage of CC genotypes than the NOB-PCOS group, while
the carrying of the C allele was observed to increase the
occurrence of PCOS; thus, OB-PCOS patients have a higher PCOS
incidence due to the CC genotype. In a recent study, MTNR1A
polymorphisms (rs2119882, rs13140012, rs6553010) were correlated
with a higher risk of oral cancer (36). CC genotype carriers were discovered
to have higher metabolic and clinical risk factors than did
carriers of the TC and TT genotypes, thus making the rs2119882 an
important risk factor for OB-PCOS (37). In addition, compared with patients
carrying the TT genotype at the rs2119882 site, OB-PCOS patients
carrying the CT + CC genotype had increased fasting glucose levels,
insulin levels, and HOMA-IRI and decreased HOMA-β% and HOMA-ISI. As
mentioned above, the CC genotype carrier was responsible for PCOS
occurrence. A recent study has demonstrated that rs2119882 of
MTNR1A was correlated with schizophrenia in a recessive model (CC
vs. TT/TC, P=0.013, OR=1.69, 95% CI=1.12–2.55) (38). The increased HOMA-IR index was
associated with IL28b, with 68% genotype CC and 45% genotype CT/TT,
making the relationship responsible for sustained viral response
(39). Decreased HOMA-β% and
HOMA-ISI and increased HOMA-IR were detected in cases of
pregnancy-induced hypertension as a result of insulin resistance
(40). Symptoms of insulin
resistance, β-cell dysfunction and hyperinsulinemia are commonly
noted in PCOS patients (41),
which could better explain the altered levels of HOMA-IR, HOMA-β%,
and HOMA-ISI. Patients with the TT genotype in rs2119882 and the CC
genotype in rs10830963 displayed significant effects reducing PCOS.
Subjects in the Mulao population carrying the TT genotype in
rs2144300 exhibited lower TG levels (42), which could be beneficial for PCOS
treatment. PCOS patients carrying the CG and GG genotypes in
rs10830963 had increased HOMA-IR, plasma glucose levels and AUC
from the OGTT compared to patients with the CC genotype, thus
providing evidence for the protective effect of CC in rs10830963
for PCOS (43).
Taken together, our findings in the present study
provide evidence for the relationship between a polymorphism of
melatonin receptor genes (rs2119882 and rs10830963) and lipid
metabolism disorder in PCOS patients. Specifically, the CC genotype
in rs2119882 and the TC + CC genotype in OB-PCOS patients could
increase the occurrence of PCOS; the higher values for BMI, WHR,
TC, TG, and LDL were risk factors for OB-PCOS, and TT in rs2119882
and CC in rs10839063 were protective factors for OB-PCOS. In
regards to the limitations of PCOS diagnosis and therapy, more
studies need to be carried out to better our understanding of PCOS
and determine more efficient PCOS therapies. In addition, due to
limited time and energy, we failed to explore the interaction
between genetic polymorphisms of melatonin and serum melatonin
levels, which is expected to be investigated in the near future.
Additionally, the therapeutic or protective effects of melatonin or
its metabolites remain an important clinical challenge. Thus, it is
necessary to determine the role of the membrane bound receptors for
melatonin metabolites, which is a difficult task due to the similar
protective activities of melatonin metabolites on melatonin.
Acknowledgements
Not applicable.
Funding
No funding was received.
Availability of data and materials
All data generated or analyzed during the present
study are included in this published article.
Authors' contributions
XHX and LCK conceived and designed the study. XHX
and HMW performed the experiments and collected the data. LCK and
HMW wrote the paper and interpreted the data. CMB and XCS obtained
and validated the results them, reviewed them and contributed to
discussions. All authors contributed to revision of the manuscript,
and read and approved the manuscript and agree to be accountable
for all aspects of the work in ensuring that questions related to
the accuracy or integrity of any part of the work are appropriately
investigated and resolved.
Ethics approval and consent to
participate
The present study was approved by the Ethics
Committee of Dongying People's Hospital, and all experimental
procedures were conducted under the strict supervision of
committee. Written informed consent was obtained from all patients
or their parents or guardians.
Patient consent for publication
Not applicable.
Competing interests
The authors state that they have no competing
interests.
References
|
1
|
Swaroop A, Jaipuriar AS, Gupta SK, Bagchi
M, Kumar P, Preuss HG and Bagchi D: Efficacy of a novel fenugreek
seed extract (Trigonella foenum-graecum, Furocyst) in polycystic
ovary syndrome (PCOS). Int J Med Sci. 12:825–831. 2015. View Article : Google Scholar : PubMed/NCBI
|
|
2
|
March WA, Moore VM, Willson KJ, Phillips
DI, Norman RJ and Davies MJ: The prevalence of polycystic ovary
syndrome in a community sample assessed under contrasting
diagnostic criteria. Hum Reprod. 25:544–551. 2010. View Article : Google Scholar : PubMed/NCBI
|
|
3
|
Goodarzi MO, Dumesic DA, Chazenbalk G and
Azziz R: Polycystic ovary syndrome: Etiology, pathogenesis and
diagnosis. Nat Rev Endocrinol. 7:219–231. 2011. View Article : Google Scholar : PubMed/NCBI
|
|
4
|
Stener-Victorin E, Holm G, Janson PO,
Gustafson D and Waern M: Acupuncture and physical exercise for
affective symptoms and health-related quality of life in polycystic
ovary syndrome: Secondary analysis from a randomized controlled
trial. BMC Complement Altern Med. 13:1312013. View Article : Google Scholar : PubMed/NCBI
|
|
5
|
Costello MF, Misso ML, Wong J, Hart R,
Rombauts L, Melder A, Norman RJ and Teede HJ: The treatment of
infertility in polycystic ovary syndrome: A brief update. Aust N Z
J Obstet Gynaecol. 52:400–403. 2012. View Article : Google Scholar : PubMed/NCBI
|
|
6
|
Wehr E, Pieber TR and Obermayer-Pietsch B:
Effect of vitamin D3 treatment on glucose metabolism and menstrual
frequency in polycystic ovary syndrome women: A pilot study. J
Endocrinol Invest. 34:757–763. 2011.PubMed/NCBI
|
|
7
|
Gourgari E, Spanakis E and Dobs AS:
Pathophysiology, risk factors, and screening methods for
prediabetes in women with polycystic ovary syndrome. Int J Womens
Health. 8:381–387. 2016. View Article : Google Scholar : PubMed/NCBI
|
|
8
|
Li C, Shi Y, You L, Wang L and Chen ZJ:
Melatonin receptor 1A gene polymorphism associated with polycystic
ovary syndrome. Gynecol Obstet Invest. 72:130–134. 2011. View Article : Google Scholar : PubMed/NCBI
|
|
9
|
Hardeland R, Cardinali DP, Srinivasan V,
Spence DW, Brown GM and Pandi-Perumal SR: Melatonin-a pleiotropic,
orchestrating regulator molecule. Prog Neurobiol. 93:350–384. 2011.
View Article : Google Scholar : PubMed/NCBI
|
|
10
|
McClay DR: Evolutionary crossroads in
developmental biology: Sea urchins. Development. 138:2639–2648.
2011. View Article : Google Scholar : PubMed/NCBI
|
|
11
|
Carcangiu V, Luridiana S, Vacca GM, Daga C
and Mura MC: A polymorphism at the melatonin receptor 1A (MTNR1A)
gene in Sarda ewes affects fertility after AI in the spring. Reprod
Fertil Dev. 23:376–380. 2011. View
Article : Google Scholar : PubMed/NCBI
|
|
12
|
Tobias DK, Gaskins AJ, Missmer SA, Hu FB,
Manson JE, Buck Louis GM, Zhang C and Chavarro JE: History of
infertility and risk of type 2 diabetes mellitus: A prospective
cohort study. Diabetologia. 58:707–715. 2015. View Article : Google Scholar : PubMed/NCBI
|
|
13
|
Ren T, Zhu Y and Kan J: Zanthoxylum
alkylamides activate phosphorylated AMPK and ameliorate glycolipid
metabolism in the streptozotocin-induced diabetic rats. Clin Exp
Hypertens. 39:330–338. 2017. View Article : Google Scholar : PubMed/NCBI
|
|
14
|
Lyssenko V, Nagorny CL, Erdos MR, Wierup
N, Jonsson A, Spégel P, Bugliani M, Saxena R, Fex M, Pulizzi N, et
al: Common variant in MTNR1B associated with increased risk of type
2 diabetes and impaired early insulin secretion. Nat Genet.
41:82–88. 2009. View
Article : Google Scholar : PubMed/NCBI
|
|
15
|
Slominski RM, Reiter RJ,
Schlabritz-Loutsevitch N, Ostrom RS and Slominski AT: Melatonin
membrane receptors in peripheral tissues: Distribution and
functions. Mol Cell Endocrinol. 351:152–166. 2012. View Article : Google Scholar : PubMed/NCBI
|
|
16
|
Slominski AT, Zmijewski MA, Semak I, Kim
TK, Janjetovic Z, Slominski RM and Zmijewski JW: Melatonin,
mitochondria, and the skin. Cell Mol Life Sci. 74:3913–3925. 2017.
View Article : Google Scholar : PubMed/NCBI
|
|
17
|
Ying X, Qian Y, Jiang Y, Jiang Z, Song Z
and Zhao C: Association of the apolipoprotein B/apolipoprotein A-I
ratio and low-density lipoprotein cholesterol with insulin
resistance in a Chinese population with abdominal obesity. Acta
Diabetol. 49:465–472. 2012. View Article : Google Scholar : PubMed/NCBI
|
|
18
|
Chin R and Miyazaki S: Criteria of obesity
and obesity disease in Japan. Nihon Rinsho. 67:297–300. 2009.(In
Japanese). PubMed/NCBI
|
|
19
|
Ferriman D and Gallwey JD: Clinical
assessment of body hair growth in women. J Clin Endocrinol Metab.
21:1440–1447. 1961. View Article : Google Scholar : PubMed/NCBI
|
|
20
|
Lucky AW, McGuire J, Rosenfield RL, Lucky
PA and Rich BH: Plasma androgens in women with acne vulgaris. J
Invest Dermatol. 81:70–74. 1983. View Article : Google Scholar : PubMed/NCBI
|
|
21
|
Stumvoll M, Mitrakou A, Pimenta W, Jenssen
T, Yki-Järvinen H, Van Haeften T, Renn W and Gerich J: Use of the
oral glucose tolerance test to assess insulin release and insulin
sensitivity. Diabetes Care. 23:295–301. 2000. View Article : Google Scholar : PubMed/NCBI
|
|
22
|
Abbasi F, Blasey C, Feldman D, Caulfield
MP, Hantash FM and Reaven GM: Low circulating 25-hydroxyvitamin D
concentrations are associated with defects in insulin action and
insulin secretion in persons with prediabetes. J Nutr. 145:714–719.
2015. View Article : Google Scholar : PubMed/NCBI
|
|
23
|
Macut D, Bjekić-Macut J, Rahelić D and
Doknić M: Insulin and the polycystic ovary syndrome. Diabetes Res
Clin Pract. 130:163–170. 2017. View Article : Google Scholar : PubMed/NCBI
|
|
24
|
Genazzani AR and Genazzani AD: Polycystic
ovary syndrome: From contraception to hormone replacement therapy.
Front Gynecol Endocrinol. Springer International Publishing. 2015.
View Article : Google Scholar : PubMed/NCBI
|
|
25
|
Wu D, Kimura F, Takashima A, Shimizu Y,
Takebayashi A, Kita N, Zhang G and Murakami T: Intake of vinegar
beverage is associated with restoration of ovulatory function in
women with polycystic ovary syndrome. Tohoku J Exp Med. 230:17–23.
2013. View Article : Google Scholar : PubMed/NCBI
|
|
26
|
Costello M, Shrestha B, Eden J, Sjoblom P
and Johnson N: Insulin-sensitising drugs versus the combined oral
contraceptive pill for hirsutism, acne and risk of diabetes,
cardiovascular disease, and endometrial cancer in polycystic ovary
syndrome. Cochrane Database Syst Rev. CD0055522007.PubMed/NCBI
|
|
27
|
Esmaeilzadeh S, Andarieh MG, Ghadimi R and
Delavar MA: Body mass index and gonadotropin hormones (LH &
FSH) associate with clinical symptoms among women with polycystic
ovary syndrome. Glob J Health Sci. 7:101–106. 2014. View Article : Google Scholar : PubMed/NCBI
|
|
28
|
Ramezanali F, Khalili G, Arabipoor A,
Bagheri Lankarani N and Moini A: Relationships between serum
luteinizing hormone level, endometrial thickness and body mass
index in polycystic ovary syndrome patients with and without
endometrial hyperplasia. Int J Fertil Steril. 10:36–41.
2016.PubMed/NCBI
|
|
29
|
Kawwass JF, Sanders KM, Loucks TL, Rohan
LC and Berga SL: Increased cerebrospinal fluid levels of GABA,
testosterone and estradiol in women with polycystic ovary syndrome.
Hum Reprod. 32:1450–1456. 2017. View Article : Google Scholar : PubMed/NCBI
|
|
30
|
Njelekela MA, Negishi H, Nara Y, Sato T,
Tomohiro M, Kuga S, Noguchi T, Kanda T, Yamori M, Mashalla Y, et
al: Obesity and lipid profiles in middle aged men and women in
Tanzania. East Afr Med J. 79:58–64. 2002. View Article : Google Scholar : PubMed/NCBI
|
|
31
|
Kalani Z, Salimi T and Rafiei M:
Comparison of obesity indexes BMI WHR and WC in association with
Hypertension: Results from a blood pressure status survey in Iran.
J Cardiovasc Dis Res. 6:72–77. 2015. View Article : Google Scholar
|
|
32
|
Zaki M, Kholoussi S, Ismail S, Raouf HA,
Helwa I, Hassan N, Youness E, Mohamed NA, Kamal S, Yousef W, et al:
Metabolic abnormalities in young Egyptian women with polycystic
ovary syndrome and their relation to ADIPOQ, gene variants and body
fat phenotype. Egypt J Med Hum Genet. 16:367–374. 2015. View Article : Google Scholar
|
|
33
|
Jaworek J, Nawrot-Porabka K, Leja-Szpak A,
Bonior J, Szklarczyk J, Kot M, Konturek SJ and Pawlik WW: Melatonin
as modulator of pancreatic enzyme secretion and pancreatoprotector.
J Physiol Pharmacol. 58 Suppl 6:S65–S80. 2007.
|
|
34
|
Slominski AT, Hardeland R, Zmijewski MA,
Slominski RM, Reiter RJ and Paus R: Melatonin: A cutaneous
perspective on its production, metabolism, and functions. J Invest
Dermatol. 138:490–499. 2018. View Article : Google Scholar : PubMed/NCBI
|
|
35
|
Slominski AT, Semak I, Fischer TW, Kim TK,
Kleszczynski K, Hardeland R and Reiter RJ: Metabolism of melatonin
in the skin: Why is it important? Exp Dermatol. 26:563–568. 2017.
View Article : Google Scholar : PubMed/NCBI
|
|
36
|
Lin FY, Lin CW, Yang SF, Lee WJ, Lin YW,
Lee LM, Chang JL, Weng WC, Lin CH and Chien MH: Interactions
between environmental factors and melatonin receptor type 1A
polymorphism in relation to oral cancer susceptibility and
clinicopathologic development. PLoS One. 10:e01216772015.
View Article : Google Scholar : PubMed/NCBI
|
|
37
|
Song X, Sun X, Ma G, Sun Y, Shi Y, Du Y
and Chen ZJ: Family association study between melatonin receptor
gene polymorphisms and polycystic ovary syndrome in Han Chinese.
Eur J Obstet Gynecol Reprod Biol. 195:108–112. 2015. View Article : Google Scholar : PubMed/NCBI
|
|
38
|
Park HJ, Park JK, Kim SK, Cho AR, Kim JW,
Yim SV and Chung JH: Association of polymorphism in the promoter of
the melatonin receptor 1A gene with schizophrenia and with insomnia
symptoms in schizophrenia patients. J Mol Neurosci. 45:304–308.
2011. View Article : Google Scholar : PubMed/NCBI
|
|
39
|
Del Campo JA, Ampuero J, Rojas L, Conde M,
Rojas A, Maraver M, Millán R, García-Valdecasas M, García-Lozano
JR, González-Escribano MF and Romero-Gómez M: Insulin resistance
predicts sustained virological response to treatment of chronic
hepatitis C independently of the IL28b rs12979860 polymorphism.
Aliment Pharmacol Ther. 37:74–80. 2013. View Article : Google Scholar : PubMed/NCBI
|
|
40
|
Chen Z, Liu W, Sun X and Zhu L: Clinical
study on the association between pregnancy-induced hypertension and
insulin resistance. Exp Ther Med. 13:2065–2070. 2017. View Article : Google Scholar : PubMed/NCBI
|
|
41
|
Diamanti-Kandarakis E: Insulin resistance
in PCOS. Endocrine. 30:13–17. 2006. View Article : Google Scholar : PubMed/NCBI
|
|
42
|
Li Q, Yin RX, Yan TT, Miao L, Cao XL, Hu
XJ, Aung LH, Wu DF, Wu JZ and Lin WX: Association of the GALNT2
gene polymorphisms and several environmental factors with serum
lipid levels in the Mulao and Han populations. Lipids Health Dis.
10:1602011. View Article : Google Scholar : PubMed/NCBI
|
|
43
|
Li C, Shi Y, You L, Wang L and Chen ZJ:
Association of rs10830963 and rs10830962 SNPs in the melatonin
receptor (MTNR1B) gene among Han Chinese women with polycystic
ovary syndrome. Mol Hum Reprod. 17:193–198. 2011. View Article : Google Scholar : PubMed/NCBI
|