Introduction
Septic shock (SS) is caused by an uncontrolled
inflammatory immune response to pathogens (for example, bacteria,
fungi, parasites and viruses) and occurs when sepsis results in
dangerous hypotension and abnormal cellular metabolism (1). SS can lead to multiple organ failure
and death, and in 2018 the mortality rate of SS was 25–50%
(2). Innate and adaptive immune
responses of hosts of different ages have various effects against
sepsis (3,4), with the survival rate of pediatric
septic shock (PSS) being particularly low compared with other age
groups (5). PSS is one of the main
causes of mortality in critically ill children in pediatric
intensive care units worldwide (6). Adult and pediatric septic shock
differ in terms of pathophysiology, clinical presentation and
therapeutic approaches (7).
Hyperdynamic shock syndrome or warm shock occurs in ~90% of adult
patients, while severe hypovolemia often characterizes PSS
(7). Activated protein C is the
preferred treatment for adult patients, whereas plasma exchange is
preferred for the treatment of pediatric patients with
thrombocytopenia-associated multiple organ failure (7). The therapy regimens widely used in
adults with SS have been shown to have little therapeutic effect on
children (8). Therefore,
investigation into the molecular mechanisms of PSS for the
diagnosis and therapeutic management of patients with PSS is
required.
Nuclear factor erythroid 2-related factor 2
(Nrf2)-linked genes are dysregulated in PSS and may affect fatty
acid metabolism, peroxisome proliferator-activated receptors
(PPARs) and retinoic acid receptor-α families, which are related to
intermediary metabolism and oxidative stress in PSS (9). A recent study revealed a list of
differentially expressed genes (DEGs) that are important for SS
diagnosis and are implicated in the immune response,
chemokine-mediated signaling, neutrophil chemotaxis and chemokine
activity (10). Olfactomedin-4
controls sepsis heterogeneity and may be a biomarker of a
pathogenic neutrophil subset associated with organ failure and
mortality caused by PSS (11).
Moreover, there is evidence that serum propionic acid has
diagnostic value for septic shock (12). Despite the aforementioned findings,
the mechanisms contributing to PSS are largely unknown.
Support vector machine (SVM) classifiers are gaining
significance as a robust classification tool in cancer genomics
(13) and have been used for the
diagnosis of various diseases, including chronic kidney disease
(14) and acute coronary syndrome
(15). In the present study, it
was hypothesized that an SVM classifier based on optimal feature
genes of PSS could facilitate the diagnosis of the disease. The
present study aimed to accurately identify the key genes in PSS
from DEGs between PSS and control samples, and constructed a SVM
classifier for distinguishing patients with PSS from normal
controls. The results from the present study could aid the
development of appropriate treatment strategies for PSS.
Materials and methods
Data source and pre-processing
Using the Gene Expression Omnibus (GEO; www.ncbi.nlm.nih.gov/geo) database, ‘septic
shock’ and ‘pediatric’ were used as keywords to search for relevant
datasets. The criteria for eligible datasets were as follows: i)
Included gene expression data of blood samples; ii) age information
was available to ensure that the subjects were children; iii) there
were both PSS samples and normal control samples; and iv) the total
number of samples was ≥100 and the number of samples that could be
used for analysis was ≥50. Finally, four microarray datasets based
on the GPL570 (HG-U133_Plus_2) Affymetrix Human Genome U133 Plus
2.0 Array, including GSE26378 (9),
GSE26440 (16), GSE13904 (17) and GSE4607 (18), were selected (Table I). The GSE13904 and GSE4607
datasets contained other samples, therefore, only the control and
septic shock samples were extracted for analysis in the present
study.
 | Table I.Information of the four microarray
datasets. |
Table I.
Information of the four microarray
datasets.
| Dataset | Platform | Samples (n) | Control | Septic shock |
|---|
| GSE26378 | GPL570
(HG-U133_Plus_2) Affymetrix Human Genome U133 Plus 2.0 Array | 103 | 21 | 82 |
| GSE26440 | GPL570
(HG-U133_Plus_2) Affymetrix Human Genome U133 Plus 2.0 Array | 130 | 32 | 98 |
|
GSE13904a | GPL570
(HG-U133_Plus_2) Affymetrix Human Genome U133 Plus 2.0 Array | 227 | 18 | 67 |
|
GSE4607a | GPL570
(HG-U133_Plus_2) Affymetrix Human Genome U133 Plus 2.0 Array | 123 | 15 | 42 |
For pre-processing the raw data in the four
datasets, data formats were converted using the oligo package
(19) (version 1.40.2; www.bioconductor.org/packages/oligo.html) in R and
normalization of gene expression values was performed using the
unit-scale normalization algorithm (20).
Meta-analysis to identify the
consistent DEGs in the four datasets
The four datasets included in the present study
involved experimental tests of samples from different patients and
thus they may have displayed different degrees of bias. To resolve
this issue, the MetaQC package (21) (version 0.1.13; www.cran.r-project.org/web/packages/MetaQC/index.html)
in R was adopted to perform quality control on the datasets. The
quality control standards in the MetaQC package contained accuracy
quality control (AQC) g and AQCp, external quality control,
consistency quality control (CQC) g and CQCp and internal quality
control. Combined with the two-dimensional diagram of the principal
component analysis (PCA) and the standardized mean rank, these
datasets were further assessed and screened.
Following the quality control analysis, DEGs between
PSS and normal control samples were analyzed using the MetaDE.ES
method in the MetaDE package (22)
(version 1.0.5; www.cran.r-project.org/web/packages/MetaDE). To
ensure that gene expression was consistent across the four
datasets, homogeneity test parameters were set as tau2=0
and Qpval >0.05. A false discovery rate (FDR)<0.05 was
selected as the significance threshold for screening of the DEGs.
Moreover, the genes with log2 fold-change (FC)>0.5 in
at least one of the datasets were used for analysis.
Weighted gene co-expression network
analysis (WGCNA)
WGCNA is an algorithm based on high-throughput
expression data, which is utilized for the construction of a
co-expression network (23). In
WGCNA, the GSE26440 dataset, which contained a relatively large
number of samples, was taken as the main analysis dataset and the
other three datasets were considered as the secondary analysis
datasets. Using the WGCNA package (23) (version 1.61; www.cran.r-project.org/web/packages/WGCNA/) in R, all
genes in the GSE26440 dataset were analyzed and screened for
disease-associated modules and genes. The requirements were: Number
of module genes ≥80, cutHeight=0.995 and P<0.05. Combined with
the three secondary analysis datasets, significantly stable modules
across the four datasets were screened. Module preservation across
the four datasets was analyzed using the module preservation
function of the WGCNA package. Using clinical information of the
samples in the GSE26440 dataset, the correlations between each
significantly stable module and clinical information were
calculated using the WGCNA cor function (version 1.68; 127.0.0.1:13239/library/WGCNA/html/cor.html) and
WGCNA corPvalueStudent function (version 1.68; 127.0.0.1:13239/library/WGCNA/html/corPvalueStudent.html).
The consistent DEGs were mapped into the
significantly stable modules. Significant enrichment parameters of
target genes in the modules were calculated using the
hypergeometric algorithm (24):
f(k,N,M,n)=C(k,M)xC(n-k,N-M)/C(n,N), where N stands for the number
of total genes participating in WGCNA network analysis, M stands
for the number of genes included in each module, n stands for the
number of genes identified by the MetaDE method and k stands for
the number of DEGs mapped to a module.
The thresholds of significant enrichment
distribution were selected as P<0.05 and fold enrichment >1.
For the consistent DEGs included in the significantly stable
modules, Gene Ontology (GO; www.geneontology.org) and Kyoto Encyclopedia of Genes
and Genomes (KEGG; www.genome.jp/kegg) enrichment analyses were conducted
based on the Database for Annotation, Visualization and Integrated
Discovery tool (25) (version 6.8;
ww.david.ncifcrf.gov). P<0.05 was
selected as the screening threshold.
Selection of the optimal gene
combination and construction of the SVM classifier
In order to further narrow down the range of
SS-related genes and accurately identify important feature genes,
the GSE26440 dataset was used as the training dataset and the other
three datasets were taken as the validation datasets to optimize
the previously identified DEGs. Recursive feature elimination (RFE)
is an integrated machine learning method, which regards the
selection of subsets as an optimization problem and evaluates gene
combinations (26). From the
training dataset GSE26440, the combination of optimal feature genes
were selected using the RFE method in the R caret package (27) (version 6.0–76; www.cran.r-project.org/web/packages/caret). In
10-fold cross validation, the gene combination with the highest
accuracy and the lowest Root Mean Square Error (RMSE) was selected
as the optimal gene combination.
SVM is a supervised classification algorithm for
machine learning, which uses the eigenvalues of features in each
sample to discriminate sample types and estimate the probability
that a sample belongs to a certain class (28). Using the SVM method in the e1071
package (28) (version 1.6–8;
www.cran.r-project.org/web/packages/e1071) in R,
the SVM classifier (Core; Sigmoid Kernel; Cross; 100-fold Cross
validation) based on the optimal gene combination was built. Based
on the pROC package (29) (version
1.12.1; www.cran.r-project.org/web/packages/pROC/index.html)
in R, the area under the receiver operating characteristic (AUROC)
was used to evaluate the efficiency of the SVM classifier in the
training and validation datasets. Values of AUROC were distributed
between 0.5 and 1, and the closer the AUROC value was to 1, the
higher the efficiency of the classifier.
Results
Meta-analysis to identify the
consistent DEGs across four datasets
The expression data in the four datasets were
standardized; the curves before and after standardization are shown
in Fig. 1A and B, respectively.
After standardization, the gene expression levels of each dataset
were distributed between −1 and 1, and the peak expression level
was ~0, which was uniform (Fig.
1B). The results of the quality control analysis (Table II) and the PCA diagram (Fig. 1C) suggested that the distributions
of the four datasets were balanced and all indexes met the quality
test standards. Therefore, all datasets could be included in the
subsequent analyses.
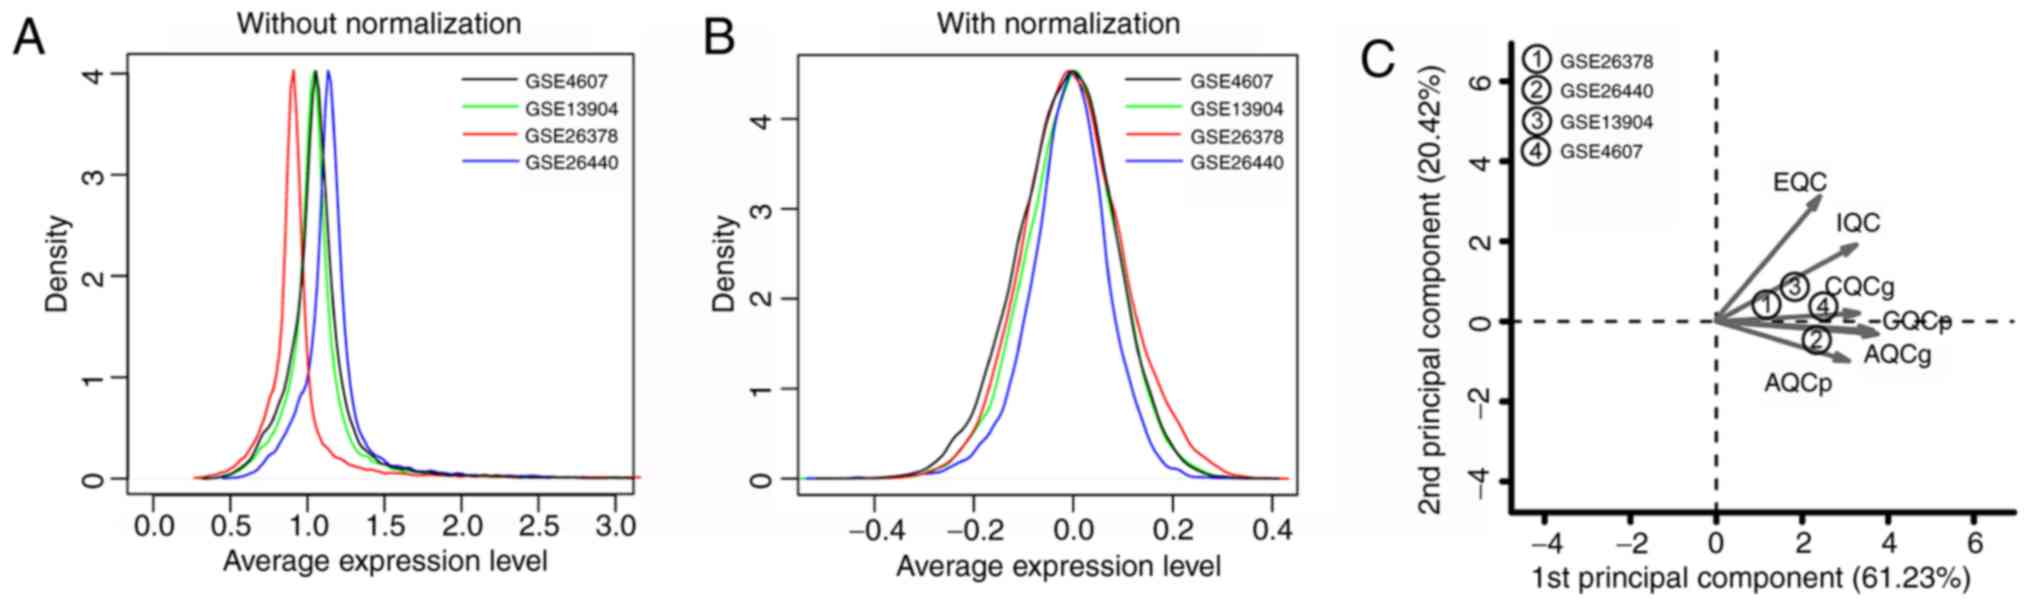 | Figure 1.Distribution curves and a
two-dimensional diagram of the PCA for the four datasets.
Distribution curves (A) before and (B) after normalization. (C)
Two-dimensional diagram of the PCA. Distribution curves for the
GSE4607, GSE13904, GSE26378 and GSE26440 datasets are represented
in black, green, red and blue, respectively. PCA, principal
component analysis; IQC, internal quality control; EQC, external
quality control; CQCg, consistency quality control gene; CQCp,
consistency quality control pathway; AQCg, accuracy quality control
gene; AQCp, accuracy quality control pathway. |
| Table II.Results of quality control analysis
of the four microarray datasets. |
Table II.
Results of quality control analysis
of the four microarray datasets.
| Dataset | IQC | EQC | CQCg | CQCp | AQCg | AQCp | SMR |
|---|
| GSE26378 | 5.350 | 4.453 | 237.678 | 107.220 | 41.268 | 114.658 | 2.839 |
| GSE26440 | 6.089 | 3.784 | 246.767 | 102.538 | 33.131 | 94.224 | 3.561 |
| GSE13904 | 6.448 | 4.579 | 74.753 | 76.039 | 37.205 | 106.445 | 4.101 |
| GSE4607 | 6.649 | 3.141 | 127.552 | 114.078 | 24.009 | 74.664 | 4.202 |
Through comprehensive analysis using the MetaDE
package, the P, FDR, tau2, Q pval and Q values for each
gene, as well as the log2FC value in each dataset, were
calculated. According to the pre-set thresholds, a total of 2,699
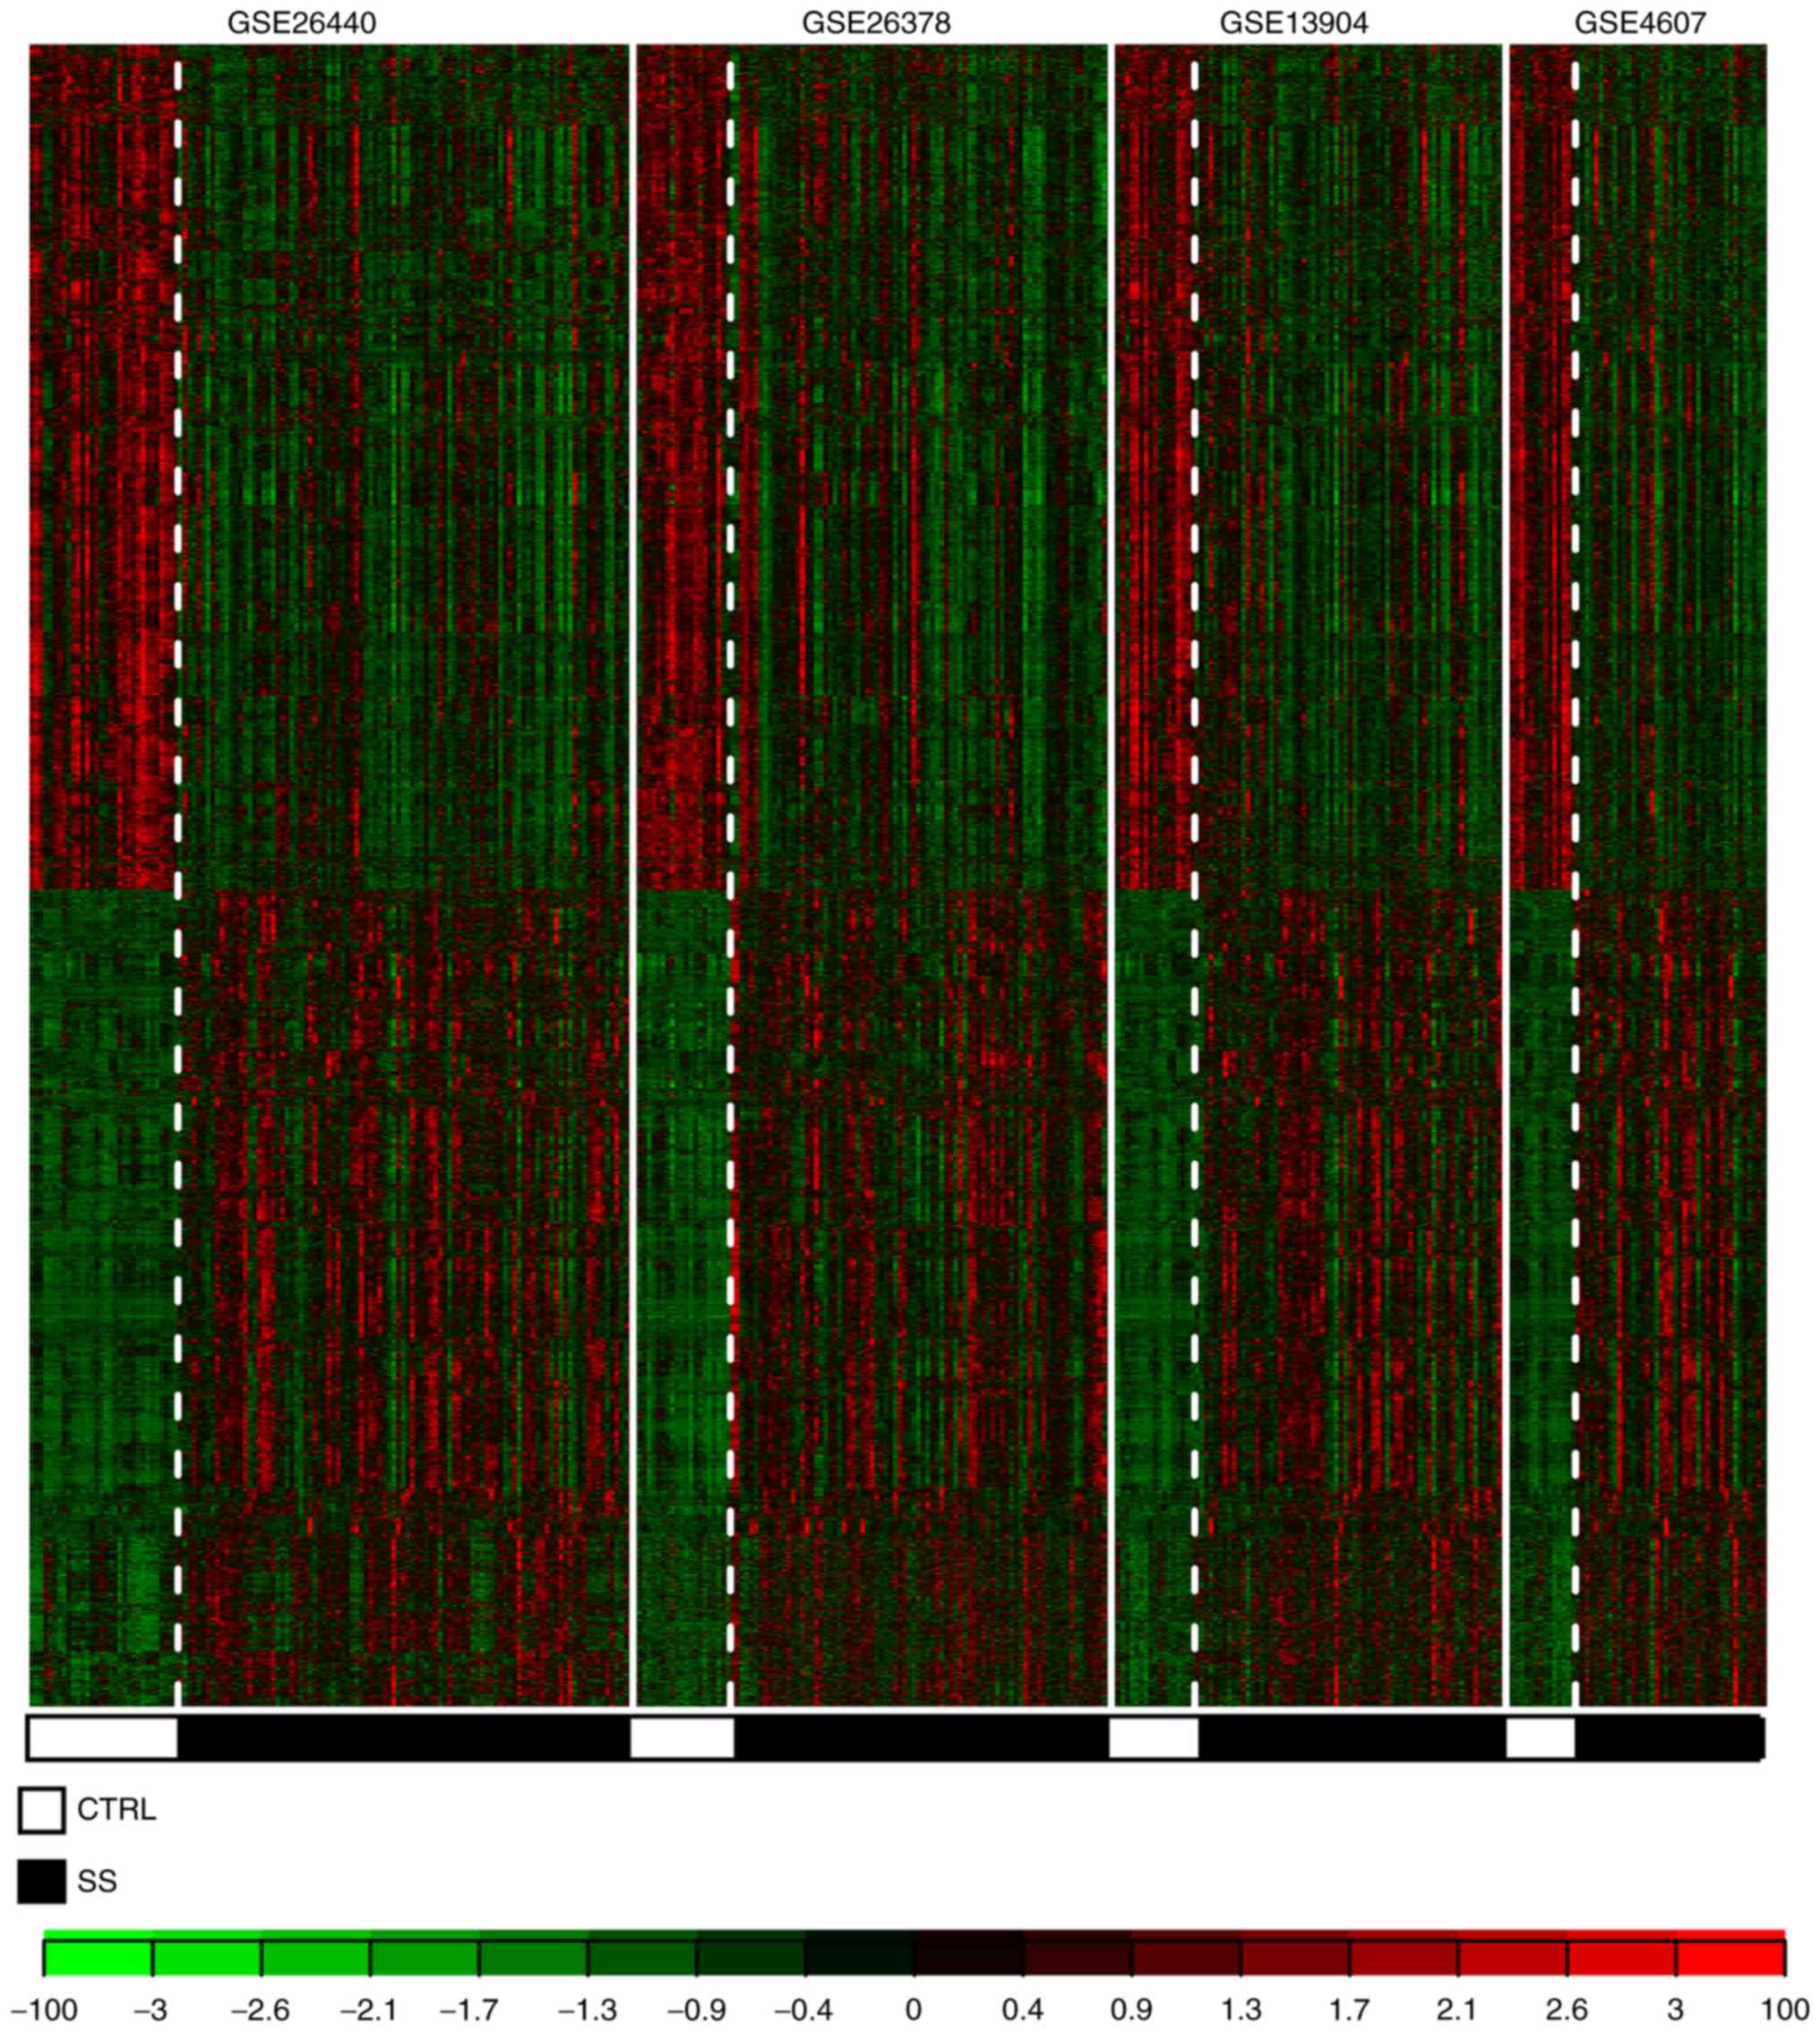
consistent DEGs were identified from the four datasets. The heat
map suggested that the differential expression patterns of the
2,699 DEGs were consistent in the four datasets (Fig. 2).
WGCNA
To ensure that the gene expression levels in each
dataset were comparable, all gene expression values in the four
datasets were analyzed for expression level consistency. The
expression level and connection level correlations between all
combinations of pairs within the four datasets were positive and
the P-values were significant (P<1×10−200),
indicating that the datasets were comparable (Fig. S1).
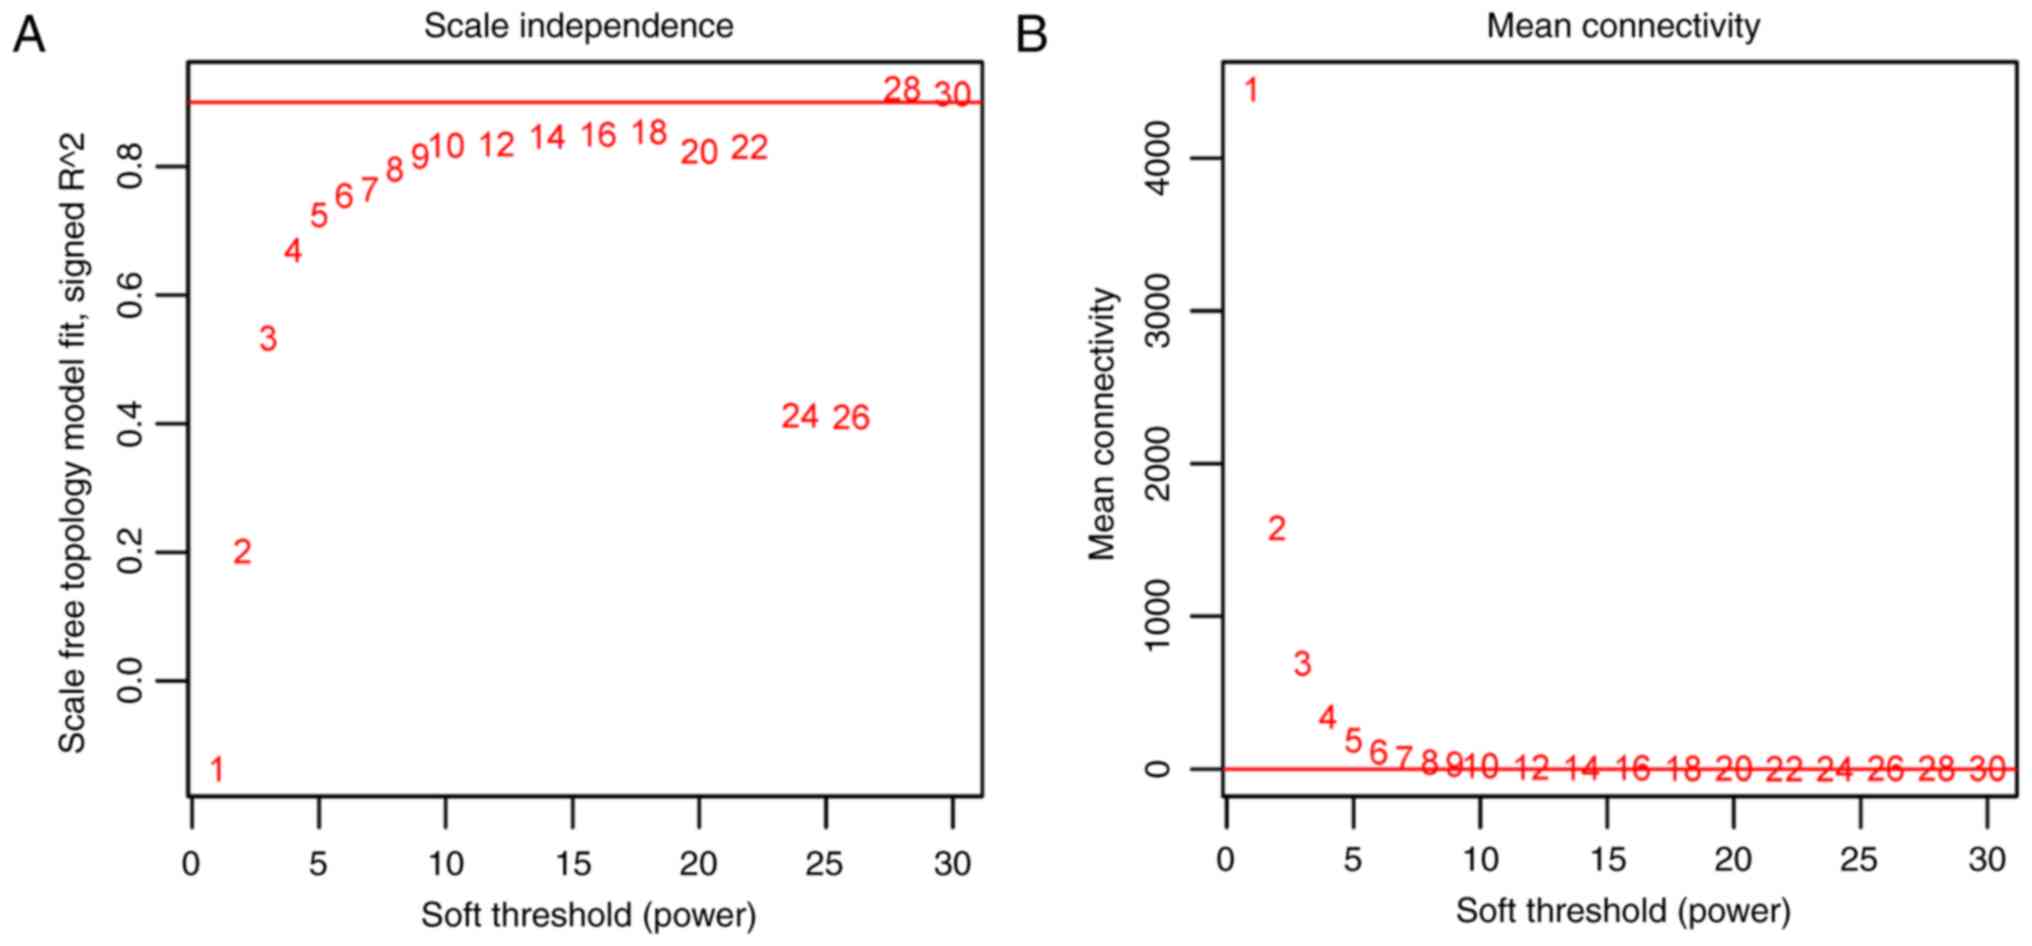
WGCNA needed to satisfy the pre-condition of
scale-free network distribution. Therefore, the value of the
weighting parameter ‘power’ was firstly explored. Based on the
GSE26440 dataset, the square values of the correlation coefficients
between log(k) and log[p(k)] corresponding to different power
values were calculated. Finally, the ‘power’ value was selected to
be 28 when the square value of the correlation coefficient reached
0.9 (Fig. 3A). Under the parameter
of ‘power’=28, the mean gene connectivity was statistically
analyzed. The mean connectivity was 1, which confirmed the
small-world property of the scale-free connection network (Fig. 3B).
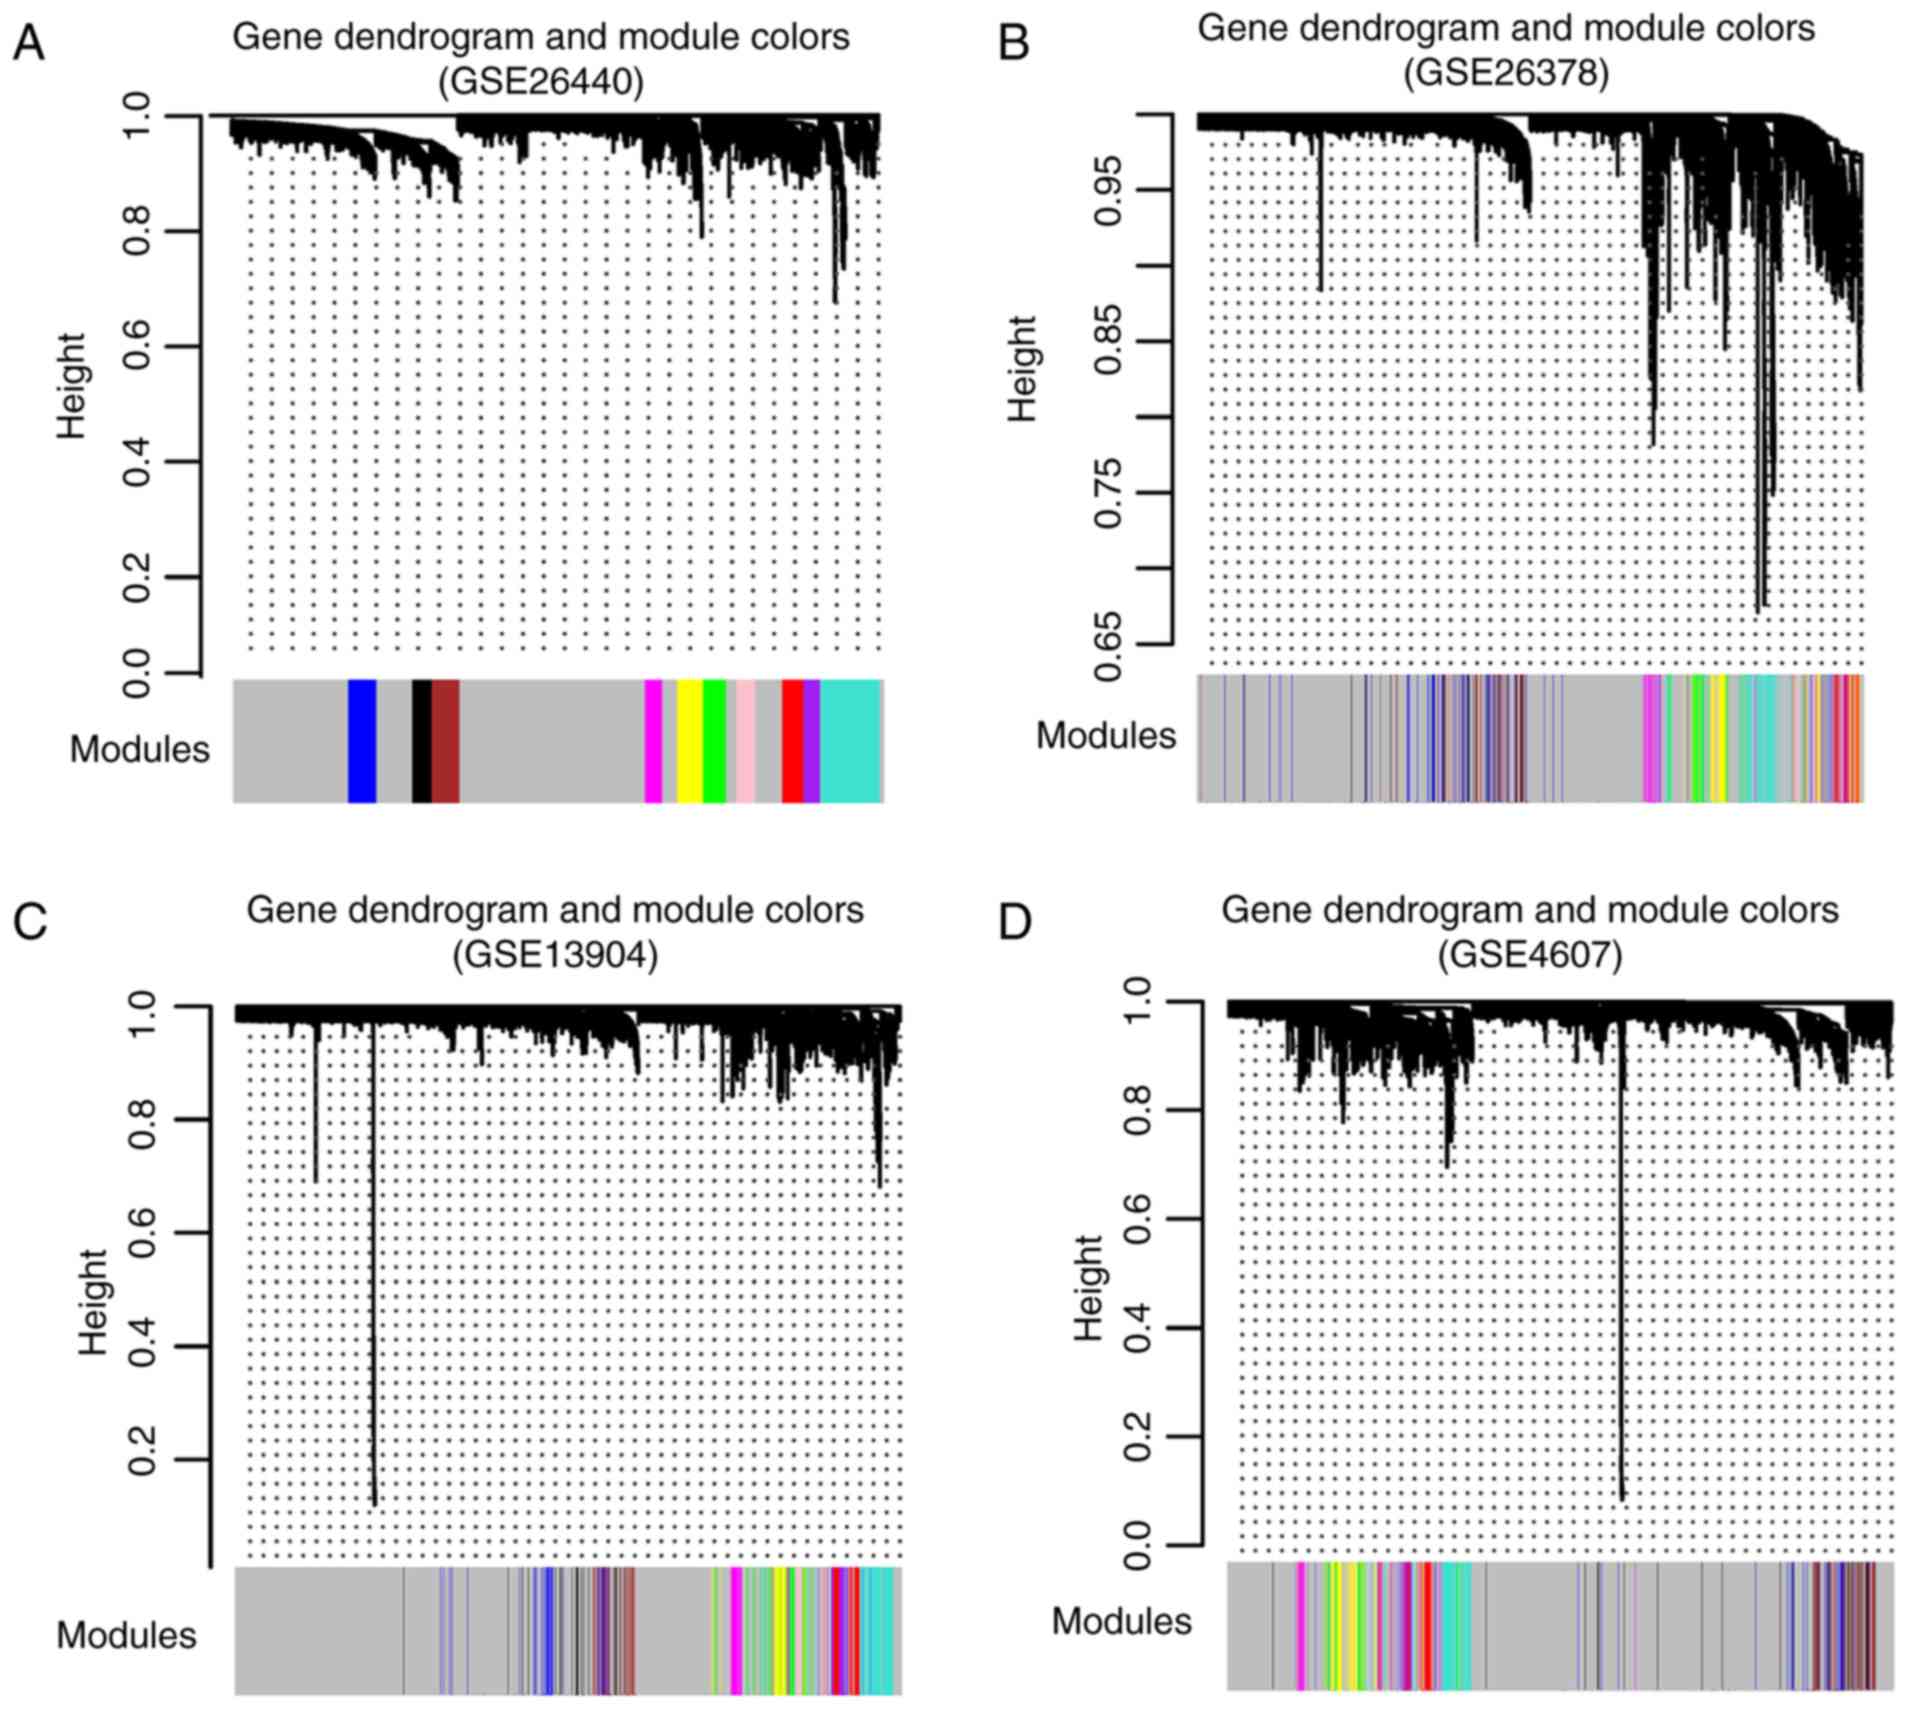
After the co-expression network was constructed
using the GSE26440 dataset as the main analysis dataset, a total of
11 modules were selected (Fig.
4A). The other three datasets including GSE26378 (Fig. 4B), GSE13904 (Fig. 4C) and GSE4607 (Fig. 4D) were also constructed with module
partition. Meanwhile, module stability was evaluated and 10
significantly stable modules across the datasets were obtained
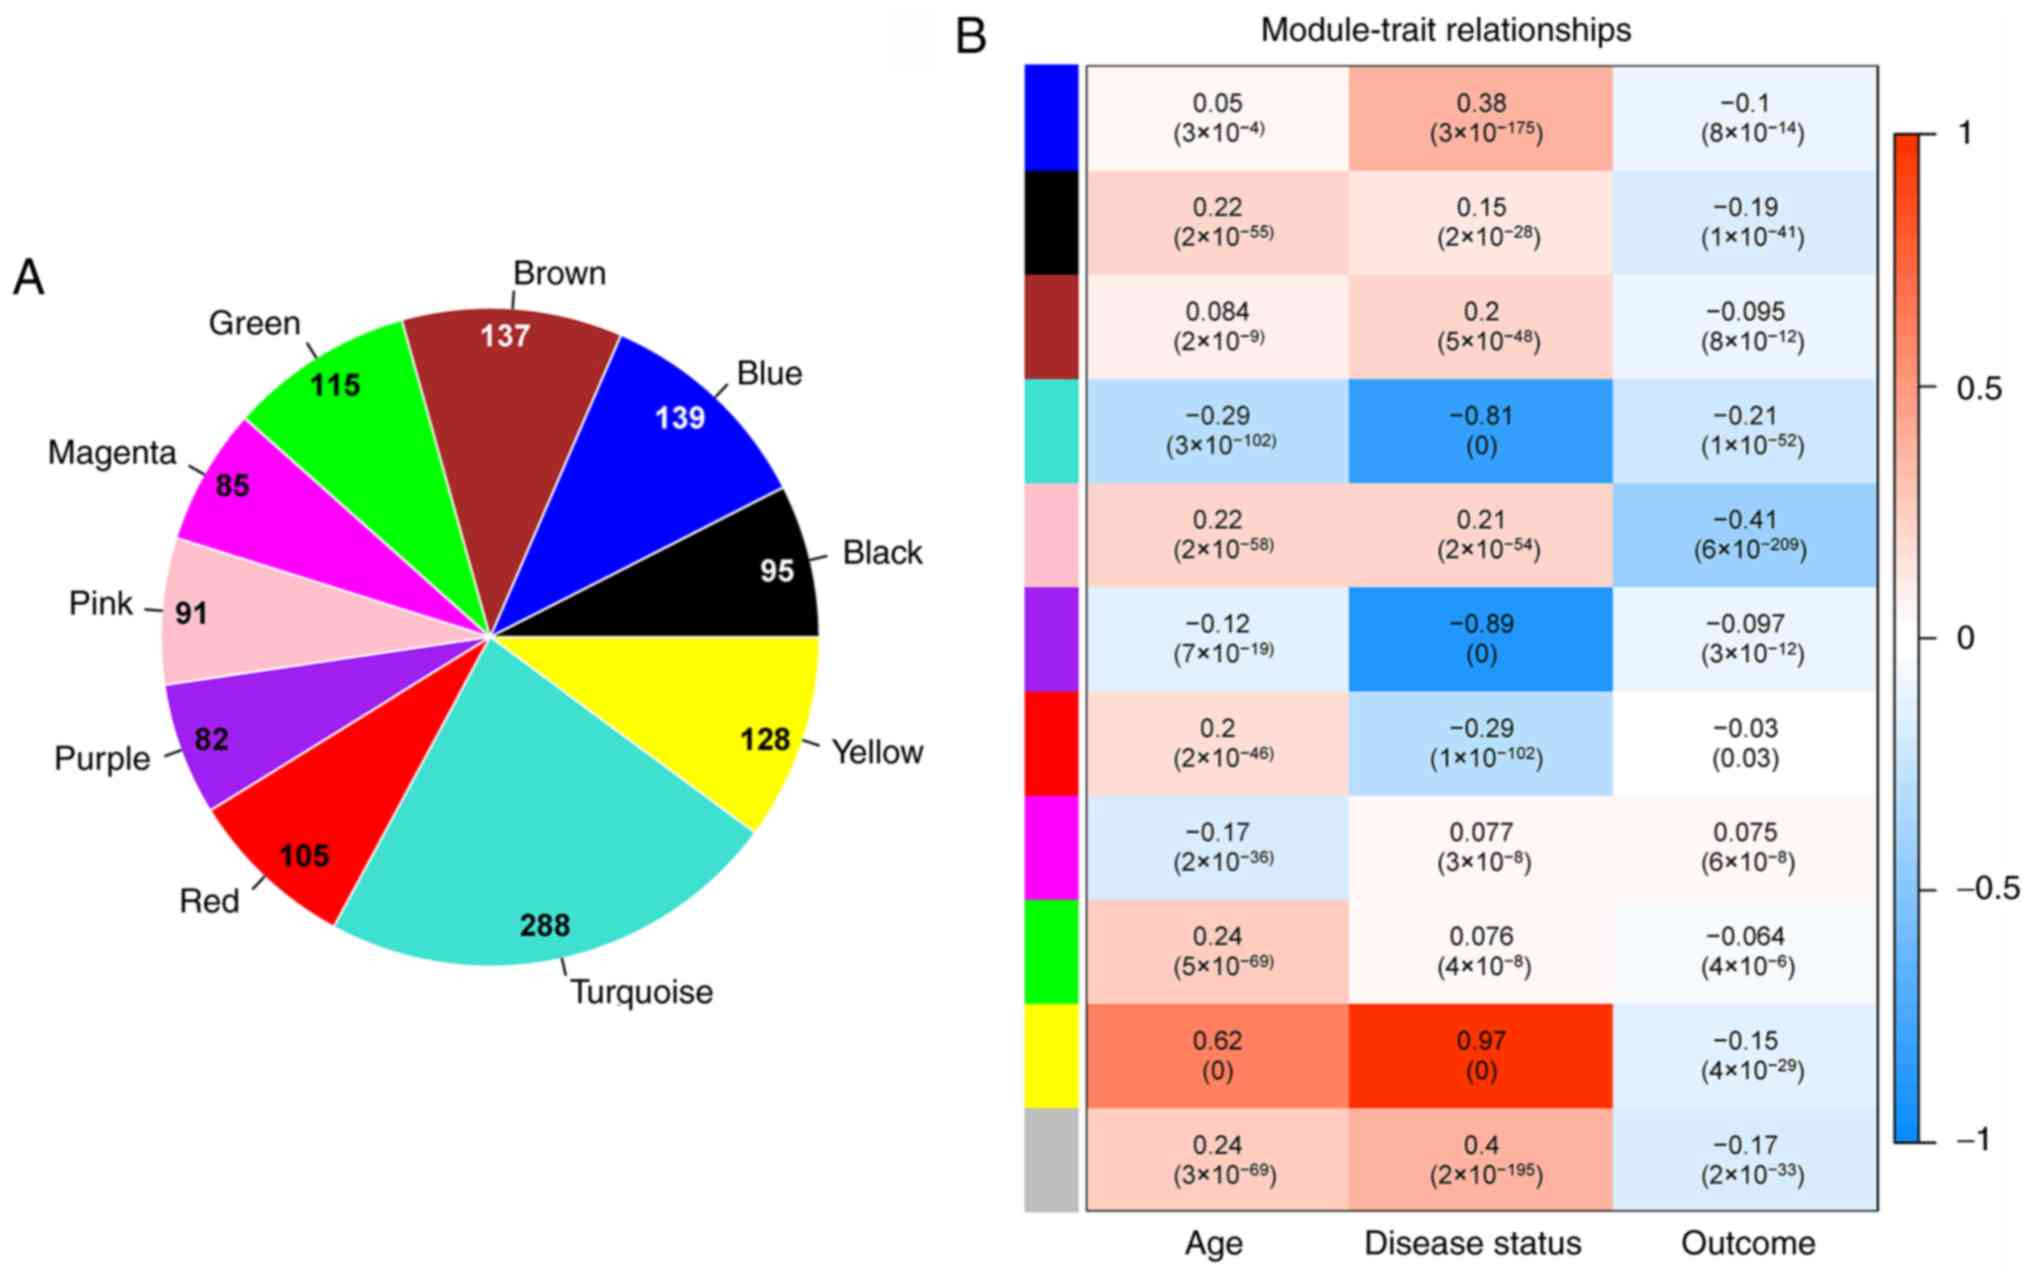
(Table III). The number of genes
present in each significantly stable module are shown in Fig. 5A. Using clinical information of the
samples in the GSE26440 dataset, the correlations between each
significantly stable module and clinical information were
calculated using the WGCNA cor and corPvalueStudent packages
(Fig. 5B).
| Table III.Preservation and enrichment
information of the 11 modules and the module genes. |
Table III.
Preservation and enrichment
information of the 11 modules and the module genes.
|
|
|
| Preservation
information |
| Enrichment
information |
|---|
|
|
|
|
|
|
|
|---|
| Module ID | Color | Module size | Z-score | P-value | DEGs (n) | Enrichment fold
(95% CI) | Phyper |
|---|
| Module 1 | Black | 95 | 11.823 |
1.78×10⁻⁴ | 0 | – | – |
| Module 2 | Blue | 139 | 9.292 |
1.18×10⁻² | 1 | 0.157
(0.004–0.898) |
3.13×10⁻² |
| Module 3 | Brown | 137 | 20.037 |
1.80×10⁻³ | 1 | 0.159
(0.004–0.912) |
3.09×10⁻² |
| Module 4 | Green | 115 | 21.756 |
1.57×10⁻¹⁰ | 3 | 0.569
(0.115–1.727) |
4.90×10⁻¹ |
| Module 5 | Grey | 3,907 | 8.083 |
1.00×10−200 | 55 | 0.307
(0.224–0.415) |
2.20×10⁻¹⁶ |
| Module 6 | Magenta | 85 | 14.990 |
3.17×10⁻⁶ | 12 | 3.079
(1.509–5.766) |
1.30×10⁻³ |
| Module 7 | Pink | 91 | 20.320 |
1.10×10⁻¹⁰ | 2 | 0.479
(0.057–1.803) |
4.40×10⁻¹ |
| Module 8 | Purple | 82 | 22.134 |
6.00×10⁻⁴ | 26 | 6.915
(4.186–11.103) |
2.67×10⁻¹² |
| Module 9 | Red | 105 | 21.649 |
1.57×10⁻⁶ | 8 | 1.662
(0.691–3.452) |
1.64×10⁻¹ |
| Module 10 | Turquoise | 288 | 36.143 |
7.00×10−38 | 67 | 5.074
(3.714–6.868) |
2.20×10⁻¹⁶ |
| Module 11 | Yellow | 128 | 23.321 |
3.20×10⁻³⁴ | 62 | 10.559
(7.458–14.849) |
2.20×10⁻¹⁶ |
The consistent DEGs were compared to the genes
within the significantly stable modules, resulting in the
identification of 237 overlapping genes. Enrichment and
distribution situations of the overlapping genes in each
significantly stable module are presented in Table III. The consistent DEGs were
significantly enriched in four stable modules, including the
magenta, purple, turquoise, and yellow modules, which contained 12,
26, 67 and 62 genes, respectively (P<0.05). Afterwards,
enrichment analysis for the genes involved in the four stable
modules was performed and 18 GO biological process terms, including
‘translational elongation’ (P=6.45×10⁻¹⁶) and
‘translation’ (P=2.16×10⁻¹³), as well as nine KEGG
pathways, including ‘ribosome’ (P=1.55×10⁻¹⁴) and ‘Fc
gamma R-mediated phagocytosis’ (P=1.89×10⁻³) were
acquired (Table IV).
| Table IV.GO biological process terms and KEGG
pathways enriched for the genes involved in the four stable
modules. |
Table IV.
GO biological process terms and KEGG
pathways enriched for the genes involved in the four stable
modules.
| A, GO analysis |
|---|
|
|---|
| Biological process
term | Count | P-value |
|---|
| GO:0006414:
Translational elongation | 17 |
6.45×10⁻¹⁶ |
| GO:0006412:
Translation | 23 |
2.16×10⁻¹³ |
| GO:0030029: Actin
filament-based process | 10 |
3.51×10⁻⁴ |
| GO:0030036: Actin
cytoskeleton organization | 9 |
1.06×10⁻³ |
| GO:0046907:
Intracellular transport | 15 |
2.55×10⁻³ |
| GO:0042254:
Ribosome biogenesis | 6 |
5.09×10⁻³ |
| GO:0022613:
Ribonucleoprotein complex biogenesis | 7 |
6.01×10⁻³ |
| GO:0006413:
Translational initiation | 4 |
7.88×10⁻³ |
| GO:0006928: Cell
motion | 11 |
1.13×10⁻² |
| GO:0016192:
Vesicle-mediated transport | 12 |
1.58×10⁻² |
| GO:0034621:
Cellular macromolecular complex subunit organization | 9 |
1.62×10⁻² |
| GO:0007010:
Cytoskeleton organization | 10 |
1.80×10⁻² |
| GO:0006886:
Intracellular protein transport | 9 |
2.08×10⁻² |
| GO:0034613:
Cellular protein localization | 9 |
3.39×10⁻² |
| GO:0070727:
Cellular macromolecule localization | 9 |
3.52×10⁻² |
| GO:0015031: Protein
transport | 13 |
4.44×10⁻² |
| GO:0001667:
Ameboidal cell migration | 3 |
4.44×10⁻² |
| GO:0045184:
Establishment of protein localization | 13 |
4.70×10⁻² |
|
| B, KEGG
analysis |
|
| Pathway | Count | P-value |
|
| hsa03010:
Ribosome | 15 |
1.55×10⁻¹⁴ |
| hsa04666: Fc gamma
R-mediated phagocytosis | 5 |
1.89×10⁻³ |
| hsa04810:
Regulation of actin cytoskeleton | 6 |
8.13×10⁻³ |
| hsa05110: Vibrio
cholerae infection | 3 |
1.22×10⁻² |
| hsa04062: Chemokine
signaling pathway | 4 |
3.30×10⁻² |
| hsa04130: SNARE
interactions in vesicular transport | 2 |
3.40×10⁻² |
| hsa04670: Leukocyte
transendothelial migration | 3 |
3.66×10⁻² |
| hsa04360: Axon
guidance | 3 |
4.09×10⁻² |
| hsa00190: Oxidative
phosphorylation | 3 |
4.13×10⁻² |
Selection of the optimal gene
combination and construction of SVM classifier
With the GSE26440 dataset as the training dataset,
the optimal feature genes were further identified from the genes
involved in the four stable modules. Under the optimal parameters
(min RMSE=0.0849 and max accuracy=0.9262), six optimal feature
genes [cysteine rich transmembrane module containing 1 (CYSTM1),
S100 calcium binding protein A9 (S100A9), solute carrier family 2
member 14 (SLC2A14), stomatin (STOM), uridine phosphorylase 1
(UPP1) and utrophin (UTRN)] were selected.
Based on the six optimal feature genes, an SVM
classifier was constructed within the GSE26440 dataset.
Subsequently, the efficiency of the SVM classifier in the training
and validation datasets was assessed. All the precision rates,
calculated as true positive/(true positive + false positive),
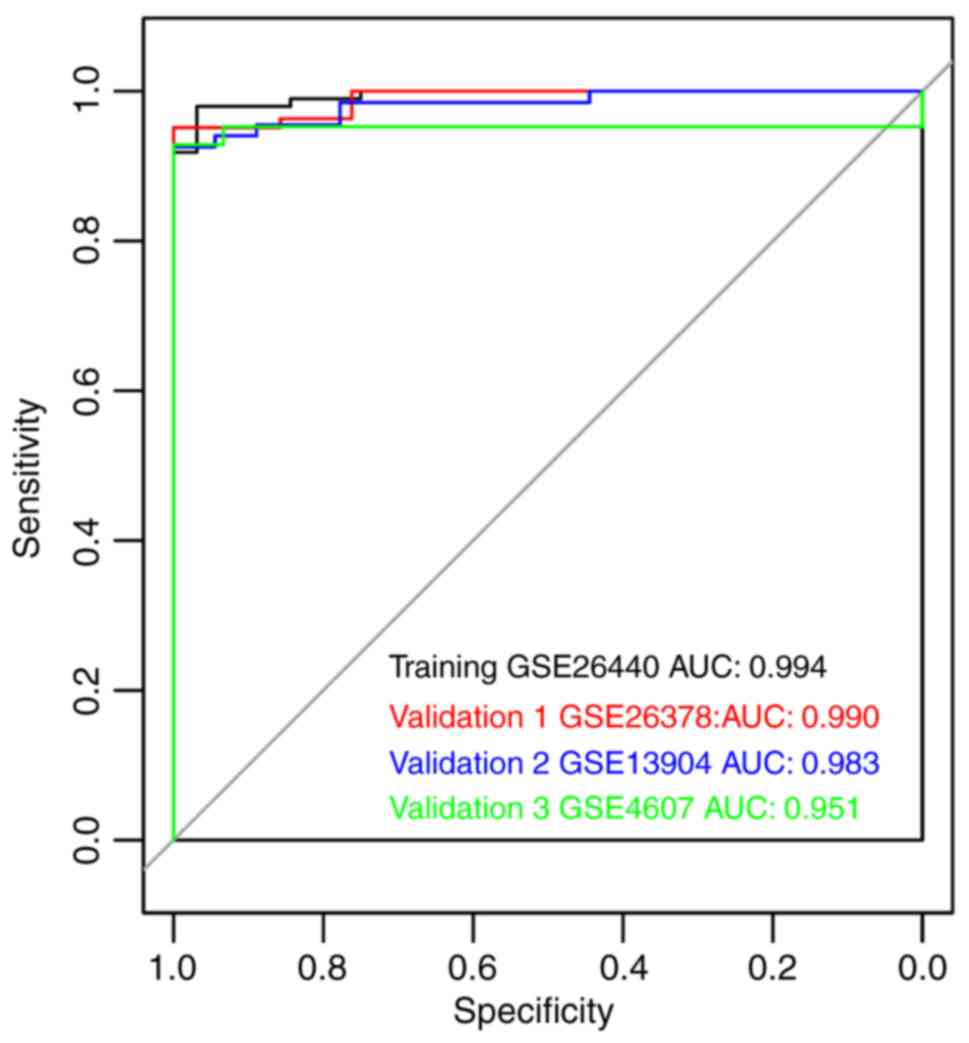
(Table V) and AUROC values
(Fig. 6) were >0.9, suggested
that the SVM classifier could accurately discriminate PSS samples
from control samples. In addition, the expression of the six
optimal genes in the four datasets was analyzed. The results
suggested that the expression differences of the six optimal genes
were consistent in the four datasets. The UTRN gene was
significantly downregulated in the PSS samples (P<0.005),
whereas the other five genes were significantly upregulated in the
PSS samples (P<0.005; Fig.
7).
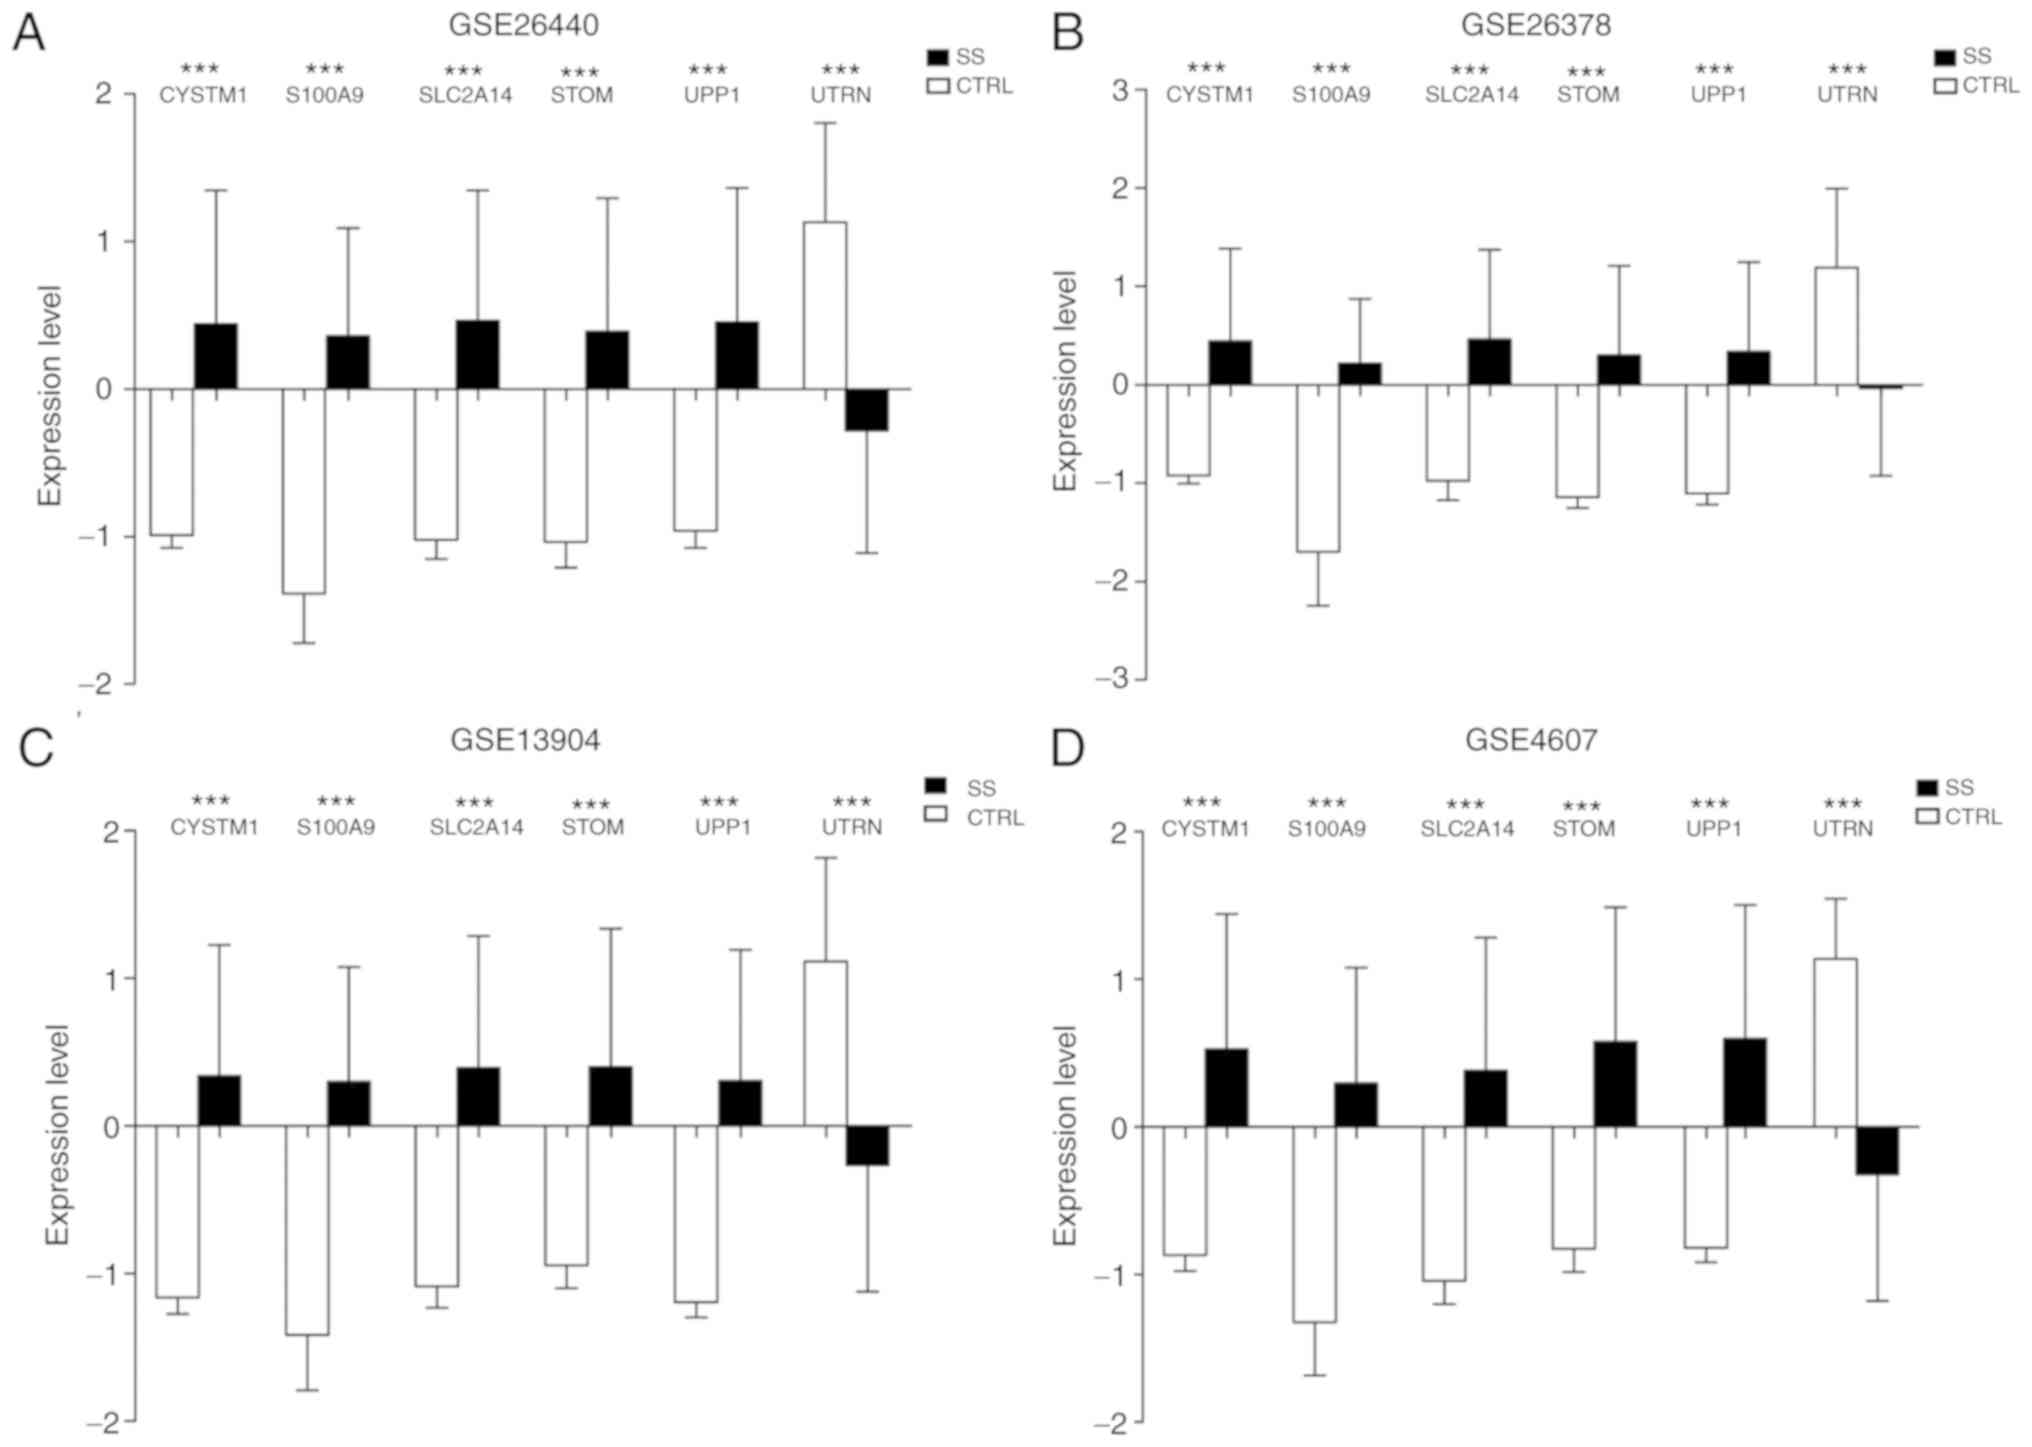 | Figure 7.Expression of the six optimal genes
in the four datasets. Column chart for (A) GSE26440, (B) GSE26378,
(C) GSE13904 and (D) GSE4607. ***P<0.005 vs. the control group.
SS, septic shock; CTRL, control; CYSTM1, cysteine rich
transmembrane module containing 1; S100A9, S100 calcium binding
protein A9; SLC2A14, solute carrier family 2 member 14; STOM,
stomatin; UPP1, uridine phosphorylase 1; UTRN, utrophin. |
| Table V.Indexes for assessing the efficiency
of the support vector machine classifier in the training and
validation datasets. |
Table V.
Indexes for assessing the efficiency
of the support vector machine classifier in the training and
validation datasets.
| Dataset | Precision rate | Sensitivity | Specificity | PPV | NPV | AUROC |
|---|
| GSE26440 | 0.977 | 0.989 | 0.939 | 0.979 | 0.969 | 0.994 |
| GSE26378 | 0.961 | 1.000 | 0.840 | 0.951 | 1.000 | 0.990 |
| GSE13904 | 0.976 | 1.000 | 0.900 | 0.970 | 1.000 | 0.983 |
| GSE4607 | 0.947 | 0.976 | 0.875 | 0.952 | 0.933 | 0.951 |
Discussion
In the present study, 2,699 consistent DEGs were
screened from four datasets and 10 significantly stable modules
across the datasets were obtained, based on WGCNA. Subsequently,
the consistent DEGs were found to be enriched in the four stable
modules, including the magenta, purple, turquoise, and yellow
modules, which contained 12, 26, 67 and 62 genes, respectively.
Moreover, six optimal feature genes (CYSTM1, S100A9, SLC2A14, STOM,
UPP1 and UTRN) were identified from the genes included in the four
stable modules. Additionally, an effective SVM classifier based on
the six optimal genes was constructed. The results from the ROC
curve analysis showed that the SVM classifier had high sensitivity
and specificity in discriminating patients with PSS from normal
subjects. To the best of our knowledge, an SVM classifier for SS
diagnosis has not been reported previously. Therefore, the SVM
classifier of six optimal genes developed in the present study may
aid in the early identification of patients with PSS in clinical
practice.
S100A9, constitutively expressed in neutrophils, is
a member of the alarmins family, and exhibits several immune
functions, including immunological defense and homeostasis
(30). Upregulation of S100A9 at
the mRNA level in SS is related to the occurrence of
hospital-acquired infections following SS and may contribute to the
early identification of patients at high risk of infection
(31). Moreover, S100A8/S100A9
alarmins compromise the suppression of the immune system by
myeloid-derived suppressor cells, a specific inflammatory monocyte
population, by repressing their expansion, thus preventing the
development of SS in neonates (32). Endotoxin tolerance (ET) is a
critical immune dysfunction related to SS (33). Elevated S100A8 and S100A9
expression has been shown to be induced in ex vivo models of
ET, suggesting that these two genes may serve as promising
biomarkers of ET and therefore providing valuable information for
immunotherapy of patients with SS (34). The present study suggested that
S100A9 is closely related to the development and diagnosis of PSS.
CYSTM1 confers tolerance and stress responses to heavy metals
(35) and is a novel biomarker in
Huntington's disease (36). The
role of CYSTM1 in PSS is not completely understood. The results of
the present study indicated that CYSTM1 might have a role in the
mechanisms of PSS by interacting with other genes in the stable
modules.
Previous studies have revealed that genetic
variations in SLC2A14 are involved in the development and
progression of chronic diseases, including inflammatory bowel
disease (IBD) and Alzheimer's disease (37–39).
The facilitated glucose transporter 14 encoded by SLC2A14 promotes
the development of IBD and may be applied for precision
intervention of IBD (38). SLP-2
belongs to the stomatin protein family, plays a critical role in T
cell activation and is a candidate target for immunomodulation
(40). STOM expression is
dysregulated between septic children and healthy controls and may
be a diagnostic marker for pediatric sepsis (41). The present study revealed that
SLC2A14 and STOM might be involved in the pathogenesis of PSS by
mediating the inflammatory immune response.
UPP1 functions in the homeostatic regulation of
intracellular uridine concentrations and the activation of
fluoropyrimidine nucleoside chemotherapeutic agents (42). Uridine displays anti-inflammatory
action during lung inflammation (43). UTRN upregulation is implicated in
the immune reaction in Duchenne muscular dystrophy mouse models
(44). UTRN upregulation induced
by proinflammatory factor-associated post-transcriptional
mechanisms exhibits an antidystrophic effect (45). Therefore, the present study
suggested that UPP1 and UTRN might act in the development and
progression of PSS by affecting inflammation and immune reactions
as well.
To the best of our knowledge, the present study is
the first to report the diagnostic value of the aforementioned six
genes for PSS. The six genes may be useful biomarkers for the early
detection of PSS. However, in the present study the genes were not
confirmed experimentally, therefore, further investigation is
required to validate the results of the present study.
In conclusion, 2,699 consistent DEGs from four GEO
datasets were analyzed in the present study. Furthermore, a SVM
classifier based on six optimal genes was constructed for the
accurate diagnosis of PSS, which may assist in the early
identification of PSS and provide useful guidance for clinical
interventions.
Supplementary Material
Supporting Data
Acknowledgements
Not applicable.
Funding
No funding was received.
Availability of data and materials
The datasets analyzed during the current study are
available in the Gene Expression Omnibus database (www.ncbi.nlm.nih.gov/geo) with the following
accession numbers: GSE26378, GSE26440, GSE13904 and GSE4607.
Authors' contributions
GL analyzed and interpreted the microarray datasets.
CY designed the study and majorly contributed to writing the
manuscript. All authors read and approved the final manuscript.
Ethics approval and consent to
participate
Not applicable.
Patient consent for publication
Not applicable.
Competing interests
The authors declare that they have no competing
interests.
References
|
1
|
Rhee C and Klompas M: New sepsis and
septic shock definitions: Clinical implications and controversies.
Infect Dis Clin North Am. 31:397–413. 2017. View Article : Google Scholar : PubMed/NCBI
|
|
2
|
de Grooth HJ, Parienti JJ, Postema J, Loer
SA, Oudemans-van Straaten HM and Girbes AR: Positive outcomes,
mortality rates, and publication bias in septic shock trials.
Intensive Care Med. 44:1584–1585. 2018. View Article : Google Scholar : PubMed/NCBI
|
|
3
|
Checchia PA, Schierding W, Polpitiya A,
Dixon D, Macmillan S, Muenzer J, Stromberg P, Coopersmith CM,
Buchman TG and Cobb JP: Myocardial transcriptional profiles in a
murine model of sepsis: Evidence for the importance of age. Pediatr
Crit Care Med. 9:530–535. 2008. View Article : Google Scholar : PubMed/NCBI
|
|
4
|
Wynn J, Cornell TT, Wong HR, Shanley TP
and Wheeler DS: The host response to sepsis and developmental
impact. Pediatrics. 125:1031–1041. 2010. View Article : Google Scholar : PubMed/NCBI
|
|
5
|
Watson RS and Carcillo JA: Scope and
epidemiology of pediatric sepsis. Pediatr Crit Care Med. 6 (3
Suppl):S3–S5. 2005. View Article : Google Scholar : PubMed/NCBI
|
|
6
|
Schlapbach LJ, Straney L, Alexander J,
MacLaren G, Festa M, Schibler A and Slater A; ANZICS Paediatric
Study Group, : Mortality related to invasive infections, sepsis,
and septic shock in critically ill children in Australia and New
Zealand, 2002-13: A multicentre retrospective cohort study. Lancet
Infect Dis. 15:46–54. 2015. View Article : Google Scholar : PubMed/NCBI
|
|
7
|
Aneja RK and Carcillo JA: Differences
between adult and pediatric septic shock. Minerva Anestesiol.
77:986–992. 2011.PubMed/NCBI
|
|
8
|
Polat G, Ugan RA, Cadirci E and Halici Z:
Sepsis and septic shock: Current treatment strategies and new
approaches. Eurasian J Med. 49:53–58. 2017. View Article : Google Scholar : PubMed/NCBI
|
|
9
|
Grunwell JR, Weiss SL, Cvijanovich NZ,
Allen GL, Thomas NJ, Freishtat RJ, Anas N, Meyer K, Checchia PA,
Shanley TP, et al: Differential expression of the Nrf2-linked genes
in pediatric septic shock. Crit Care. 19:3272015. View Article : Google Scholar : PubMed/NCBI
|
|
10
|
Mohammed A, Cui Y, Mas VR and Kamaleswaran
R: Differential gene expression analysis reveals novel genes and
pathways in pediatric septic shock patients. Sci Rep. 9:112702019.
View Article : Google Scholar : PubMed/NCBI
|
|
11
|
Alder MN, Opoka AM, Lahni P, Hildeman DA
and Wong HR: Olfactomedin-4 is a candidate marker for a pathogenic
neutrophil subset in septic shock. Crit Care Med. 45:e426–e432.
2017. View Article : Google Scholar : PubMed/NCBI
|
|
12
|
Weng J, Wu H, Xu Z, Xi H, Chen C, Chen D,
Gong Y, Hua Y and Wang Z: The role of propionic acid at diagnosis
predicts mortality in patients with septic shock. J Crit Care.
43:95–101. 2018. View Article : Google Scholar : PubMed/NCBI
|
|
13
|
Huang S, Cai N, Pacheco PP, Narrandes S,
Wang Y and Xu W: Applications of support vector machine (SVM)
learning in cancer genomics. Cancer Genomics-Proteomics. 15:41–51.
2018.PubMed/NCBI
|
|
14
|
Polat H, Danaei Mehr H and Cetin A:
Diagnosis of chronic kidney disease based on support vector machine
by feature selection methods. J Med Syst. 41:552017. View Article : Google Scholar : PubMed/NCBI
|
|
15
|
Berikol GB, Yildiz O and Özcan İT:
Diagnosis of acute coronary syndrome with a support vector machine.
J Med Syst. 40:842016. View Article : Google Scholar : PubMed/NCBI
|
|
16
|
Wong HR, Cvijanovich N, Lin R, Allen GL,
Thomas NJ, Willson DF, Freishtat RJ, Anas N, Meyer K, Checchia PA,
et al: Identification of pediatric septic shock subclasses based on
genome-wide expression profiling. BMC Med. 7:342009. View Article : Google Scholar : PubMed/NCBI
|
|
17
|
Wong HR, Cvijanovich N, Allen GL, Lin R,
Anas N, Meyer K, Freishtat RJ, Monaco M, Odoms K, Sakthivel B, et
al: Genomic expression profiling across the pediatric systemic
inflammatory response syndrome, sepsis, and septic shock spectrum.
Crit Care Med. 37:1558–1566. 2009. View Article : Google Scholar : PubMed/NCBI
|
|
18
|
Cvijanovich N, Shanley TP, Lin R, Allen
GL, Thomas NJ, Checchia P, Anas N, Freishtat RJ, Monaco M, Odoms K,
et al: Validating the genomic signature of pediatric septic shock.
Physiol Genomics. 34:127–134. 2008. View Article : Google Scholar : PubMed/NCBI
|
|
19
|
Parrish RS and Spencer HJ III: Effect of
Normalization on significance testing for oligonucleotide
microarrays. J Biopharm Stat. 14:575–589. 2004. View Article : Google Scholar : PubMed/NCBI
|
|
20
|
Chaudhary K, Poirion OB, Lu L and Garmire
LX: Deep Learning-based multi-omics integration robustly predicts
survival in liver cancer. Clin Cancer Res. 24:1248–1259. 2018.
View Article : Google Scholar : PubMed/NCBI
|
|
21
|
Zhou Q, Su X, Jing G and Ning K:
Meta-QC-Chain: Comprehensive and fast quality control method for
metagenomic data. Genomics Proteomics Bioinformatics. 12:52–56.
2014. View Article : Google Scholar : PubMed/NCBI
|
|
22
|
Chang LC, Lin HM, Sibille E and Tseng GC:
Meta-analysis methods for combining multiple expression profiles:
Comparisons, statistical characterization and an application
guideline. BMC Bioinformatics. 14:3682013. View Article : Google Scholar : PubMed/NCBI
|
|
23
|
Li J, Zhou D, Qiu W, Shi Y, Yang JJ, Chen
S, Wang Q and Pan H: Application of weighted gene co-expression
network analysis for data from paired design. Sci Rep. 8:6222018.
View Article : Google Scholar : PubMed/NCBI
|
|
24
|
Cao J and Zhang S: A Bayesian extension of
the hypergeometric test for functional enrichment analysis.
Biometrics. 70:84–94. 2014. View Article : Google Scholar : PubMed/NCBI
|
|
25
|
Huang da W, Sherman BT and Lempicki RA:
Systematic and integrative analysis of large gene lists using DAVID
bioinformatics resources. Nat Protoc. 4:44–57. 2009. View Article : Google Scholar : PubMed/NCBI
|
|
26
|
Lu X, Yang Y, Wu F, Gao M, Xu Y, Zhang Y,
Yao Y, Du X, Li C, Wu L, et al: Discriminative analysis of
schizophrenia using support vector machine and recursive feature
elimination on structural MRI images. Medicine (Baltimore).
95:e39732016. View Article : Google Scholar : PubMed/NCBI
|
|
27
|
Deist TM, Dankers FJWM, Valdes G, Wijsman
R, Hsu IC, Oberije C, Lustberg T, van Soest J, Hoebers F, Jochems
A, et al: Machine learning algorithms for outcome prediction in
(chemo)radiotherapy: An empirical comparison of classifiers. Med
Phys. 45:3449–3459. 2018. View
Article : Google Scholar : PubMed/NCBI
|
|
28
|
Wang Q and Liu X: Screening of feature
genes in distinguishing different types of breast cancer using
support vector machine. Onco Targets Ther. 8:2311–2317.
2015.PubMed/NCBI
|
|
29
|
Robin X, Turck N, Hainard A, Tiberti N,
Lisacek F, Sanchez JC and Müller M: pROC: An open-source package
for R and S+ to analyze and compare ROC curves. BMC Bioinformatics.
12:772011. View Article : Google Scholar : PubMed/NCBI
|
|
30
|
Goyette J and Geczy CL:
Inflammation-associated S100 proteins: New mechanisms that regulate
function. Amino Acids. 41:821–842. 2011. View Article : Google Scholar : PubMed/NCBI
|
|
31
|
Fontaine M, Pachot A, Larue A, Mougin B,
Landelle C, Venet F, Allombert C, Cazalis MA, Monneret G and Lepape
A: Delayed increase of S100A9 messenger RNA predicts
hospital-acquired infection after septic shock. Crit Care Med.
39:2684–2690. 2011. View Article : Google Scholar : PubMed/NCBI
|
|
32
|
Heinemann AS, Pirr S, Fehlhaber B,
Mellinger L, Burgmann J, Busse M, Ginzel M, Friesenhagen J, von
Köckritz-Blickwede M, Ulas T, et al: In neonates S100A8/S100A9
alarmins prevent the expansion of a specific inflammatory monocyte
population promoting septic shock. FASEB J. 31:1153–1164. 2017.
View Article : Google Scholar : PubMed/NCBI
|
|
33
|
Pena OM, Hancock DG, Lyle NH, Linder A,
Russell JA, Xia J, Fjell CD, Boyd JH and Hancock RE: An endotoxin
tolerance signature predicts sepsis and organ dysfunction at
initial clinical presentation. EBioMedicine. 1:64–71. 2014.
View Article : Google Scholar : PubMed/NCBI
|
|
34
|
Fontaine M, Planel S, Peronnet E,
Turrel-Davin F, Piriou V, Pachot A, Monneret G, Lepape A and Venet
F: S100A8/A9 mRNA induction in an ex vivo model of endotoxin
tolerance: Roles of IL-10 and IFNγ. PLoS One. 9:e1009092014.
View Article : Google Scholar : PubMed/NCBI
|
|
35
|
Venancio TM and Aravind L: CYSTM, a novel
cysteine-rich transmembrane module with a role in stress tolerance
across eukaryotes. Bioinformatics. 26:149–152. 2010. View Article : Google Scholar : PubMed/NCBI
|
|
36
|
Mastrokolias A, Ariyurek Y, Goeman JJ, van
Duijn E, Roos RA, van der Mast RC, van Ommen GB, den Dunnen JT, 't
Hoen PA and van Roon-Mom WM: Huntington's disease biomarker
progression profile identified by transcriptome sequencing in
peripheral blood. Eur J Hum Genet. 23:1349–1356. 2015. View Article : Google Scholar : PubMed/NCBI
|
|
37
|
Amir Shaghaghi M, Murphy B and Eck P: The
SLC2A14 gene: Genomic locus, tissue expression, splice variants,
and subcellular localization of the protein. Biochem Cell Biol.
94:331–335. 2016. View Article : Google Scholar : PubMed/NCBI
|
|
38
|
Amir Shaghaghi M, Zhouyao H, Tu H,
El-Gabalawy H, Crow GH, Levine M, Bernstein CN and Eck P: The
SLC2A14 gene, encoding the novel glucose/dehydroascorbate
transporter GLUT14, is associated with inflammatory bowel disease.
Am J Clin Nutr. 106:1508–1513. 2017. View Article : Google Scholar : PubMed/NCBI
|
|
39
|
Wang W, Yu JT, Zhang W, Cui WZ, Wu ZC,
Zhang Q and Tan L: Genetic association of SLC2A14 polymorphism with
Alzheimer's disease in a Han Chinese population. J Mol Neurosci.
47:481–484. 2012. View Article : Google Scholar : PubMed/NCBI
|
|
40
|
Kirchhof MG, Chau LA, Lemke CD, Vardhana
S, Darlington PJ, Márquez ME, Taylor R, Rizkalla K, Blanca I,
Dustin ML and Madrenas J: Modulation of T cell activation by
stomatin-like protein 2. J Immunol. 181:1927–1936. 2008. View Article : Google Scholar : PubMed/NCBI
|
|
41
|
Li Y, Li Y, Bai Z, Pan J, Wang J and Fang
F: Identification of potential transcriptomic markers in developing
pediatric sepsis: A weighted gene co-expression network analysis
and a case-control validation study. J Transl Med. 15:2542017.
View Article : Google Scholar : PubMed/NCBI
|
|
42
|
Roosild TP and Castronovo S: Active site
conformational dynamics in human uridine phosphorylase 1. PLoS One.
5:e127412010. View Article : Google Scholar : PubMed/NCBI
|
|
43
|
Evaldsson C, Ryden I and Uppugunduri S:
Anti-inflammatory effects of exogenous uridine in an animal model
of lung inflammation. Int Immunopharmacol. 7:1025–1032. 2007.
View Article : Google Scholar : PubMed/NCBI
|
|
44
|
Yamamoto K, Yuasa K, Miyagoe Y, Hosaka Y,
Tsukita K, Yamamoto H, Nabeshima YI and Takeda S: Immune response
to adenovirus-delivered antigens upregulates utrophin and results
in mitigation of muscle pathology in mdx mice. Hum Gene Ther.
11:669–680. 2000. View Article : Google Scholar : PubMed/NCBI
|
|
45
|
Waheed I, Gilbert R, Nalbantoglu J,
Guibinga GH, Petrof BJ and Karpati G: Factors associated with
induced chronic inflammation in mdx skeletal muscle cause
posttranslational stabilization and augmentation of extrasynaptic
sarcolemmal utrophin. Hum Gene Ther. 16:489–501. 2005. View Article : Google Scholar : PubMed/NCBI
|