Introduction
Osteosarcoma (OS) is one of the most common primary
malignancies that occurs in bone tissues, resulting in ~9% of
cancer-related deaths in adolescents and children between the ages
of 10 and 24 (1); in the past 60
years, a second peak of incidence has been observed (2). OS demonstrates a high probability to
metastasize and damage surrounding tissues, especially within the
lung; however, despite the existence of surgical excision and the
development of neoadjuvant chemotherapies for patients with OS over
the past few decades, the prognosis of OS for 20 year survival
remains <20% (3). This poor
prognosis is largely due to the anatomical location, tumor size,
tumor stage, presence or absence of local recurrence and
metastasis, in addition to ineffective chemotherapy regimens
(4). Thus, the development of new
patient treatment strategies for OS is urgently required. There is
evidence to suggest that the regulation of oncogenes and tumor
suppressors serve vital roles in the progression of OS (5). Hence, it is of great importance to
identify the molecular mechanism of OS metastasis to improve the
diagnosis and treatment of osteosarcoma.
The C-type lectins are the largest family of lectins
and belong to a group of proteins involved in various functions,
such as cell differentiation, migration and proliferation. Most
members of the family have the C-type carbohydrate recognition
domain located on the outer surface of the cell, which under
physical stress, can specifically identify and bind to proteins,
lipids and carbohydrates in a Ca2+-dependent manner
(6). Dysfunctional C-type lectins
have been reported in various pathological states, including
cancer; for example, Wang et al (7) observed that C-type-lectin-like-2
promoted the proliferation and migration of gastric cancer cells by
regulating the AKT signaling pathway. Ni et al (8) demonstrated that high expression
levels of the C-type lectin domain family 3 member A (CLEC3A) were
positively associated with poor prognosis in patients with invasive
ductal carcinoma of the breast. In addition, as a member of the
C-type lectin superfamily, CLEC3A was originally identified in
cartilage, and a previous study reported that CLEC3A was involved
in bone formation (6); however,
the effect and molecular mechanism of CLEC3A in OS is largely
unknown.
In the present study, the expression levels of
CLEC3A were observed to be increased in OS tissues, which was
associated with TNM stage and lymph node metastasis. Furthermore,
the suppression of CLEC3A using small interfering RNA (siRNA)
inhibited OS cell proliferation and promoted their chemosensitivity
through the AKT1/mTOR/hypoxia-inducible factor 1-α (HIF1α)
signaling pathway. These findings may contribute to the development
of a novel targeted therapy for the diagnosis and treatment of
OS.
Materials and methods
Patient studies
The present study was approved by the ethics
committee of the Maternal and Child Health Hospital of Guiyang
Province and was performed in accordance with the principles
embodied in the Declaration of Helsinki. Written informed consent
was obtained from all patients who provided samples. Clinical OS
tissue and tumor-adjacent normal samples from patients with OS were
obtained from the Maternal and Child Health Hospital of Guiyang
Province between June 2015 and March 2019. A total of 30 patients
(male/female=17/13; age range: 8–66 years; mean age: 17.3) enrolled
in the present study: All of them provided OS tissues and 15 of
them also provided adjacent tissues.
Bioinformatics method
Gene expression profile data GSE99671 was obtained
from the Gene Expression Omnibus (http://www.ncbi.nlm.nih.gov/geo). This profile was
provided by Ho et al (9),
and includes 18 OS tissues and 18 corresponding tissues. The gene
expression profile data were normalized and differently expressed
analysis performed using R software (version 3.5.2; The R
Foundation; http://www.r-project.org/) (10). Log fold change (LogFC)>2 and
adjusted P-value<0.05 were selected as cut-offs for
differentially expression.
Cell culture and reagents
The human OS cell lines SaOS-2 and MG63 were
purchased from the American Type Culture Collection. Cells were
cultured in DMEM (Gibco; Thermo Fisher Scientific, Inc.),
supplemented with 10% FBS (Gibco; Thermo Fisher Scientific, Inc.)
and maintained in a humidified at atmosphere at 37°C and 5%
CO2.
Reverse transcription-quantitative PCR
(RT-qPCR)
Total RNA was extracted from OS tissues (0.5×0.5×0.3
cm), adjacent tissues (0.5×0.5×0.3 cm) and cells lines (MG63 and
SaSO-2, 5×10⁵ cells) using TRIzol® reagent
[Yeasen Biotechnology (Shanghai) Co., Ltd.], according to the
manufacturer's protocol. Total RNA was reverse transcribed into
cDNA using the PrimeScript RT reagent kit [Yeasen Biotechnology
(Shanghai) Co., Ltd.] according to the manufacturer's protocol.
qPCR was subsequently performed using SYBR Green qPCR Master Mix
[Yeasen Biotechnology (Shanghai) Co., Ltd.]. The following primer
pairs were used for the qPCR: CLEC3A forward,
5′-CGAGGCACTAAAGTTCACAAGA-3′ and reverse,
5′-CGGAGTTCCTGGGGATAACCA-3′; AKT1 forward,
5′-AGCGACGTGGCTATTGTGAAG-3′ and reverse,
5′-GCCATCATTCTTGAGGAGGAAGT-3′; MCL1 forward,
5′-TGCTTCGGAAACTGGACATCA-3′ and reverse,
5′-TAGCCACAAAGGCACCAAAAG-3′; GLUT1 forward,
5′-GGCCAAGAGTGTGCTAAAGAA-3′ and reverse,
5′-ACAGCGTTGATGCCAGACAG-3′; VEGF forward,
5′-AGGGCAGAATCATCACGAAGT-3′ and reverse,
5′-AGGGTCTCGATTGGATGGCA-3′; β-actin forward,
5′-CATGTACGTTGCTATCCAGGC-3′ and reverse,
5′-CTCCTTAATGTCACGCACGAT-3′. The following thermocycling conditions
were used for qPCR: Initial denaturation at 95°C for 30 sec; and 40
cycles of 95°C for 30 sec and 60°C for 30 sec. Expression levels
were quantified using the 2−ΔΔCq method (11) and the internal reference gene
β-actin acted as the control.
Immunohistochemical (IHC)
staining
OS tissues were fixed using 4% paraformaldehyde for
30 min under room temperature, dehydrated using a Rapid Tissue
Processor (Sakura Seiki Co., Ltd.) under room temperature, embedded
in paraffin (Wuhan Servicobio Technology Co., Ltd.) and
subsequently cut into 2-µm sections. Sections were deparaffinized,
and then rehydrated with xylene and a descending alcohol series at
room temperature, respectively. Following restoration by sodium
citrate (100 mM) at room temperature, the sections were blocked
with 3% H2O2 and 5% BSA (Wuhan Servicobio
Technology Co., Ltd.) at room temperature and subsequently
incubated with an anti-CLEC3A primary antibody (1:400; cat. no.
ab185282; Abcam) for 16 h at 4°C. Following the primary incubation,
the sections were incubated with a horseradish peroxidase
(HRP)-conjugated secondary antibody (1:400, cat no. G1210-2-A-100,
Wuhan Servicobio Technology Co., Ltd.) for 2 h at room temperature.
The slides were subsequently stained using a Cell and Tissue
Staining HRP-3,3′-diaminobenzidine kit (Wuhan Servicobio Technology
Co., Ltd.) and the nuclear counterstain was used 0.2% hematoxylin
at room temperature for 1 min. The staining was visualized using an
light microscope (magnification, ×100).
Cell transfection
CLEC3A siRNA (si-CLEC3A) and control siRNA
[si-negative control (NC)] were obtained from Shanghai GenePharma,
Co., Ltd.; CLEC3A overexpression plasmid and empty plasmid were
purchased from Sangon Biotech Co., Ltd. The si-CLEC3A sequence was
5′-CAGAAGTCAATGCCTTGAAGGAAAT-3′. The si-NC sequence was
5′-ACGAGACACGAACGGAGAATT-3′. A total of 1×10⁵ MG63 and
SaOS-2 cells were plated into 6-well plates and upon reaching
50–60% confluence, si-CLEC3A, control siRNA, the CLEC3A
overexpression plasmid and the empty plasmid (all 10 µm) were
transfected into OS cells using Lipofectamine® 2000
reagent (Invitrogen; Thermo Fisher Scientific, Inc.), according to
the manufacturer's protocol. Following 48 h of transfection, the
efficiency of si-CLEC3A or CLEC3A overexpression plasmid was
detected by RT-qPCR and western blotting. Similarly, subsequent
experimentation was also performed after 48 h of transfection.
Cell viability assay
A total of 4×10³ MG63 and SaOS-2
cells/well were plated into 96-well plates and co-cultured with
cisplatin (CDDP, MedChemExpress LLC; 0, 0.25, 1, 2, 4 and 8 µM),
doxorubicin (DOX, MedChemExpress LLC; 0, 0.25, 1, 2, 4 and 8 µM) or
SC79 (MedChemExpress LLC, 5 µM) for 48 h at 37°C. Subsequently, 10
µl Cell Counting Kit-8 reagent (Dojindo Molecular Technologies,
Inc.) was added to each well according to the manufacturer's
protocol. Following incubation for 2 h at 37°C, the absorbance was
measured at 450 nm using a microplate reader. To calculate the
IC50, the inhibitory rate of each concentration were
exported into GraphPad Prism version 6.0 software (GraphPad
Software, Inc.) and linear regression analysis performed. After
obtaining the corresponding linear regression equation, inhibitory
rate=50 was substituted into corresponding equation and the
IC50 was calculated.
Colony formation assay
Following transfection for 24 h, a total of
1×10³ MG63 and SaOS-2 cells/well were plated into
six-well plates. To detect chemosensitivity, CDDP (2 µM), DOX (2
µM) or SC79 (5 µM) were added in the well on the second day for 2
weeks at 37°C. The medium was changed every third day. At 2 weeks
after plating, the cells were fixed with 4% paraformaldehyde for 30
min at room temperature and subsequently stained with 0.1% crystal
violet for 15 min at room temperature. Colonies with area >10
mm2 were counted.
Cell cycle analysis
Following transfection for 24 h, 1×10⁶
MG63 and SaOS-2 cells were harvested by centrifugation (600 × g) at
room temperature for 5 min and fixed with PBS containing 75%
ice-cold ethanol overnight at −20°C. Cells were subsequently
incubated with 10 µg/ml propidium iodide solution (Invitrogen;
Thermo Fisher Scientific, Inc.) at room temperature. Flow cytometry
was performed using a BD FACSCalibur™ flow cytometer (BD
Biosciences; version: 343020) to detect the cell cycle distribution
and FlowJo (version no. 7.6.1; FlowJo LLC) was used for
analysis.
Western blotting
Total protein of 2×10⁶ MG63 and SaOS-2
cells was extracted using RIPA lysis buffer (Boster Biological
Technology) containing 1:50 EDTA-free Protease Inhibitor Cocktail
(Boster Biological Technology) and phenylmethylsulfonyl fluoride
(Boster Biological Technology). Cell lysates were centrifuged
(8,000 × g) for 15 min at 4°C to separate protein from cellular
debris. Total protein was quantified using a Bicinchoninic Acid
assay (Boster Biological Technology) and proteins (30 µg) were
separated by 10% SDS-PAGE. The separated proteins were subsequently
transferred onto PVDF membranes (Merck KGaA) and blocked in 5% skim
milk with TBS-Tween-20 (0.1%) for 2 h (TBST) at room temperature.
The membranes were incubated with the following primary antibodies
at 4°C overnight: Anti-CLEC3A (1:1,000; cat no. H00010143-B01;
Abnova), anti-AKT (1:1,000; cat no. 10176-2-AP), anti-mTOR
(1:1,000; cat no. 66888-1-Ig), anti-HIF1α (1:1,000; cat no.
20960-1-AP), anti-GLUT1 (1:1,000; cat no. 21829-1-AP,), anti-VEGF
(1:1,000; cat no. 19003-1-AP), anti-MCL1 (1:1,000; cat no.
16225-1-AP) and anti-β-actin (1:1,000; cat no. 60008-1-Ig).
Subsequently, the PVDF membranes were washed with TBST three times
(10 min each) and incubated with HRP-conjugated secondary goat
anti-mouse (1:3,000; cat no. SA00001-1) and goat anti-rabbit
antibody (1:3,000; cat no. SA00001-2; all from ProteinTech Group,
Inc.) for 2 h at 37°C. The membranes were washed three times (10
min each) with TBST and protein bands were visualized using high
sensitivity ECL regent (Boster Biological Technology) in an
enhanced chemiluminescence (ChemiDoc) system (Bio-Rad Laboratories,
Inc.) with hypersensitive ECL reagent (cat no. AR1170; Wuhan Boster
Biological Technology, Ltd.).
Immunofluorescence staining
Total of 1×10⁵ si-NC- and
si-CLEC3A-transfected MG63 OS cells were fixed with 4%
paraformaldehyde for 10 min at room temperature, permeabilized with
0.5% Triton X-100 (Wuhan Servicebio Technology Co., Ltd.) for 10
min at room temperature and blocked with 5% BSA (Wuhan Servicebio
Technology Co., Ltd.) for 30 min at room temperature. The cells
were subsequently incubated with rabbit anti-HIF1α primary antibody
(1:100; cat no. 20960-1-AP; ProteinTech Group, Inc.) overnight at
4°C. Following washing with PBS three times, MG63 cells were
incubated with Cy3-conjugated anti-rabbit IgG for 2 h at room
temperature. Nuclei were counterstained with DAPI for 10 min at
room temperature and stained slides were visualized by fluorescence
microscopy (magnification, ×200).
Statistical analysis
Statistical analysis of three independent
experimental repeats was performed using GraphPad Prism version 6.0
software (GraphPad Software, Inc.). Data were presented as mean ±
standard deviation. Significant differences between >2 groups
was determined using one-way ANOVA and Fisher's Least Significant
Difference post hoc test, whereas Student's t-tests were used to
analyze the statistical significance between two groups.
Co-expression relationships were analyzed using Pearson correlation
analysis, with R >0.3 and P<0.05 set as cut-offs.
Associations between CLEC3A expression and clinical characteristics
were analyzed using χ2 tests, and patients were divided
into high or low groups based the median expression value of
CLEC3A. P<0.05 was considered to indicate a statistically
significant difference.
Results
CLEC3A expression is increased in OS
tissue, and associated with TNM stage and lymph node
metastasis
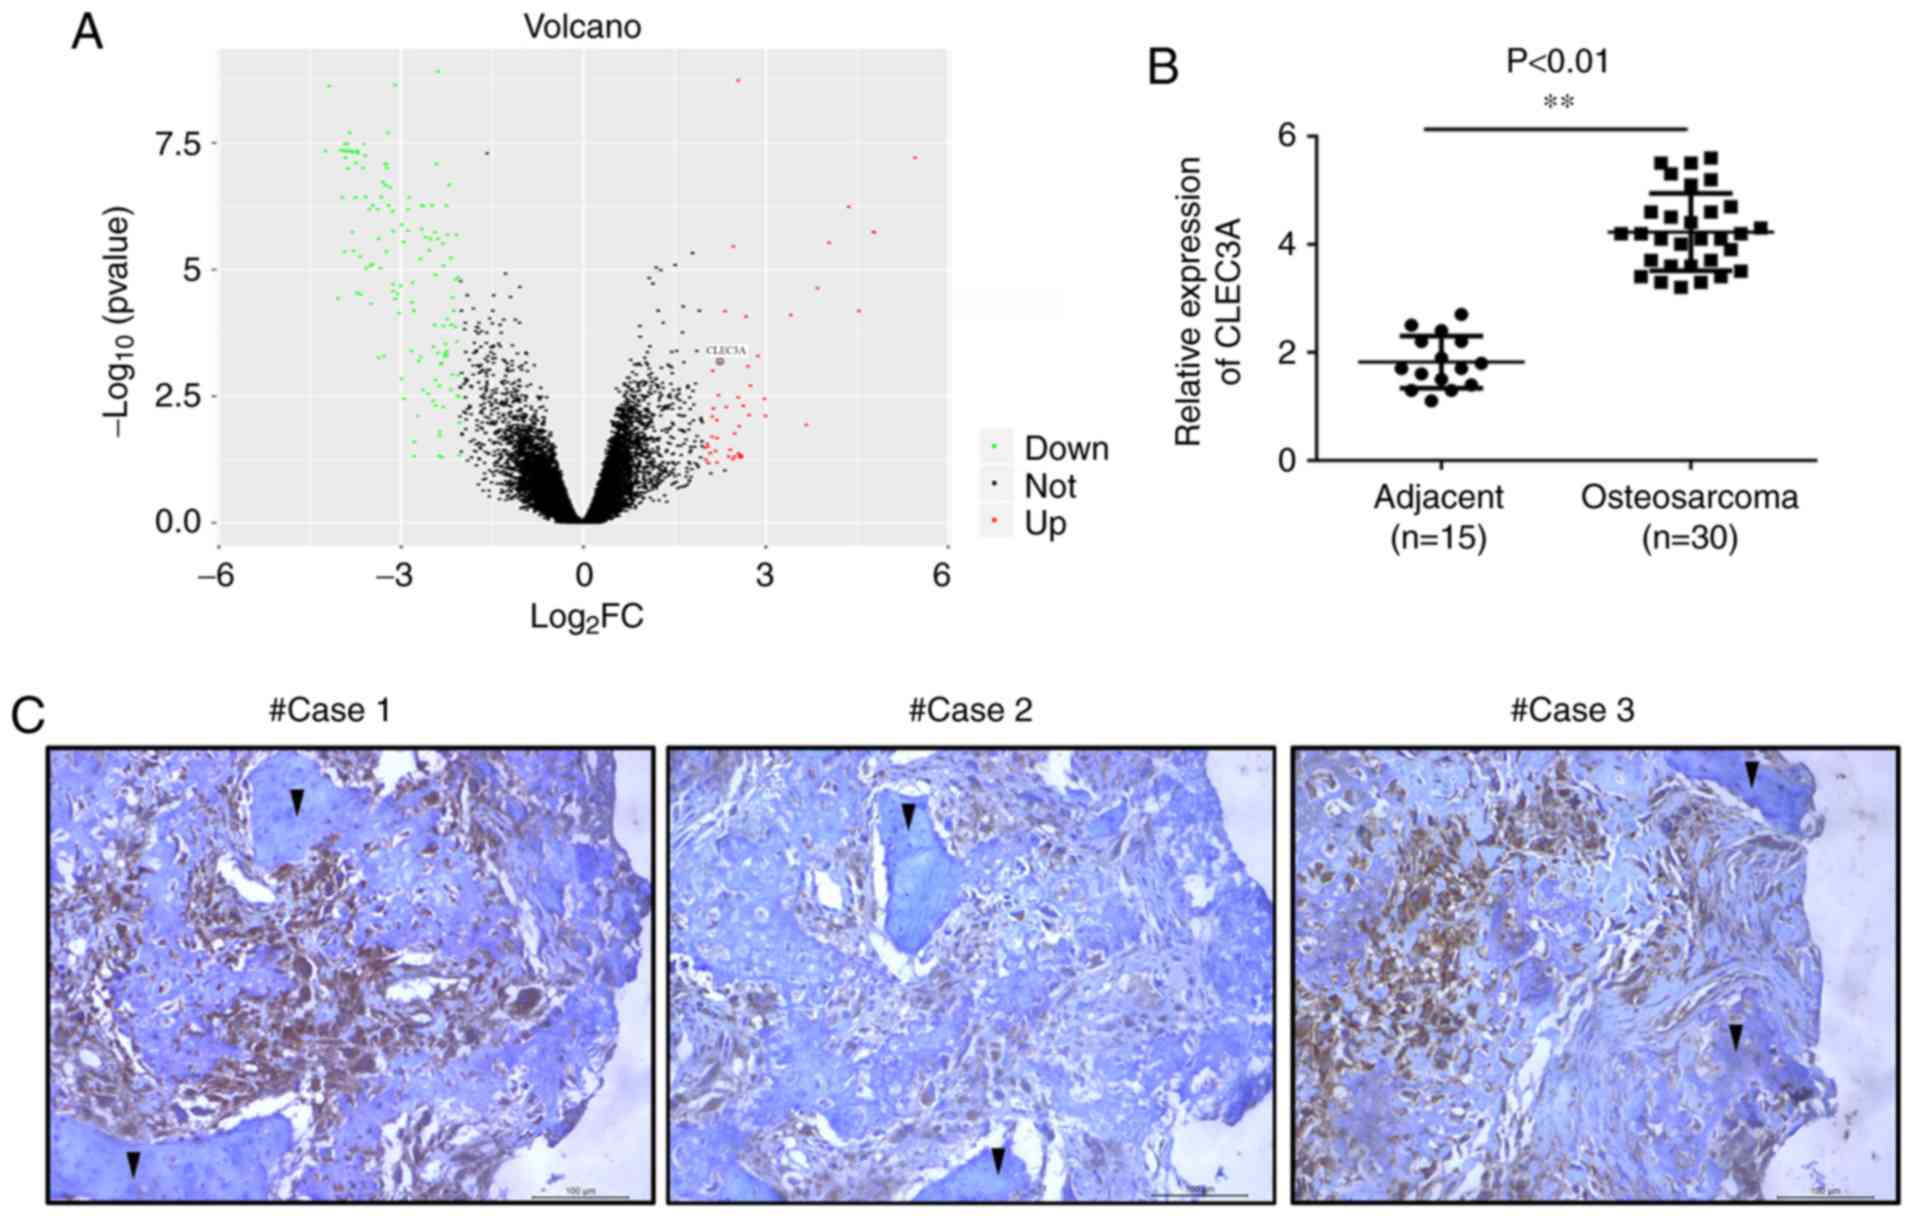
The gene expression profile data of GSE99671,
including 18 tumor tissues and 18 adjacent normal bone tissues,
were analyzed. Within the GSE99671 dataset, CLEC3A expression
levels were found to be upregulated in OS tumor tissue compared
with adjacent normal bone tissue (Fig.
1A). To verify these results, the expression levels of CLEC3A
were analyzed in OS tissues from patients using RT-qPCR. The mRNA
expression levels of CLEC3A were significantly increased in OS
tissues (n=30) compared with adjacent non-tumor tissues (n=15;
Fig. 1B). Subsequently, IHC
staining was used to detect the protein expression levels of CLEC3A
in OS tissues and observe the erosion of normal bone tissue by
tumor cells; the protein expression levels of CLEC3A in OS cells
were markedly high, whereas expression levels in normal bone cells
were low (Fig. 1C). According to
the mRNA expression level of CLEC3A, patient OS tissues were
divided into low expression and high expression groups (Table I), and the expression of CLEC3A was
demonstrated to be positively associated with TNM stage and lymph
node metastasis, but not age or tumor size (Table I).
 | Table I.Clinicopathological variables
associated with 30 patients with osteosarcoma. |
Table I.
Clinicopathological variables
associated with 30 patients with osteosarcoma.
|
|
| C-type lectin
domain family 3 member A expression |
|
|---|
|
|
|
|
|
|---|
| Variable | n | High | Low | P-value |
|---|
| Age |
|
|
| 0.713 |
|
<60 | 17 | 8 | 9 |
|
|
≥60 | 13 | 7 | 6 |
|
| Tumor size
(cm) |
|
|
|
|
|
<5 | 16 | 10 | 6 | 0.143 |
| ≥5 | 14 | 5 | 9 |
|
| TNM stage |
|
|
|
|
|
I–II | 14 | 4 | 10 | 0.028 |
|
III–IV | 16 | 11 | 5 |
|
| Lymph node
metastasis |
|
|
|
|
| No | 12 | 3 | 9 | 0.025 |
|
Yes | 18 | 12 | 6 |
|
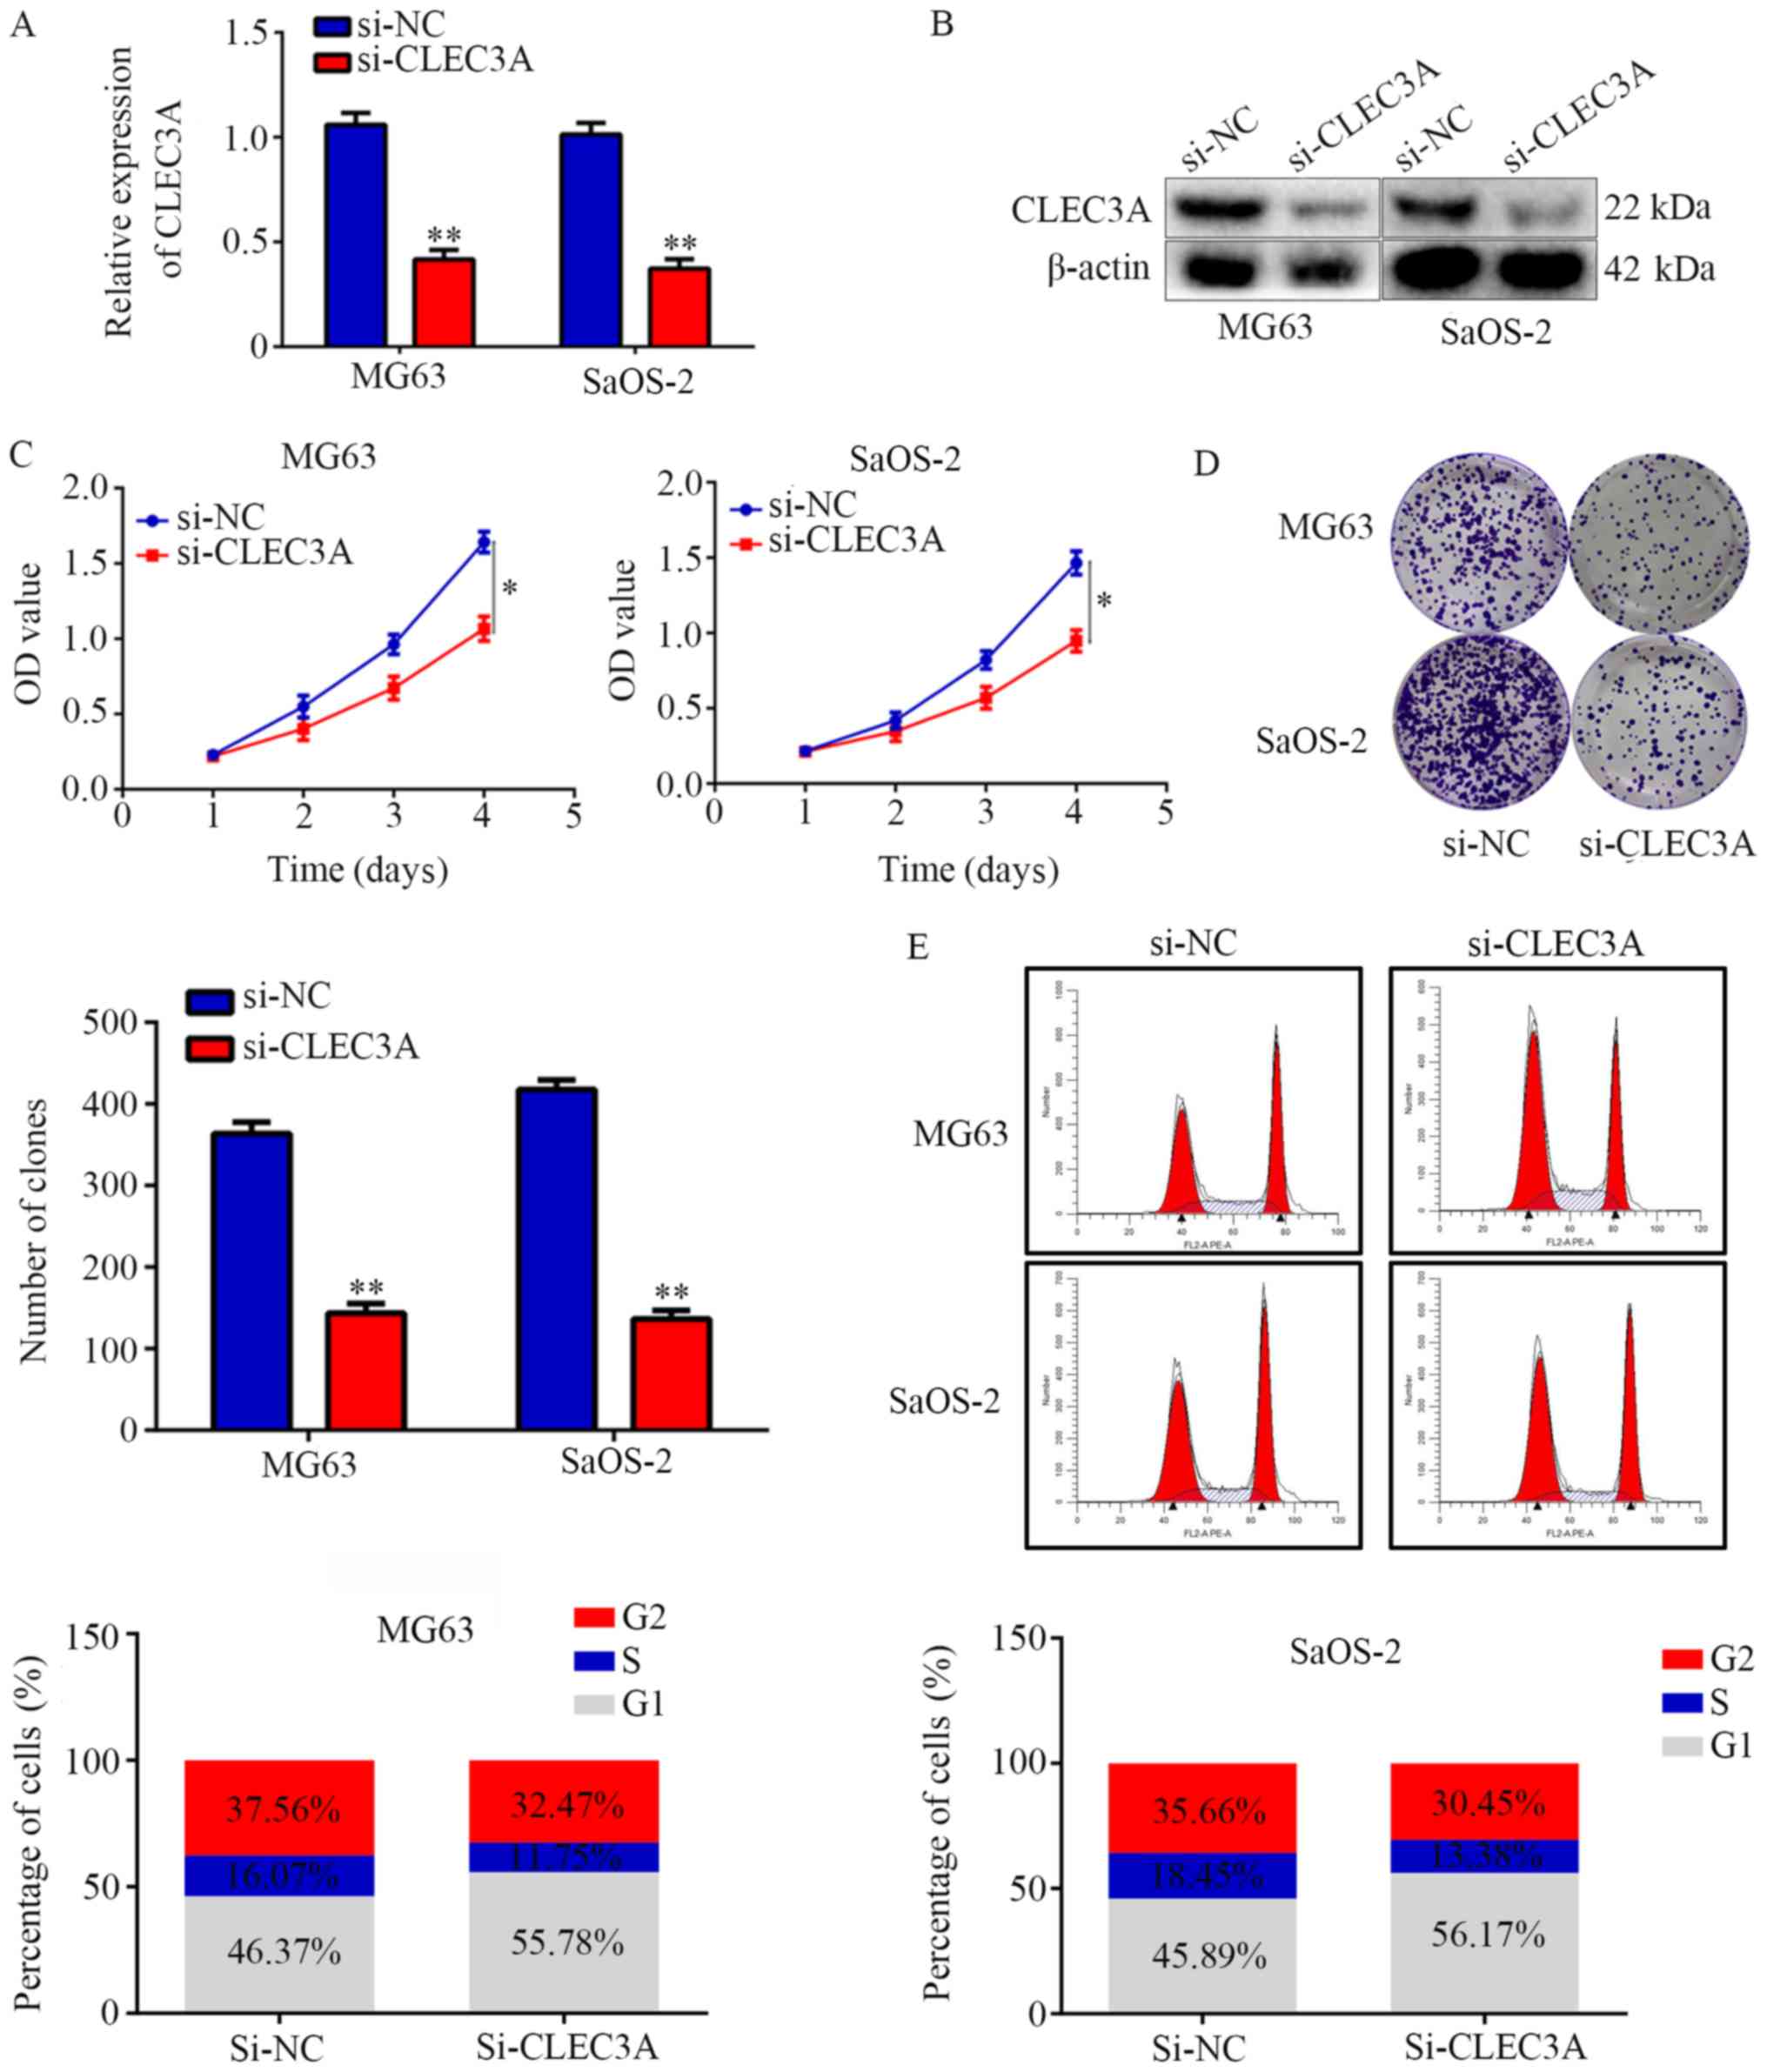
Inhibition of CLEC3A decreases OS cell
proliferation and induces G1 phase arrest
To investigate the role of CLEC3A in OS, si-CLEC3A
was used to transiently knock down CLEC3A in the OS cell
lines MG63 and SaOS-2; the transfection efficiency was confirmed as
successful following RT-qPCR and western blotting analyses of mRNA
and protein expression levels in cells transfected with si-CLEC3A
compared with si-NC (Fig. 2A and
B). The silencing of CLEC3A with si-CLEC3A significantly
decreased the proliferation of MG63 and SaOS-2 OS cells at day 4
compared with si-NC-transfected cells (Fig. 2C). Colony formation assays were
subsequently performed to evaluate the effects of CLEC3A on OS cell
colony forming ability; the results demonstrated that knockdown of
CLEC3A significantly decreased the number of colonies formed by
both MG63 and SaOS-2 cells compared with si-NC-transfected cells
(Fig. 2D). Furthermore,
si-CLEC3A-transfected cells were observed to have an increased
proportion of cells in the G1 phase compared with the NC (Fig. 2E). Taken together, these findings
suggested that the genetic knockdown of CLEC3A may decrease OS cell
proliferation and induce G1 phase arrest.
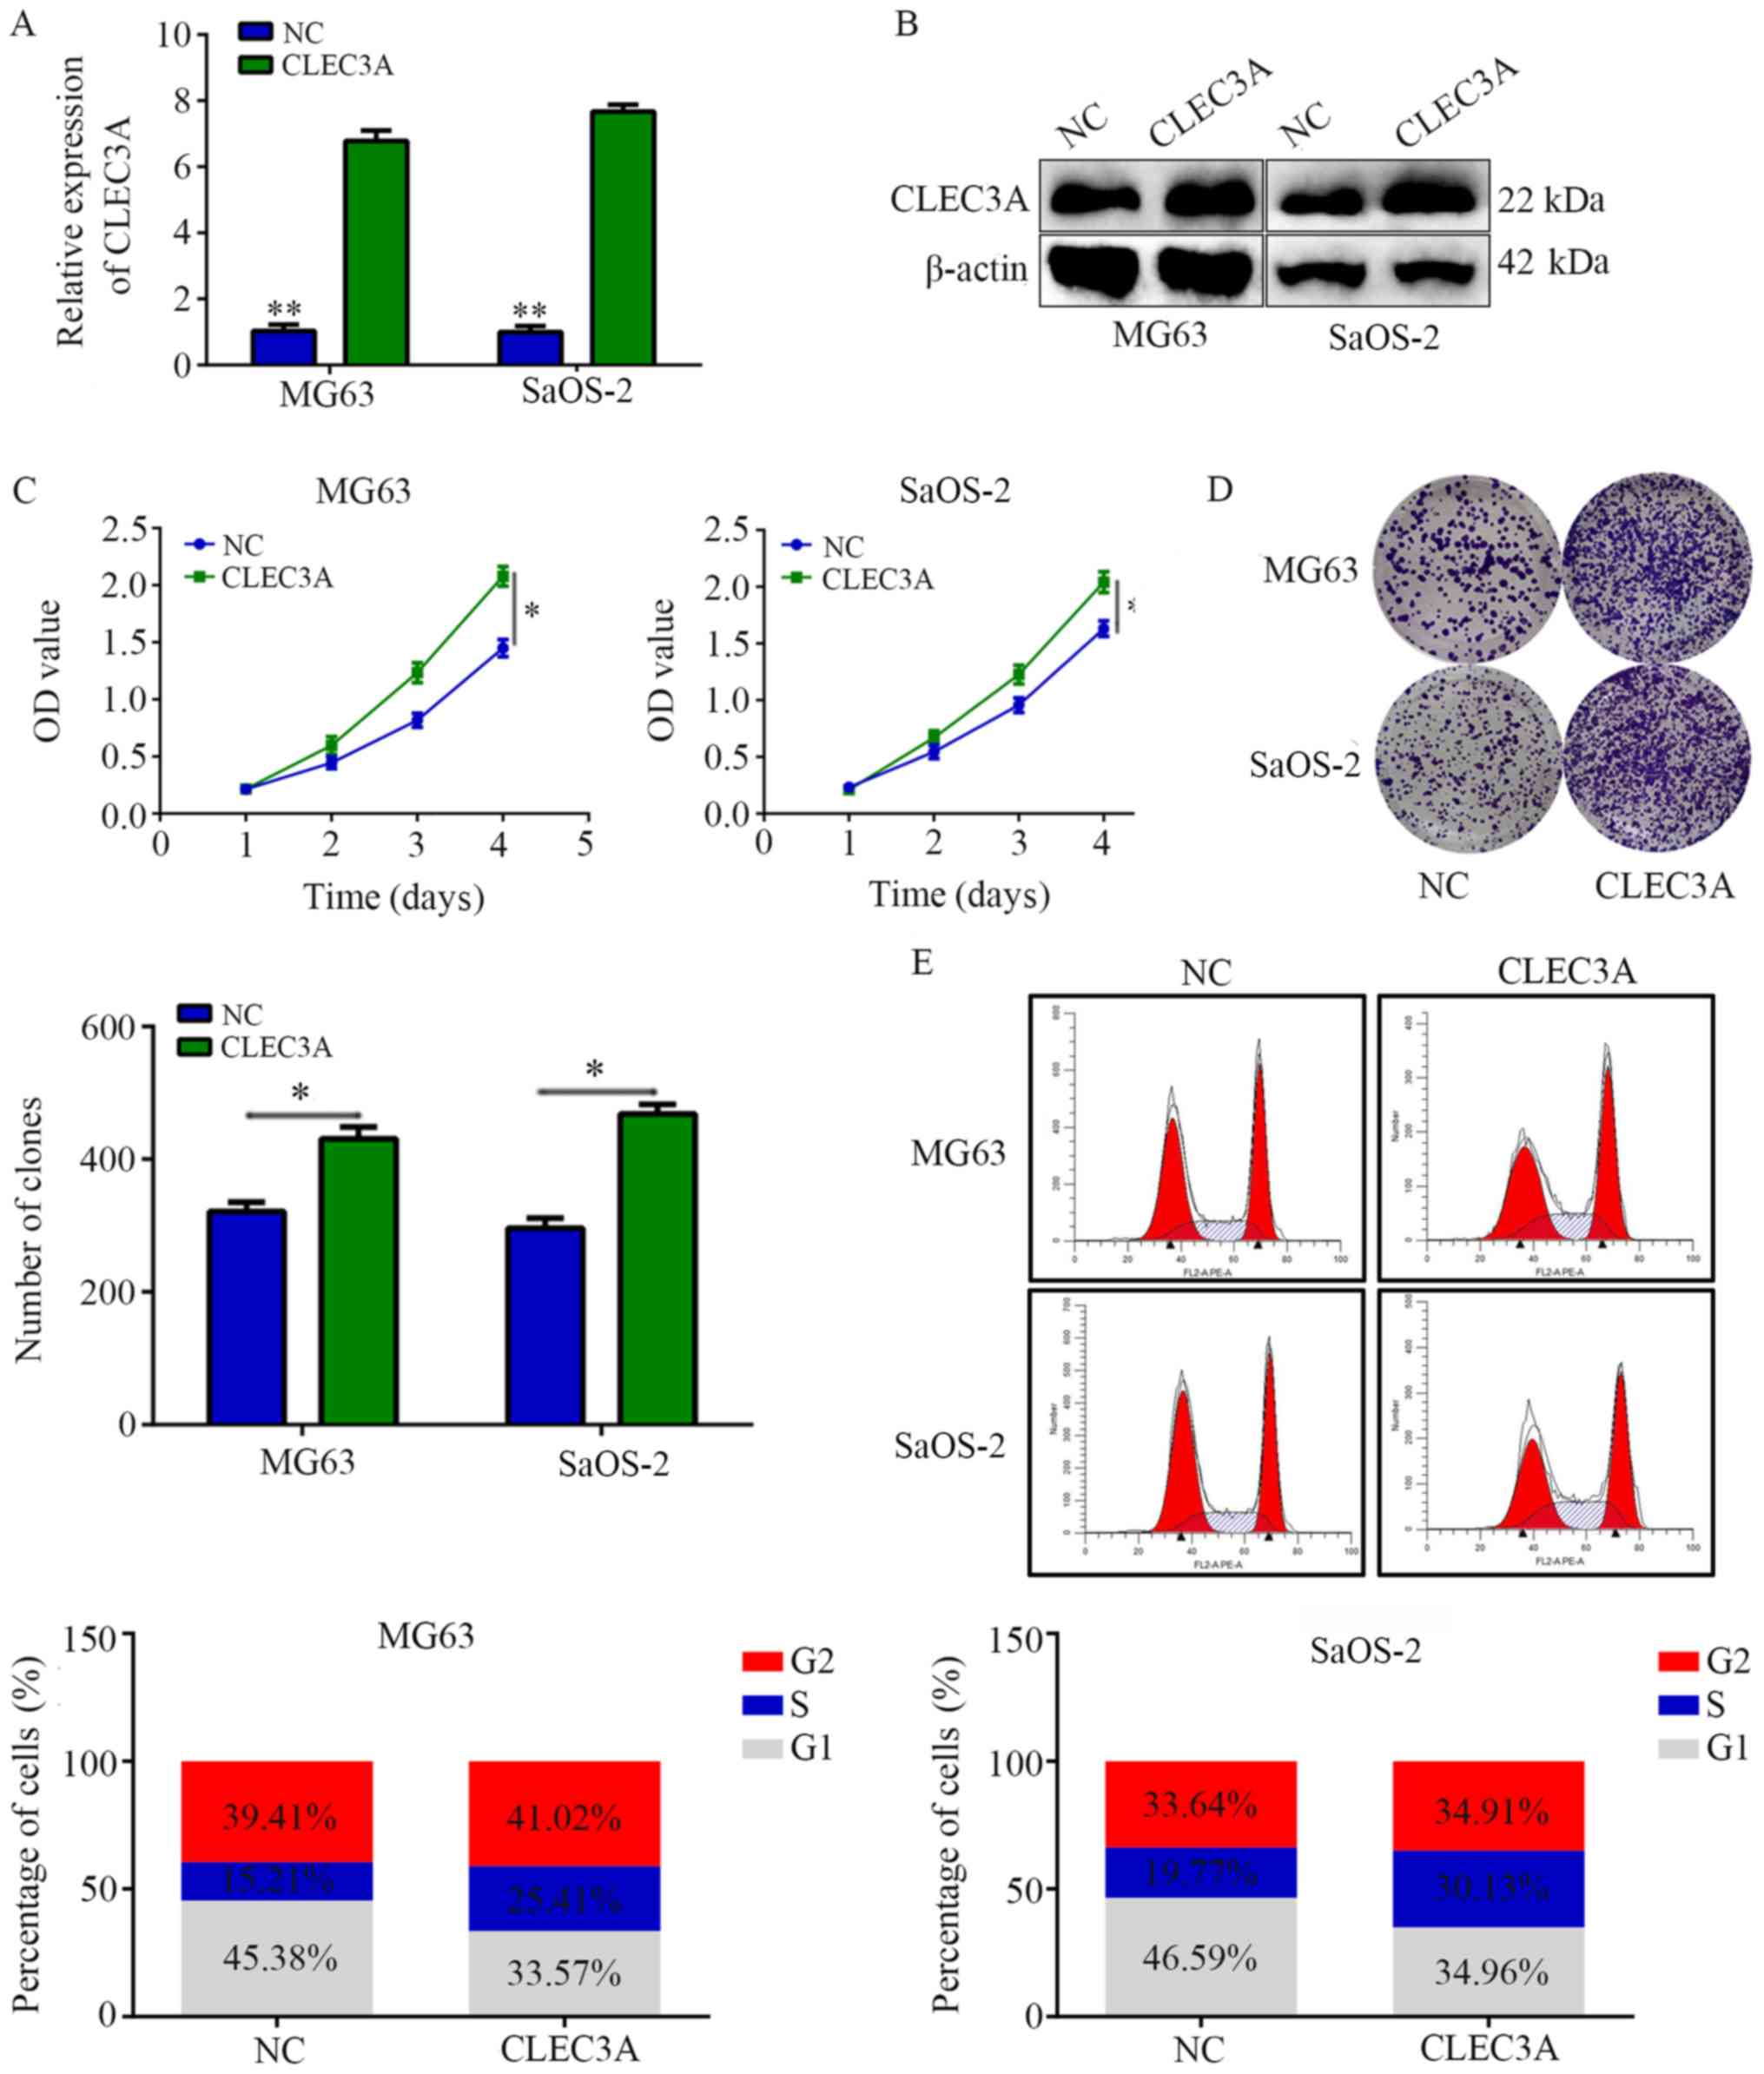
Overexpression of CLEC3A increases
cell proliferation and decreases G1 phase arrest
A CLEC3A overexpression plasmid was used to
construct CLEC3A-overexpressing MG63 cells and SaOS-2 cells; the
transfection efficiency was confirmed as successful following
RT-qPCR and western blotting analyses of mRNA and protein
expression levels in cells overexpressing CLEC3A compared with NC
cells (Fig. 3A and B). CCK-8
assays revealed that the overexpression of CLEC3A significantly
increased the proliferation rate at 4 days of MG63 and SaOS-2 cells
compared with the NC (Fig. 3C).
Similarly, through colony formation assays, it was observed that
the overexpression of CLEC3A significantly increased the number of
colonies formed in both MG63 and SaOS-2 cells compared with the NC
(Fig. 3D). Furthermore, cell cycle
distribution analysis found that the proportion of cells in G1
phase was decreased in the CLEC3A overexpression group, whereas the
proportion of cells increased in the S phase compared with the NC
group (Fig. 3E).
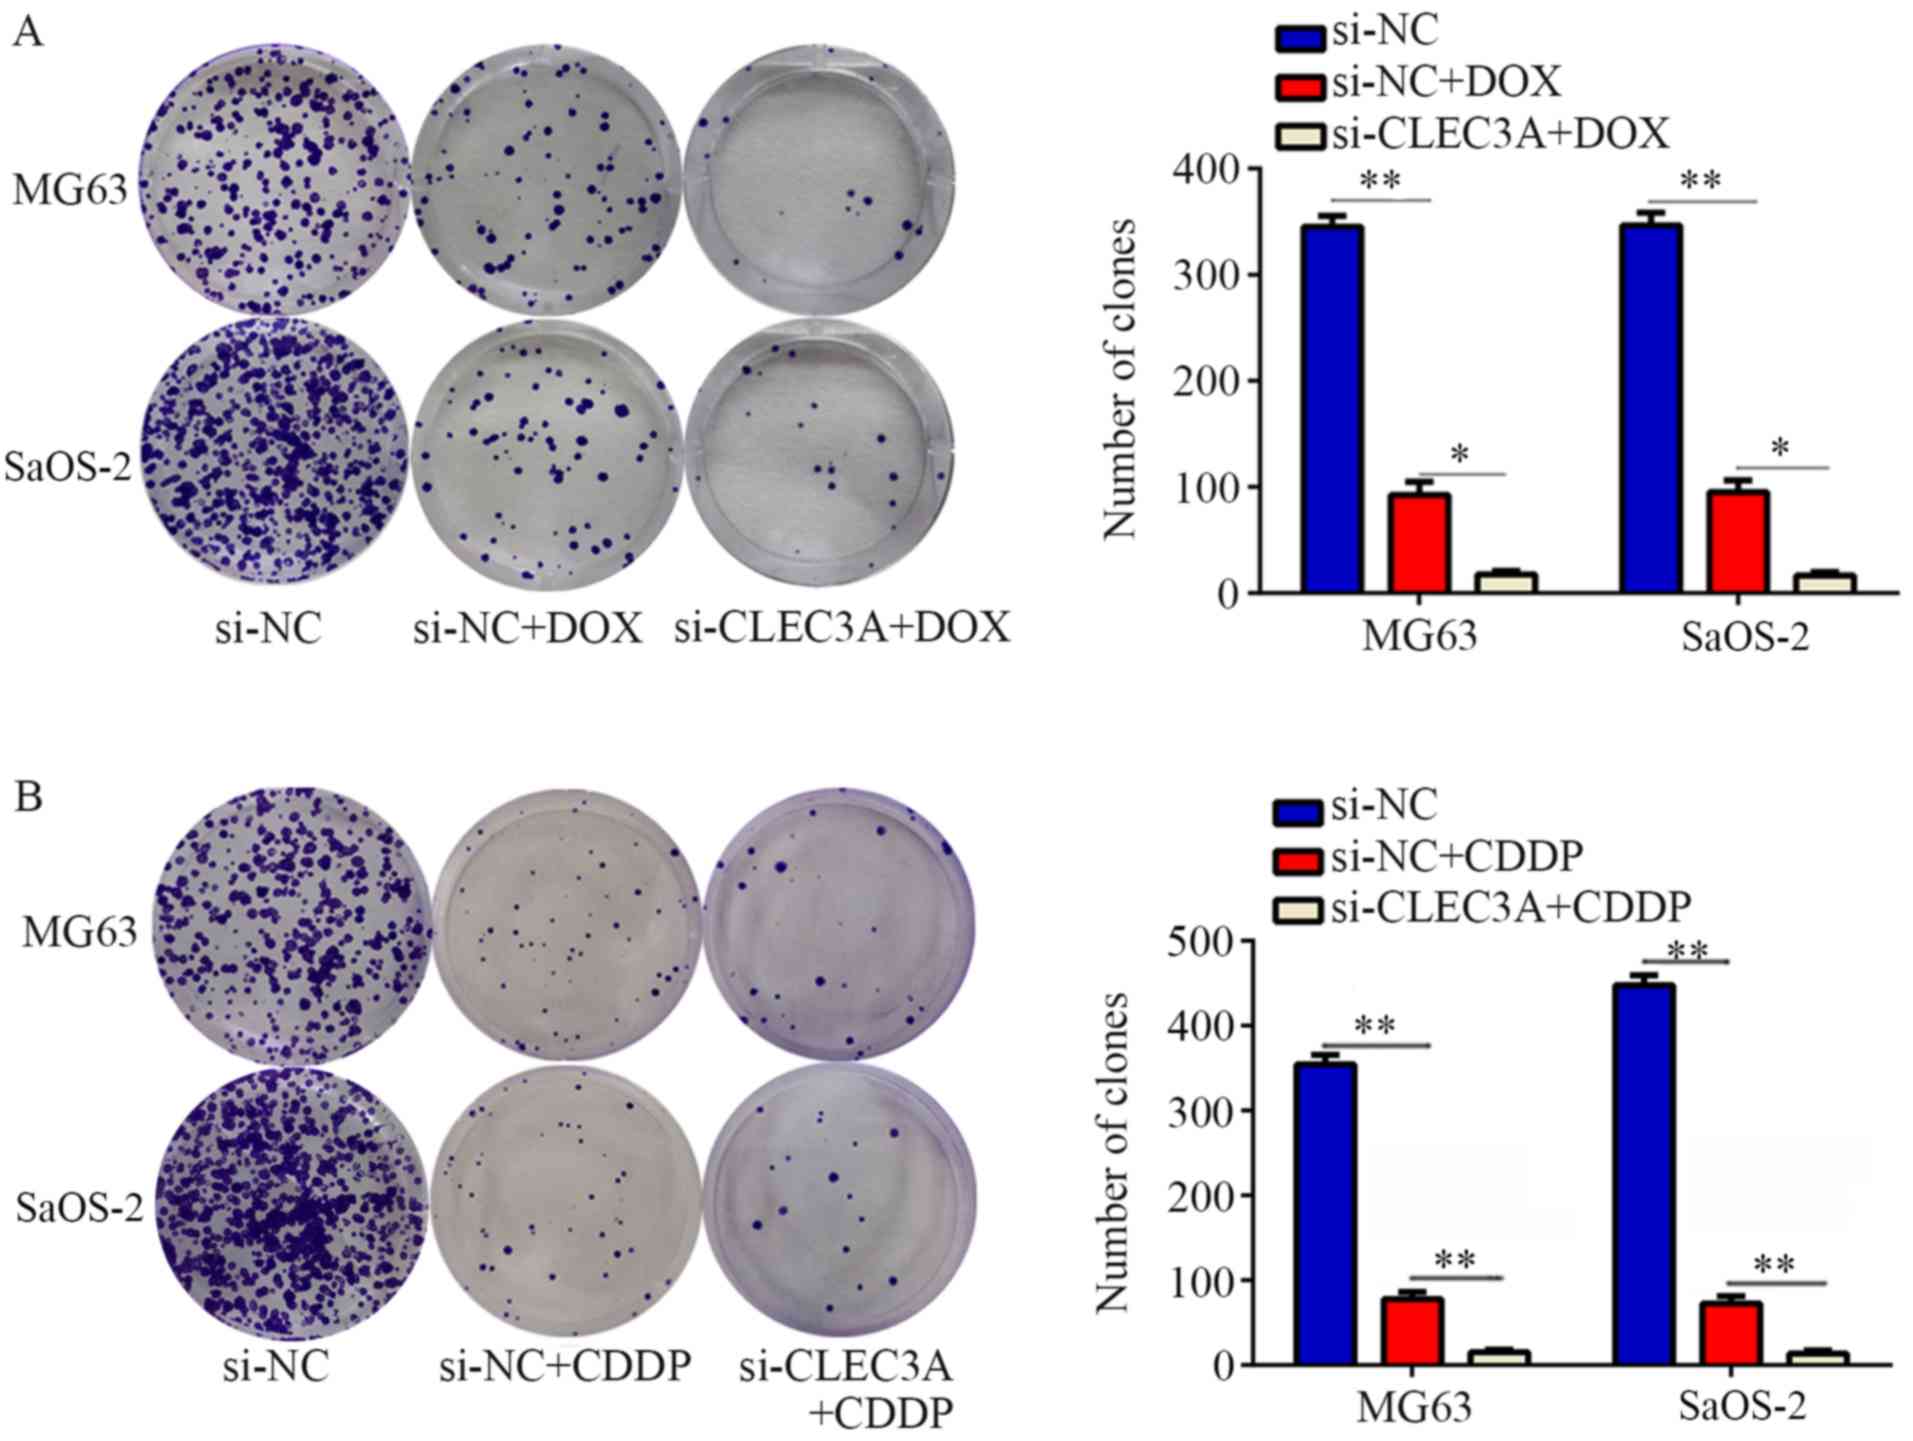
CLEC3A knockdown promotes
chemosensitivity of OS cells to doxorubicin and cisplatin
Chemotherapy resistance is an important reason for
the failure of OS treatment (12).
To determine whether the genetic knockdown of CLEC3A can promote
chemosensitivity in OS cells, MG63 and SaOS-2 cells were treated
with doxorubicin (DOX) and cisplatin (CDDP) for 24, 48 and 72 h.
The IC50 values of DOX and CDDP for MG63 and SaOS-2
cells at 24, 48 and 72 h are presented in Table II. Furthermore, DOX and CDDP
significantly decreased colony formation compared with normal
control, while CLEC3A inhibition combined with DOX or CDDP
treatment significantly decreased the colony number compared with
DOX or CDDP treatment alone (Fig. 4A
and B). These results indicated that the knockdown of CLEC3A
may promote chemosensitivity of MG63 and SaOS-2 OS cells to DOX and
CDDP.
| Table II.IC50 values of doxorubicin
and cisplatin in si-NC and si-CLEC3A knockdown MG63 and SaOS-2
cells at 24, 48 and 72 h (mean ± standard deviation). |
Table II.
IC50 values of doxorubicin
and cisplatin in si-NC and si-CLEC3A knockdown MG63 and SaOS-2
cells at 24, 48 and 72 h (mean ± standard deviation).
| A, Doxorubicin |
|---|
|
| IC50
(µM) |
|
|---|
|
|
|
|
|---|
| Group | 24 h | 48 h | 72 h |
|---|
| MG63-si-NC | 2.66±0.13 | 1.89±0.11 | 1.65±0.07 |
| MG63-si-CLEC3A |
0.87±0.15a |
0.34±0.05a |
0.28±0.07a |
| SaOS-2-si-NC | 3.01±0.17 | 2.03±0.13 | 1.77±0.06 |
|
SaOS-2-si-CLEC3A |
1.39±0.11a |
0.51±0.09a |
0.43±0.05a |
|
| B,
Cisplatin |
|
| IC50
(µM) |
|
|
|
|
|
| Group | 24 h | 48 h | 72 h |
|
| MG63-si-NC | 2.33±0.14 | 1.54±0.06 | 1.24±0.09 |
| MG63-si-CLEC3A |
0.67±0.13a |
0.29±0.06a |
0.19±0.03a |
| SaOS-2-si-NC | 2.77±0.21 | 1.77±0.11 | 1.45±0.04 |
|
SaOS-2-si-CLEC3A |
1.23±0.14a |
0.42±0.07a |
0.31±0.05a |
CLEC3A regulates the AKT1/mTOR/HIF1α
signaling pathway
Various studies have reported that the AKT1/mTOR
pathway is involved in cancer cell proliferation, migration,
metastasis and drug susceptibility (13,14).
Through analyzing the relationship between CLEC3A and AKT1 in the
30 OS patient tissues, it was observed that CLEC3A was positively
correlated with AKT1 (Fig. 5A).
Therefore, it was hypothesized that CLEC3A may have the potential
to regulate the AKT1/mTOR pathway. Western blotting was performed,
and the results found that CLEC3A knockdown decreased the
expression of AKT1 and mTOR in MG63 and SaOS-2 cells compared with
si-NC-transfected cells (Fig. 5B).
HIF1α is a critical protein regulated by AKT1/mTOR; increased
levels of HIF1α translocate to the nucleus to promote various
cancer cell processes, such as proliferation and migration
(15). Therefore, the expression
of HIF1α was investigated; the expression levels of HIF1α were also
decreased when CLEC3A was knocked down compared to the NC group
(Fig. 5B). Immunofluorescence was
also used to detect the intracellular localization of HIF1α in the
NC group and si-CLEC3A group. It was observed that HIF1α was mainly
located in the nucleus in the NC group under normal culture
conditions, whereas the genetic knockdown of CLEC3A reduced the
amount of HIF1α accumulated in the nucleus (Fig. 5C). Moreover, the mRNA and protein
expression levels of HIF1α-target genes, including VEGF, GLUT1 and
MCL1 were decreased following CLEC3A knockdown in MG63 and SaOS-2
cells compared with si-NC-transfected cells (Fig. 5D-F). These data indicated that
CLEC3A may regulate the AKT1/mTOR/HIF1α pathway.
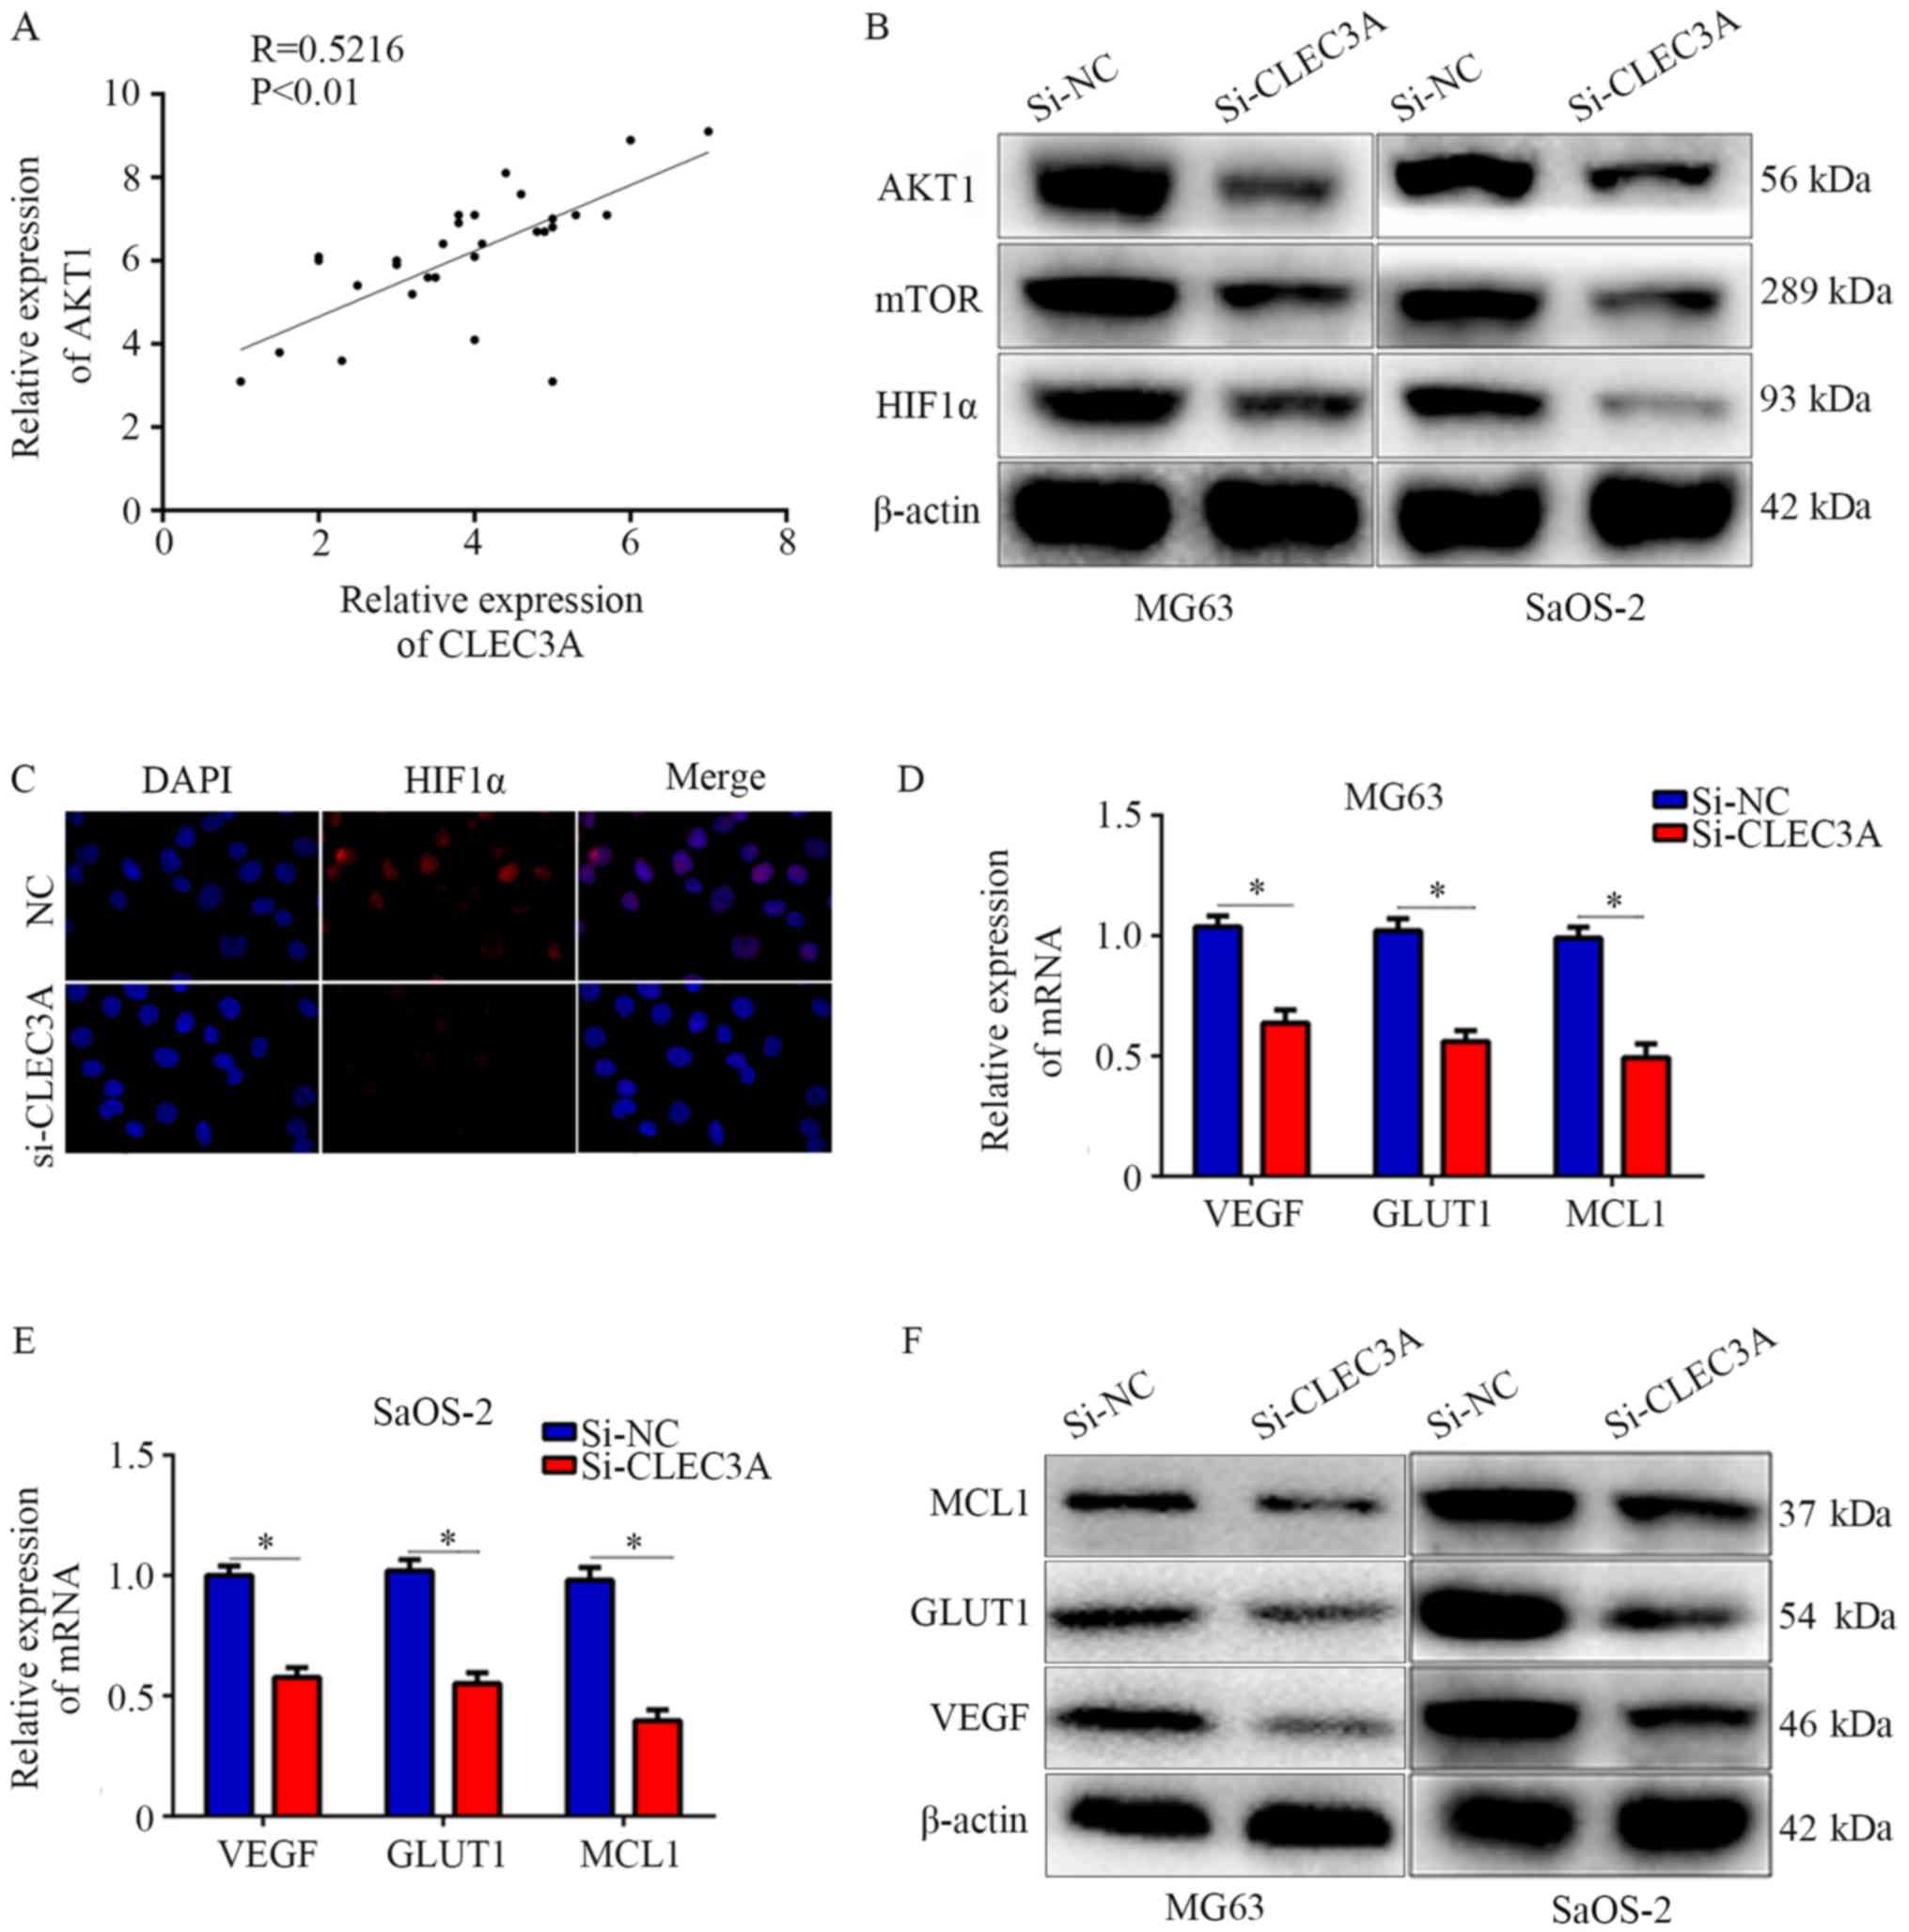 | Figure 5.Knockdown of CLEC3A suppresses the
AKT1/mTOR/HIF1α pathway. (A) Scatter diagram demonstrating the
co-expressing relationship between CLEC3A and AKT1 in mRNA level in
patient OS tissues. (B) Expression levels of AKT1, mTOR, and HIF1α
in the si-NC- and si-CLEC3A-transfected MG63 and SaOS-2 cells was
detected using western blotting. (C) Immunofluorescence was used to
analyze the nuclear location of HIF1α in the si-NC- and
si-CLEC3A-transfected MG63 cells (magnification, ×200). VEGF, GLUT1
and MCL1 mRNA expression levels were detected by reverse
transcription-quantitative PCR in the si-NC- and
si-CLEC3A-transfected (D) MG62 and (E) SaOS-2 cells. (F) VEGF,
GLUT1, and MCL1 protein expression levels were detected in the
si-NC- and si-CLEC3A-transfected cells by western
blotting.*P<0.05. OS, osteosarcoma; CLEC3A, C-type lectin domain
family 3 member A; NC, negative control; si, small interfering RNA;
HIF1, hypoxia-inducible factor-1; VEGF, vascular endothelial growth
factor; GLUT1, glucose transporter 1; MCL1, induced myeloid
leukemia cell differentiation protein Mcl-1. |
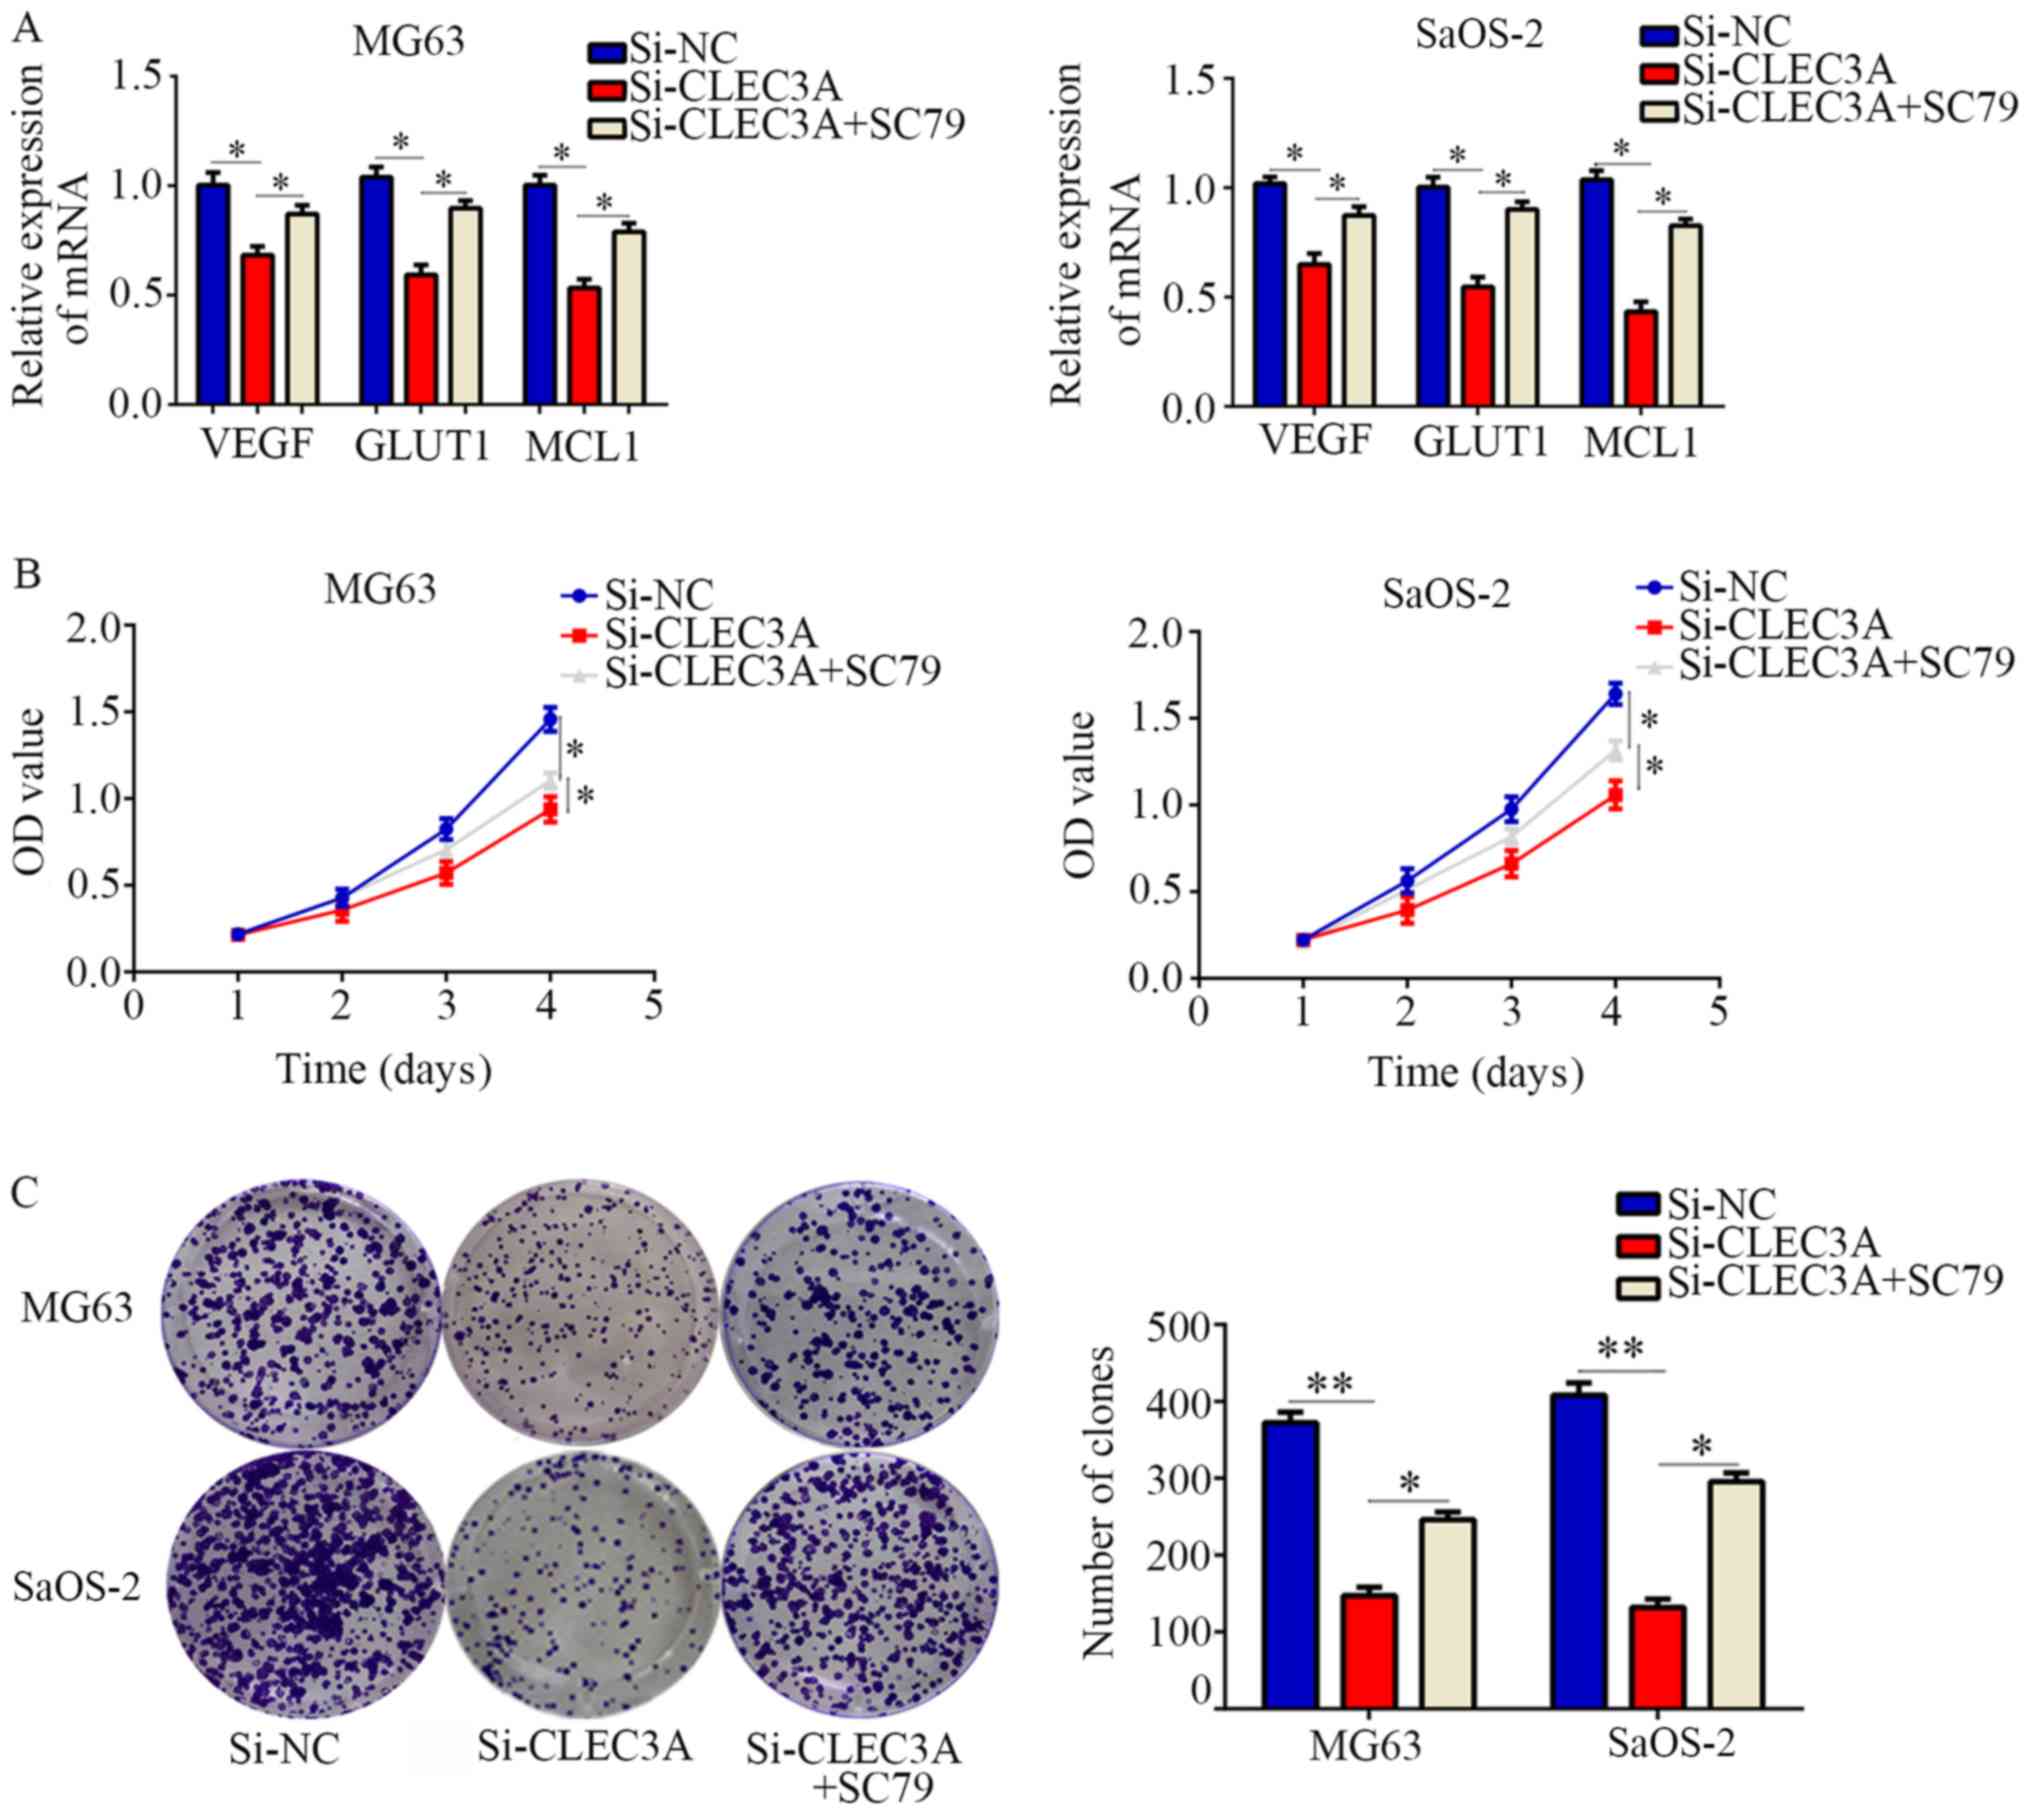
Restoration of AKT activity reverses
the effect of CLEC3A on OS cell proliferation
To determine whether the AKT1/mTOR/HIF1α pathway is
involved in CLEC3A-induced biological functions, an AKT activator,
SC79, was employed. CLEC3A inhibition significantly decreased the
expression of HIF1α target genes compared with normal control
cells, and then SC79 restored them (Fig. 6A). CCK-8 assays demonstrated that
SC79-activated AKT also significantly reversed the inhibitory
effects of CLEC3A knockdown on OS cell proliferation
(Fig. 6B). In addition, it was
observed that SC79-activated AKT could significantly reverse the
effect of CLEC3A knockdown on OS cell colony forming ability
(Fig. 6C). Taken together, these
results indicated that CLEC3A may promote OS cell proliferation via
the AKT1/mTOR/HIF1α signaling pathway.
Discussion
OS is a malignant tumor that occurs in bone tissues
and mainly affects adolescents (16). Through developments in diagnostic
and therapeutic techniques, the 5-year survival rate of patients
with OS has increased by 60–70% in the last decade; however, the
20-year survival rate of patients with OS remains low, at ~20%
(17,18). The mechanisms involved in the
development of OS are largely unclear; thus, the identification of
novel biomarkers in OS may be useful for future diagnosis and
treatment of patients.
Dysregulated C-type lectins have been found in
various diseases, including cancer (19,20).
CLEC-2, a member of the C-type lectin family, was highly expressed
in clear cell renal cell carcinoma and was positively associated
with poor patient prognosis (21)
and it was also observed to regulate cell proliferation and
migration (22). CLEC3A, another
C-type lectin, was reported to be highly expressed in breast
invasive ductal carcinoma and promoted breast cancer cell
proliferation and migration (8). A
previous study has demonstrated that CLEC3A is involved in bone
formation (23); however, the
effect of CLEC3A on OS cells is largely unknown. In the present
study, consistent with its role in breast cancer (8), it was demonstrated that CLEC3A is
highly expressed in OS tissues, and this high expression of CLEC3A
was positively associated with TNM stage and lymph node metastasis.
These were the first evidences which demonstrated that CLECE3A may
be a novel biomarker for OS. Furthermore, biology function
experiments showed CLEC3A knockdown decreased OS cell
proliferation, and increased the chemosensitivity of OS cells to
DOX and CDDP, whereas the overexpression of CLEC3A increased cell
proliferation. These were first evidences which demonstrated that
CELEC3A may be an oncogene in OS.
Numerous studies have demonstrated that the change
in expression levels of genes involved in the PI3K/AKT/mTOR pathway
are common in osteosarcoma (24,25).
The PI3K/AKT/mTOR pathway promoted the development of osteosarcoma
through regulating a series of target genes, such as mouse double
minute 2 homolog/p53, cyclins and matrix metalloproteinases
(26). Similarly, various genes
have demonstrated the potential to regulate the PI3K/AKT/mTOR
pathway (27,28). In the present study, it was found
that the knockdown of CLEC3A decreased the expression levels of
AKT/mTOR. HIF1α is a critical transcriptional regulator of the
adaptive response to hypoxia. Under normoxia, HIF1α is modified by
oxygen-dependent prolyl-hydroxylases and is subsequently recognized
by the von Hippel-Lindau tumor suppressor protein and degraded by
the ubiquitination pathway (29).
However, under hypoxia, oxygen-dependent prolyl hydroxylases are
inactive and HIF1α is stable, facilitating its dimerization with
HIF-1β, translocation to the nucleus and binding to the promoters
of target genes to promote their transcription (30,31).
The expression of HIF1α and its activity are also controlled by
oxygen-independent mechanisms; for example, multiple studies have
reported that the AKT1/mTOR signaling pathway increased the
expression of HIF1α (32,33). In the present study, the genetic
knockdown of CLEC3A significantly decreased both the protein
expression levels of HIF1α and its nuclear localization. Various
studies have shown that the target genes of HIF1α such as VEGF,
MCL1 and Glut1 induced the metabolic change and apoptosis
inhibition, therefore promoting proliferation and decreasing
sensitivity of chemotherapy (34,35).
In the present study, we showed the expression levels of
HIF1α-targeted genes, including MCL1, GLUT1 and VEGF, were also
decreased when CLEC3A was knocked down; however, the restoration of
the AKT1/mTOR/HIF1α signaling with SC79 reversed the inhibitory
effects of CLEC3A knockdown on the biological function of OS
cells.
In conclusion, the present study suggested that
CLEC3A may be an oncogene in OS by promoting OS cell proliferation
and demonstrated that CLEC3A may be involved in chemosensitivity
through regulating the AKT1/mTOR/HIF1α signaling pathway. Thus,
CLEC3A may contribute to the development of OS and be a potential
target for OS diagnosis and treatment.
Acknowledgements
Not applicable.
Funding
This work was supported by Qian Kehe SY [grant no.
(2013)3042] and The National Natural Science Foundation of China
(grant no. 81560356).
Availability of data and materials
The datasets used and/or analyzed during the current
study are available from the corresponding author on reasonable
request.
Authors' contributions
CR, RP, LH, HW, JS and WZ were responsible for
performing the experiments, collecting the data, conducting the
data analysis and interpreting the results. XT and HC designed the
experiments and wrote the manuscript. All authors read and approved
the final version of the article.
Ethics approval and consent to
participate
The present study was approved by the Ethics
Committee of the Guiyang Maternal and Child Health-Care Hospital
and was performed in accordance with the principles embodied in the
Declaration of Helsinki. Informed consent was obtained from all
patients who provided samples.
Patient consent for publication
Not applicable.
Competing interests
The authors declare that they have no competing
interests.
References
|
1
|
Maximov VV, Akkawi R, Khawaled S, Salah Z,
Jaber L, Barhoum A, Or O, Galasso M, Kurek KC, Yavin E and Aqeilan
RI: MiR-16-1-3p and miR-16-2-3p possess strong tumor suppressive
and antimetastatic properties in osteosarcoma. Int J Cancer.
145:3052–3063. 2019. View Article : Google Scholar : PubMed/NCBI
|
|
2
|
Hsu MJ, Peng SF, Chueh FS, Tsai CH, Tsai
FJ, Huang CY, Tang CH, Yang JS, Hsu YM, Huang WW and Chung JG:
Lupeol suppresses migration and invasion via p38/MAPK and PI3K/Akt
signaling pathways in human osteosarcoma U-2 OS cells. Biosci
Biotechnol Biochem. 83:1729–1739. 2019. View Article : Google Scholar : PubMed/NCBI
|
|
3
|
Ma H, Su R, Feng H, Guo Y and Su G: Long
noncoding RNA UCA1 promotes osteosarcoma metastasis through
CREB1-mediated epithelial-mesenchymal transition and activating
PI3K/AKT/mTOR pathway. J Bone Oncol. 16:1002282019. View Article : Google Scholar : PubMed/NCBI
|
|
4
|
Wang Y, Huang H and Li Y: Knocking down
miR-384 promotes growth and metastasis of osteosarcoma MG63 cells
by targeting SLBP. Artif Cells Nanomed Biotechnol. 47:1458–1465.
2019. View Article : Google Scholar : PubMed/NCBI
|
|
5
|
Chen JK, Peng SF, Lai KC, Liu HC, Huang
YP, Lin CC, Huang AC, Chueh FS and Chung JG: Fistein suppresses
human osteosarcoma U-2 OS cell migration and invasion via affecting
FAK, uPA and NF-κB signaling pathway in vitro. In vivo. 33:801–810.
2019. View Article : Google Scholar : PubMed/NCBI
|
|
6
|
Lau D, Elezagic D, Hermes G, Mörgelin M,
Wohl AP, Koch M, Hartmann U, Höllriegl S, Wagener R, Paulsson M, et
al: The cartilage-specific lectin C-type lectin domain family 3
member A (CLEC3A) enhances tissue plasminogen activator-mediated
plasminogen activation. J Biol Chem. 293:203–214. 2018. View Article : Google Scholar : PubMed/NCBI
|
|
7
|
Wang Y, Lv Y, Liu TS, Yan WD, Chen LY, Li
ZH, Piao YS, An RB, Lin ZH and Ren XS: Cordycepin suppresses cell
proliferation and migration by targeting CLEC2 in human gastric
cancer cells via Akt signaling pathway. Life Sci. 223:110–119.
2019. View Article : Google Scholar : PubMed/NCBI
|
|
8
|
Ni J, Peng Y, Yang FL, Xi X, Huang XW and
He C: Overexpression of CLEC3A promotes tumor progression and poor
prognosis in breast invasive ductal cancer. Onco Targets Ther.
11:3303–3312. 2018. View Article : Google Scholar : PubMed/NCBI
|
|
9
|
Ho XD, Phung P, Q Le V, H Nguyen V,
Reimann E, Prans E, Kõks G, Maasalu K, Le NT, H Trinh L, et al:
Whole transcriptome analysis identifies differentially regulated
networks between osteosarcoma and normal bone samples. Exp Biol Med
(Maywood). 242:1802–1811. 2017. View Article : Google Scholar : PubMed/NCBI
|
|
10
|
Sepulveda JL: Using R and Bioconductor in
clinical genomics and transcriptomics. J Mol Diagn. 22:3–20. 2019.
View Article : Google Scholar : PubMed/NCBI
|
|
11
|
Livak JK and Schmittgen TD: Analysis of
relative gene expression data using quantitative PCR and the 2
(-Delta Delta C(T)) method. Methods. 25:402–408. 2001. View Article : Google Scholar : PubMed/NCBI
|
|
12
|
Heng M, Gupta A, Chung PW, Healey JH,
Vaynrub M, Rose PS, Houdek MT, Lin PP, Bishop AJ, Hornicek FJ, et
al: The role of chemotherapy and radiotherapy in localized
extraskeletal osteosarcoma. Eur J Cancer. 125:130–141. 2010.
View Article : Google Scholar
|
|
13
|
Pan C, Liu Q and Wu X: HIF1α
a/miR-520a-3p/AKT1/mTOR feedback promotes the proliferation and
glycolysis of gastric cancer cells. Cancer Manag Res.
11:10145–10156. 2019. View Article : Google Scholar : PubMed/NCBI
|
|
14
|
Zhang X, Wang S, Wang H, Cao J, Huang X,
Chen Z, Xu P, Sun G, Xu J, Lv J and Xu Z: Circular RNA circNRIP1
acts as a microRNA-149-5p sponge to promote gastric cancer
progression via the AKT1/mTOR pathway. Mol Cancer. 18:202019.
View Article : Google Scholar : PubMed/NCBI
|
|
15
|
Liao Z, She C, Ma L, Sun Z, Li P, Zhang X,
Wang P and Li W: KDELR2 promotes glioblastoma tumorigenesis
targeted by HIF1a via mTOR signaling pathway. Cell Mol Neurobiol.
39:1207–1215. 2019. View Article : Google Scholar : PubMed/NCBI
|
|
16
|
Prater S and McKeon B: Cancer,
Osteosarcoma. StatPearls Publishing; Treasure Island, FL: 2019
|
|
17
|
Imura Y, Takenaka S, Kakunaga S, Nakai T,
Wakamatsu T, Outani H, Tanaka T, Tamiya H, Oshima K, Hamada K, et
al: Survival analysis of elderly patients with osteosarcoma. Int
Orthop. 43:1741–1747. 2019. View Article : Google Scholar : PubMed/NCBI
|
|
18
|
Zhang Y, Yang J, Zhao N, Wang C, Kamar S,
Zhou Y, He Z, Yang J, Sun B, Shi X, et al: Progress in the
chemotherapeutic treatment of osteosarcoma. Oncol Lett.
16:6228–6237. 2018.PubMed/NCBI
|
|
19
|
Mayer S, Raulf MK and Lepenies B: C-type
lectins: Their network and roles in pathogen recognition and
immunity. Histochem Cell Biol. 147:223–237. 2017. View Article : Google Scholar : PubMed/NCBI
|
|
20
|
Ding D, Yao Y, Zhang S, Su C and Zhang Y:
C-type lectins facilitate tumor metastasis. Oncol Lett. 13:13–21.
2017. View Article : Google Scholar : PubMed/NCBI
|
|
21
|
Xiong Y, Liu L, Xia Y, Wang J, Xi W, Bai
Q, Qu Y, Long Q, Xu J and Guo J: High CLEC-2 expression associates
with unfavorable postoperative prognosis of patients with clear
cell renal cell carcinoma. Oncotarget. 7:63661–63668. 2016.
View Article : Google Scholar : PubMed/NCBI
|
|
22
|
Osada M, Inoue O, Ding G, Shirai T, Ichise
H, Hirayama K, Takano K, Yatomi Y, Hirashima M, Fujii H, et al:
Platelet activation receptor CLEC-2 regulates blood/lymphatic
vessel separation by inhibiting proliferation, migration, and tube
formation of lymphatic endothelial cells. J Biol Chem.
287:22241–22252. 2012. View Article : Google Scholar : PubMed/NCBI
|
|
23
|
Karlsson C, Dehne T, Lindahl A, Brittberg
M, Pruss A, Sittinger M and Ringe J: Genome-wide expression
profiling reveals new candidate genes associated with
osteoarthritis. Osteoarthritis Cartilage. 18:581–592. 2010.
View Article : Google Scholar : PubMed/NCBI
|
|
24
|
Perry JA, Kiezun A, Tonzi P, Van Allen EM,
Carter SL, Baca SC, Cowley GS, Bhatt AS, Rheinbay E, Pedamallu CS,
et al: Complementary genomic approaches highlight the PI3K/mTOR
pathway as a common vulnerability in osteosarcoma. Proc Natl Acad
Sci USA. 111:E5564–E5573. 2014. View Article : Google Scholar : PubMed/NCBI
|
|
25
|
Zhang J, Yu XH, Yan YG, Wang C and Wang
WJ: PI3K/Akt signaling in osteosarcoma. Clin Chim Acta.
444:182–192. 2015. View Article : Google Scholar : PubMed/NCBI
|
|
26
|
Hu K, Dai HB and Qiu ZL: mTOR signaling in
osteosarcoma: Oncogenesis and therapeutic aspects (Review). Oncol
Rep. 36:1219–1225. 2016. View Article : Google Scholar : PubMed/NCBI
|
|
27
|
Jiang C, Ma Z, Zhang G, Yang X, Du Q and
Wang W: CSNK2A1 Promotes gastric cancer invasion through the
PI3K-Akt-mTOR signaling pathway. Cancer Manag Res. 11:10135–10143.
2019. View Article : Google Scholar : PubMed/NCBI
|
|
28
|
Li ZQ, Qu M, Wan HX, Wang H, Deng Q and
Zhang Y: FOXK1 promotes malignant progression of breast cancer by
activating PI3K/AKT/mTOR signaling pathway. Eur Rev Med Pharmacol
Sci. 23:9978–9987. 2019.PubMed/NCBI
|
|
29
|
Qian J and Rankin EB: Hypoxia-induced
phenotypes that mediate tumor heterogeneity. Adv Exp Med Biol.
1136:43–55. 2019. View Article : Google Scholar : PubMed/NCBI
|
|
30
|
Hayashi Y, Yokota A, Harada H and Huang G:
Hypoxia/pseudohypoxia-mediated activation of hypoxia-inducible
factor-1α in cancer. Cancer Sci. 110:1510–1517. 2019. View Article : Google Scholar : PubMed/NCBI
|
|
31
|
Thomas LW and Ashcroft M: Exploring the
molecular interface between hypoxia-inducible factor signalling and
mitochondria. Cell Mol Life Sci. 76:1759–1777. 2019. View Article : Google Scholar : PubMed/NCBI
|
|
32
|
Du Y, Long Q, Zhang L, Shi Y, Liu X, Li X,
Guan B, Tian Y, Wang X, Li L and He D: Curcumin inhibits
cancer-associated fibroblast-driven prostate cancer invasion
through MAOA/mTOR/HIF-1α signaling. Int J Oncol. 47:2064–2072.
2015. View Article : Google Scholar : PubMed/NCBI
|
|
33
|
Woo YM, Shin Y, Lee EJ, Lee S, Jeong SH,
Kong HK, Park EY, Kim HK, Han J, Chang M and Park JH: Inhibition of
aerobic glycolysis represses Akt/mTOR/HIF-1α axis and restores
tamoxifen sensitivity in antiestrogen-resistant breast cancer
cells. PLoS One. 10:e01322852015. View Article : Google Scholar : PubMed/NCBI
|
|
34
|
Wang Y, Huang Y, Liu H, Su D, Luo F and
Zhou F: Long noncoding RNA CDKN2B-AS1 interacts with miR-411-3p to
regulate ovarian cancer in vitro and In vivo through
HIF-1a/VEGF/P38 pathway. Biochem Biophys Res Commun. 514:44–50.
2019. View Article : Google Scholar : PubMed/NCBI
|
|
35
|
Sadlecki P, Bodnar M, Grabiec M, Marszalek
A, Walentowicz P, Sokup A, Zegarska J and Walentowicz-Sadlecka M:
The role of Hypoxia-inducible factor-1α, glucose transporter-1,
(GLUT-1) and carbon anhydrase IX in endometrial cancer patients.
BioMed research international. 2014:6168502014. View Article : Google Scholar : PubMed/NCBI
|