Introduction
Obesity, which is the accumulation of excessive
adipose tissues, is a global health problem due to the potential
for adverse effects on health, leading to various lethal diseases,
including type 2 diabetes, high blood pressure, hypertension,
dyslipidaemia, cardiovascular diseases and some types of cancer
(1). The accumulated adipose
tissue in the body can be classified into 2 categories:
Subcutaneous tissue, which is stored under the skin, and visceral
adipose tissue, which is stored in or around internal organs, such
as the liver, blood vessels, kidney and pancreas (2–4). It
is hypothesized that the accumulation of adipose tissue is
age-related and visceral adipose tissue increases with age
(5). However, more studies have
demonstrated that obesity is mainly due to excess dietary intake
(6–10). Visceral obesity, due to the storage
of excess visceral adipose tissue, is more worrisome than
subcutaneous obesity because the adipose tissue surrounds the vital
organs and is metabolized by the liver, turning the tissue into
blood cholesterol (11). In
addition, visceral adipose tissue appears to be a key component
that determines and predicts the development of a number of the
aforementioned diseases (2).
Moreover, breast cancer has been shown to exhibit complex
associations with obesity (12).
Gene expression has been used to predict factors for
being overweight, including gene fusion, co-occurrence and
co-expression in the development of obesity (13). However, to the best of our
knwoeldge, detection of adipose tissue accumulation based on gene
expression profiles in subcutaneous and visceral adipose tissues by
bioinformatics, which may lead to the identification of biomarkers
to distinguish the type of adipose tissue accumulation, remains
rare. Recent genetic studies have demonstrated that gene expression
may play a role in the development of adipose tissue primarily by
regulating the storage and release of energy from food (14–15).
However, the negative regulation of adipogenic transcription
factors and their downstream genes in visceral adipose tissue
development remain to be elucidated. The negative regulation that
causes visceral obesity has been demonstrated to reduce adipocyte
proliferation and differentiation (16). As a result, the body does not have
sufficient adipocytes to store extra fat; therefore, the fat is
stored in internal organs during high-fat consumption (17). Increased expression of peroxisome
proliferator-activated receptor-γ (PPARG) has been detected in
visceral adipose tissue (18).
However, additional adipogenic-related genes need to be identified
to understand the detailed underlying mechanism of visceral adipose
tissue accumulation. The aim of the present study was to
investigate differentially expressed genes (DEGs) at the mRNA level
in the adipose tissues of an animal model fed with different
amounts of food. The accumulated adipose tissues were then used for
total RNA extraction and reverse transcribed to cDNA for the
determination of differential expression of 84 genes using PCR
arrays. Moroever, PCR arrays were used in the present study to
measure the expression of various genes related to the excessive
accumulation of adipose tissues in the body. The arrays are a
reliable tool to analyze the expression of specific disease-related
genes and biochemical pathways. PCR arrays comprise 96-well plates
containing primers for a panel of genes involved in a specific
biochemical pathway or disease, in addition to appropriate positive
and negative controls. The technique combines the profiling
capacities of a microarray with the performance of PCR and is
becoming one of the standard approaches for measuring differential
gene expression.
Materials and methods
Animal feeding and adipose tissue
collection
Experiments involving the use of animals (n=12) were
performed according to the Guidelines For The Care And Use Of
Animals For Scientific Purposes (19), after obtaining ethical approval
from the Universiti Sains Malaysia Animal Ethics Committee [Permit
no. USM/PPSF/50(085) Jld.2]. Male Sprague Dawley rats (weight,
80–100 g; age, 4 weeks) were obtained from the Animal House of
Universiti Sains Malaysia. Rats were housed with three rats per
cage at room temperature with a 12:12 h light:dark cycle and 50%
relative humidity in the animal holding room. Only male rats were
selected for the study as male rats are not susceptible to the
physiological changes due to the oestrous cycle, the presence of
which may have induced variations in the current study. All rats
were given free access to drinking water and standard chow [Gold
Coin Feedmills (Malaysia) Sdn. Bhd.]. After 2 weeks of acclimation
to the diet and housing conditions, rats were randomly assigned to
1 of 2 groups: Control [given an ordinary diet, 15/100 g body
weight per day (n=3)] or experimental [given twice the amount of
the ordinary diet, 30/100 g body weight per day (n=3)]. Rats were
provided with pre-weighed quantities of food each day and the
quantity remaining in the food dish was weighed every 24 h. The
body weight of each rat in each group was recorded every week and
the growth patterns were monitored prior to sacrifice via exposure
to 100% carbon dioxide. A fill rate of ~10% chamber volume/min was
used. Death was confirmed based on a lack of respiration and faded
eye colour. Then, the abdominal cavities of animals (n=3) from each
group were opened, whereby the subcutaneous and visceral adipose
tissues were removed and weighed. All selection criteria of obese
rats were performed based on a previous study (18). The collected adipose tissues were
then used for total RNA extraction or rinsed in TRI
Reagent® (Molecular Research Center), frozen in liquid
nitrogen and stored at −80°C. The experiments were repeated twice
(3 cohorts of 6 mice were used) to ensure reproducibility of the
findings. A feeding period of 2 months was used because this period
results in significant visceral adipose tissue accumulation in rats
(18).
Total RNA extraction and cDNA
synthesis
Total RNA extraction from subcutaneous and visceral
adipose tissues was performed using TRI Reagent (Molecular Research
Center), according to the manufacturer's protocols. The integrity
of total extracted RNA was confirmed using 1% (w/v) agarose gel
electrophoresis, while the purity and the yield of the RNA were
measured using a nanophotometer (Implen GmbH). The integrity of
total RNA was confirmed again by a 2100 Bioanalyzer (Agilent
Technologies, Inc.) using the RNA 6000 Pico LabChip® Kit
(Agilent Technologies, Inc.). Subsequently, 1 µg of high-quality
total RNA was reverse transcribed into cDNA using a RevertAid™
First Strand cDNA Synthesis Kit (Thermo Fisher Scientific, Inc.),
according to the manufacturer's protocols. The success of cDNA
synthesis was validated with conventional PCR amplification using
rat GAPDH primers (forward 5′-CAAGTTCAACGGCACAGTCAAG-3′, reverse
5′-CTCCTGGAAGATGGTGATTGGT-3′). The PCR was performed using 2X PCR
MasterMix (Thermo Fisher Scientific, Inc.) and SureCycler 8800
(Agilent Technologies, Inc.). For this, a volume of 2X PCR master
mix (12.5 µl), 0.12 µM of each forward and reverse primers, and 1.0
µl of cDNA (100 ng) were mixed. A sufficient volume of deionized
water (9.5 µl) was added to the mixture, to bring the volume of the
reaction solution to 25 µl per vial. The program for the thermal
cycler was carried out as follows: Initial denaturation at 95°C for
2 min, followed by 35 cycles at 95°C for 30 sec, 55°C for 30 sec
and 72°C for 1 min for annealing and the extension step.
PCR arrays
Following cDNA synthesis, DEGs were identified using
RT2 Profiler™ PCR Array Rat Obesity (cat. no.
PAMM-017A-12; SABiosciences). Each plate for arrays contained 84
primer pairs that had been experimentally validated to ensure gene
specificity and high amplification efficiency. Genes were
categorized into 5 groups: i) Neuropeptides and receptors; ii) gut
hormones and receptors; iii) adipocyte-derived peptides and
receptors; iv) pancreas-derived peptides and receptors; and v)
central nervous system-derived peptides and receptors. Reverse
transcription-quantitative PCR (RT-qPCR) arrays were performed
using an ABI 7000 Sequence Detection System (Applied Biosystems;
Thermo Fisher Scientific, Inc.). For this purpose, reactions with a
total volume of 25 µl, consisting of RT2 qPCR SYBR
Green/Fluorescein, nuclease-free water and cDNA (template), were
set up in each well of the plate. The reactions were then initiated
at 95°C for 10 min to activate the HotStart polymerase, which was
followed by 40 cycles of denaturation at 95°C for 15 sec and primer
annealing, as well as an extension at 60°C for 1 min. A
dissociation curve programme was added after the reactions were
completed to generate the derivative dissociation curve of the
reactions. The dissociation curve programme was initiated at 95°C
for 1 min, 65°C for 2 min and 65°C to 95°C at 2°C/min. The
intensity of each gene was then normalized to the intensity of
housekeeping genes: β-actin (ACTB), β-2 microglobulin, GAPDH, heat
shock protein 90 α (cytosolic)-class B member 1 (HSP90AB1) or
glucuronidase-β (GUSB) (20). The
normalized gene intensity of subcutaneous and visceral adipose
tissues in control and experimental rats were then drawn as scatter
plots using simple linear regression.
Clustering, functional enrichment and
pathway analyses
The relationship between the normalized gene
intensities of subcutaneous and visceral adipose tissues in control
and experimental rats were then converted to fold change in a
volcano plot generated using GraphPad Prism 7.05 (GraphPad
Software, Inc.), whereby genes with a fold change ≥2 and P<0.05
were identified as statistically significant DEGs. A
heatmap-dendrogram of log2 fold change for DEGs was then
produced using Metascape (http://metascape.org/gp/index.html#/main/step1). The
heatmap showed upregulated genes (green), downregulated genes (red)
and genes with no difference (black) in expression, whereas a
dendrogram was constructed to show expression-based relationships
across the entire set of expressed genes in the experiments. To
further study the DEGs at a functional level, Gene Ontology (GO)
functional enrichment analysis was performed using GeneMANIA
(https://genemania.org/) (21–23).
GeneMANIA discovered functionally similar genes using a wealth of
genomics and proteomics data from a query gene. The algorithm of
the modal was then weighted against each functional genomic
dataset, according to its predictive value for the query, whereby a
fold change discovery ≤0.05 was set as the cut-off criterion for
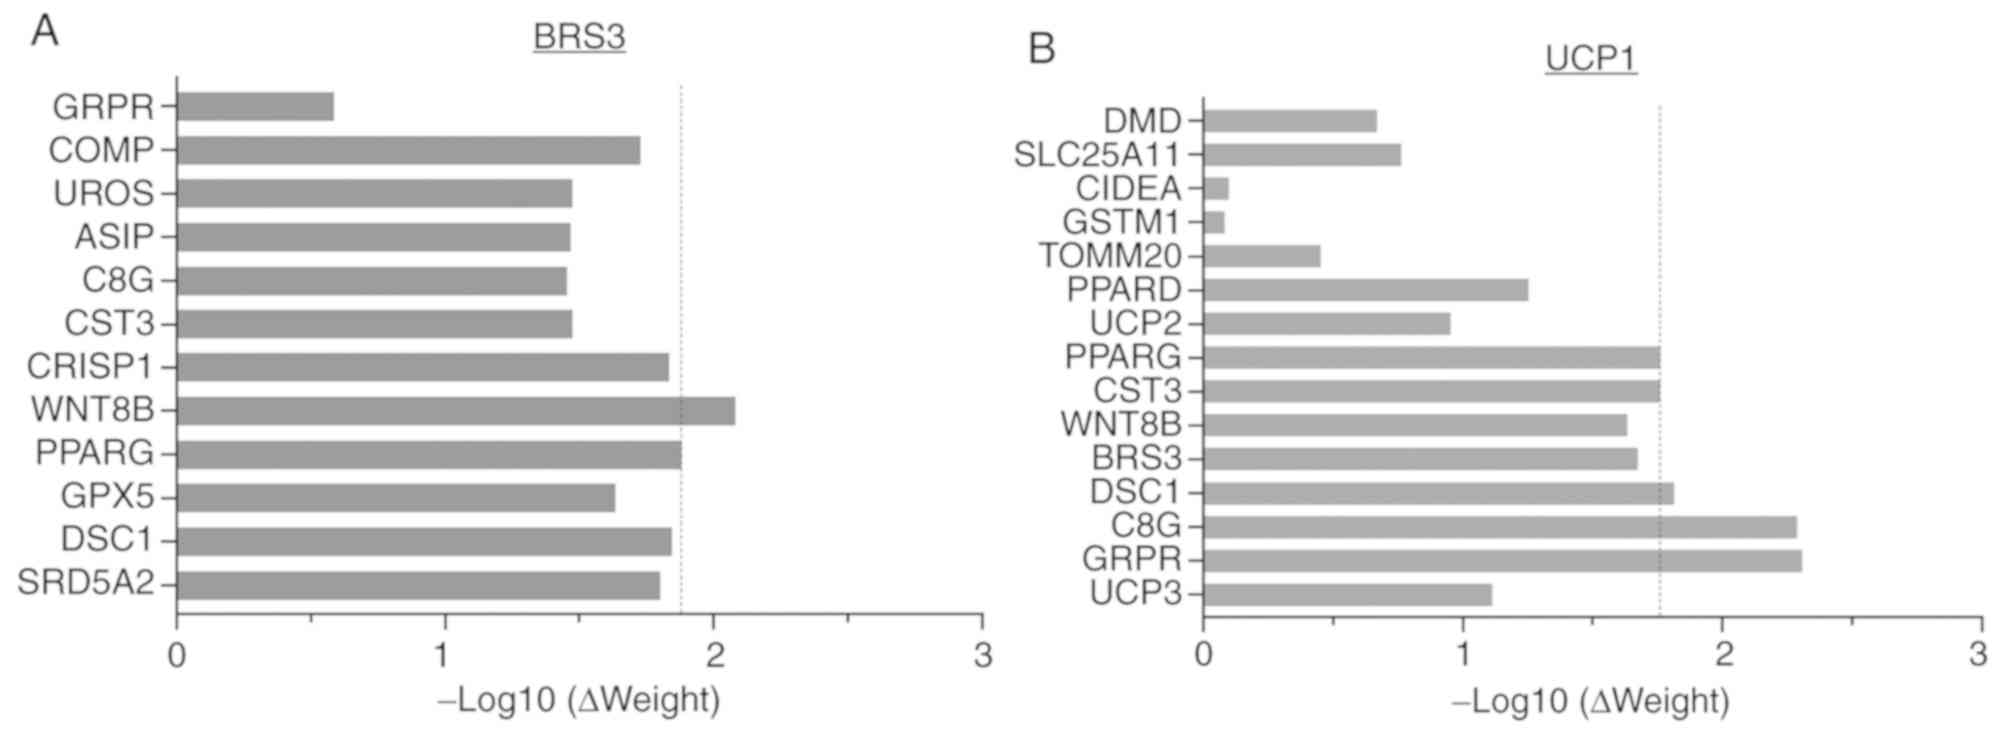
the enrichment analysis. The diagrams of network weight for BRS3
and UCP1 were plotted by -log10 (ΔWeight). The list of
genes likely to share function with the single query gene based on
their interactions was listed.
Validation of selected genes
MCF-7 and MDA-MB-231 (American Type Culture
Collection) were cultured with 6 ml of 10% growth medium (DMEM;
Gibco; Thermo Fisher Scientific, Inc.) supplemented with 10% (v/v)
FBS (Gibco; Thermo Fisher Scientific, Inc.), 100 U/ml of penicillin
and 100 mg/ml of streptomycin (Gibco; Thermo Fisher Scientific,
Inc.) in a T-25 culture flask. The culture was incubated at 37°C in
a humidified atmosphere of 5% (v/v) CO2 until the growth
of the cells reached approximately 70% confluence. After that, the
old growth medium of the culture was discarded, the cells were
trypsinized, and sub-cultured with fresh growth medium to 6-well
plates. The cells were then ready to extraction of total RNA. Total
RNA extraction of MCF-7 and MDA-MB-231 was performed using a RNeasy
Mini kit (QIAGEN, Inc.). The concentration and integrity of the
extracted RNA were verified, as described above. Extracted RNA of
sufficient quality was reverse transcribed to cDNA using a
RevertAid First Strand cDNA Synthesis kit (Thermo Fisher
Scientific, Inc.). The product of reverse transcription (cDNA) was
stored at −20°C until it was used for the analysis of gene
expression by conventional PCR. Gene-specific primers were designed
for semi-quantitative amplification of the bombesin-like receptor 3
(BRS3), uncoupling protein 1 (UCP1) and GAPDH using Primer Express
3.0 software (Applied Biosystems; Thermo Fisher Scientific, Inc.).
Forward human BRS3: 5′-GGCAGTTGTGAAGCCACTTGA-3′, reserve human
BRS3: 5′-AGACGCAGCCAGCTTTTACAC-3′; forward human UCP1:
5′-AGGACCAACGGCTTTCTTCAA-3′, reserve human UCP1:
5′-CATAATGACGTTCCAGGATCCA-3′; forward human GAPDH:
5′-ACAGCCTCAAGATCATCAGCA-3′, reverse human GAPDH:
5′-AGTCTTCTGGGTGGCAGTGAT-3′. Semi-quantitative analysis is an
analysis using a DNA ladder (marker) as an indication to measure
the integrity of the PCR product. The gene expression was
quantified using the ladder area; ‘lower’ and ‘upper’ ladders are
internal standards used to align the ladder data with data from the
sample wells. The area under the ladder was then compared with the
sum of the sample peak areas. PCR was performed in a volume of 12.5
µl of PCR Master Mix (Applied Biosystems; Thermo Fisher Scientific,
Inc.), 20 pmol of each forward and reverse primer and 5 µl of cDNA
(25 ng). A sufficient volume of deionized water was added to the
mixture to bring the volume of the reaction to 25 µl. The
thermocycler program was carried out as follows: 50°C for 3 min and
95°C for 5 min as the short hot-start, followed by 35–40 cycles of
95°C for 10 sec for denaturation, and annealing and extension steps
at 60°C for 30 sec. The integrity of PCR products was confirmed by
a 2100 Bioanalyzer (Agilent Technologies, Inc.) using a DNA 1000
LabChip® Kit (Agilent Technologies, Inc.). Data analysis
was carried out, according to the manufacturer's instructions,
whereby the gene expression was quantified by comparing the
integrity of a DNA ladder with the integrity from the sample. Each
sample was analyzed in three replications. The experiment was
performed and repeated at least twice.
The peak concentrations of PPARG, BRS3 and GAPDH
were also analyzed in MK886-treated and control DMSO-treated
MDA-MB-231 cells via PCR. The values were then converted to % of
fold change for gene expression level analysis. To do this, MK886
(97% purity; Sigma-Aldrich; Merck KGaA), which is PPARG inhibitor,
was dissolved in DMSO (Bio Basic, Inc.) as a 10 mM stock. The drug
stock was stored at −20°C and further diluted to the working
concentration with assay medium [DMEM supplemented with 2% (v/v)
FBS and antibiotics]. Subsequently, 3 µM of MK886 was added to the
cells and the treated cells were incubated at 37°C in 5% (v/v)
CO2 for 2, 4 and 6 days. The treatment criteria of
MDA-MB-231 was performed based on the previous study (24). Following 2 days of treatment, the
cells were harvested using a trypsin/EDTA solution (Gibco; Thermo
Fisher Scientific, Inc.). MK886-treated and control DMSO-treated
MDA-MB-231 cells were then subjected to total RNA extraction, cDNA
conversion and peak concentration analysis by PCR and Bioanalyzer,
as described above. The same method was used to calculate the
target gene expression levels in MK886-treated and control
DMSO-treated MDA-MB-231 cells following 4 and 6 days of
treatment.
Data analysis
Graphs were extracted from GeneMANIA and all
statistical analyses were performed using GraphPad Prism 7.05
(GraphPad Prism Software, Inc.). The significance of the data in
scatter and volcano plots were analysed using unpaired t-tests. In
contrast, two-way ANOVA with Tukey's multiple comparison post hoc
test was used for the validation of the selected genes in cells.
All values are expressed as mean ± SD. P<0.05 was considered to
indicate a statistically significant difference.
Results
Scatter plot analysis of normalized
gene intensity
A total of 49 genes were detected from the analysis.
The intensity of expression of each detected obesity related-gene
in subcutaneous and visceral adipose tissues was normalized to
various housekeeping genes provided by the arrays. Classic t-tests
showed that adenylate cyclase activating polypeptide 1 (ADCYAP1;
P<0.05) and zinc finger protein 91 (ZFP91; P<0.05) were
significantly upregulated and downregulated genes, respectively, in
the subcutaneous adipose tissue of rats, which were overfed for 2
months (Fig. 1A), whereas ADCYAP1
(P<0.05), UCP1 (P<0.05) and BRS3 (P<0.05) were identified
as significantly downregulated genes in visceral adipose tissues;
however, no significantly upregulated genes were detected in this
tissue between experimental and control rats (Fig. 1B). Statistical analysis identifying
ADCYAP1, ZFP91, UCP1 and BRS3 as DEGs revealed that these genes are
potentially associated with adipose tissue accumulation induced by
excessive dietary intake in rats. In addition, the distribution of
data within the plots is presented, where only the data normalized
to GAPDH are distributed at the centre of the plots. This
phenomenon probably indicated that GAPDH is a suitable housekeeping
gene for the validation of gene expression in the present study
using rats. The housekeeping genes ACTB and GUSB were also measured
in the assays but were not detected in the present study.
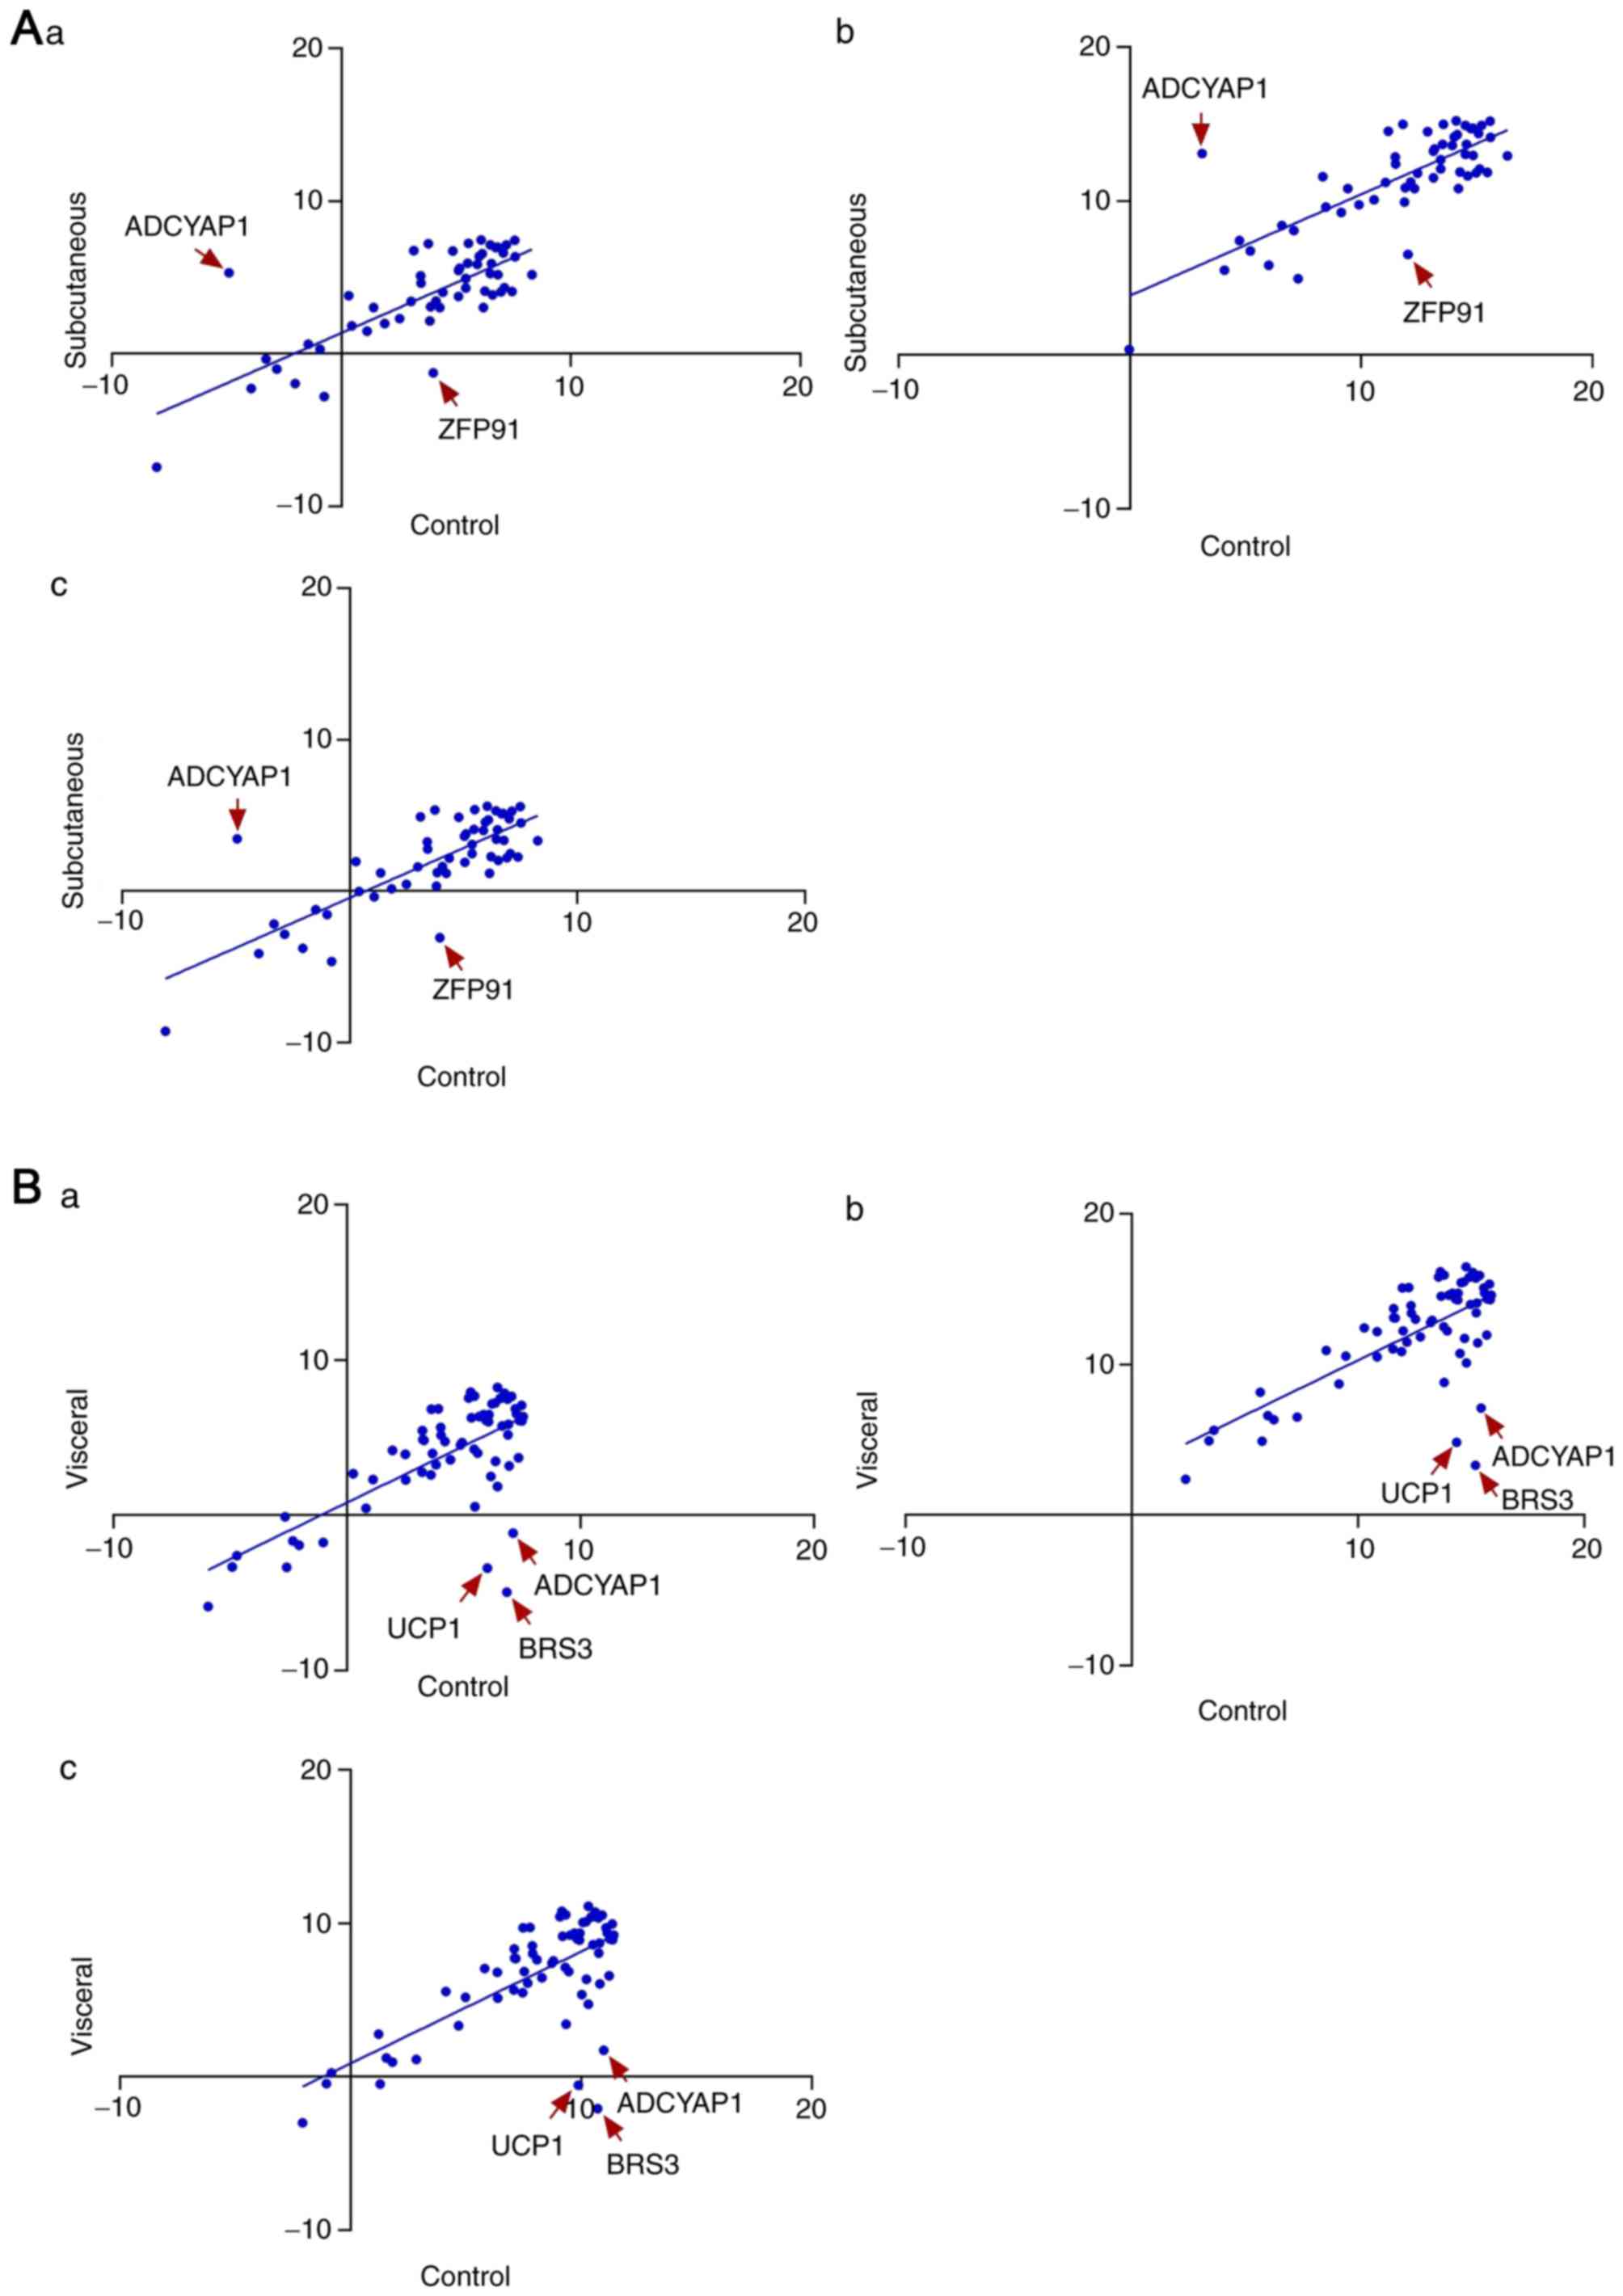 | Figure 1.Scatter plot of subcutaneous and
visceral adipose tissue differentially expressed genes in control
and experimental rats. (A) Gene profiles were normalized to (Aa)
B2M, (Ab) GAPDH and (Ac) HSP90AB1 in subcutaneous adipose tissue,
whereas (B) gene profiles were normalized to (Ba) B2M, (Bb) GAPDH
and (Bc) HSP90AB1 in visceral adipose tissue. Red arrows indicate
ADCYAP1 and ZFP91 as significantly upregulated and downregulated
genes, respectively, in subcutaneous adipose tissue, whereas
ADCYAP1, BRS3 and UCP1 were significantly downregulated in visceral
adipose tissue. B2M, β-2 microglobulin; HSP90AB1, heat shock
protein 90 α (cytosolic)-class B member 1; ADCYAP1, adenylate
cyclase activating polypeptide 1; ZFP91, zinc finger protein 91;
BRS3, bombesin-like receptor 3; UCP1, uncoupling protein 1. |
Volcano plot and heatmap-dendrogram
analyses for DEG identification
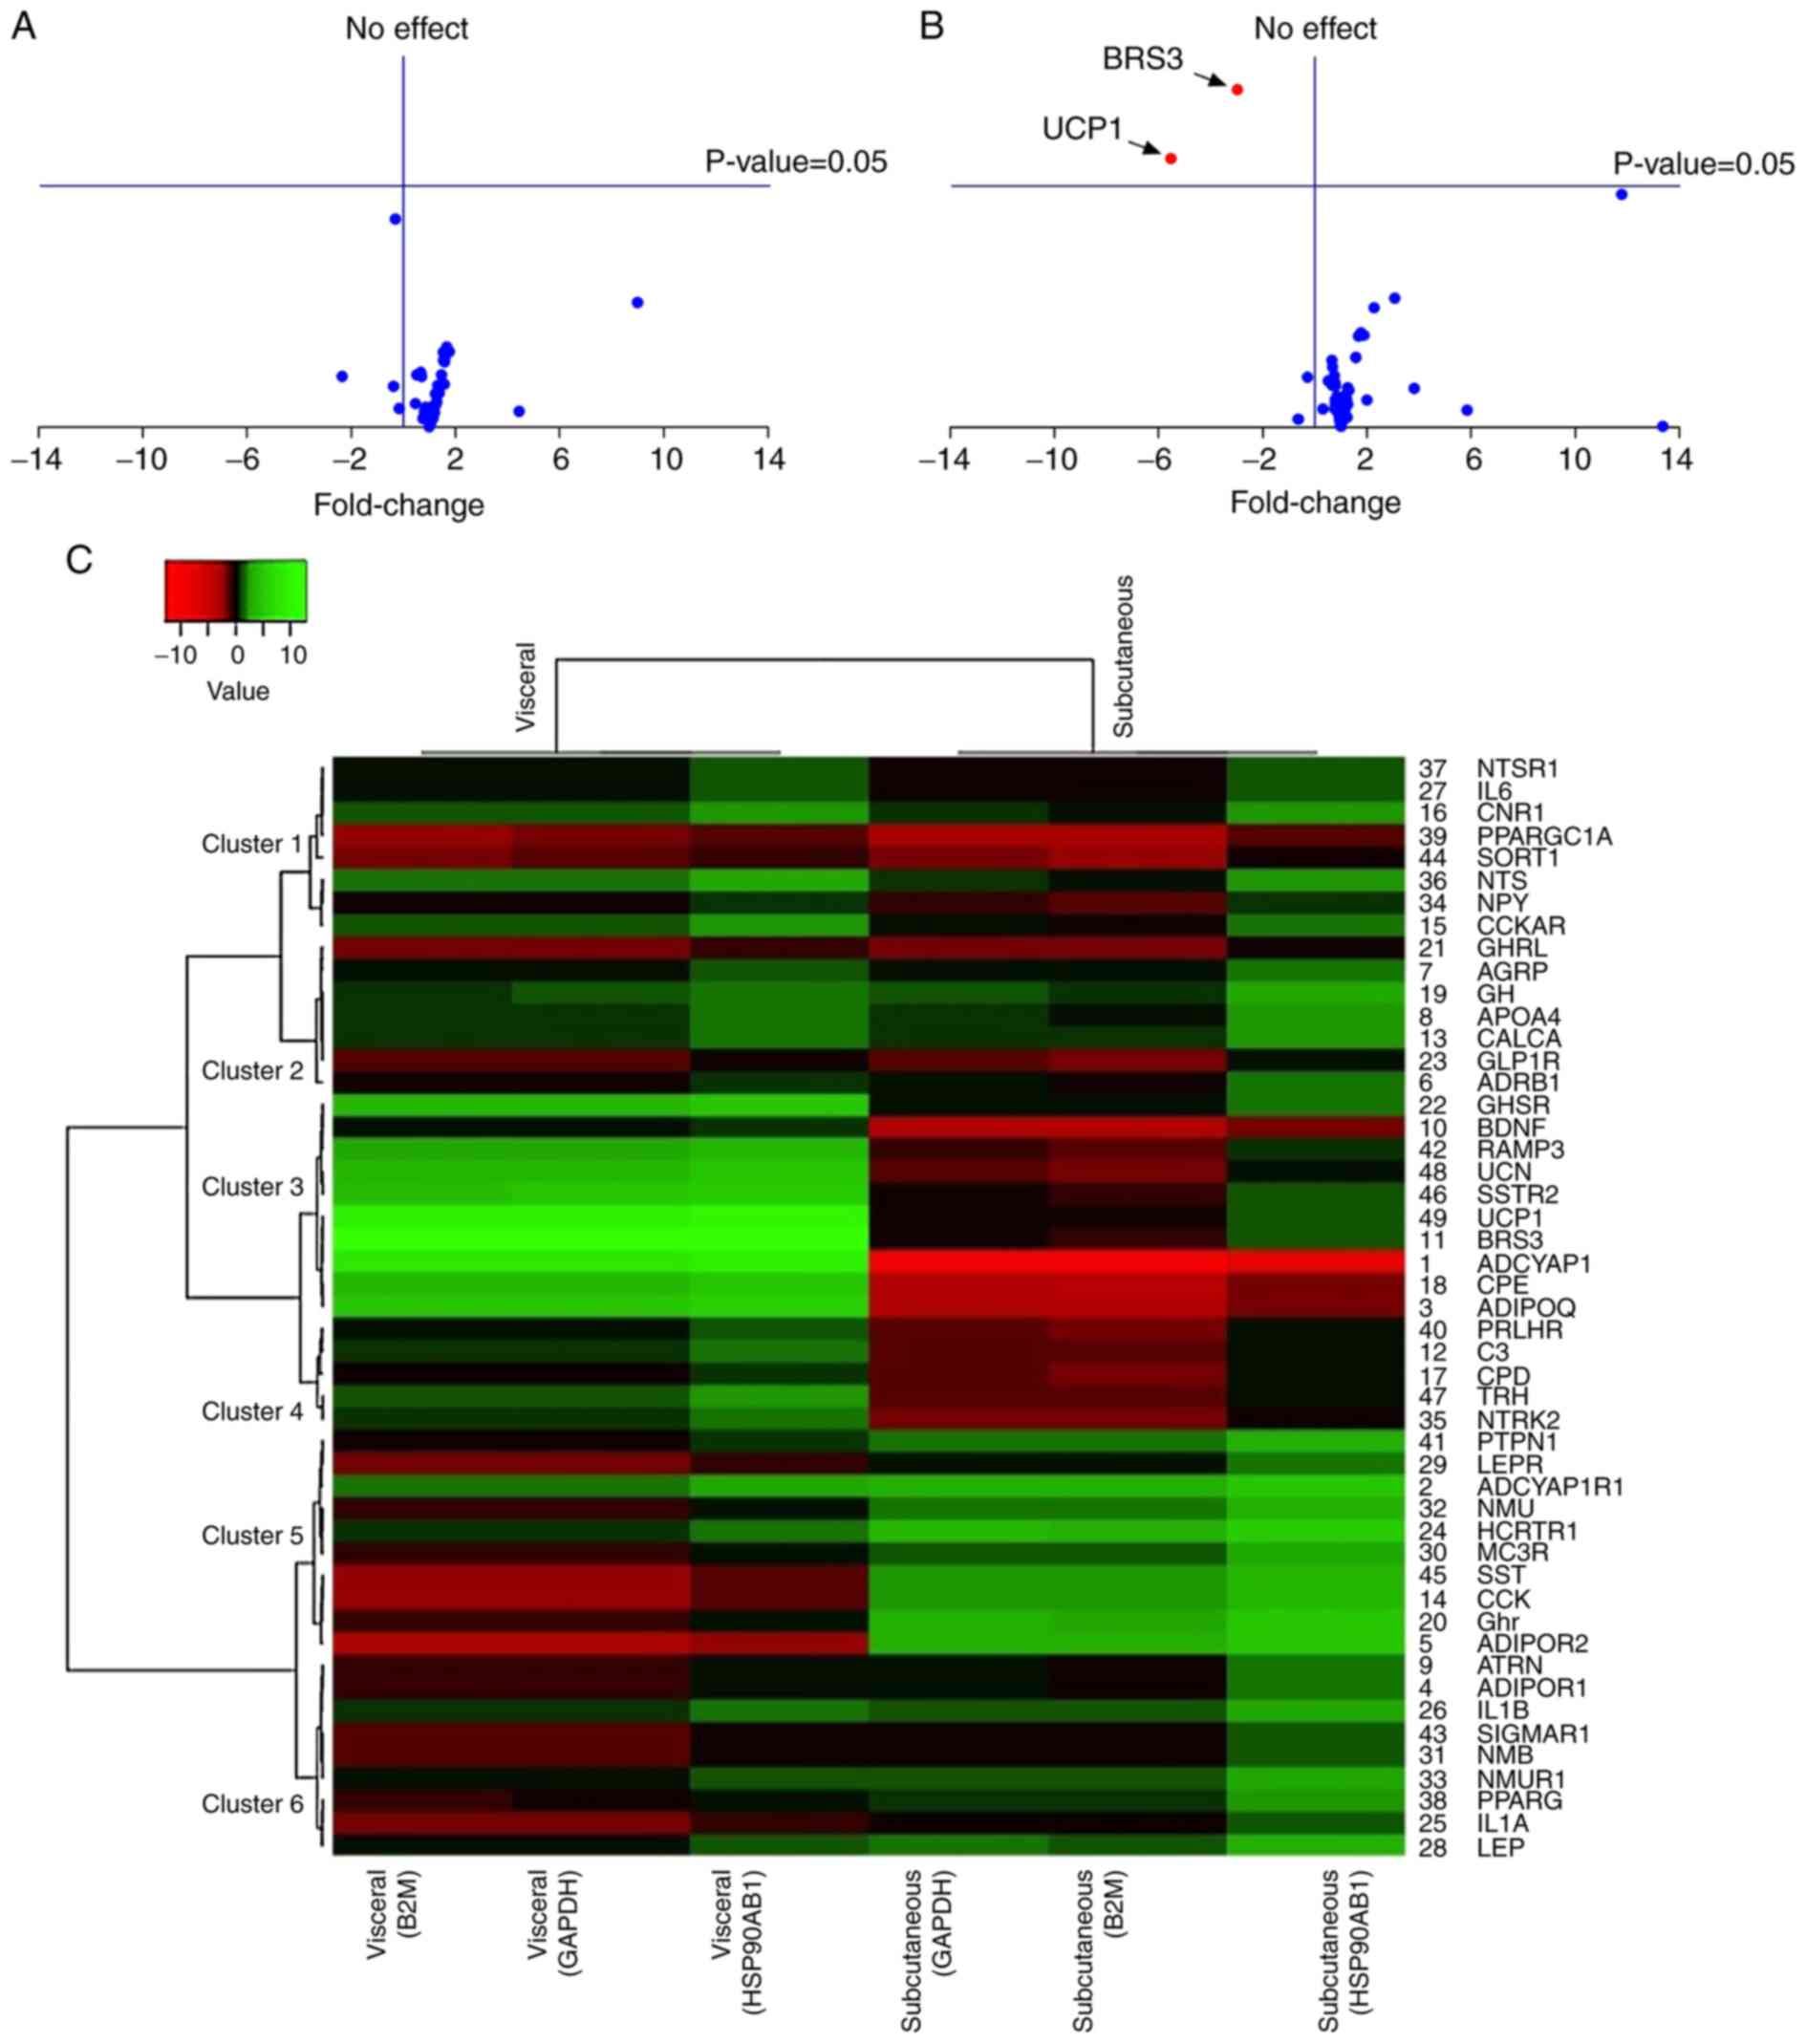
In using volcano plots to illustrate fold change, no
gene was identified as significantly different in expression in the
subcutaneous adipose tissue (Fig.
2A), whereas 2 genes, BRS3 and UCP1, were identified as
significantly downregulated in visceral adipose tissue (Fig. 2B), with fold changes of 12.0
(P<0.05) and 9.64 (P<0.05), respectively, using classic
t-tests. The present study next explored obesity-related DEGs by
clustering the log2 fold change for each gene in
subcutaneous and visceral adipose tissues in a heatmap-dendrogram.
Out of 49 analyzed genes in the heatmap, only 5 genes (10.2%) were
≥2-fold downregulated and 6 genes (12.2%) were ≥2-fold upregulated
in subcutaneous tissue. In addition, 4 genes (8.2%) showed ≥2-fold
downregulation and 9 genes (18.4%) showed ≥2-fold upregulation in
visceral adipose tissue after removing the group of genes that were
normalized to HSP90AB1 and shown to be incompatible (Fig. 2C). Based on P<0.05 as the
cut-off point, 8 genes, including brain-derived neurotrophic
factor, BRS3, growth hormone receptor, growth hormone secretagogue
receptor (GHSR), hypocretin receptor 1, somatostatin receptor 2
(SSTR2), urocortin (UCN) and UCP1, were identified as
differentially expressed in visceral adipose tissue. The expression
of BRS3 and UCP1 was also observed to significantly differ in
visceral adipose tissue in both analyses. Therefore, BRS3 and UCP1
in visceral adipose tissue were selected for subsequent studies
(Table I). A dendrogram that was
constructed to show the expression-based relationship of BRS3 and
UCP1 across the entire set of expressed genes in the experiment
included GHSR, receptor activity-modifying protein 3, UCN, SSTR2,
ADCYAP1, carboxypeptidase E and adiponectin (Cluster 3; Fig. 2C).
 | Table I.Selected differentially expressed
genes in visceral adipose tissue. |
Table I.
Selected differentially expressed
genes in visceral adipose tissue.
| Gene | Average expression
value (log2 fold change) | P-value | Expression
alteration |
|---|
| BRS3 | −2.977 | 0.014996 | Downregulated |
| UCP1 | −5.527 | 0.035315 | Downregulated |
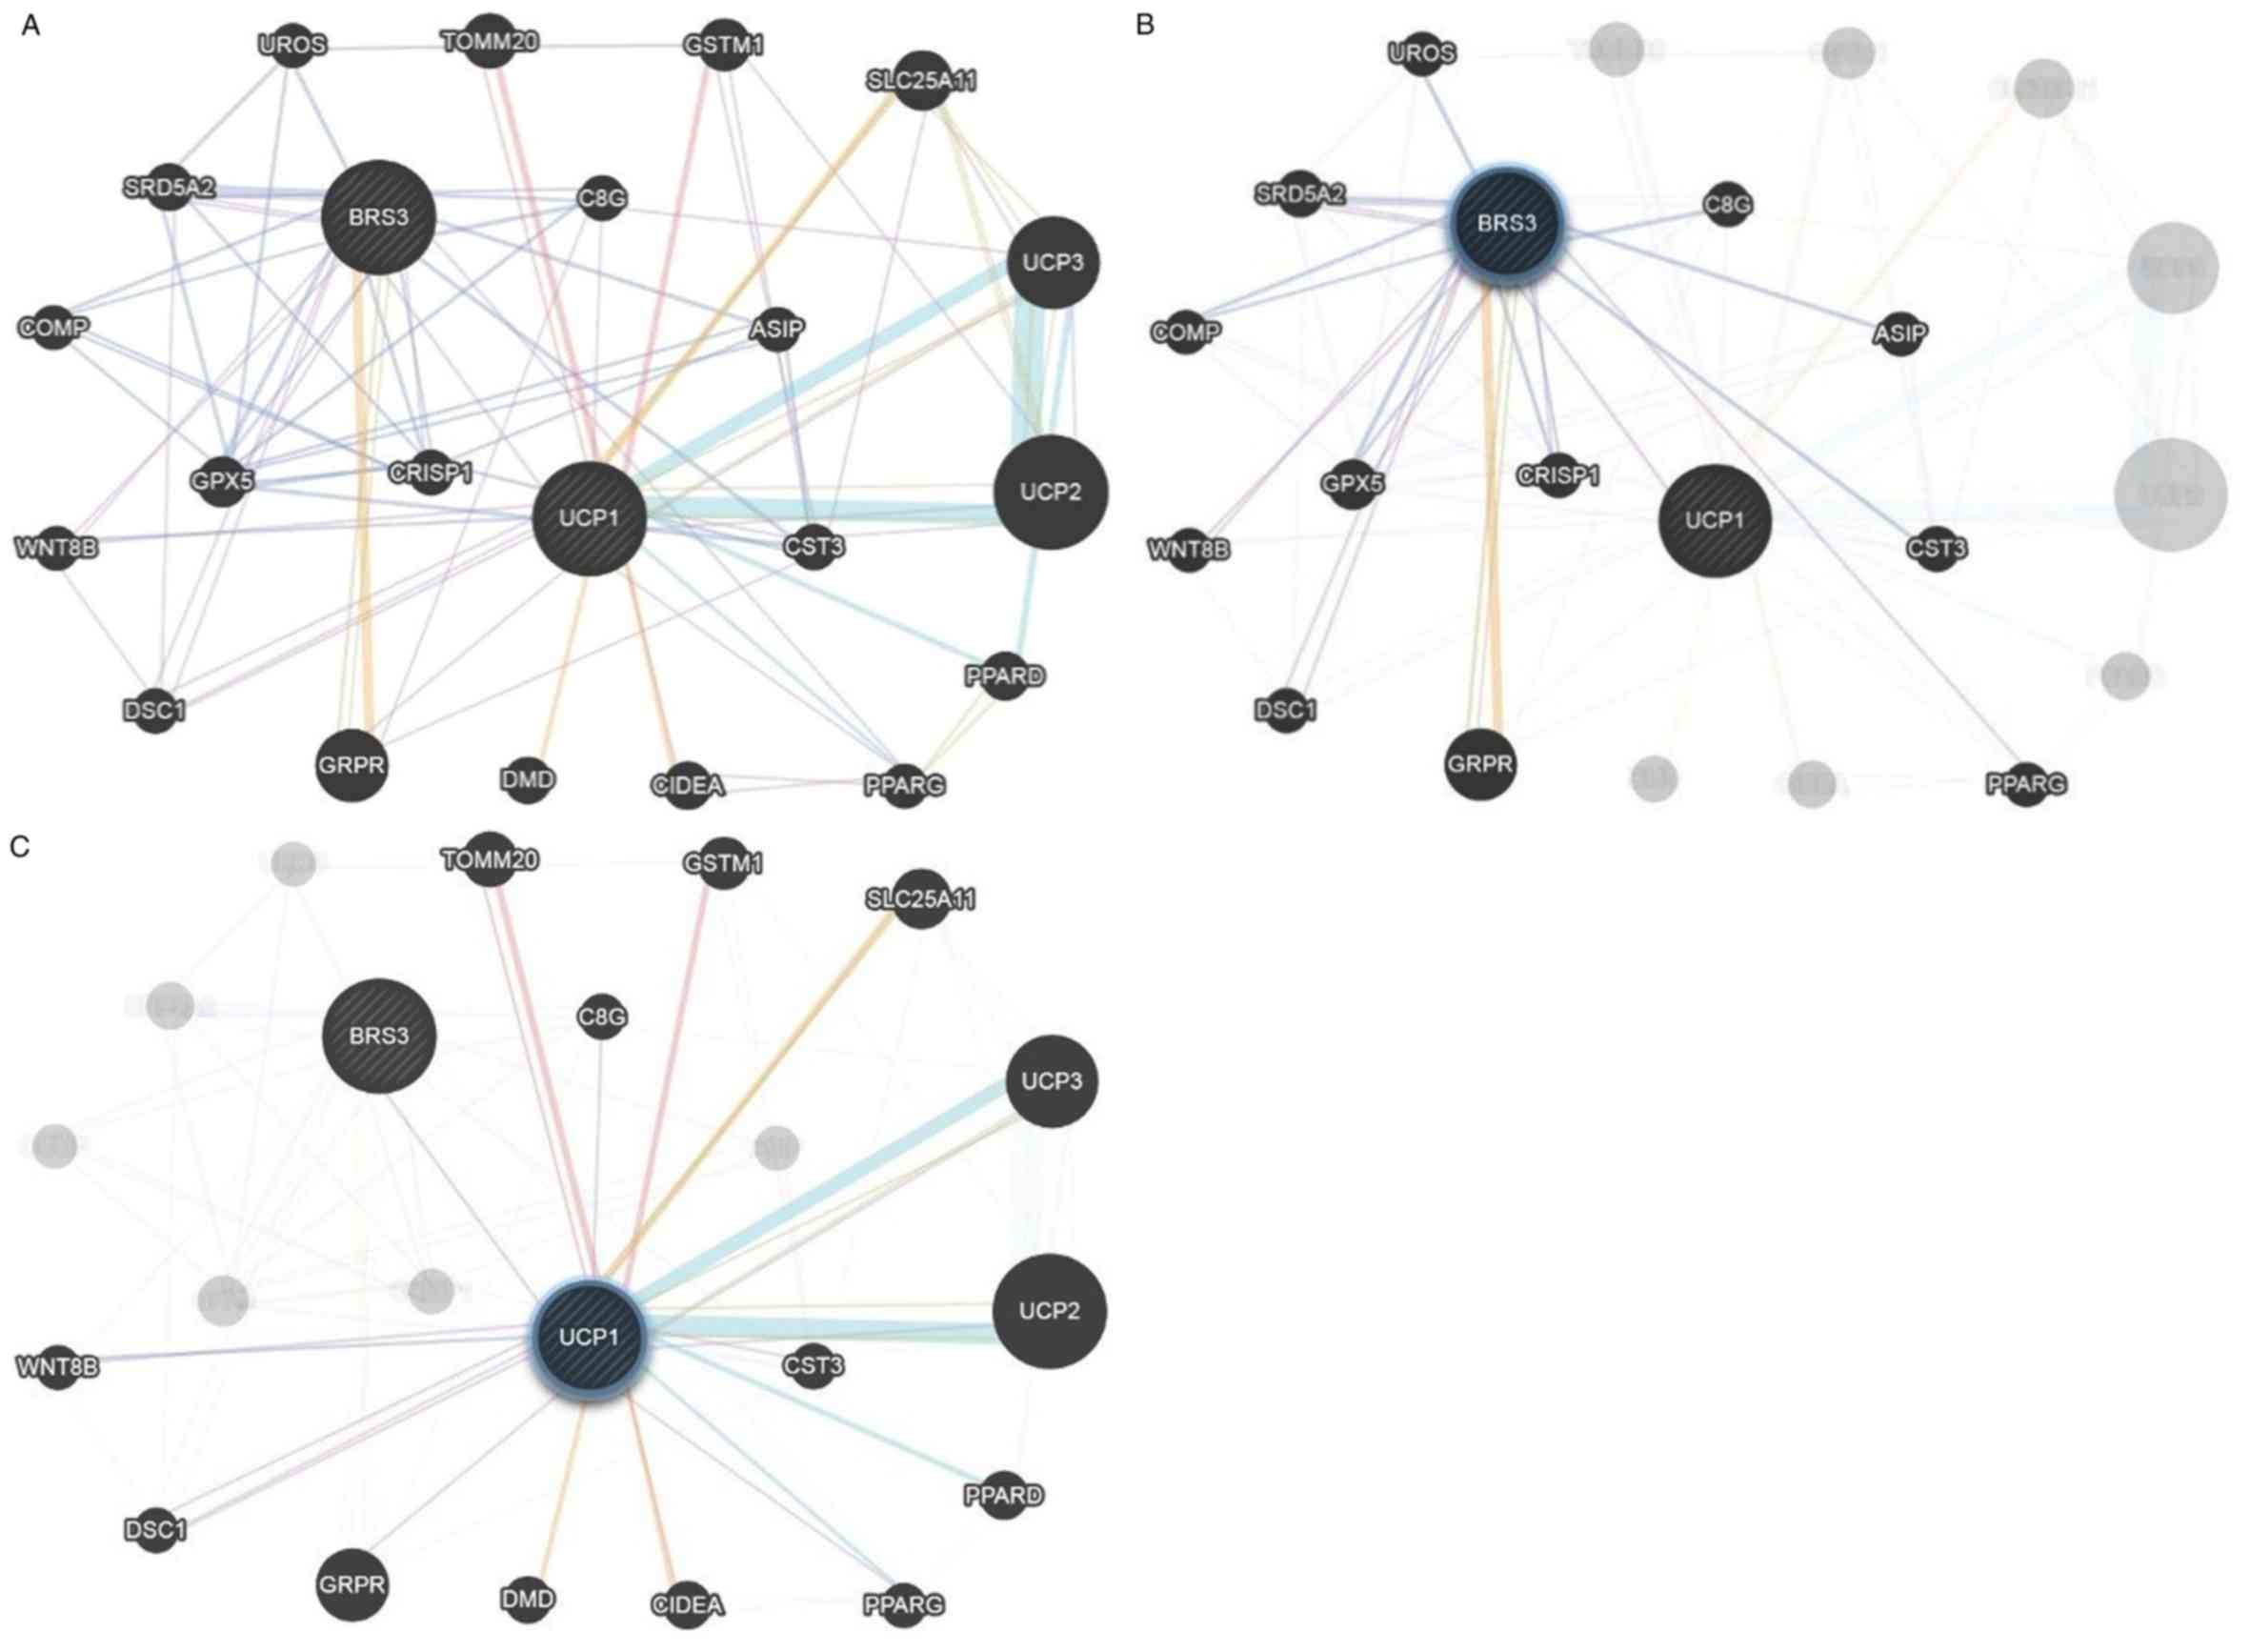
Functional enrichment analysis of key
DEGs in visceral adipose tissue
Construction of weighted composite gene-gene
functional interaction networks for BRS3 and/or UCP1 from a list of
genes using GeneMANIA are shown in Fig. 3. The networks included 20 gene
interactions, in which 13 and 15 genes were associated with BRS3
and UCP1, respectively. The results of the list indicated that the
key DEGs, BRS3 and UCP1, which are commonly found in visceral
adipose tissue, are mostly associated with complement C8γ (C8G),
cystatin 3 (CST3), Wnt-8b (WNT8B), desmocollin-1 (DSC1),
gastrin-releasing peptide receptor (GRPR) and PPARG, and that the
functional annotations of each gene from GO are highlighted in
Table II. PPARG may be closely
associated with BRS3 and UCP1 in fat cell differentiation,
sequestering of triglycerides and regulation of sequestering of
triglycerides, and fatty acid binding in visceral adipose tissue
development. In addition to PPARG, other genes, including C8G,
CST3, WNT8B, DSC1 and GRPR, were also identified in the composite
networks. The results also showed that BRS3 is associated with
PPARG and WNT8B (Fig. 4A), whereas
UCP1 is associated with PPARG, CST3, DSC1, C8G and GRPR (Fig. 4B). Therefore, BRS3, UCP1 and PPARG
may be useful as biomarkers for the design of drugs or
cost-effective agents to reduce visceral adipose accumulation and
its associated diseases, including breast cancer.
| Table II.Gene Ontology functional annotation
of composite networks for BRS3 and UCP1. |
Table II.
Gene Ontology functional annotation
of composite networks for BRS3 and UCP1.
| Function | Genes in
network | Gene symbol | Fold change
discovery |
|---|
| Fat cell
differentiation | 2 |
PPARD | 0.0007 |
|
|
|
PPARG | 0.0005 |
| Sequestering of
triglyceride | 1 |
CIDEA | 0.0007 |
|
|
|
PPARG | 0.0005 |
| Proton
transport | 2 |
UCP2 | 0.0049 |
|
|
|
UCP3 | 0.0035 |
| Organelle inner
membrane | 3 |
UCP2 | 0.0049 |
|
|
|
UCP3 | 0.0035 |
|
|
|
SLC25A11 | 0.0014 |
| Hydrogen
transport | 2 |
UCP2 | 0.0049 |
|
|
|
UCP3 | 0.0035 |
| Mitochondrial
membrane | 4 |
UCP2 | 0.0049 |
|
|
|
UCP3 | 0.0035 |
|
|
|
SLC25A11 | 0.0014 |
|
|
|
TOMM20 | 0.0011 |
| Mitochondrial inner
membrane | 3 |
UCP2 | 0.0049 |
|
|
|
UCP3 | 0.0035 |
|
|
|
SLC25A11 | 0.0014 |
| Regulation of
sequestering of triglyceride | 1 |
CIDEA | 0.0007 |
|
|
|
PPARG | 0.0005 |
| Electron transport
chain | 2 |
UCP2 | 0.0049 |
|
|
|
UCP3 | 0.0035 |
| Fatty acid
binding | 1 |
PPARD | 0.0007 |
|
|
|
PPARG | 0.0005 |
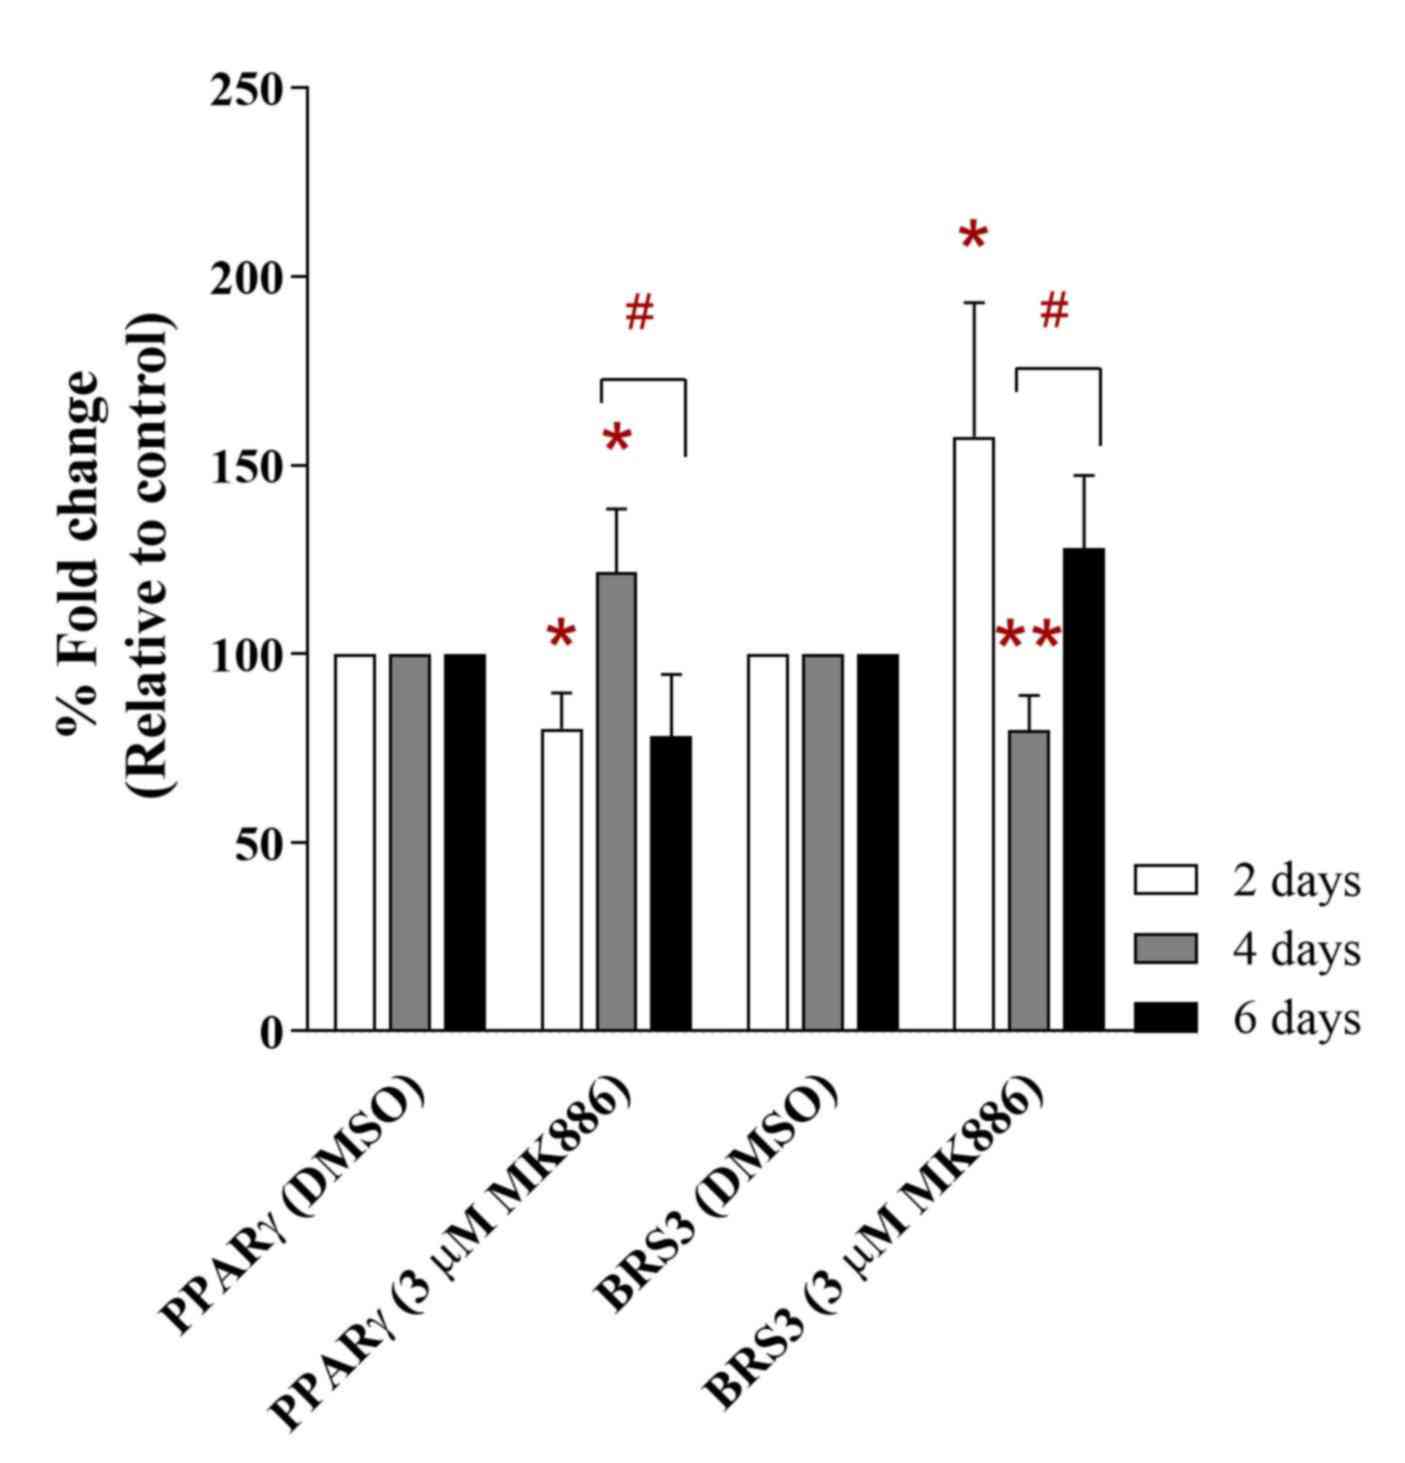
Validation of BRS3 and UCP1 peak
concentrations in breast cancer cell lines
The peak concentrations of BRS3 and UCP1 were
analyzed in breast cancer cell lines using PCR and Bioanalyzer. The
gene validation showed that the peak concentrations for both BRS3
and UCP1 were not detected in MCF-7 cells, whereby only GAPDH was
identified as a detectable peak at 0.62 ng/µl (Table III). UCP1 was also not detected
in MDA-MB-231 cells. Only BRS3 (3.72 ng/µl) and GAPDH (0.36 ng/µl)
were detected in the cells, indicating that BRS3 may play an
important role in the activity of highly metastatic breast cancer
cells. A similar mRNA expression profile for PPARG and BRS3 was
also observed when MDA-MB-231 cells were treated with MK886 (a
PPARG inhibitor). MK886 (3 µM) inhibited the level of PPARG mRNA
expression by ~80.15% of fold change (P<0.05) compared with
control cells as early as 2 days following treatment (Fig. 5). The treatment was found to induce
upregulation of PPARG mRNA expression (~121.55% of fold change,
P<0.05) at day 4 of treatment compared to the control. Moreover,
the mRNA expression level of PPARG was inhibited at day 6 following
treatment with MK886 (~78.15% of fold change) compared with the
control, indicating that the drug effectively inhibited PPARG in
MDA-MB-231 cells. There was also a significant difference between
the mRNA expression levels of reduction in PPARG at day 6 compared
with day 4 in MK886-treated MDA-MB-231 cells (P<0.05).
Furthermore, a different expression profile of BRS3 in MDA-MB-231
cells was observed after treatement with the PPARG inhibitor for 6
days. A higher level of BRS3 expression was found when the PPARG
inhibitor was first introduced to MDA-MB-231 cells for 2 days
(~157.51% of fold change; P<0.05). In addition, BRS3 expression
level was reduced to ~79.74% of fold change (P<0.01) after 4
days, at which point PPARG expression was induced. The expression
level of BRS3 was further increased to ~128.10% of fold change at
day 6, when PPARG expression was downregulated. There was also a
significant difference between the levels of BRS3 mRNA expression
at day 6 compared with day 4 in MK886-treated MDA-MB-231 cells
(P<0.05). This phenomenon further indicated that PPARG and BRS3
expression may be associated, which may play a role in the activity
of highly metastatic breast cancer cells.
| Table III.Peak level of gene expression in
breast cancer cells. |
Table III.
Peak level of gene expression in
breast cancer cells.
| Cell line | Gene | Peak concentration
(ng/µl) |
|---|
| MCF-7 |
BRS3 | Not determined |
|
|
UCP1 | Not determined |
|
|
GAPDH | 0.62 |
| MDA-MB-231 |
BRS3 | 3.72 |
|
|
UCP1 | Not determined |
|
|
GAPDH | 0.36 |
Discussion
The present study identified BRS3 and UCP1 as DEGs
in visceral adipose tissue of rats with an excess dietary intake.
The gene network may be associated with PPARG, as increased
expression of PPARG was detected in visceral adipose tissue in our
previous study (18). PPARG, which
is widely described as playing an important role in adipocyte
proliferation and differentiation, as well as in the conversion of
various cells into adipose-like cells (25–30),
was implicated in the visceral adipose tissue accumulation of the
experimental rats in the present study. PPARG expression is also
potentially associated with serum levels of C-C motif chemokine
ligand 2 and interleukin-6 in rats (18), which may facilitate the
accumulation of visceral adipose tissue, indicating that PPARG
serves a role in this phenomenon. However, whether PPARG is
directly or inversely associated with BRS3 and UCP1 in visceral
adipose tissue accumulation needs further investigation.
The results of the present study suggested that
BRS3, UCP1 and PPARG could be an important group of genes involved
in the accumulation of excess visceral adipose tissue. BRS3 is an
orphan G protein-coupled receptor that has been shown to regulate
blood pressure and heart rate through a central sympathetic
mechanism (31), whereas UCP1 is a
primary regulator of thermogenesis that is likely to play an
important role in the regulation of body adiposity (32). UCP1 has been demonstrated to be
regulated by PPARG during adipocyte differentiation and lipid
oxidation (33). However, studies
into the association between BRS3 and PPARG remain rare. BRS3 is an
important factor that should be considered in the gene network, as
depletion of this gene alters adiposity, but also influences blood
pressure and heart rate in animal models, which is undesirable in
clinical treatment (31). The
effects of social isolation on body weight gain, food consumption
and responsiveness to a novel, as well as social, environment has
been assessed in BRS3-deficient mice (34). However, the effect of BRS3 on
visceral adiposity has yet to be fully elucidated. Notably, the
expression of this gene was detected in highly metastatic breast
cancer cells in the present study, which is consistent with a
previous study describing that excessive accumulation of adipose
tissues is one of the well-known risk factors for breast cancer
(35). The present study also
found that PPARG and BRS3 are associated. The strategy of PPARG
inhibition must be considered with caution during anti-disease
agent design, as inhibition of PPARG alone may not play an absolute
role in body adiposity or disease reduction, but it may affect
blood pressure and heart rate due to its association with BRS3.
Therefore, BRS3 gene expression will be one of the essential
targets in the gene network in future studies.
Furthermore, a lack of UCP1 may convey a tendency
towards fat accumulation, which can be further confirmed by the
analysis in the present study. The study showed that downregulation
of UCP1 increased visceral adipose tissue accumulation. UCP1
depletion also results in poor thermoregulation and susceptibility
to cold (32). As such, it is
hypothesized that UCP1 may be an important factor in the
development of anti-disease agents from local natural products in
the future, whereby activation or upregulation of UCP1 is likely to
regulate adiposity negatively. This is supported by the observation
that reconstitution of UCP1 in the white adipose tissue of an
animal model was demonstrated to decrease fat deposition and
improve thermogenic capacity, which may also be a potential and
valuable resource for the production of lean meat (32). All factors in this gene network
require careful validation at cell-specific level before more
costly tissue-specific validation is conducted to support their use
in the agricultural sector or for potential anti-disease agent
development.
The accumulation of adipose tissue is age-related
(5). A previous report determined
that a metabolic profile predictive of cardiovascular disease
showed an increased risk in middle-aged premenopausal women
compared with young women. Similarly, this phenomenon can also be
explained by our previous study, which demonstrated a significant
increase in the body weight of male rats as early as 2 months after
the feeding regimen had begun, and which is probably due to the
excessive accumulation of subcutaneous adipose tissue before
visceral adipose tissue accumulation (18). Moreover, middle-aged individuals
have been found to have elevated levels of total visceral adipose
tissue and greater body adipose tissue mass compared with younger
control subjects (5). The pattern
of gene expression that occurs during excessive accumulation of
subcutaneous and visceral adipose tissues, as detected in the
present study, may lay a useful foundation for exploration in
preclinical trials and future investigation for human diseases.
Collectively, due to the small sample size in the
present preliminary study, the results should be confirmed in
larger cohorts. As stated in the Materials and methods, the
selection criteria of obese rats were based on a previous study
(18), where 2 months of feeding
with twice the amount of the ordinary diet induced a significant
increase visceral adipose tissue accumulation. The group sizes for
this study (n=3) were based on the principles of 3Rs (Replacement,
Reduction and Refinement) for humane animal research. A small
sample size reduces the significance level of the study and
increases the margin of error, which can render the study
meaningless, as well as leading to cases of bias. In addition, a
small sample size may also prevent the findings from being
extrapolated (36). However, the
present study identifed the same results as our previous study that
was conducted using the same strategy, thus proving that the
experiment is reproducible (18).
In conclusion, the expression of BRS3, UCP1 and
PPARG were predicted to be associated with early accumulation of
visceral adipose tissue in the body. However, careful validation
must be applied before this gene network can be used for studies of
visceral adipose tissue-associated diseases, including cancers, and
the development of anti-disease agents.
Acknowledgements
The authors thank Professor Hiroshi Sugiyama and the
team at Department of Chemistry, Graduate School of Science of
Kyoto University, Kyoto for their technical support. The
corresponding author would also like to thank Mr. Hiroshi
Katsumoto, Thermo Fisher Scientific, Life Technologies, Tokyo,
Japan for allowing the use of the Primer Express™ Software v3.0.1
License for primer design.
Funding
The present study was funded by a Fundamental
Research Grant Scheme (grant no. 203/CIPPM/6711119) from the
Ministry of Higher Education and partly funded by a Long-Term
Research Grant Scheme-Malaysia Research University Network (grant
no. 203/CIPPM/6720020). The second author was also supported by a
USM fellowship from the Institute of Postgraduate Studies,
Universiti Sains Malaysia.
Availability of data and materials
The datasets used and/or analyzed during the current
study are available from the corresponding author on reasonable
request.
Authors' contributions
JCY conceived the present study. BYK collected and
analyzed data. TY and SKL performed experiments. BYK and GBYT
designed the study. BYK and GBYT were responsible for supervising
the study. BYK was responsible for visualization of data. TY wrote
the original draft of the manuscript, and BYK reviewed and edited
the manuscript.
Ethics approval and consent to
participate
Experiments involving the use of animals were
performed according to the Guidelines for the Care and Use of
Animals for Scientific Purposes (19) after obtaining the ethical approval
from the Universiti Sains Malaysia Animal Ethics Committee [permit
no. USM/PPSF/50(085) Jld.2].
Patient consent for publication
Not applicable.
Competing interests
The authors declare that they have no competing
interests.
References
|
1
|
Sharma AM and Staels B: Review: Peroxisome
proliferator-activated receptor gamma and adipose
tissue-understanding obesity-related changes in regulation of lipid
and glucose metabolism. J Clin Endocrinol Metab. 92:386–395. 2007.
View Article : Google Scholar : PubMed/NCBI
|
|
2
|
Wajchenberg BL: Subcutaneous and visceral
adipose tissue: Their relation to the metabolic syndrome. Endocr
Rev. 21:697–738. 2000. View Article : Google Scholar : PubMed/NCBI
|
|
3
|
Bjørndal B, Burri L, Staalesen V, Skorve J
and Berge RK: Different adipose depots: Their role in the
development of metabolic syndrome and mitochondrial response to
hypolipidemic agents. J Obes. 2011:4906502011. View Article : Google Scholar : PubMed/NCBI
|
|
4
|
Shuster A, Patlas M, Pinthus JH and
Mourtzakis M: The clinical importance of visceral adiposity: A
critical review of methods for visceral adipose tissue analysis. Br
J Radiol. 85:1–10. 2012. View Article : Google Scholar : PubMed/NCBI
|
|
5
|
Pascot A, Lemieux S, Lemieux I, Prud'homme
D, Tremblay A, Bouchard C, Nadeau A, Couillard C, Tchernof A,
Bergeron J and Després JP: Age-related increase in visceral adipose
tissue and body fat and the metabolic risk profile of premenopausal
women. Diabetes Care. 22:1471–1478. 1999. View Article : Google Scholar : PubMed/NCBI
|
|
6
|
Romieu I, Dossus L, Barquera S, Blottière
HM, Franks PW, Gunter M, Hwalla N, Hursting SD, Leitzmann M,
Margetts B, et al: Energy balance and obesity: What are the main
drivers? Cancer Causes Control. 28:247–258. 2017. View Article : Google Scholar : PubMed/NCBI
|
|
7
|
Swinburn BA, Caterson I, Seidell JC and
James WP: Diet, nutrition and the prevention of excess weight gain
and obesity. Public Health Nutr. 7:123–146. 2004. View Article : Google Scholar : PubMed/NCBI
|
|
8
|
Fonseca DC, Sala P, Ferreira BAM, Reis J,
Torrinhas RS, Bendavid I and Waitzberg DL: Body weight control and
energy expenditure. Clin Nutr Exp. 20:55–59. 2018. View Article : Google Scholar
|
|
9
|
ParÏõÂzkova J: Dietary habits and
nutritional status in adolescents in central and eastern europe.
Eur J Clin Nutr. 54 (Suppl 1):S36–S40. 2000. View Article : Google Scholar : PubMed/NCBI
|
|
10
|
Racette SB, Deusinger SS and Deusinger RH:
Obesity: Overview of prevalence, etiology, and treatment. Phys
Ther. 83:276–288. 2003. View Article : Google Scholar : PubMed/NCBI
|
|
11
|
De Lorenzo A, Soldati L, Sarlo F, Calvani
M, Di Lorenzo N and Di Renzo L: New obesity classification criteria
as a tool for bariatric surgery indication. World J Gastroenterol.
22:681–703. 2016. View Article : Google Scholar : PubMed/NCBI
|
|
12
|
Cozzo AJ, Fuller AM and Makowski L:
Contribution of adipose tissue to development of cancer. Compr
Physiol. 8:237–282. 2017. View Article : Google Scholar : PubMed/NCBI
|
|
13
|
Li L, Wang G, Li N, Yu H, Si J and Wang J:
Identification of key genes and pathways associated with obesity in
children. Exp Ther Med. 14:1065–1073. 2017. View Article : Google Scholar : PubMed/NCBI
|
|
14
|
Choe SS, Huh JY, Hwang IJ, Kim JI and Kim
JB: Adipose tissue remodeling: Its role in energy metabolism and
metabolic disorders. Front Endocrinol (Lausanne). 7:302016.
View Article : Google Scholar : PubMed/NCBI
|
|
15
|
Luo L and Liu M: Adipose tissue in control
of metabolism. J Endocrinol. 231:R77–R99. 2016. View Article : Google Scholar : PubMed/NCBI
|
|
16
|
Khoo BY, Najimudin N and Muhammad TS: The
PPARgamma coding region and its role in visceral obesity. Biochem
Biophys Res Commun. 371:177–179. 2008. View Article : Google Scholar : PubMed/NCBI
|
|
17
|
Longo M, Zatterale F, Naderi J, Parrillo
L, Formisano P, Raciti GA, Beguinot F and Miele C: Adipose tissue
dysfunction as determinant of obesity-associated metabolic
complications. Int J Mol Sci. 20:E23582019. View Article : Google Scholar : PubMed/NCBI
|
|
18
|
Yogarajah T, Bee YT, Noordin R and Yin KB:
Increased peroxisome proliferator-activated receptor γ expression
levels in visceral adipose tissue, and serum CCL2 and interleukin-6
levels during visceral adipose tissue accumulation. Mol Med Rep.
11:515–520. 2015. View Article : Google Scholar : PubMed/NCBI
|
|
19
|
Division of Research and Innovation, .
Guidelines for the care and use of animals for scientific purposes.
Universiti Sains Malaysia; 2016, http://www.research.usm.my/default.asp?tag=10&f=1&k=1
|
|
20
|
Livak KJ and Schmittgen TD: Analysis of
relative gene expression data using real-time quantitative PCR and
the 2(-Delta Delta C(T)) method. Methods. 25:402–408. 2001.
View Article : Google Scholar : PubMed/NCBI
|
|
21
|
Ashburner M, Ball CA, Blake JA, Botstein
D, Butler H, Cherry JM, Davis AP, Dolinski K, Dwight SS, Eppig JT,
et al: Gene ontology: Tool for the unification of biology. The Gene
Ontology Consortium. Nat Genet. 25:25–29. 2000. View Article : Google Scholar : PubMed/NCBI
|
|
22
|
The Gene Ontology Consortium, . The gene
ontology resource: 20 years and still GOing strong. Nucleic Acids
Res. 47:D330–D338. 2019. View Article : Google Scholar : PubMed/NCBI
|
|
23
|
Mi H, Muruganujan A, Ebert D, Huang X and
Thomas PD: PANTHER version 14: More genomes, a new PANTHER GO-slim
and improvements in enrichment analysis tools. Nucleic Acids Res.
47:D419–D426. 2019. View Article : Google Scholar : PubMed/NCBI
|
|
24
|
Nadarajan K, Balaram P and Khoo BY: MK886
inhibits the pioglitazone-induced anti-invasion of MDA-MB-231 cells
is associated with PPARα/γ, FGF4 and 5LOX. Cytotechnology.
68:1771–1787. 2016. View Article : Google Scholar : PubMed/NCBI
|
|
25
|
Desvergne B and Wahli W: Peroxisome
proliferator-activated receptors: Nuclear control of metabolism.
Endocr Rev. 20:649–688. 1999. View Article : Google Scholar : PubMed/NCBI
|
|
26
|
Yang WL and Frucht H: Activation of the
PPAR pathway induces apoptosis and COX-2 inhibition in HT-29 human
colon cancer cells. Carcinogenesis. 22:1379–1383. 2001. View Article : Google Scholar : PubMed/NCBI
|
|
27
|
Lee YH, Mottillo EP and Granneman JG:
Adipose tissue plasticity from WAT to BAT and in between. Biochim
Biophys Acta Mol Basis Dis. 1842:358–369. 2014. View Article : Google Scholar
|
|
28
|
Giralt M and Villarroya F: White, brown,
beige/brite: Different adipose cells for different functions?
Endocrinology. 154:2992–3000. 2013. View Article : Google Scholar : PubMed/NCBI
|
|
29
|
Park HS, Ju UI, Park JW, Song JY, Shin DH,
Lee KH, Jeong LS, Yu J, Lee HW, Cho JY, et al: PPARγ neddylation
essential for adipogenesis is a potential target for treating
obesity. Cell Death Differ. 23:1296–1311. 2016. View Article : Google Scholar : PubMed/NCBI
|
|
30
|
Ghaben AL and Scherer PE: Adipogenesis and
metabolic health. Nature Reviews Molecular Cell Biology volume.
20:242–258. 2019. View Article : Google Scholar
|
|
31
|
Lateef DM, Xiao C, Brychta RJ, Diedrich A,
Schnermann J and Reitman ML: Bombesin-like receptor 3 regulates
blood pressure and heart rate via a central sympathetic mechanism.
Am J Physiol Heart Circ Physiol. 310:H891–H898. 2016. View Article : Google Scholar : PubMed/NCBI
|
|
32
|
Zheng Q, Lin J, Huang J, Zhang H, Zhang R,
Zhang X, Cao C, Hambly C, Qin G, Yao J, et al: Reconstitution of
UCP1 using CRISPR/Cas9 in the white adipose tissue of pigs
decreases fat deposition and improves thermogenic capacity. Proc
Natl Acad Sci USA. 114:E9474–E9482. 2017. View Article : Google Scholar : PubMed/NCBI
|
|
33
|
Villarroya F, Iglesias R and Giralt M:
PPARs in the control of uncoupling proteins gene expression. PPAR
Res. 2007:743642007. View Article : Google Scholar : PubMed/NCBI
|
|
34
|
Yamada K, Ohki-Hamazaki H and Wada K:
Differential effects of social isolation upon body weight, food
consumption, and responsiveness to novel and social environment in
bombesin receptor subtype-3 (BRS-3) deficient mice. Physiol Behav.
68:555–561. 2000. View Article : Google Scholar : PubMed/NCBI
|
|
35
|
Blücher C and Stadler SC: Obesity and
breast cancer: Current insights on the role of fatty acids and
lipid metabolism in promoting breast cancer growth and progression.
Front Endocrinol (Lausanne). 8:2932017. View Article : Google Scholar : PubMed/NCBI
|
|
36
|
Faber J and Fonseca LM: How sample size
influences research outcomes. Dental Press J Orthod. 19:27–29.
2014. View Article : Google Scholar : PubMed/NCBI
|