Introduction
Although most patients with infection exhibit
leukocytosis, which contributes to rapid inherent immunological
defense, a certain portion of these patients experience
leukocytopenia (1). In patients
with leukocytopenia, pathogens are more likely to escape from
immunocytes, increasing the severity of infection symptoms and
complicating infection control, thereby prolonging the course of
anti-infective treatment (2).
Leukocytopenia can be caused by a variety of pathogens, such as
bacteria and viruses; however, the detailed mechanisms underlying
leukocytopenia post-infection remain unclear (3,4).
Numerous studies have demonstrated that gene methylation plays an
important role in a variety of pathophysiological processes, and
exploration of pathomechanisms from the perspective of gene
regulation may provide novel approaches for the diagnosis and
treatment of diseases (5,6).
DNA methylation refers to the process via which
methyltransferases modify 5′ terminal promoter region bases and the
pentacoordinate carbon of cytosine-phosphate-guanines (CpGs) in the
first exon to form 5-methylcytosine (7). A CpG island refers to a region with a
CpG sequence density that is 10–20 times higher than the average
density of the sequence, with >50% G + C content in a region
>200 bases; ~50% of human genes contain CpG islands, for ~29,000
total CpG islands, which are normally located in the promoter
region of the gene (8). In normal
cells, CpG islands exist in a non-methylated state; however, high
levels of methylation at CpG islands in housekeeping genes and
tissue-specific genes are closely associated with inactivation of
protein function and the development of cancers and genetic
diseases (9). Furthermore,
methylation of CpG islands in some non-promoter regions, including
intragenic, intergenic and downstream regions, may also cause
pathological changes at the molecular level (10).
Previous studies on methylation have primarily
focused on tumors (5,9); to the best of our knowledge, the role
of DNA methylation in leukocytopenia after infection has not been
reported. Overall, studying the methylation of single genes is
laborious and inefficient, and it fails to reflect the epigenetic
variations in patients with post-infection leukocytopenia.
Furthermore, a large amount of work would be required to verify
individual candidate methylation-regulated genes to determine
whether they cause molecular changes in patients with
post-infection leukocytopenia. Gene chip technology, also known as
microarray technology, is a systematic, complete analytical method
specific for DNA methylation (11). Advantages of this method include
easy operation and high throughput (11). Indeed, detection of methylation
patterns based on this technique has been reported in a number of
studies (11,12).
The present study aimed to apply gene chip
technology to investigate the association of DNA methylation with
post-infection leukocytopenia. To this end, baseline data,
inflammation indices and chemotactic factors of patients with
post-infection leukocytopenia were analyzed, and the methylation
status of the entire genome was analyzed using 450K methylation
chips to establish gene methylation patterns associated with these
patients. Key methylated gene sites were then screened and
verified.
Materials and methods
Study subjects
A total of 30 patients who were diagnosed with
infection complicated by leukocytopenia (<3.5×10⁹/l leukocytes;
mean age, 52.34±12.74 years; age range, 39–65 years) at People's
Hospital of Xinjiang Uygur Autonomous Region (Urumqi, China), were
successively recruited between January 2016 and June 2017. Patients
with leukocytosis (>3.5×10⁹/l leukocytes; n=30; mean age,
53.62±13.08 years; age range, 39–66 years) were also enrolled. The
control group was comprised of 30 healthy volunteers (mean age,
55.76±11.84 years; age range, 43–67 years) who underwent a health
examination at the same hospital during the same period. The
clinical data of the participants were analyzed. From each group,
four individuals were randomly selected for gene-related
examination, and the four with leukocytopenia (designated as A1-A4;
n=4), four with leukocytosis (C1-C4; n=4) and four healthy
volunteers (D1-D4; n=4) constituted the leukocytopenia,
leukocytosis and normal control groups, respectively. Patients with
infection due to unknown pathogens or with non-respiratory
infection were excluded from the leukocytopenia group; those with
leukocytopenia due to chemoradiation, hematological disease or
sulfonamide and analgesic medication were excluded from the
leukocytopenia group; and those with diseases that influence C3 and
C5 levels (such as rheumatoid arthritis, idiopathic interstitial
pneumonia, chronic bronchitis and bronchial asthma) were excluded
from all groups. The 30 patients with leukocytopenia were further
divided into slight (<1.5×10⁹/l; n=9), moderate (2.5–1.5×10⁹/l;
n=15) and severe (1.5×10⁹/l; n=6) subgroups, according to the
degree of decrease in white blood cell count (13).
This study was conducted in accordance with the
Declaration of Helsinki. Approval was obtained from the Ethics
Committee of People's Hospital of Xinjiang Uygur Autonomous Region
(policy no. 2016056). Written informed consent was obtained from
each participant.
Data collection
General data, including sex, age and infection site,
were collected for each patient. Clinical data, laboratory
examination outcomes with regard to blood routine examination, C3
and C5 complement levels, procalcitonin (PCT) and interleukin
(IL)-6 were also collected. In total, ~4 ml of peripheral venous
blood was extracted from each participant after fasting and
combined with 0.109 mol/l sodium citrate anticoagulant agent. The
samples were immediately stored at −196°C after collection.
C3 and C5 detection
C3 and C5 serum levels were detected using ELISA.
Kits for human serum C3 and C5 detection were purchased from
Shanghai Fusheng Industrial Co., Ltd. (cat. no. YM-YM10444), the
procedures were performed in strict accordance with the
instructions of the manufacturer.
Locations of CpG sites with
differential methylation
Sites with differential methylation were classified
into transcription start sites (TSS)200, 5′untranslated region
(UTR), body, TSS1500, 3′ UTR and 1st exon categories according to
the physical locations of the detected sites, as well as the
related annotation information were provided by the University of
California Santa Cruz database (14).
Whole-genome methylation detection
DNA preparation and quality
examination
Genomic DNA was extracted from blood samples using a
Wizard® Genomic DNA Purification kit (Promega
Corporation), quantified by spectrophotometry and adjusted to the
standard concentration of 50 ng/µl (20 µl in total). The sample was
subjected to 0.8% agarose gel electrophoresis. Methylation
experiments were performed using samples with a distinct major
electrophoresis band with a length no shorter than 10 kb and no
noticeable degradation, with a total sample quantity of >5
µg.
Sulfite transformation
Sulfite transformation was performed using an EZ DNA
methylation kit (Zymo Research Corp.) according to the
manufacturer's protocols.
NaOH denaturation and whole-genome
amplification
NaOH (0.1%) was used to dissociate double-stranded
DNA into single-stranded DNA. Whole-genome amplification was
performed using a PCR amplification kit (cat. no. KG203; Beijing
Hongyue Biotech Co., Ltd.). The amplification conditions were as
follows: 94°C for 12 min; 10 cycles of 93°C for 50 sec, 62°C for 48
sec (−0.5°C/cycle) and 72°C for 1 min; 35 cycles of 94°C for 45
sec, 56°C for 48 sec and 72°C for 1 min; 72°C for 3 min; and hold
at 4°C. After amplification, 2% agarose gel electrophoresis was
performed for product verification.
DNA segmentation, precipitation and
resuspension
PCR products were fragmented using the random
endonuclease method. Isopropanol was applied for centrifugal
precipitation of the fragments at 4°C (2×10⁴ × g for 15 min). The
precipitated sample was placed at room temperature, dried and
dissolved in hybridization buffer.
DNA/chip hybridization
Prepared chips were used for DNA hybridization. The
capture probe with 50-mer-long beads (7 fmol/µl) was combined with
the digested genomic DNA (gDNA) products; annealing was carried out
in a hybridization oven for 8–10 h.
Chip washing and single-base extension
and staining
The wash rack was submerged in the wash dish
containing 200 ml PB1 (Shanghai Tichem Chemical Co., Ltd.). The Hyb
Chamber inserts were removed from the Hyb Chambers. BeadChips
(CapitalBio Corporation) were removed from the Hyb Chamber inserts
one at a time, and the cover seal was removed from each BeadChip.
Then, the BeadChip was slide into the wash rack, one at a time,
ensuring that the BeadChip was complete. These procedures were
repeated until all BeadChips (a maximum of 8) were transferred to
the wash rack submerged in PB1. Once all BeadChips were in the wash
rack, the wash rack was moved up and down for 1 min, the surface of
the PB1 was broken with gentle, slow agitation. The wash rack was
transferred to the other wash dish containing clean PB1 (ensuring
all BeadChips were complete) and the wash rack was moved up and
down for 1 min. The surface of the PB1 was broken with gentle, slow
agitation. The DNA sequence detected by the probe was used as the
template, and nucleotide substrates were labeled with dinitrophenol
and biotin using the random primer method (A/T and C/G,
respectively) (15) Unqualified
DNA was removed, followed by single base extension (the condition
for base extension was that gDNA hybridization did not occur).
Detectable fluorophores (Fluorescein-5-maleimide) were applied to
the chip, and A/T and C/G were used for labeling different
fluorescent dyes to distinguish different methylation states. The
chip was coated with XC4 reagent to prolong its lifetime and the
extension time of the signals. The chip was then placed in a vacuum
dehydration unit for 1 h.
Chip scanning and data reading
The fluorophores were excited with a laser to obtain
fluorescence. Corresponding ‘manifest’ files were downloaded
(https://support.illumina.com/downloads/infinium-methylationepic-v1-0-product-files.html)
to generate raw data. The data were then analyzed using
GenomeStudio software (version 1.1.0; Illumina, Inc.) to obtain the
methylation P-value of each gene and each site of the gene
(16,17).
Key site screening
To obtain the genes associated with leukocytopenia,
the scope of key gene site screening was narrowed by intersection
analysis (18). Based on P-values
and the functions of related genes according to GenBank (https://www.ncbi.nlm.nih.gov/; accessed on February
18, 2018), AKT2, NADPH oxidase 5 (NOX5), WW domain containing E3
ubiquitin protein ligase2 (WWP2) and calcium-binding atopy-related
autoantigen 1 (CBARA1) were ultimately selected for
verification.
Key gene verification
DNA preparation
DNA was extracted from blood samples using a Wizard
Genomic DNA Purification kit (Promega Corporation). Quantitation
using spectrophotometry and 1% agarose gel electrophoresis was
performed. In general, the length of gDNA obtained was no shorter
than 20 kb. DNA was adjusted to a concentration of 50 ng/µl and
transferred to a 384-well plate for storage at −20°C.
Primer design
Primers were designed by EpiDesigner (Sequenom;
http://www.epidesigner.com) to
correspond to the methylation sites of AKT2, NOX5, WWP2 and CBARA1.
The normal lengths of the amplified fragments ranged from 200–600
bp. To the 5′ terminal of the forward primer, 10-mer tag was
applied to balance PCR conditions, and a T7 promoter sequence was
applied to the 5′ terminal of the reverse primer for subsequent
transcription in vitro. Syntheses were performed by
CapitalBio Technology Co., Ltd. The upstream and downstream primers
of AKT2 were 5′-TTTATGTAAAGAGGAATAGTTGGGAAA-3′ and
5′-CCAAAAAAACAACAAAAATTCACTC-3′, respectively. After modification,
the upstream and downstream primers were
5′-aggaagagagTTTATGTAAAGAGGAATAGTTGGGAAA-3′ and
5′-cagtaatacgactcactatagggagaaggctCCAAAAAACAACAAAAATTCACTC-3′,
respectively. The upstream, downstream, modified upstream and
modified downstream primers of NOX5 were
5′-TGGGGTATTTATTTTTAAAGTGGGT-3′, 5′-AATCAATCCACTACACTCCAACCTA-3′,
5′-aggaagagagTGGGGTATTTATTTTTAAAGTGGGT-3′ and
5′-cagtaatacgactcactatagggagaaggctAATCAATCCACTACACTCCAACCTA-3′,
respectively. The upstream, downstream, modified upstream and
modified downstream primers of WWP2 were
5′-TGGGGTATTTATTTTTAAAGTGGGT-3′, 5′-AAAACCAAAAACAAATTAACCCAA-3′,
5′-aggaagagagTTTTGGATAGTAGGGTAGAAGGGTT-3′ and
5′-cagtaatacgactcactatagggagaaggctAAAACCAAAAACAAATTAACCCAA-3′,
respectively, and those of CBARA1 were
5′-GGTATGTGTGTTTTTTGGAGAGAGTT-3′, 5′-ATCAAACAAAATAAAACCAACAAAT-3′,
5′-aggaagagagGGTATGTGTGTTTTTTGGAGAGAGTT-3′ and
5′-cagtaatacgactcactatagggagaaggctATCAAACAAAATAAAACCAACAAAT-3′,
respectively.
PCR amplification
Amplification was performed using a PCR
amplification kit (Sequenom). The amplification conditions
consisted of 94°C for 12 min, 10 cycles at 93°C for 50 sec, 62°C
for 48 sec (−0.5°C/cycle) and 72°C for 1 min, 35 cycles at 94°C for
45 sec, 56°C for 48 sec and 72°C for 1 min, 72°C for 3 min and a
final hold at 4°C. Agarose (2%) electrophoresis was performed for
PCR product verification, with ethidium bromide as the fluorescence
dye. RT fluorescent quantitation was performed for PCR
products.
Shrimp alkaline phosphatase (SAP)
SAP treatment was performed in accordance with the
instructions of the MassCLEAVE™ reagent kit (Sequenom).
Chip sample application and mass
spectrometric detection
Purified products were applied to a 384-formatted
SpectroCHIP with the MassARRAYNanodispenser RS1000 arrayer
(Sequenom). The prepared chip was detected using a MassARRAY
compact system (Sequenom). Matrix-assisted laser
desorption/ionization-time of flight mass spectrometry was
performed in accordance with the protocols of the Infinium HD Assay
Methylation Protocol Guide 2011 (19), and data were analyzed using
EpiTYPER v1.05 (Sequenom).
Statistical analysis
Genomic methylation data
Raw data were processed by GenomeStudio software to
obtain the original signal value and detection P-value of each site
(15,16). Site quality control and individual
quality control were performed. Color bias adjustment and quantile
normalization were performed for the quality-controlled data using
Lumi 2.22.1 included in the R software 4.0.0 package (20,21).
For probe-type biases, the methylation levels (β values) obtained
after the preceding adjustment step were further adjusted with BMIQ
v1.3 (β-mixture quantile normalization). The adjusted b values were
subjected to differential methylation analysis using IMA 3.1.2 of
the R software package (22), and
the analysis method was based on the limma algorithm (23) of Empirical Bayes Statistics. For
multiple hypothesis testing, the P-value adjusted by the false
discovery rate (FDR) was calculated using the Benjamini-Hochberg
method (24). The selection
criterion for differential sites was an adjusted P-value (FDR
value) ≤0.05 (if the adjusted P-values of all sites were >0.05
or when the adjusted P-values of few sites were ≤0.05, a P-value
before adjustment of ≤0.05 was used as the criterion). Cluster
analysis was performed for the samples using gplots 2.13.0 of the R
package (https://CRAN.R-project.org/package=gplots). Gene
Ontology (GO) enrichment (25,26),
Kyoto Encyclopedia of Genes and Genomes (KEGG) pathway enrichment
(27) and disease enrichment
[Online Mendelian Inheritance in Man (OMIM), KEGG Disease, FunDo,
GAD, National Human Genome Research Institute (NHGRI)] analyses
were performed for the genes mapped based on differential
sites.
Other data
Experimental data were processed using SPSS 22.0
software (IBM Corp.). For categorical data, χ2 test was used for
group comparisons. For data regarding methylation levels and serum
testing, one-way ANOVA was used for comparison among groups. When
measurement data were abnormally distributed or exhibited
heterogeneity of variance [PCT, C-reactive protein (CRP), acute
physiology and chronic health evaluation II (APACHE II) score, C3],
the nonparametric Kruskal-Wallis one-way ANOVA was applied for
comparison of methylation levels among groups. The significance
level was adjusted using the Bonferroni method, and an adjusted
P<0.05 was considered significant (all stated P-values are
adjusted). GraphPad Prism 6 (GraphPad Software, Inc.) was used for
plotting.
Results
General data
Clinical data
Clinical data for patients with post-infection
leukocytopenia or post-infection leukocytosis, and for normal
controls were analyzed (Table I).
The confirmation of infection was based on etiological outcomes or
an increase in PCT levels. The three groups did not show
significant differences in age (F=1.026, P=0.349) or sex ratio
(χ2=5.217, P=0.084). Similarly, the leukocytopenia and leukocytosis
groups did not show significant differences in infection sites
(χ2=4.692, P=0.074) or infectious pathogen type (χ2=7.631,
P=0.062).
 | Table I.General data for the three
groups. |
Table I.
General data for the three
groups.
|
Characteristics | Leukocytopenia
(n=30) | Leukocytosis
(n=30) | Normal control
(n=30) | P-value |
|---|
| Age (years) | 52.34±12.74 | 53.62±13.08 | 55.76±11.84 | 0.349a |
| Sex |
|
|
| 0.084a |
|
Male | 16 | 19 | 15 |
|
|
Female | 14 | 11 | 15 |
|
| Infection site |
|
|
| 0.074b |
|
Pulmonary | 13 | 11 | 0 |
|
|
Hematogenous | 3 | 7 | 0 |
|
|
Intra-abdominal | 4 | 3 | 0 |
|
| Pathogen |
|
|
| 0.026b |
|
Gram-positive cocci | 11 | 15 | 0 |
|
|
Gram-negative cocci | 9 | 4 | 0 |
|
| Other
bacteria | 0 | 0 | 0 |
|
|
Virus | 0 | 0 | 0 |
|
| No etiological
base | 10 | 11 | 30 |
|
| Died within 72 h
after admission | 3 | 1 | 0 |
|
Diagnostic values of inflammation
indices for post-infection leukocytopenia and leukocytosis
The leukocytopenia group had significantly higher
levels of PCT and IL-6 than the leukocytosis group (P=0.015 and
P=0.034, respectively); however, no significant difference in CRP
levels was observed between these two groups (P>0.05; Table II).
| Table II.Comparisons of inflammation indices
between post-infection leukocytopenia and post-infection
leukocytosis. |
Table II.
Comparisons of inflammation indices
between post-infection leukocytopenia and post-infection
leukocytosis.
| Index | Leukocytopenia | Leukocytosis | P-value |
|---|
| PCT, ng/ml | 4.6 (0.4, 8.2) | 7.2 (0.6,
30.3) | 0.015 |
| CRP, mg/ml | 86.2 (40.6,
130.4) | 67.6 (30.1,
116.7) | 0.961 |
| IL-6, pg/ml | 6.25±1.26 | 9.43±3.08 | 0.034 |
Association of inflammation indices
with the total white blood cell count in leukocytopenia
The 30 patients with leukocytopenia were further
divided according to the degree of decrease. The highest serum PCT
level was observed in the severe group, followed by the moderate
group and the slight group (P<0.05). No significant differences
in IL-6 and CRP were observed among the three groups. The highest
APCACHE II score was observed in the severe group, followed by the
moderate group and the slight group (P<0.05). The results are
summarized in Table III.
| Table III.Analysis of associations between
inflammation indices and total white blood cell counts in
leukocytopenia. |
Table III.
Analysis of associations between
inflammation indices and total white blood cell counts in
leukocytopenia.
| Index | Slight (n=9) | Moderate
(n=15) | Severe (n=6) | P-value |
|---|
| PCT, ng/ml | 2.9 (0.92,
7.9) | 3.8 (1.28,
8.3) | 4.3 (1.7, 9.6) | 0.023 |
| CRP, mg/ml | 60.2 (33.6,
103.2) | 68.4 (36.7,
116.3) | 73.2 (40.6,
128.9) | 0.231 |
| IL-6, pg/ml | 6.3±0.8 | 7.9±1.9 | 8.6±2.3 | 0.118 |
| APACHE II
score | 18.9 (14.9,
19.3) | 19.7 (15.3,
21.3) | 20.2 (16.7,
25.6) | 0.031 |
Changes in serum C3 and C5
C3 and C5 levels in the leukocytopenia, leukocytosis
and normal control groups were detected by ELISA. The
leukocytopenia group showed significantly lower levels of C3 and C5
than the leukocytosis and the normal control groups (all P<0.05;
Table IV).
| Table IV.Comparisons of C3 and C5 levels. |
Table IV.
Comparisons of C3 and C5 levels.
| Index | Leukocytopenia | Leukocytosis | Normal control | P-value |
|---|
| C3, g/l | 0.26 (0.08,
1.45) | 1.48 (0.76,
1.65) | 0.9 (0.88,
1.39) | 0.026 |
| C5, g/l | 0.7±0.38 | 1.4±0.46 | 3.1±1.5 | 0.031 |
Methylation levels
CpG sites and genes with differential
methylation
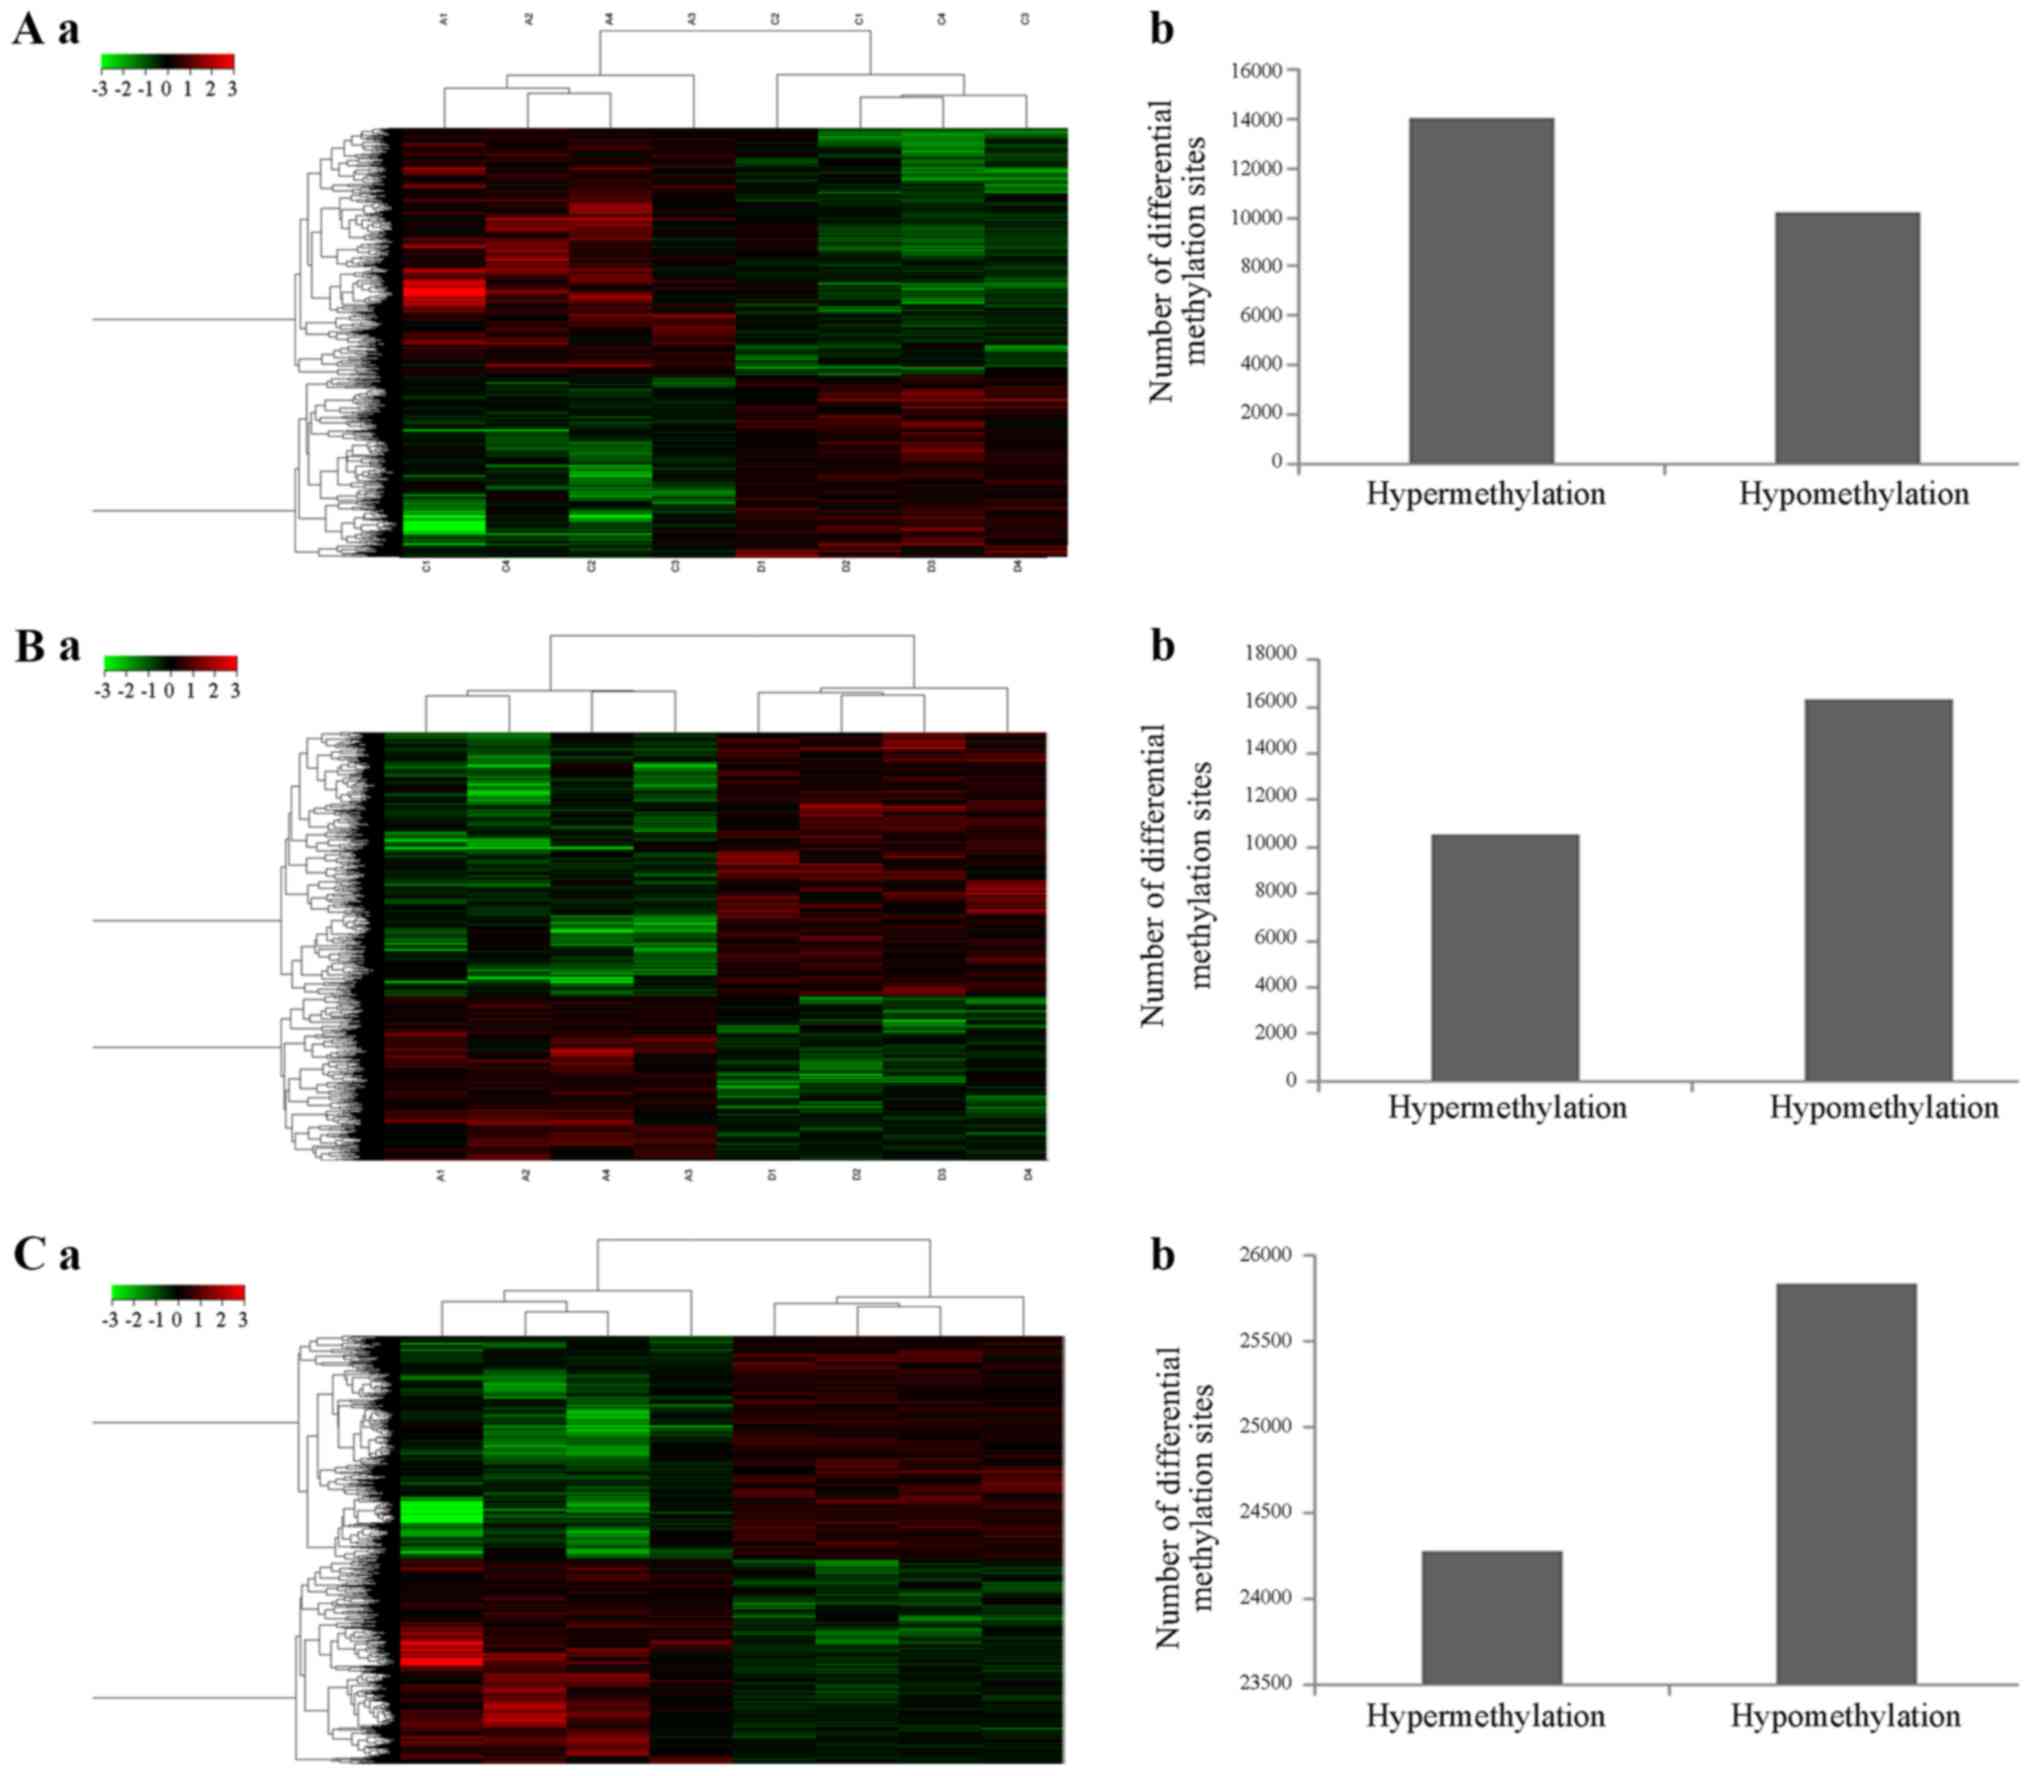
Methylation levels were detected at 473,270 sites
across the leukocytopenia, leukocytosis and normal control groups.
Pairwise comparisons of methylation rates were performed among the
three groups, and the results are shown in Fig. 1. The comparison between the
eukocytopenia group and the leukocytosis group demonstrated
significantly more hyper- methylation sites compared with
hypo-methylation sites, and the comparison between the leukocytosis
group and the normal control group found less hyper- methylation
sites compared with hypo-methylation sites. However, there were no
significant difference between the number of hyper- methylation
sites and that of hypo-methylation sites when the leukocytopenia
group was compared with the normal control group.
Locations of CpG sites with
differential methylation
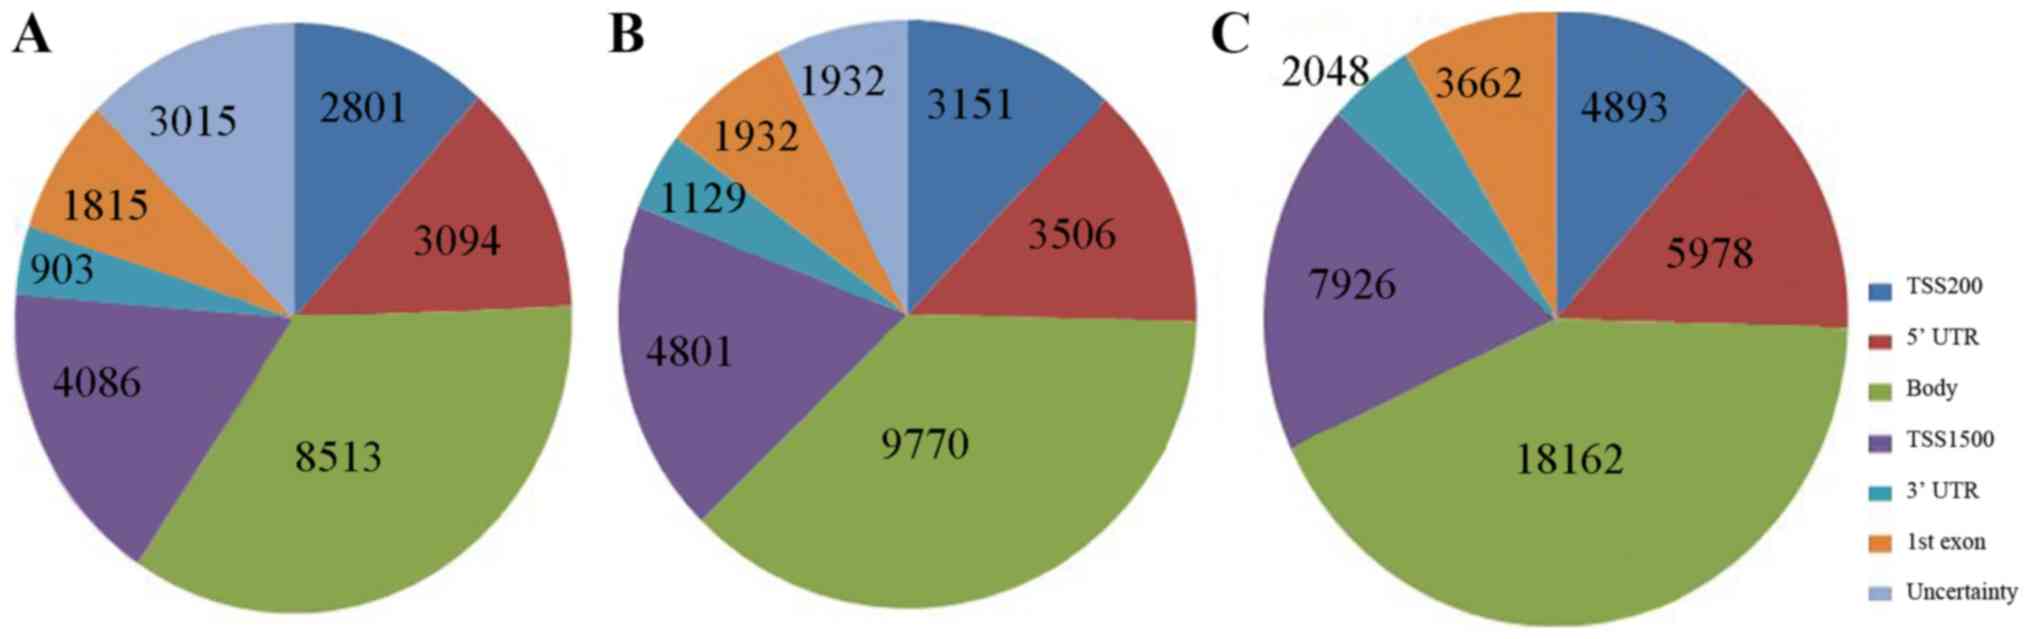
Methylation of the TSS, 5′ UTR and 1st exon inhibits
gene expression, whereas that of the body and 3′ UTR promotes
expression. The results are shown in Fig. 2. A total of 24,230 differential
methylation sites were detected between the leukocytopenia group
and the leukocytosis group: 11,796 sites were related to the genes
whose methylation inhibits gene expression and 9,416 were related
to the genes whose methylation promotes gene expression, with the
rest undetected in genes. There were 26,892 differential
methylation sites detected in total between the leukocytosis group
and the normal control group: 13,390 sites were related to the
genes whose methylation inhibits gene expression and 10,899 were
related to the genes whose methylation promotes gene expression,
with the rest undetected in genes. Moreover, comparison between the
leukocytopenia group and the normal control group identified 50,117
differential methylation sites: 22,459 sites were related to the
genes whose methylation inhibits gene expression and 20,210 were
related to the genes whose methylation promotes gene expression,
with the rest undetected in genes.
Chromosome distribution of sites with
differential methylation
The chromosome distribution of sites with
differential CpG methylation was also analyzed. Sites with
differential methylation between the leukocytopenia and
leukocytosis groups were primarily located on chromosomes 1, 2, 6,
and 7. In addition, sites with differential methylation between the
leukocytosis and normal control groups were primarily located on
chromosomes 2, 6, 7 and 17, and those between the leukocytopenia
and normal control groups were primarily located on chromosomes 1,
2, 6 and 11 (Table V).
| Table V.Chromosome distribution of sites with
differential methylation. |
Table V.
Chromosome distribution of sites with
differential methylation.
| Chromosome no. | Leukocytopenia vs.
leukocytosis (n, %) | Leukocytosis vs.
control (n, %) | Leukocytopenia vs.
control (n, %) |
|---|
| 1 | 1,561 (6.44) | 1,809 (6.73) | 1,809 (6.73) |
| 2 | 2,564 (10.58) | 2,791 (10.38) | 3,848 (7.68) |
| 3 | 1,390 (5.73) | 1,365 (5.08) | 2,690 (5.37) |
| 4 | 1,205 (5.10) | 1,165 (4.33) | 2,370 (4.73) |
| 5 | 1,296 (5.35) | 1,355 (5.04) | 2,732 (5.45) |
| 6 | 1,990 (8.21) | 2,235 (8.31) | 3,810 (7.60) |
| 7 | 1,558 (6.43) | 1,643 (6.11) | 3,163 (6.31) |
| 8 | 1,080 (4.46) | 1,179 (4.38) | 2,389 (4.77) |
| 9 | 0 (0.00) | 581 (2.16) | 1,046 (2.09) |
| 10 | 1,259 (5.20) | 1,438 (5.34) | 2,650 (5.29) |
| 11 | 1,424 (5.88) | 1,538 (5.72) | 3,167 (6.32) |
| 12 | 1,228 (5.11) | 1,423 (5.29) | 2,491 (4.97) |
| 13 | 0 (0.00) | 690 (2.57) | 1,245 (2.48) |
| 14 | 754 (3.11) | 781 (2.90) | 1,580 (3.15) |
| 15 | 819 (3.40) | 888 (3.30) | 1,667 (3.33) |
| 16 | 1,025 (4.23) | 1,273 (4.73) | 2,142 (4.27) |
| 17 | 1,261 (5.20) | 1,672 (6.22) | 2,695 (5.38) |
| 18 | 329 (1.41) | 299 (1.11) | 0 (0.00) |
| 19 | 1,211 (5.10) | 1,432 (5.33) | 2,291 (4.57) |
| 20 | 515 (2.13) | 611 (2.27) | 1,070 (2.14) |
| 21 | 234 (0.01) | 223 (0.01) | 440 (0.88) |
| 22 | 370 (0.02) | 501 (1.86) | 798 (1.59) |
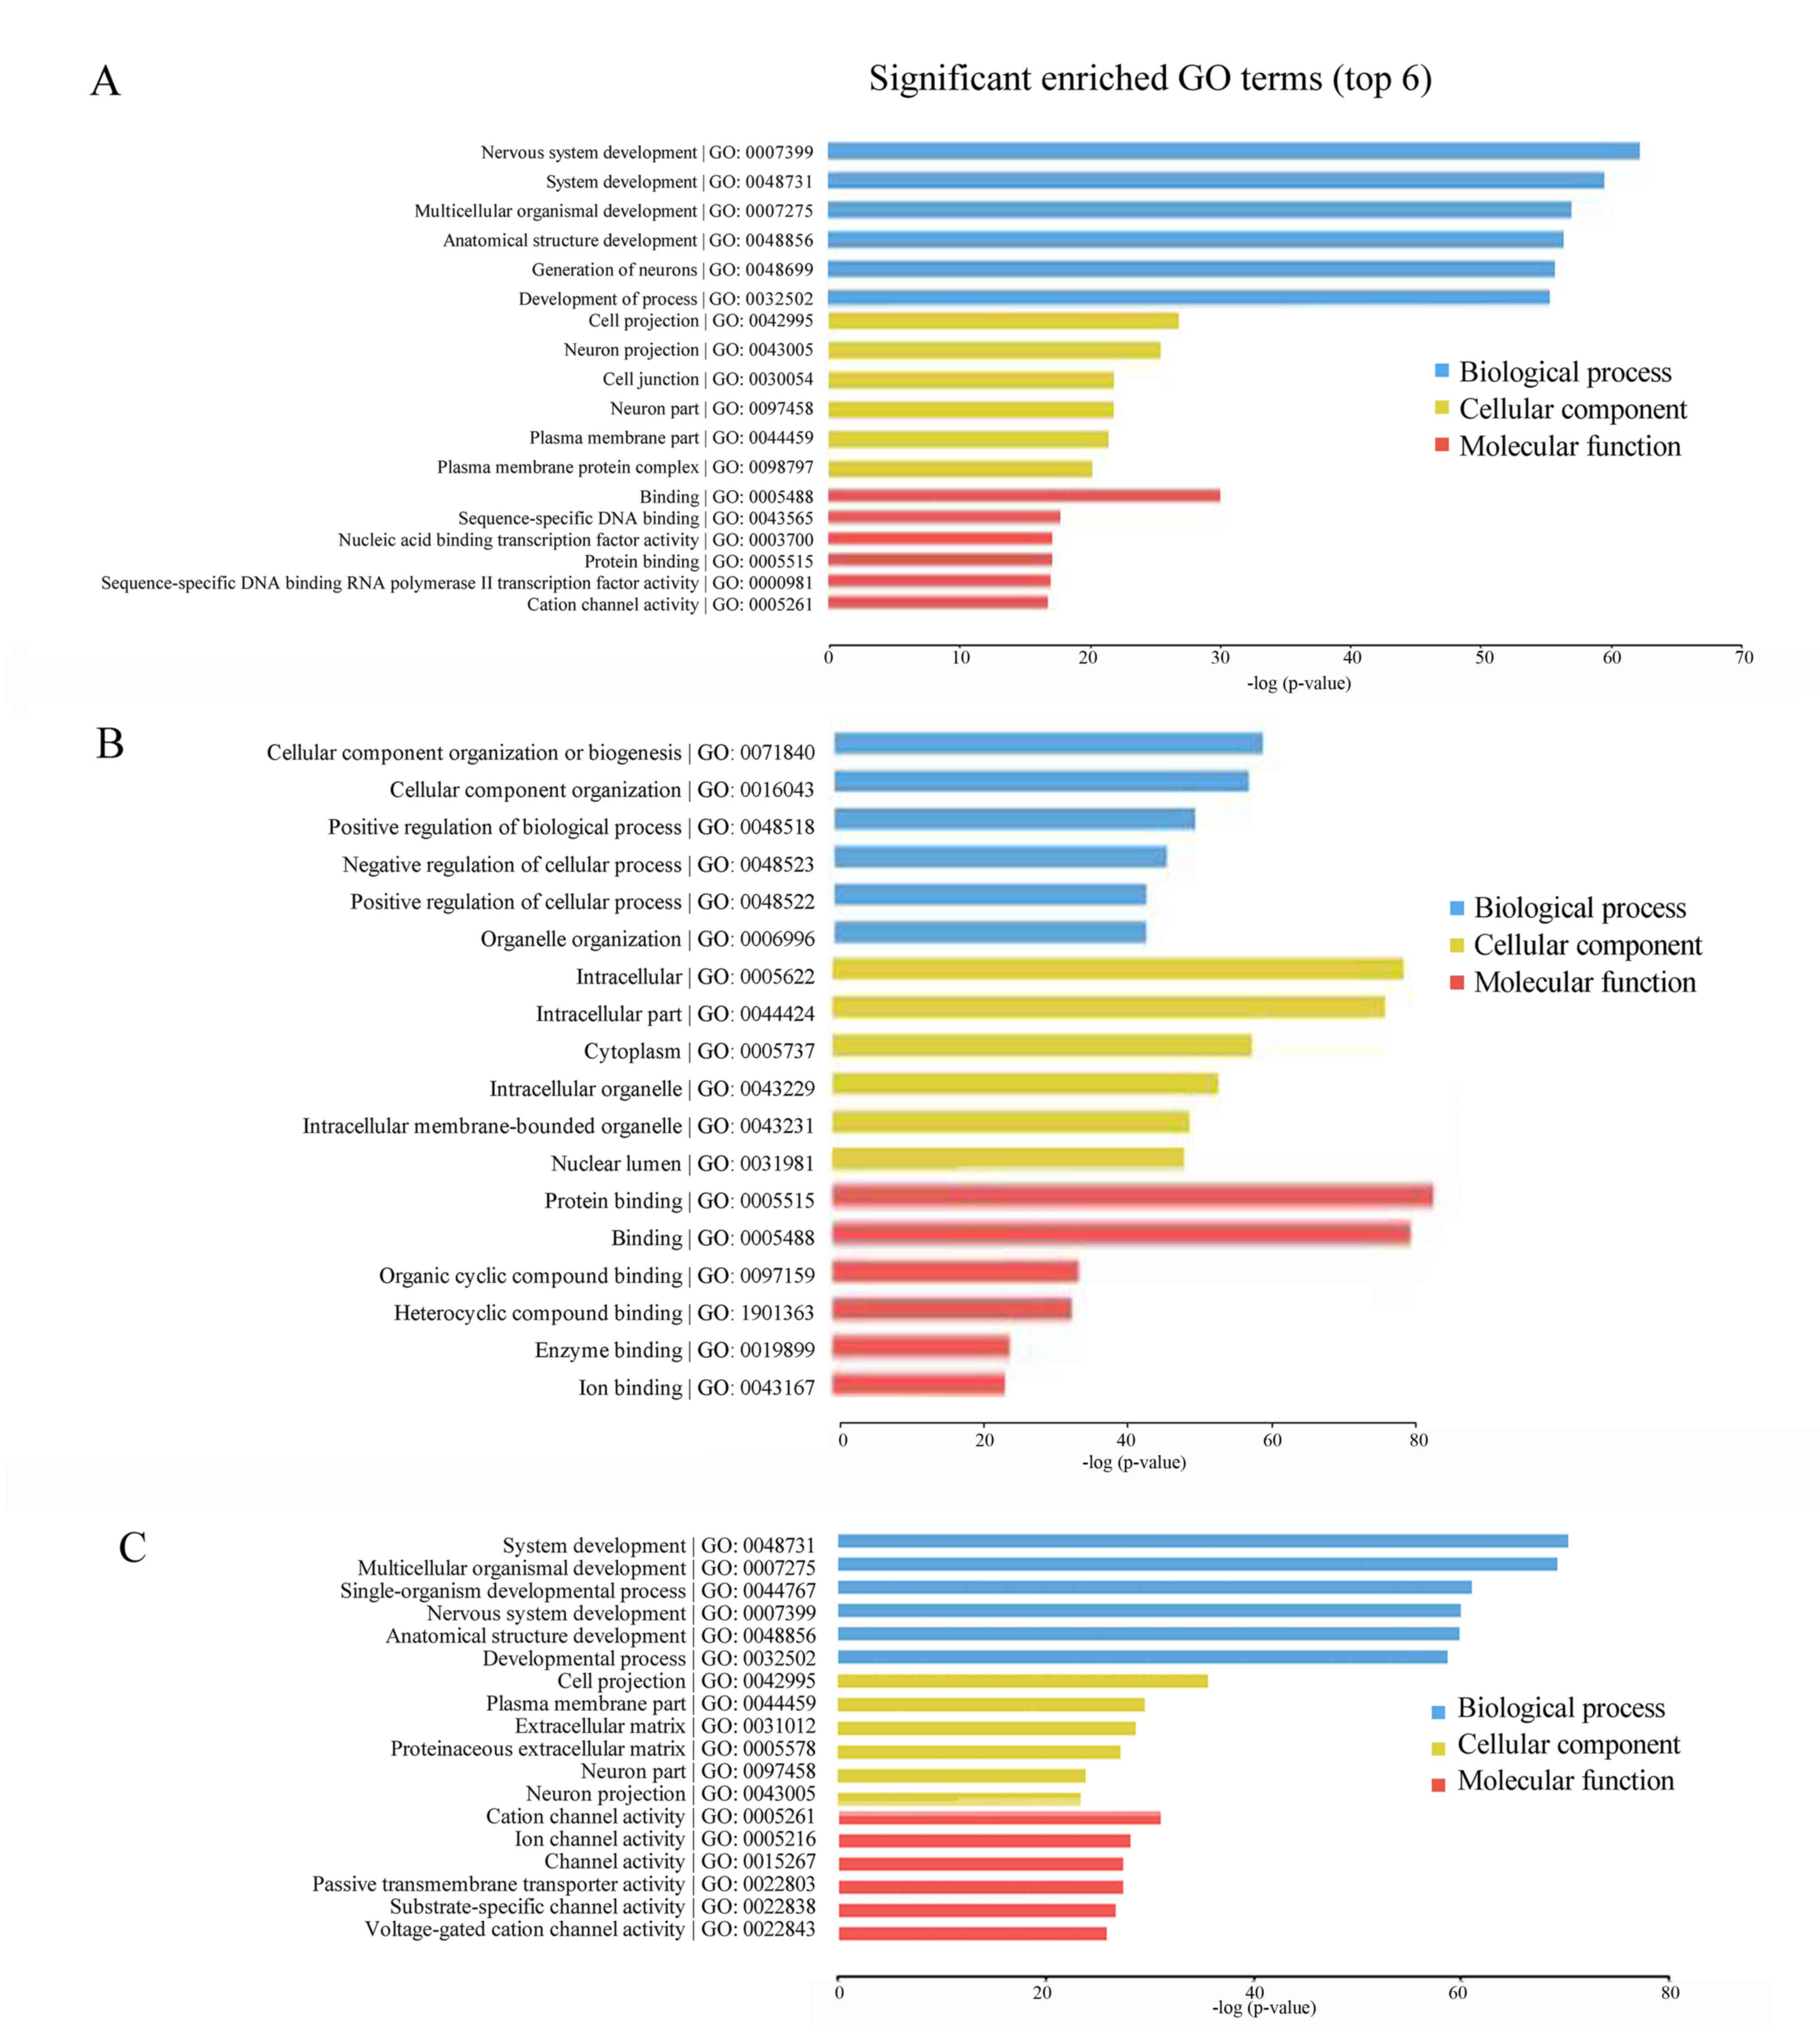
GO enrichment analysis
GO enrichment categories include biochemical
processes, molecular function and cellular composition. The
comparison between the leukocytopenia group and the leukocytosis
group demonstrated that the three biochemical processes with the
P-values with the greatest significance are nervous system
development, system development and multicellular organismal
development; the three molecular functions with the most strongly
significant P-values are binding, sequence-specific DNA binding and
sequence-specific DNA binding transcription factor activity; and
the three cellular compositions with the P-values with the greatest
significance are cell projections, neuron projections and cell
junctions (Fig. 3A). Comparing the
leukocytosis and normal control groups, the three biochemical
processes with the P-values with the greatest significance are
cellular component organization or biogenesis, cellular component
organization and positive regulation of biological process; the
three molecular functions with the P-values with the greatest
significance are protein binding, binding and organic cyclic
compound binding; and the three cellular compositions with the
P-values with the greatest significance are intracellular,
intracellular part and cytoplasm (Fig.
3B). The comparison between the leukocytopenia group and the
normal control group showed that the three biochemical processes
with the P-values with the greatest significance are system
development, multicellular organismal development and
single-organism developmental process; the three molecular
functions with the P-values with the greatest significance are
cation channel activity, ion channel activity and passive
transmembrane transporter activity; and the three cellular
compositions with the P-values with the greatest significance are
cell projections, plasma membrane part and extracellular matrix
(Fig. 3C).
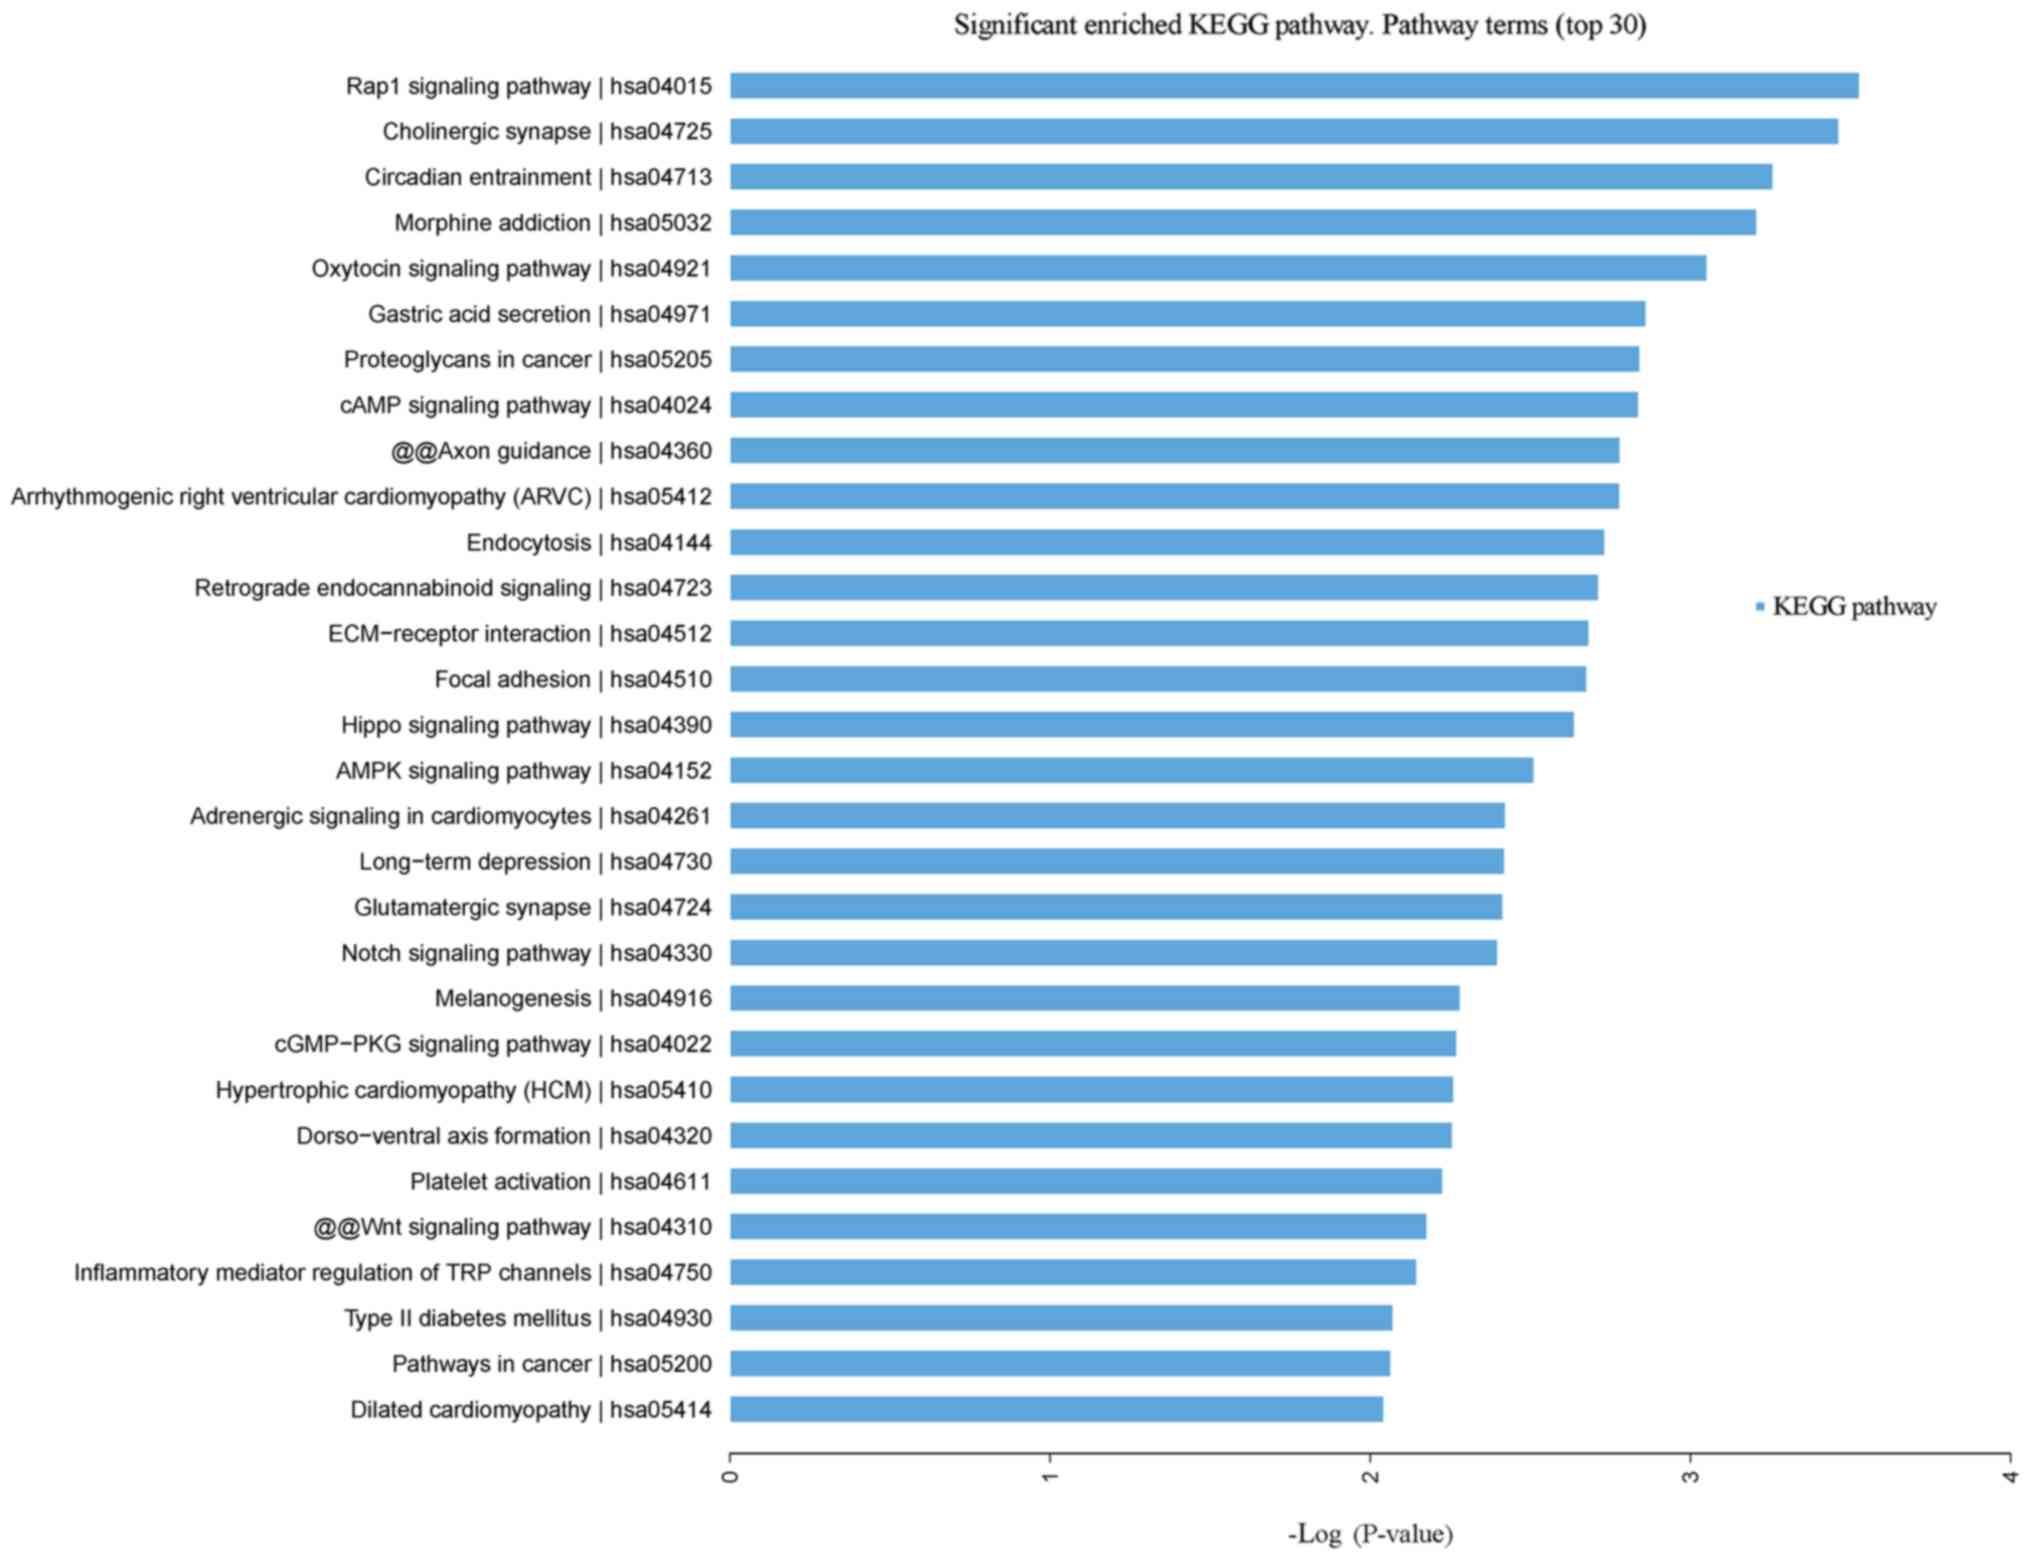
Pathway analysis
Leukocytopenia vs. leukocytosis
Signaling pathways with the most significant
P-values are associated with Rap1 signaling pathway, cholinergic
synapse, circadian entrainment and morphine addiction (Fig. 4). Further disease enrichment with
the R software identified that diseases with the most significant
P-values were cancer, depression, behavior disease and intestinal
disease (Fig. S1)
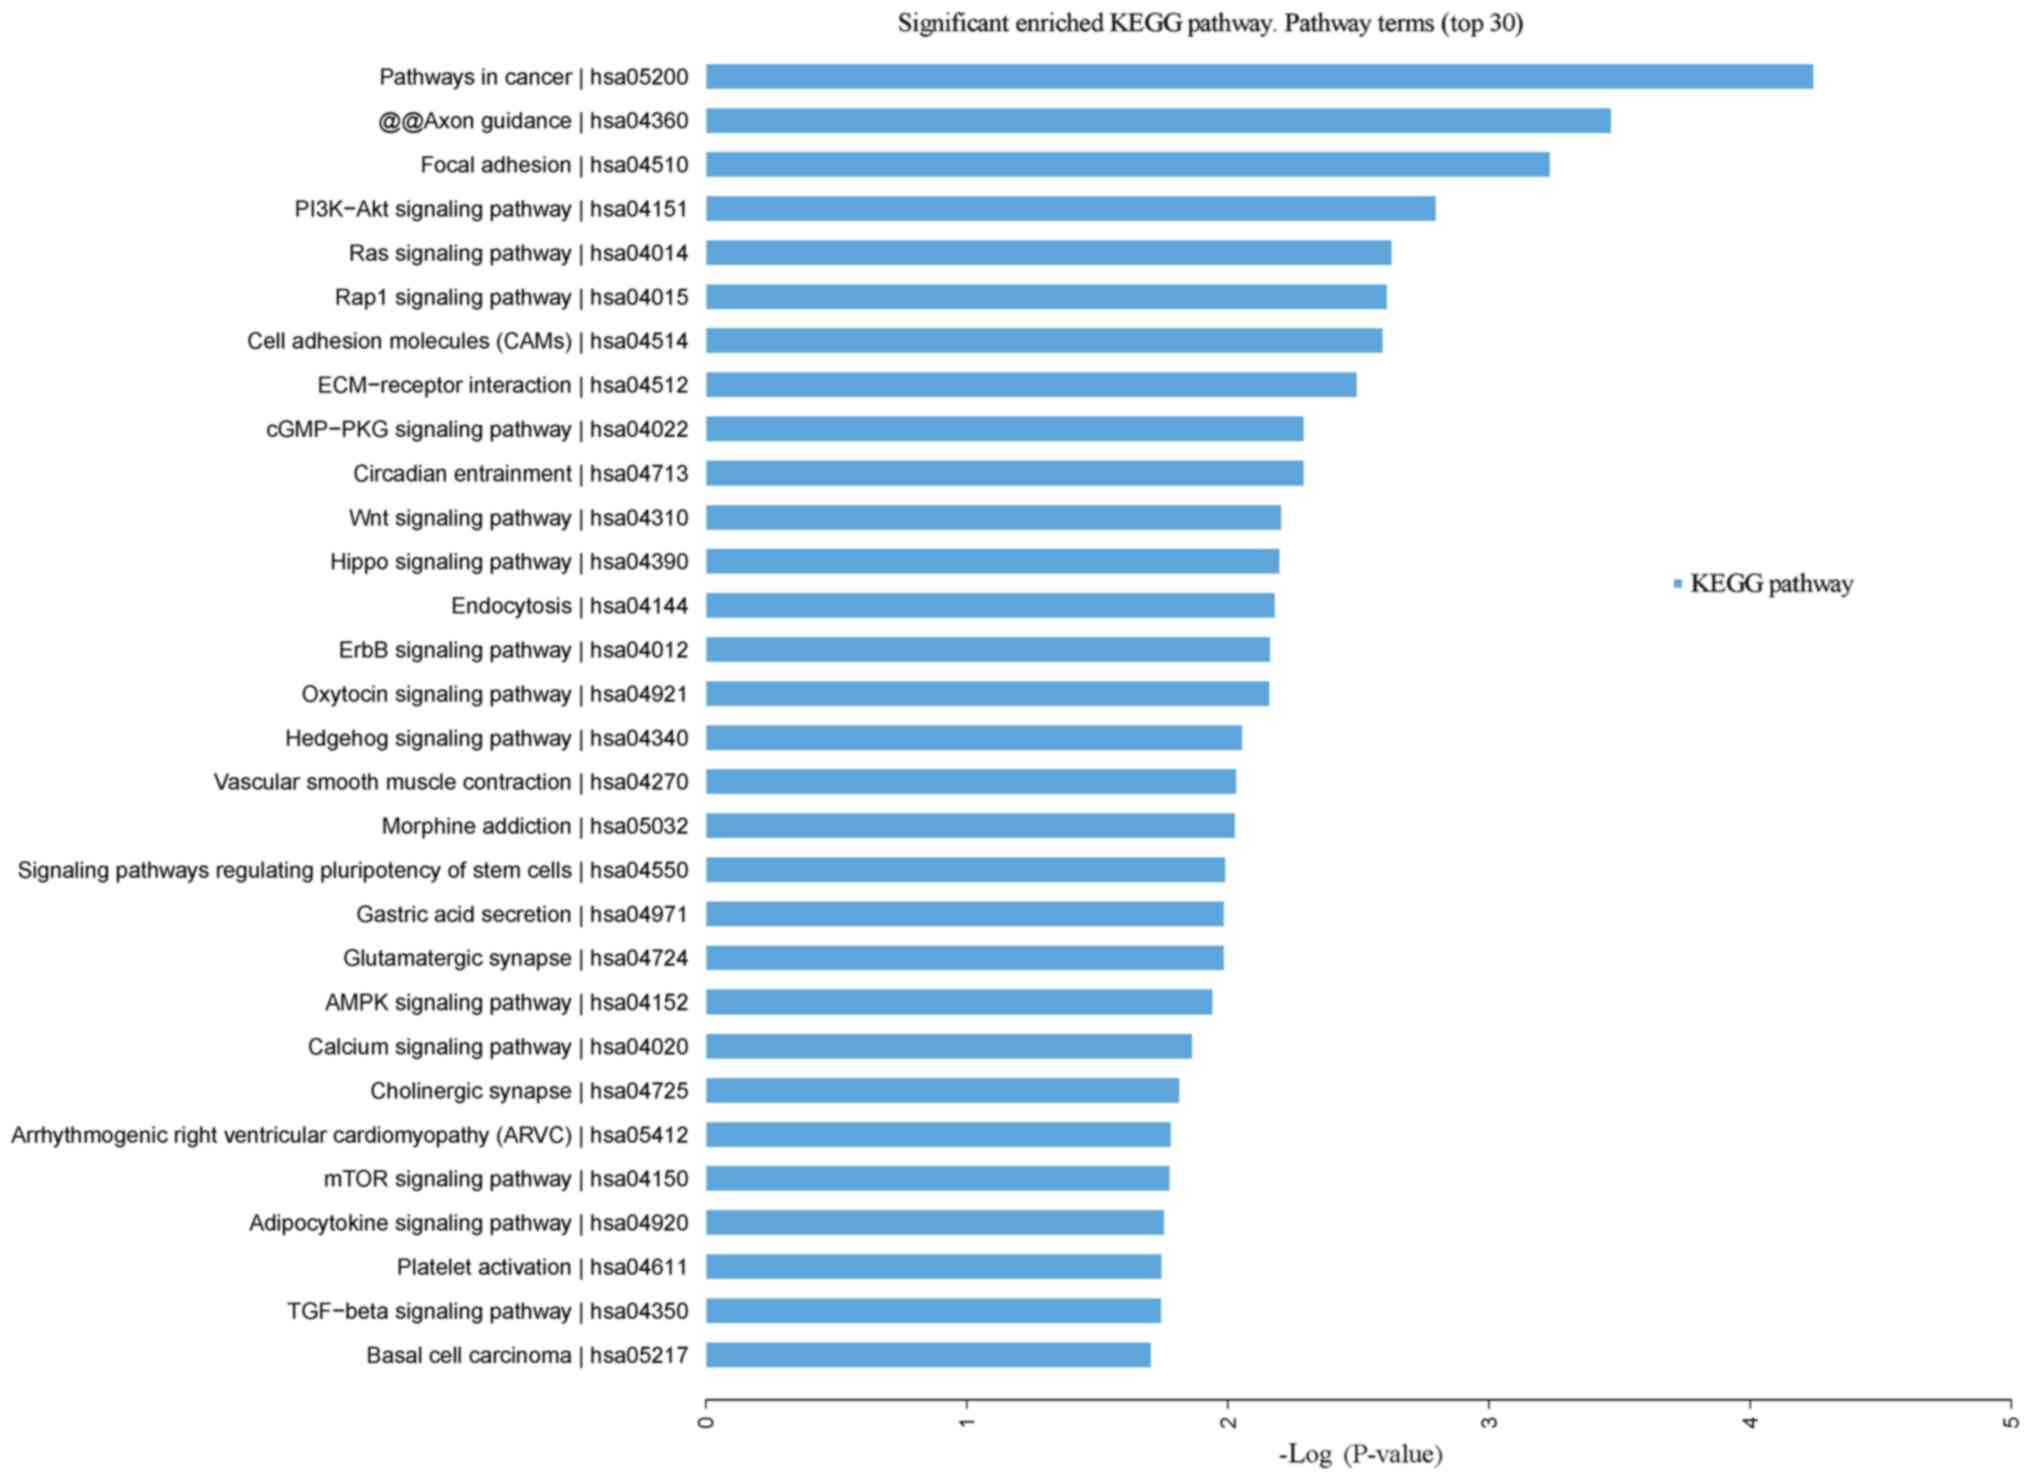
Leukocytopenia vs. normal control
Signaling KEGG pathways with the most significant
P-values were pathways in cancer, Axon guidance, focal adhesion and
PISK-Akt signaling pathway (Fig.
5). P-values with the greatest significance included cancer,
Down syndrome, diabetes mellitus, cholelithiasis, urinary
depression, brain disease and drug abuse (Fig. S2).
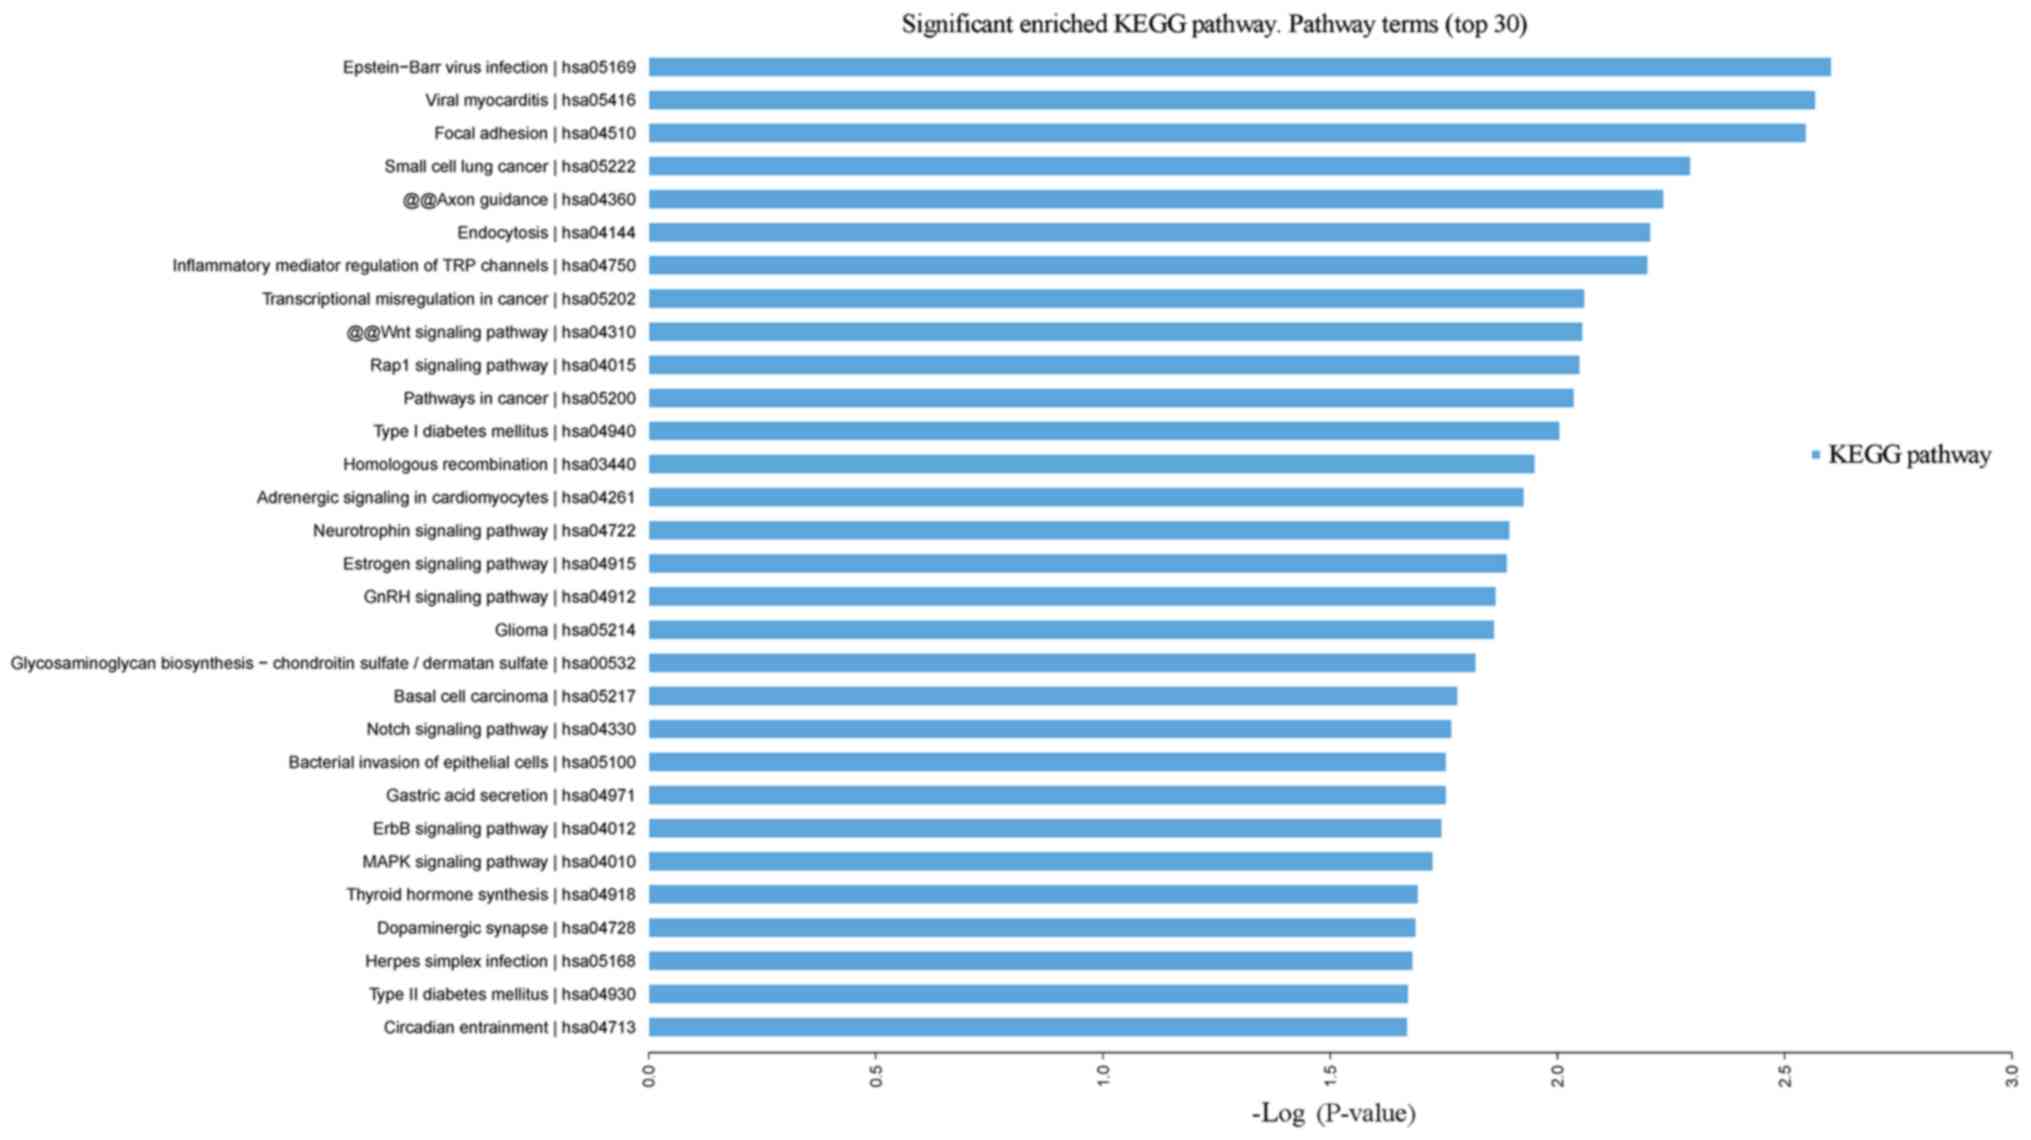
Leukocytosis vs. normal control
Signaling KEGG pathways with the most significant
P-values were associated with Epstein-Barr virus infection, viral
myocarditis, focal adhesion, and small cell lung cancer (Fig. 6). Diseases with P-values with the
greatest significance included cancer, adenovirus infection, brain
tumor, leukoencephalopathy, neurodegenerative disorder and deafness
(Fig. S3).
Key site screening
The analysis of the leukocytopenia group vs. the
leukocytosis group and the leukocytopenia group vs. the normal
control group showed a total of 66 differential sites, which
corresponded to 37 genes; both the leukocytopenia group vs. the
leukocytosis group and the leukocytopenia group vs. the normal
control group had 28 sites with hypermethylation and 38 sites with
hypomethylation (Table SI). The
analysis for the leukocytopenia group vs. the leukocytosis group,
and the leukocytosis group vs. normal control group showed 27
significantly different sites, which corresponded to 18 genes. A
total of 13 hypermethylated fragments were observed in the
leukocytopenia group compared with the leukocytosis group, and 14
were observed in the leukocytosis group compared with the normal
control group. A total of 14 hypomethylation fragments were
observed in the leukocytopenia group compared with the leukocytosis
group, and 13 were observed in the leukocytosis group compared with
the normal control group (Table
SII).
Based on P-values and the functions of related genes
according to GenBank (https://www.ncbi.nlm.nih.gov/; accessed on February
18, 2018), four genes were ultimately selected for verification
(Table VI). WWP2 is an E3
ubiquitin protein ligase containing a WW domain that participates
in the ubiquitination process and viral entry into host cells
(28). AKT2 has shown nucleotide
binding, protein serine, threonine kinase, protein binding,
ATP-binding and transferase activities, and participates in protein
amino acid phosphorylation and diabetes development (29). NOX5 has calcium ion binding,
hydrogen ionic channel, oxidation reduction enzyme,
hemocrystallin-binding and NADP-binding activities, and
participates in cytokinesis, electron transfer, apoptosis,
hyperoxide release and cytokine release. CBARA1 has been
demonstrated to have calcium ion-binding activity and participate
in defense responses (30).
| Table VI.Key genes. |
Table VI.
Key genes.
| Gene | ILMNID | ADDRESSA_ID |
ALLELEA_PROBESEQ |
|---|
| WWP2 | cg01735503 | 73749496 |
AAACCAAAAACAAATTAACCCAACACCAAACRAAAAAACATACCCACACC |
| AKT2 | cg07815521 | 43769440 |
ATAAACATAATATATAACCRAACTAATAACTAAAAAACACAAACAACTTC |
| NOX5 | cg26664528 | 67715503 |
TACCCTCATTTAATCCATATATCAAATAAACACRTATTATATTAATTCTC |
| CBARA1 | cg06348245 | 35789301 |
ACAACTTAAAAAATATATTCAACAACAATCCAACRAAAAACACATATAAC |
Key gene verification
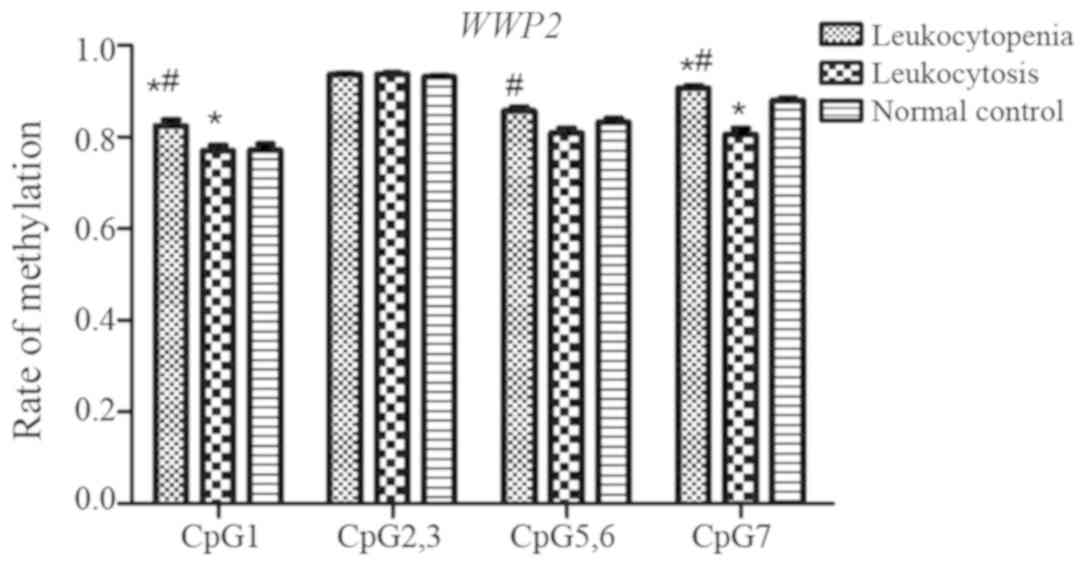
WWP2 gene
A total of five CpG sites in WWP2 fragments (CpG_1,
CpG_2/3, CpG_4, CpG_5/6 and CpG_7) were investigated, and four
(CpG_1, CpG_2/3, CpG_5/6 and CpG_7) were detected (Fig. 7). Although no significant
differences in methylation rates at CpG_2/3 were observed among the
three groups (P=0.350), significant differences were observed at
CpG_1, CpG_5/6 and CpG_7 (P=0.010, P=0.002 and P<0.001,
respectively). The methylation rate at CpG_1 in the leukocytopenia
group was significantly higher than that in the leukocytosis and
normal control group (P=0.020 and P=0.035, respectively), although
no significant difference was observed between the leukocytosis and
normal control groups. The methylation rate at CpG_5/6 in the
leukocytopenia group was significantly higher than that in the
leukocytosis (P=0.001), but no significant difference was observed
between the leukocytosis group and the normal control group. In the
leukocytopenia group, the methylation rate at CpG_7 was
significantly higher than that in the leukocytosis group and the
normal control group (P<0.001 and P=0.017, respectively), and
the rate in the leukocytosis group was significantly lower than
that in the normal control group (P=0.013).
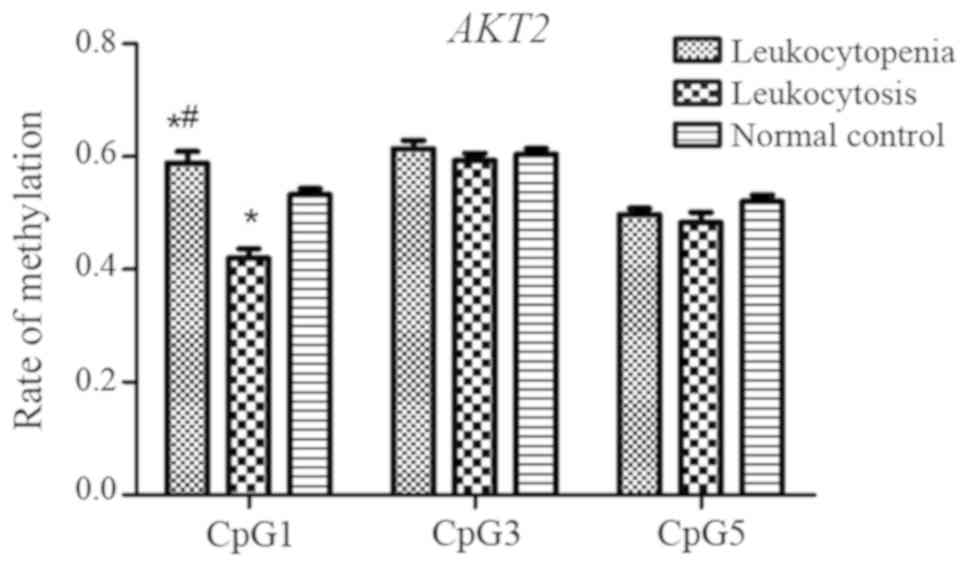
AKT2 gene
A total of five CpG sites among AKT2 fragments
(CpG_1, CpG_2, CpG_3, CpG_4 and CpG_5) were investigated, and three
(CpG_1, CpG_3 and CpG_5) were detected. No significant differences
in methylation levels at the CpG_3 and CpG_5 sites were observed
among the three groups (P=0.581 and P=0.215, respectively);
however, the levels of CpG_1 methylation in the leukocytopenia
group were significantly higher than those in the leukocytosis and
normal control groups (P<0.001 and P=0.045, respectively;
Fig. 8), and the leukocytosis
group had a significantly lower methylation level at this site than
the normal control group (P=0.001).
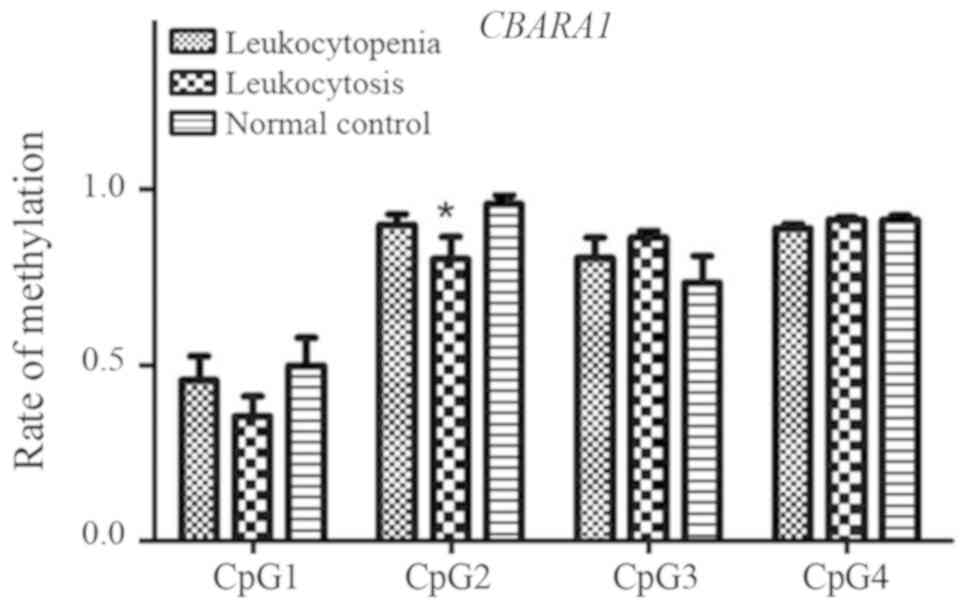
CBARA1 gene
A total of four CpG sites among CBARA1 fragments
(CpG_1, CpG_2, CpG_3 and CpG_4) were investigated and detected. No
significant differences in methylation at the CpG_1, CpG_3 and
CpG_4 sites were found among the three groups (all P>0.05),
whereas a significant difference was observed for CpG_2 (P=0.011;
Fig. 9). The CpG_2 methylation
level in the leukocytosis group was significantly lower than that
in the normal control group (P=0.002).
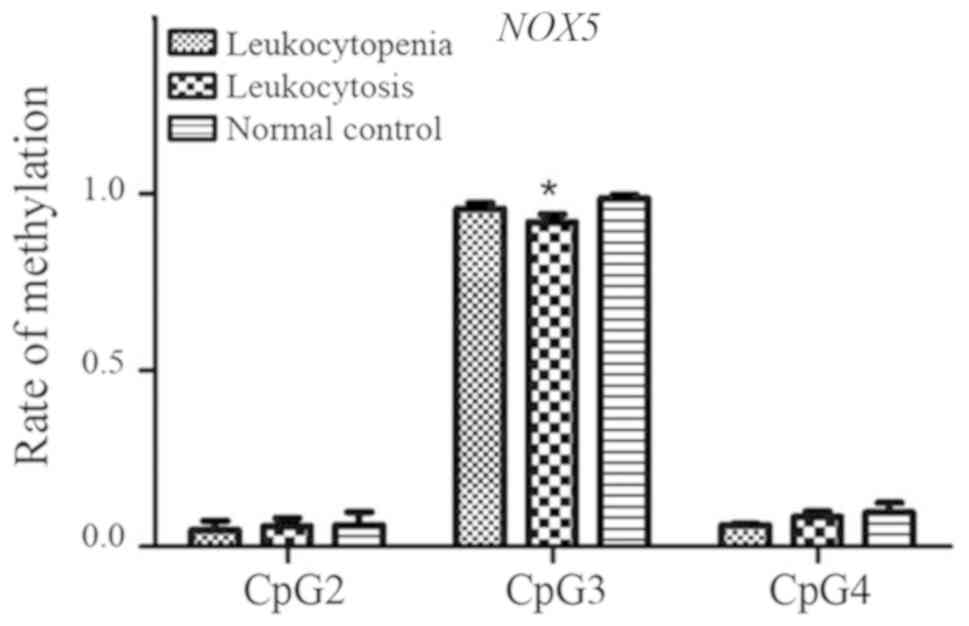
NOX5 gene
For NOX5 fragments (CpG_1, CpG_2, CpG_3 and CpG_4),
four CpG sites were investigated and three (CpG_2, CpG_3 and CpG_4)
were detected. No significant differences in methylation levels at
the CpG_2 and CpG_4 sites were observed among the three groups
(both P>0.05), whereas a significant difference was observed for
CpG_3 (P=0.005; Fig. 10). The
methylation level at the CpG_3 in the leukocytosis group was
significantly lower than that in the normal control group
(P=0.004).
Discussion
Death due to infection is currently the cause of
~25% of all deaths caused by diseases worldwide (1). In recent years, the incidence rate of
infection has remained high for various reasons, including disease
complications, the use of glucocorticoids, immunocompromise,
bacterial resistance and invasive operations (1). Regardless of leukocytopenia or
leukocytosis, infections are primarily caused by pathogens,
commonly viruses and bacteria, which initiate infection by
activating innate immunity. Non-specific innate immunity (30), also known as natural immunity,
plays an important role in acute infection, and neutrophils,
lymphocytes, eosinophils and basophils are important immunocytes
involved in this process (31).
These cells reach the site of infection via adhering, binding,
cellular escape and cellular migration (32), and release reactive oxygen species
and antimicrobial lytic proteins, such as peroxidase, lysozyme,
alkaline phosphatase and acid hydrolase (33). These cells engulf, kill and digest
microorganisms, thereby playing a direct role in the immune system
(34). In clinical settings,
post-infection leukocytopenia occurs frequently; the symptoms of
patients with post-infection leukocytopenia are generally severe
and difficult to treat, and require an extensive anti-infection
treatment course (35).
Furthermore, abnormalities such as cell migration disorders,
myelosis, reduced chemotactic factor secretion and immunocyte
surface receptor abnormalities may exist in these patients
(36). In the present study, the
general clinical data of patients with leukocytopenia, including
age, sex, infection site, routine blood tests, and levels of IL-6
and serum complement, were analyzed and whole-genome methylation
analysis was performed. Key sites of methylation were then screened
with the aim of exploring post-infection leukocytopenia-associated
molecular mechanisms in order to provide a novel avenue for gene
diagnosis and treatment of such diseases.
The general data showed higher levels of PCT and
IL-6 in the leukocytosis group compared with the leukocytopenia
group. Furthermore, patients in the leukocytopenia group had a
higher APACHE II score than those in the leukocytosis group,
indicating a worse prognosis. Analysis of serum complement C3 and
C5 levels revealed significant decreases in the leukocytopenia
group compared with the leukocytosis and normal control groups.
This finding suggested that post-infection leukocytopenia may be
complicated by abnormally low expression of chemotactic factors,
and that abnormal expression of chemotactic factors may partly
contribute to the pathogenesis of infection-associated
leukocytopenia. Genome methylation detection was then performed to
further determine the mechanisms via which chemotactic factors are
abnormally expressed, as well as to find other mechanisms
underlying post-infection leukocytopenia.
DNA methylation is classically studied in epigenetic
research and is the most representative feature of epigenetics.
Moreover, changes in methylation may underlie the pathogenesis of a
variety of diseases (37). In the
present study, whole-genome methylation detection was performed,
revealing significant enrichment in various pathways and
disease-causing functions. The significantly enriched pathways and
functions closely associated with the development of post-infection
leukocytopenia included receptor activity, transmembrane signal
transduction and potassium ion channels. These results indicated
that multiple pathways are responsible for the development of this
disease via network interactions. Diseases with significant
enrichment included cancer, neurodegenerative disorders, intestinal
diseases, cardiovascular diseases, endocrine diseases and urinary
diseases, although most of these were not associated with the
disease investigated in the present study. This may be partially
due to the fact that genome methylation detection is primarily
applied in research into tumors, as well as cardiovascular and
nervous system diseases (38,39),
whereas its application in investigating infectious disease has not
been reported to date. In addition, this finding may also be due to
limitations such as small sample size and experimental error.
Therefore, experiments with a larger sample size should be
performed in the future to obtain more accurate functional
enrichment analysis data.
Intersection analysis of differentially methylated
gene sites between the leukocytopenia and leukocytosis groups, and
the leukocytopenia and normal control groups may suggest the cause
of leukocytopenia, and that between the leukocytopenia and
leukocytosis groups, and the leukocytosis and normal control groups
may indicate the cause of leukocytosis. Based on reports from the
literature and P-values obtained, NOX5, WWP2, AKT2 and CBARA1 were
selected for further verification. NOX5 is expressed in the spleen
and lymph node cells (40), and
its functions primarily include calcium ion binding, hydrogen ion
channels, superoxide production, NADPH oxidase, oxidoreductase,
flavin adenine dinucleotide binding and NADP binding (41). NOX5 protein primarily participates
in cytokinesis, electron transfer, apoptosis, cellular
proliferation, proton transportation regulation, superoxide
release, cytokine secretion and cell fusion regulation (42). According to a previous study
(43), monocytes can differentiate
into various subsets of dendritic cells, and NOX5-p22phox complexes
may promote the differentiation of monocytes into dendritic cells
via Janus kinase/signal transducers, and activators of
transcription/MAPK and NF-κB pathways. NOX5 may be able to reduce
oxidative stress and may be associated with calcium ion
channel-related oxidative stress in lymph nodes (44). WWP2 also exhibits protein binding
and ligase activities (28); it is
involved in the ubiquitination process, circulation and viral entry
into host cells (28). WWP2 has a
negative regulatory effect on Toll-like receptor 3-mediated innate
immunity (45). CBARA1 has calcium
ion-binding activity and participates in the immune response
(26). AKT2 shows
nucleotide-binding, protein serine, threonine kinase,
protein-binding, ATP-binding and transferase activities, and
participates in protein amino acid phosphorylation as well as the
development of diabetes (46,47).
Moreover, it has been shown that AKT2 is associated with dendritic
cell migration and the functions of neutrophils, as well as
vascular permeability, edema and leukocytic emigration in acute
inflammation (48). AKT2 knockout
can ameliorate pulmonary injury by reducing alveolar cell
depolarization (49), and AKT2 may
also participate in the development of pulmonary fibrosis via
transforming growth factor-β1 and IL-13 (50).
The present study has a number of limitations.
First, the sample used for genome methylation detection was small,
which may have resulted in false positive results. Therefore, these
findings need to be further verified by experiments with larger
sample sizes. Second, as most studies into methylation and genomes
have focused on tumor research, signaling pathway analysis and
disease enrichment analysis in this study, based on the current
datasets, did not identify the direct association of the methylated
genes with leukocytopenia. Therefore, studies involving animal
experiments and gene knockout need to be performed in the
future.
In conclusion, four genes may participate in the
occurrence of leukocytopenia after infection: NOX5, WWP2, AKT2 and
CBARA1. Based on the results of this study, multiple experiments
with larger sample sizes should be carried out and more genes
should be selected for verification. These experiments may be
useful for clarifying the molecular mechanisms underlying
leukocytopenia following infection, and identifying novel
strategies for diagnosis and treatment.
Supplementary Material
Supporting Data
Supporting Data
Supporting Data
Acknowledgements
Not applicable.
Funding
The present study was financially supported by the
Youth Fund of the Natural Science Foundation of Xinjiang Uygur
Autonomous Region (grant no. 2015211C214).
Availability of data and materials
The datasets used and/or analyzed during the present
study are available from the corresponding author on reasonable
request.
Authors' contributions
All authors have made contributions to the current
work. CW and XY designed the study. CW led the writing of the
article. XM, WW, MD, and RJ conducted the experiments and collected
the data. ZL, DL and YL conducted data analysis. XY supervised the
process and offered constructive advice. All authors read and
approved the final manuscript.
Ethics approval and consent to
participate
This study was conducted in accordance with the
Declaration of Helsinki. Approval was obtained from the Ethics
Committee of People's Hospital of Xinjiang Uygur Autonomous Region
(policy no. 2016056). Written informed consent was obtained from
each participant.
Patient consent for publication
Not applicable.
Competing interests
The authors declare that they have no competing
interests.
References
|
1
|
Xu R: Global dynamics of an
epidemiological model with age of infection and disease relapse. J
Biol Dyn. 12:118–145. 2018. View Article : Google Scholar : PubMed/NCBI
|
|
2
|
Panupattanapong S, Stwalley DL, White AJ,
Olsen MA, French AR and Hartman ME: Epidemiology and outcomes of
granulomatosis with polyangiitis in pediatric and working-age adult
populations In the United States: Analysis of a large national
claims database. Arthritis Rheumatol. 70:2067–2076. 2018.
View Article : Google Scholar : PubMed/NCBI
|
|
3
|
Tendl KA, Schulz SMF, Mechtler TP, Bohn A,
Metz T, Greber-Platzer S, Kasper DC, Herkner KR and Item CB: DNA
methylation pattern of CALCA in preterm neonates with bacterial
sepsis as a putative epigenetic biomarker. Epigenetics.
8:1261–1267. 2013. View Article : Google Scholar : PubMed/NCBI
|
|
4
|
Dhas DB, Ashmi AH, Bhat BV, Kalaivani S
and Parija SC: Comparison of genomic DNA methylation pattern among
septic and non-septic newborns - An epigenome wide association
study. Genom Data. 3:36–40. 2014. View Article : Google Scholar : PubMed/NCBI
|
|
5
|
Saif I, Kasmi Y, Allali K and Ennaji MM:
Prediction of DNA methylation in the promoter of gene suppressor
tumor. Gene. 651:166–173. 2018. View Article : Google Scholar : PubMed/NCBI
|
|
6
|
Bomsztyk K, Denisenko O and Wang Y: DNA
methylation yields epigenetic clues into the diabetic nephropathy
of Pima Indians. Kidney Int. 93:1272–1275. 2018. View Article : Google Scholar : PubMed/NCBI
|
|
7
|
Samadian A, Hesaraki M, Mollamohammadi S,
Asgari B, Totonchi M and Baharvand H: Temporal gene expression and
DNA methylation during embryonic stem cell derivation. Cell J.
20:361–368. 2018.PubMed/NCBI
|
|
8
|
Beck S, Rhee C and Song J: Temporal Gene
Expression and DNA Methylation during Embryonic Stem Cell
Derivation. Nucleic Acids Res. 46:4382–4391. 2018. View Article : Google Scholar : PubMed/NCBI
|
|
9
|
Zare M, Bastami M, Solali S and Alivand
MR: Aberrant miRNA promoter methylation and EMT-involving miRNAs in
breast cancer metastasis: Diagnosis and therapeutic implications. J
Cell Physiol. 233:3729–3744. 2018. View Article : Google Scholar : PubMed/NCBI
|
|
10
|
Dixit AB, Sharma D, Tripathi M, Srivastava
A, Paul D, Prakash D, Sarkar C, Kumar K, Banerjee J and Chandra PS:
Genome-wide DNA methylation and RNAseq analyses identify aberrant
signalling pathways in focal cortical dysplasia (FCD) type II. Sci
Rep. 12:179762018. View Article : Google Scholar
|
|
11
|
Mohammadi NM, Shamsasenjan K and
Akbarzadehlaleh P: The angiogenic chemokines expression profile of
myeloid cell lines co-cultured with bone marrow-derived mesenchymal
stem cells. Cell J. 20:19–24. 2018.PubMed/NCBI
|
|
12
|
Zou LS, Erdos MR, Taylor DL, Chines PS,
Varshney A, Parker SCJ, Collins FS and Didion JP; McDonnell Genome
Institute, : BoostMe accurately predicts DNA methylation values in
whole-genome bisulfite sequencing of multiple human tissues. BMC
Genomics. 19:390–403. 2018. View Article : Google Scholar : PubMed/NCBI
|
|
13
|
Farajifard H, Zavvar M, Rajaei T,
Noorbakhsh F, Nikougoftar-Zarif M, Azadmanesh K, Kompani F and
Rezaei N: In vitro study of HAX1 gene therapy by retro viral
transduction as a therapeutic target in severe congenital
neutropenia. Eur Cytokine Netw. 29:146–152. 2018. View Article : Google Scholar : PubMed/NCBI
|
|
14
|
Tyner C, Barber GP, Casper J, Clawson H,
Diekhans M, Eisenhart C, Fischer CM, Gibson D, Gonzalez JN,
Guruvadoo L, et al: The UCSC Genome Browser database: 2017 update.
Nucleic Acids Res. 45((D1)): D626–D634. 2017.PubMed/NCBI
|
|
15
|
Chrzastek K, Lee DH, Smith D, Sharma P,
Suarez DL, Pantin-Jackwood M and Kapczynski DR: Use of
sequence-independent, single-primer-amplification (SISPA) for rapid
detection, identification, and characterization of avian RNA
viruses. Virology. 509:159–166. 2017. View Article : Google Scholar : PubMed/NCBI
|
|
16
|
Reese SE, Zhao S, Wu MC, Joubert BR, Parr
CL, Håberg SE, Ueland PM, Nilsen RM, Midttun Ø, Vollset SE, et al:
DNA methylation score as a biomarker in newborns for sustained
maternal smoking during pregnancy. Environ Health Perspect.
125:760–766. 2017. View
Article : Google Scholar : PubMed/NCBI
|
|
17
|
Shen J, Wang S, Zhang YJ, Wu HC, Kibriya
MG, Jasmine F, Ahsan H, Wu DP, Siegel AB, Remotti H, et al:
Exploring genome-wide DNA methylation profiles altered in
hepatocellular carcinoma using infinium humanmethylation 450
beadchips. Epigenetics. 8:34–43. 2013. View Article : Google Scholar : PubMed/NCBI
|
|
18
|
Deng X, Yang Y, Sun H, Qi W, Duan Y and
Qian Y: Analysis of whole genome-wide methylation and gene
expression profiles in visceral omental adipose tissue of
pregnancies with gestational diabetes mellitus. J Chin Med Assoc.
81:623–630. 2018. View Article : Google Scholar : PubMed/NCBI
|
|
19
|
Kunze S: Quantitative region-specific DNA
methylation analysis by the EpiTYPERTM Technology. Methods Mol
Biol. 515–535. 2018. View Article : Google Scholar : PubMed/NCBI
|
|
20
|
R Core Team, . R: A language and
environment for statistical computing. R Foundation for Statistical
Computing, Vienna, Austria. 2014. http://www.R-project.org/
|
|
21
|
Du P, Kibbe WA and Lin SM: lumi: A
pipeline for processing Illumina microarray. Bioinformatics.
24:1547–1548. 2008. View Article : Google Scholar : PubMed/NCBI
|
|
22
|
Wang D, Yan L, Hu Q, Sucheston LE, Higgins
MJ, Ambrosone CB, Johnson CS, Smiraglia DJ and Liu S: IMA: An R
package for high-throughput analysis of Illumina's 450K Infinium
methylation data. Bioinformatics. 28:729–730. 2012. View Article : Google Scholar : PubMed/NCBI
|
|
23
|
Ritchie ME, Phipson B, Wu D, Hu Y, Law CW,
Shi W and Smyth GK: limma powers differential expression analyses
for RNA-sequencing and microarray studies. Nucleic Acids Res.
43:e472015. View Article : Google Scholar : PubMed/NCBI
|
|
24
|
Benjamini Y and Hochberg Y: Controlling
the false discovery rate: A practical and powerful approach to
multiple testing. J R Stat Soc B. 51:289–300. 1995.
|
|
25
|
Ashburner M, Ball CA, Blake JA, Botstein
D, Butler H, Cherry JM, Davis AP, Dolinski K, Dwight SS, Eppig JT,
et al: The Gene Ontology Consortium: Gene ontology: Tool for the
unification of biology. Nat Genet. 25:25–29. 2000. View Article : Google Scholar : PubMed/NCBI
|
|
26
|
The Gene Ontology Consortium, . The Gene
Ontology Resource: 20 years and still GOing strong. Nucleic Acids
Res. 47((D1)): D330–D338. 2019.PubMed/NCBI
|
|
27
|
Kanehisa M, Sato Y, Furumichi M, Morishima
K and Tanabe M: New approach for understanding genome variations in
KEGG. Nucleic Acids Res. 47((D1)): D590–D595. 2019. View Article : Google Scholar : PubMed/NCBI
|
|
28
|
Chen K, Hsu LT, Wu CY, Chang SY, Huang HT
and Chen W: CBARA1 plays a role in stemness and proliferation of
human embryonic stem cells. PLoS One. 8:e636532013. View Article : Google Scholar : PubMed/NCBI
|
|
29
|
Zou G, Liu T, Guo L, Huang Y, Feng Y and
Duan T: MicroRNA-32 silences WWP2 expression to maintain the
pluripotency of human amniotic epithelial stem cells and β
islet-like cell differentiation. Int J Mol Med. 41:1983–1991.
2018.PubMed/NCBI
|
|
30
|
Gerdol M, Luo YJ, Satoh N and Pallavicini
A: Genetic and molecular basis of the immune system in the
brachiopod Lingula anatina. Dev Comp Immunol. 82:7–30. 2018.
View Article : Google Scholar : PubMed/NCBI
|
|
31
|
Iqbal J, El-Gamal MI, Ejaz SA, Lecka J,
Sévigny J and Oh CH: Tricyclic coumarin sulphonate derivatives with
alkaline phosphatase inhibitory effects: In vitro and docking
studies. J Enzyme Inhib Med Chem. 33:479–484. 2018. View Article : Google Scholar : PubMed/NCBI
|
|
32
|
Mohammadi H, Sharafkandi N, Hemmatzadeh M,
Azizi G, Karimi M, Jadidi-Niaragh F, Baradaran B and Babaloo Z: The
role of innate lymphoid cells in health and disease. J Cell
Physiol. 233:4512–4529. 2018. View Article : Google Scholar : PubMed/NCBI
|
|
33
|
Sheikh AA, Hooda OK and Dang AK: JAK3 and
PI3K mediate bovine Interferon-tau stimulated gene expression in
the blood neutrophils. J Cell Physiol. 233:4885–4894. 2018.
View Article : Google Scholar : PubMed/NCBI
|
|
34
|
Nowak K, Ratajczak-Wrona W, Garley M and
Jabłońska E: The effect of ethanol and N-nitrosodimethylamine on
the iNOS-dependent NO production in human neutrophils. Role of
NF-κB. Xenobiotica. 48:498–505. 2018. View Article : Google Scholar : PubMed/NCBI
|
|
35
|
Komatsu H, Hayashi K and Higashiyama F:
Treatment with granulocyte colony-stimulating factor in the
refeeding phase of anorexia nervosa complicated with severe
neutropenia and sepsis: A case report. Eat Weight Disord.
23:897–902. 2018. View Article : Google Scholar : PubMed/NCBI
|
|
36
|
Kumari P and Kumar H: Viral
deubiquitinases: Role in evasion of anti-viral innate immunity.
Crit Rev Microbiol. 44:304–317. 2018. View Article : Google Scholar : PubMed/NCBI
|
|
37
|
Sun W, Guo F and Liu M: Up-regulated WDR5
promotes gastric cancer formation by induced cyclin D1 expression.
J Cell Biochem. 119:3304–3316. 2018. View Article : Google Scholar : PubMed/NCBI
|
|
38
|
Lu TP, Chuang NC, Cheng CY, Hsu CA, Wang
YC, Lin YH, Lee JK, Wu CK, Hwang JJ, Lin LY, et al: Genome-wide
methylation profiles in coronary artery ectasia. Clin Sci (Lond).
131:583–594. 2017. View Article : Google Scholar : PubMed/NCBI
|
|
39
|
Yamada Y, Horibe H, Oguri M, Sakuma J,
Takeuchi I, Yasukochi Y, Kato K and Sawabe M: Identification of
novel hyper- or hypomethylated CpG sites and genes associated with
atherosclerotic plaque using an epigenome-wide association study.
Int J Mol Med. 41:2724–2732. 2018.PubMed/NCBI
|
|
40
|
Ghanbari H, Keshtgar S and Kazeroni M:
Inhibition of the CatSper channel and NOX5 enzyme activity affects
the functions of the progesterone-stimulated human sperm. Iran J
Med Sci. 43:18–25. 2018.PubMed/NCBI
|
|
41
|
Mahbouli S, Der Vartanian A, Ortega S,
Rougé S, Vasson MP and Rossary A: Leptin induces ROS via NOX5 in
healthy and neoplastic mammary epithelial cells. Oncol Rep.
38:3254–3264. 2017. View Article : Google Scholar : PubMed/NCBI
|
|
42
|
Jha JC, Watson AMD, Mathew G, de Vos LC
and Jandeleit-Dahm K: The emerging role of NADPH oxidase NOX5 in
vascular disease. Clin Sci (Lond). 131:981–990. 2017. View Article : Google Scholar : PubMed/NCBI
|
|
43
|
Dho SH, Kim JY, Lee KP, Kwon ES, Lim JC,
Kim CJ, Jeong D and Kwon KS: STAT5A-mediated NOX5-L expression
promotes the proliferation and metastasis of breast cancer cells.
Exp Cell Res. 351:51–58. 2017. View Article : Google Scholar : PubMed/NCBI
|
|
44
|
Oliva-Olivera W, Moreno-Indias I,
Coín-Aragüez L, Lhamyani S, Alcaide Torres J, Fernández-Veledo S,
Vendrell J, Camargo A, El Bekay R and Tinahones FJ: Different
response to hypoxia of adipose-derived multipotent cells from obese
subjects with and without metabolic syndrome. PLoS One.
12:e01883242017. View Article : Google Scholar : PubMed/NCBI
|
|
45
|
Liu J, Wan L, Liu J, Yuan Z, Zhang J, Guo
J, Malumbres M, Liu J, Zou W and Wei W: Cdh1 inhibits WWP2-mediated
ubiquitination of PTEN to suppress tumorigenesis in an
APC-independent manner. Cell Discov. 2:15044–15053. 2016.
View Article : Google Scholar : PubMed/NCBI
|
|
46
|
Smet-Nocca C, Page A, Cantrelle FX,
Nikolakaki E, Landrieu I and Giannakouros T: The O-β-linked
N-acetylglucosaminylation of the Lamin B receptor and its impact on
DNA binding and phosphorylation. Biochim Biophys Acta, Gen Subj.
1862:825–835. 2018. View Article : Google Scholar
|
|
47
|
Gu J, Yan X, Dai X, Wang Y, Lin Q, Xiao J,
Zhou S, Zhang J, Wang K, Zeng J, et al: Metallothionein preserves
Akt2 activity and cardiac function via inhibiting TRB3 in diabetic
hearts. Diabetes. 67:507–517. 2018. View Article : Google Scholar : PubMed/NCBI
|
|
48
|
Sudhahar V, Okur MN, Bagi Z, O'Bryan JP,
Hay N, Makino A, Patel VS, Phillips SA, Stepp D, Ushio-Fukai M, et
al: Akt2 (protein kinase B beta) stabilizes ATP7A, a copper
transporter for extracellular superoxide dismutase, in vascular
smooth muscle: Novel mechanism to limit endothelial dysfunction in
type 2 diabetes mellitus. Arterioscler Thromb Vasc Biol.
38:529–541. 2018. View Article : Google Scholar : PubMed/NCBI
|
|
49
|
Trejo-Soto PJ, Hernández-Campos A,
Romo-Mancillas A, Medina-Franco JL and Castillo R: In search of AKT
kinase inhibitors as anticancer agents: Structure-based design,
docking, and molecular dynamics studies of 2,4,6-trisubstituted
pyridines. J Biomol Struct Dyn. 36:423–442. 2018. View Article : Google Scholar : PubMed/NCBI
|
|
50
|
Nie Y, Sun L, Wu Y, Yang Y, Wang J, He H,
Hu Y, Chang Y, Liang Q, Zhu J, et al: AKT2 regulates pulmonary
inflammation and fibrosis via modulating macrophage activation. J
Immunol. 198:4470–4480. 2017. View Article : Google Scholar : PubMed/NCBI
|