Introduction
MicroRNAs (miRNAs) are small, non-coding RNAs that
are ~22 nucleotides in length. They serve important roles in
regulating gene expression and are involved in a number of
biological processes, including early development, vascular
development (1,2), cell proliferation, differentiation
and apoptosis (3). miRNAs are
encoded and transcribed as primary transcripts, which are
subsequently cleaved by 2 enzymes, Drosha and Dicer, to produce
mature miRNAs. As part of the RNA-induced silencing complex, miRNAs
regulate gene expression post-transcriptionally by binding to
target mRNAs. Several genes are involved in the regulation of eye
development and miRNAs have been shown to act upstream of these
genes (4,5). A previous study revealed that miRNA
dysregulation during mouse retinal development resulted in
morphological and functional defects (6).
While several studies have investigated the roles of
miRNA in cancer (7,8), few have investigated their role in
development. In addition, a limited number of studies have examined
the expression pattern of miRNAs in the mammalian retina. Karali
et al (9) analyzed the
spatiotemporal localization of several miRNAs in mouse embryonic
and postnatal retinas. Hackler et al (10) used microarrays to characterize the
miRNA expression patterns in the mouse retina from embryonic day 15
to adulthood. However, the aforementioned studies focused on the
expression patterns of specific miRNAs or obtained a global
expression profile for a limited number of time-points.
In mice, the period between postnatal day 0 (P0) and
postnatal day 21 (P21) is important for to retinal development,
particularly neuron development and angiogenesis (11,12).
The aim of the present study was to gain a more detailed
understanding of the postnatal miRNA expression pattern over
several time-points and to identify the miRNAs required for mouse
retinal development, using a linear model. The combination of
bioinformatics analysis and microarray data allowed for the
comprehensive analysis of the miRNA expression pattern. Initially,
differentially expressed miRNAs (DE-miRNAs) associated with neuron
development and angiogenesis were identified. The target genes of
these miRNAs were subsequently predicted and pathway enrichment
analysis was performed using Gene Ontology (GO) and the Kyoto
Encyclopedia of Genes and Genomes (KEGG). Reverse-transcription
quantitative polymerase chain reaction (RT-qPCR) was performed to
validate the identified miRNAs. The present study identified
critical miRNAs associated with mouse retinal development and
investigated their biological functions and molecular
interactions.
Materials and methods
Animals
C57BL/6J pregnant mice aged 6–8 weeks (32–40 g) were
purchased from the Ophthalmic Animal Laboratory, Zhongshan
Ophthalmic Center, Sun Yat-Sen University and housed in a
pathogen-free environment with an average temperature of 20°C, 55%
humidity and 12-h light/dark cycle with free access to food and
water. The procedures for the care and use of the animals were
approved by The Ethics Committee of the Sun Yat-Sen University
Zhongshan Ophthalmic Center (ethical approval no. 2017-069).
Institutional and governmental regulations concerning the ethical
use of animals were followed. Animal health and behavior were
monitored daily. Retinas from mice at P0, P1, P3, P4, P7, P8, P10,
P14 and P21 were harvested and pooled. A total of 46 mice were used
for the experiment and sacrifice was performed by cervical
dislocation.
RNA extraction
Each sample consisted of 8–10 mixed retina tissues.
Total RNA was isolated using TRIzol® (Invitrogen; Thermo
Fisher Scientific, Inc.) and purified with the RNeasy Mini kit
(Exiqon; Qiagen GmbH), according to the manufacturer's protocol.
RNA quality and quantity were measured using a spectrophotometer
(ND-1000; NanoDrop Technologies; Thermo Fisher Scientific, Inc.).
To determine the RNA integrity, the isolated RNA with loading
buffer was loaded and electrophoresed on a 1% Tris-Acetate-EDTA
agarose gel.
miRNA labeling and array
hybridization
The miRCURY™ Hy3™/Hy5™ Power labeling kit (Exiqon;
Qiagen GmbH) was used for miRNA labeling, according to the
manufacturer's protocol. The Hy3™-labeled samples were subsequently
hybridized on the miRCURYTM Locked Nucleic Acid Array (version
18.0; Exiqon; Qiagen GmbH), according to the manufacturer's
protocol. The resulting slides were scanned using the Axon GenePix
4000B microarray scanner (Molecular Devices, LLC).
Identification of key DE-miRNAs
The expression of each miRNA on microarrays at the
developmental time-points of interest was analyzed using linear
regression models. For each miRNA, time-points and their
corresponding expression values were regarded as independent
variable × and dependent variable y, respectively, as follows:
yi=β0+β1xi+εi
Where β0, β1 and
εi represented the intercept, slope and error
term, respectively. The aim was to find the estimated value
^β0 and ^β1 for the intercept
and slope that would provide the best fit for all the time-points
for each miRNA. In other words, the goal was to find the
^β0 and ^β1 values that
minimized the sum of the squared error term (Q):
Q(β0,β1)=∑(yi-β0-β1xi)2
Q(βˆ0,βˆ1)=minβ0,β1 Q(β0,β1)
Using the least-squares approach, the intercept and
slope of the fitted regression line of each miRNA were calculated.
The greater the absolute value of the slope, the greater the change
in miRNA expression during mouse retinal development. Since data
from microarrays often have high variability, the linear model may
not be appropriate for miRNAs with a high absolute value of the
slope. Therefore, in order to reduce the false positive rate, the
coefficient of determination (R2) of each
regression line was calculated to evaluate the proportion of the
variance:
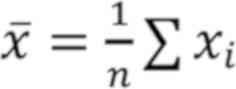
R2=(∑(xi-x¯)(yi-y¯))2∑(xi-x¯)2∑(yi-y¯)2
Where x¯=1n∑xi
and y¯=1n∑yi
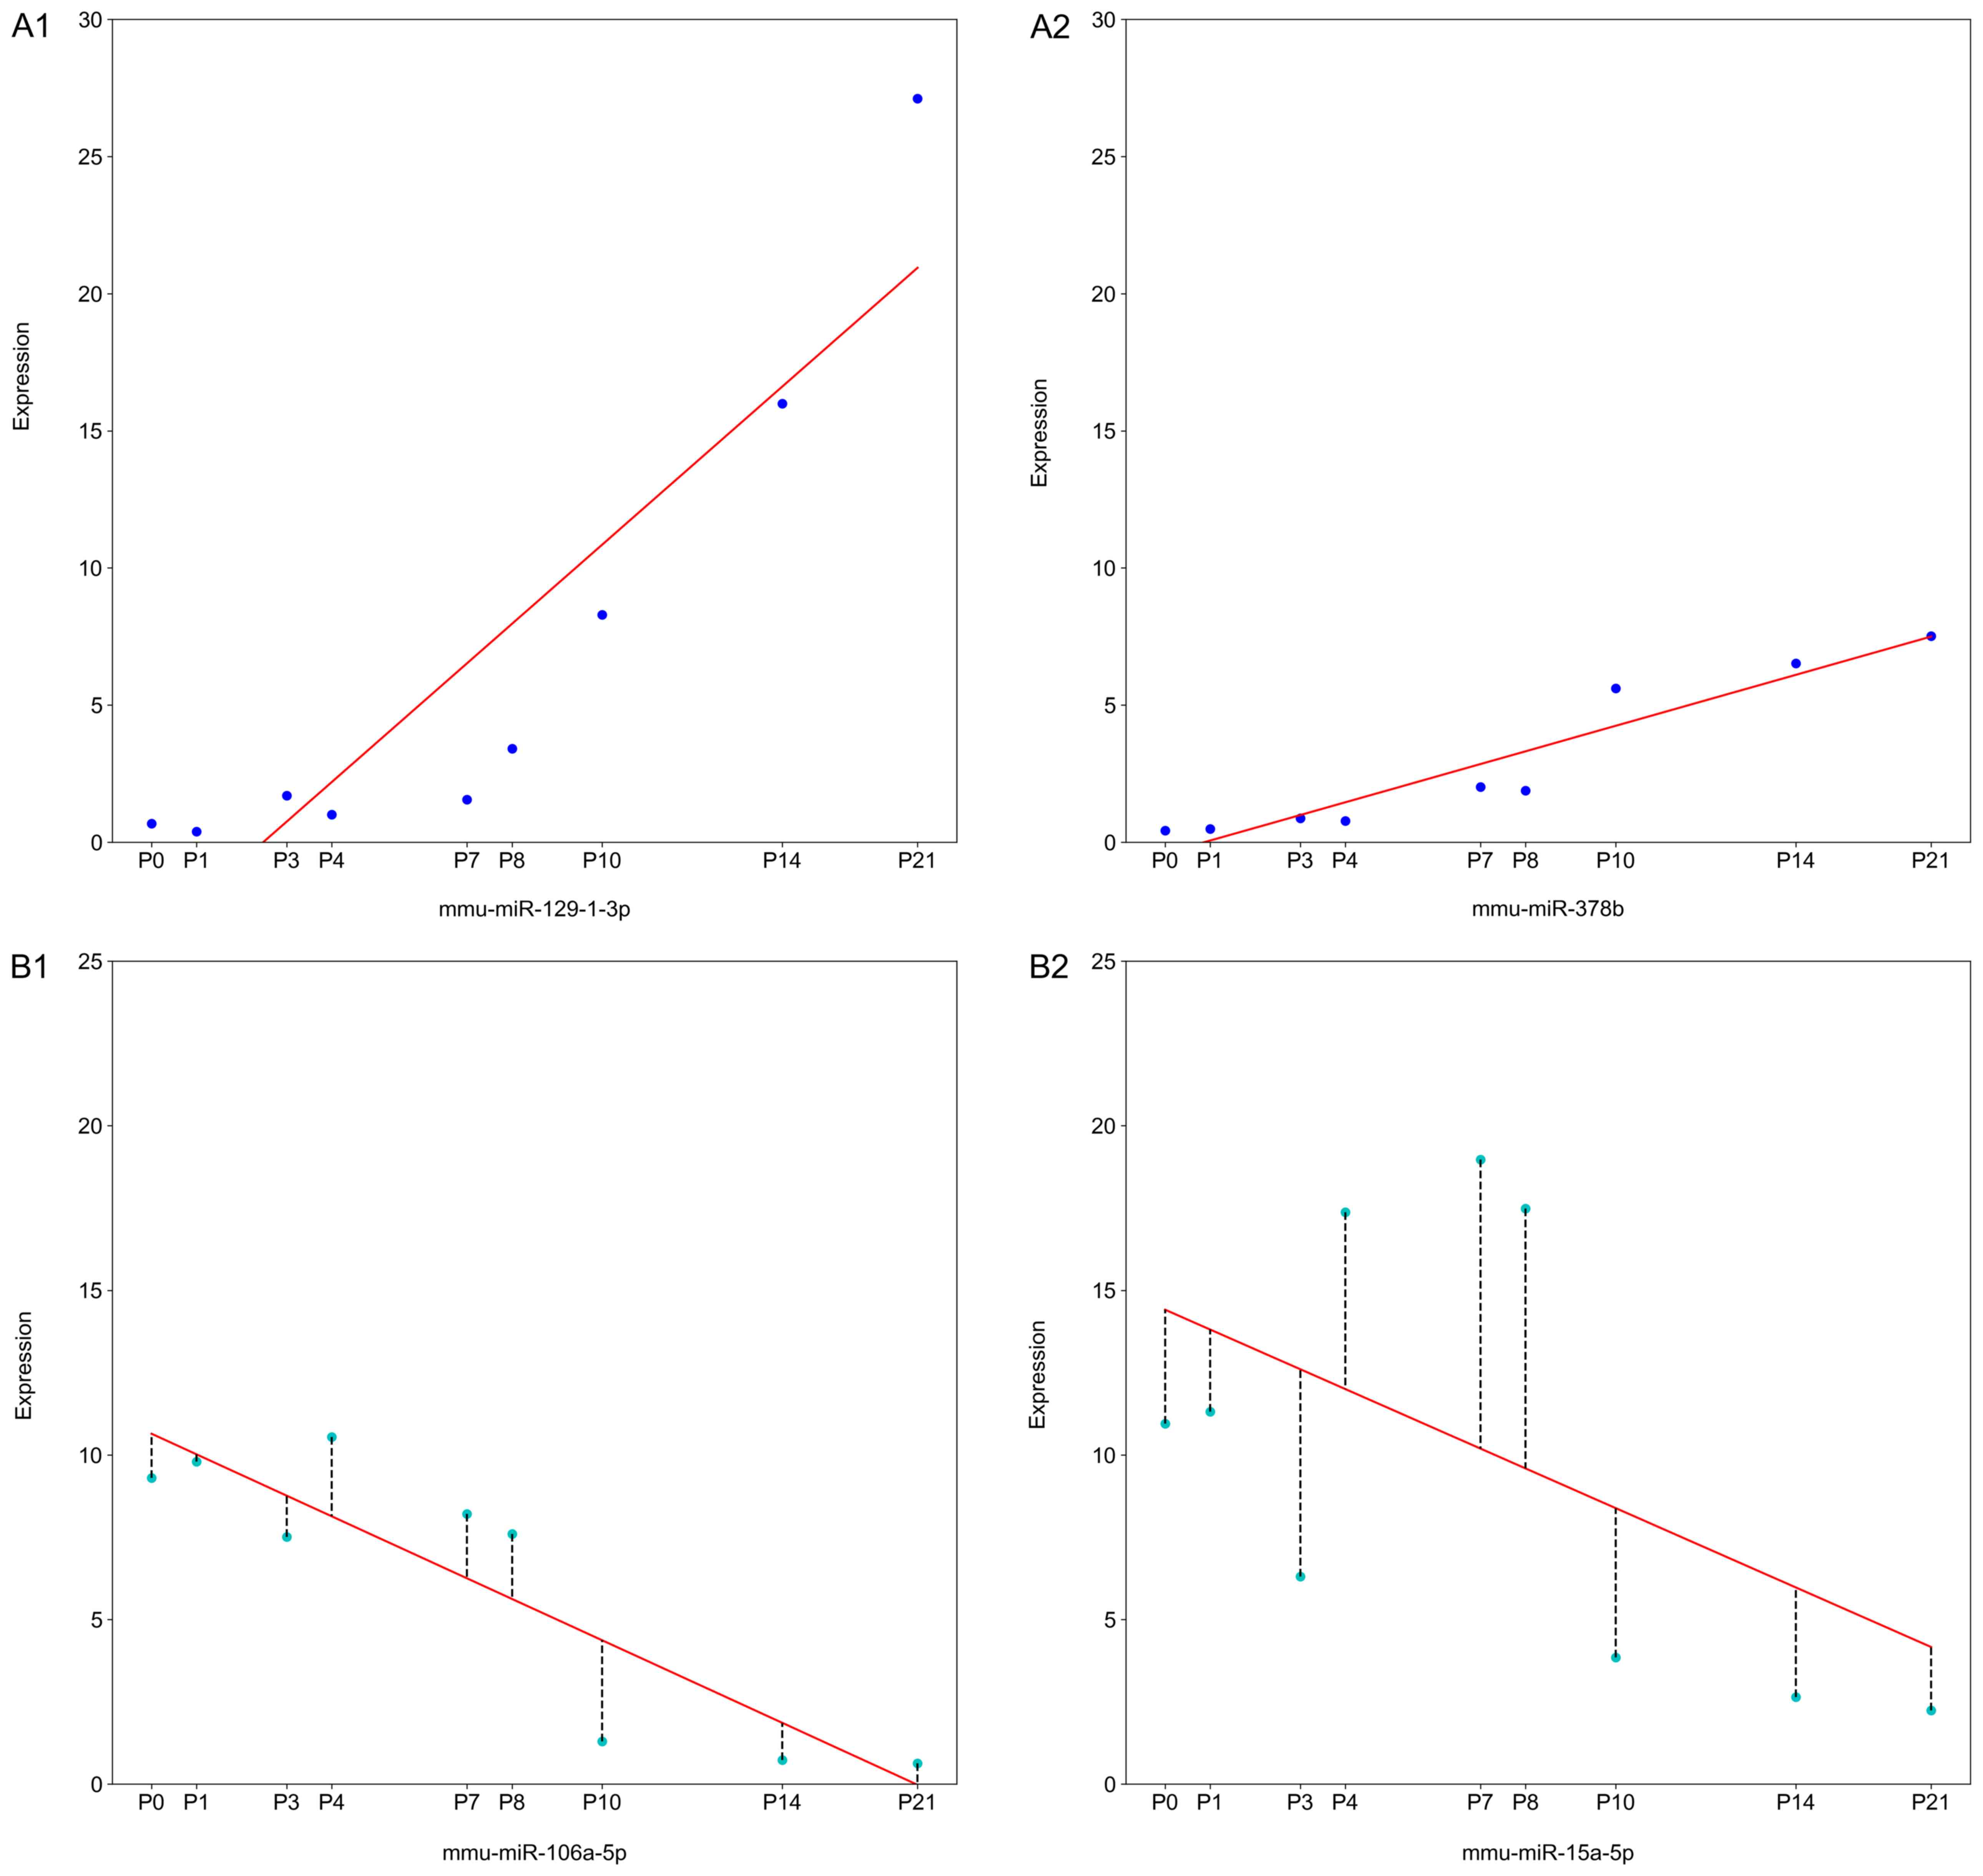
The closer R2 is to 1, the better
the estimated regression line is at explaining the relationship
between × and y. miRNAs with a R2>0.6 were
considered reliable. This implied that ≤60% of the variability
between the 2 variables was accounted for by a linear regression
model (Fig. 1). miRNAs with
absolute values of the slopes in the top 1% and
R2>0.6 were considered to be the most
essential miRNAs during mouse retinal development and were defined
as DE-miRNAs.
Identifying the target genes of the
DE-miRNAs
TargetScan (version 7.2) (13) and miRDB (version 6.0) (14), 2 miRNA target gene prediction
databases that are continuously updated, were used to identify the
target genes of the DE-miRNAs using the default parameters. In
order to increase the accuracy of the results obtained, any gene
that was predicted by both databases for a specific miRNA was
considered as a target gene for that miRNA.
GO and KEGG pathway enrichment
analyses
A GO term describes the functions of specific genes
in terms of their associated biological processes, cellular
components and molecular functions. GO enrichment analysis is used
to identify which GO terms are enriched in a given gene set
(15,16). Based on the knowledge of molecular
interactions, reactions and gene relation networks, potential
target genes of interest were annotated in a collection of manually
drawn pathway maps. The goal of KEGG pathway enrichment analysis is
to determine the pathways in which a certain set of genes are
over-represented (17). After the
target genes were identified, GO and KEGG pathway enrichment
analyses were performed using the online tool DAVID (version 6.8)
(18,19).
RT-qPCR
RT-qPCR analysis of the final filtered DE-miRNAs was
performed. Total RNA from retinas was isolated and RNA quality and
quantity were measured as described earlier. The RNA was reverse
transcribed with a PrimeScript RT reagent kit (Takara Bio, Inc.)
using specific primers for each miRNA and U6 was used as the
reference (Bulge-Loop miRNA qPCR Primers; RiboBio, Co., Ltd.; the
sequences are a commercial secret). Real-time PCR was subsequently
performed conducted on the resulting cDNA template using TB Green™
Premix Ex Taq™ II (Takara Bio, Inc.) on a StepOnePlus™ Real-Time
PCR System (Applied Biosystems; Thermo Fisher Scientific, Inc.)
using the following protocol: 95°C for 30 sec; 40 cycles of 95°C
for 10 sec, 60°C for 20 sec, and 70°C for 1 sec. miRNA expression
levels were quantified using the 2−ΔΔCq method and
normalized to U6 levels (20).
Efficiencies of qPCR reactions were also calculated by standard
curve method (21).
Statistical analyses: The method of
identifying DE-miRNAs using linear regression models has already
been described
miRNA expression levels and efficiencies were
calculated from the average of three independent RT-qPCR
experiments. Linear regression models were also used to fit the
RT-qPCR data. In enrichment of GO and KEGG pathway analyses,
P<0.05 was considered to indicate a statistically significant
difference. All the data processing and figure generation were
performed using Python. (Python Software Foundation; Python
Language Reference; version 3.6; http://www.python.org).
Results
Identification of key DE-miRNAs in
mouse retinal development
The mean values of the concentration and OD 260/280
for the RNA samples were 1,156 ng/µl and a ratio of 2.02,
respectively, indicating that the RNA samples were acceptable for
microarray hybridization. The microarray data discussed in the
present study have been deposited in the Gene Expression Omnibus
(GEO) and are accessible through GEO Series accession number
GSE115581 (https://www.ncbi.nlm.nih.gov/geo/query/acc.cgi?acc=GSE115581).
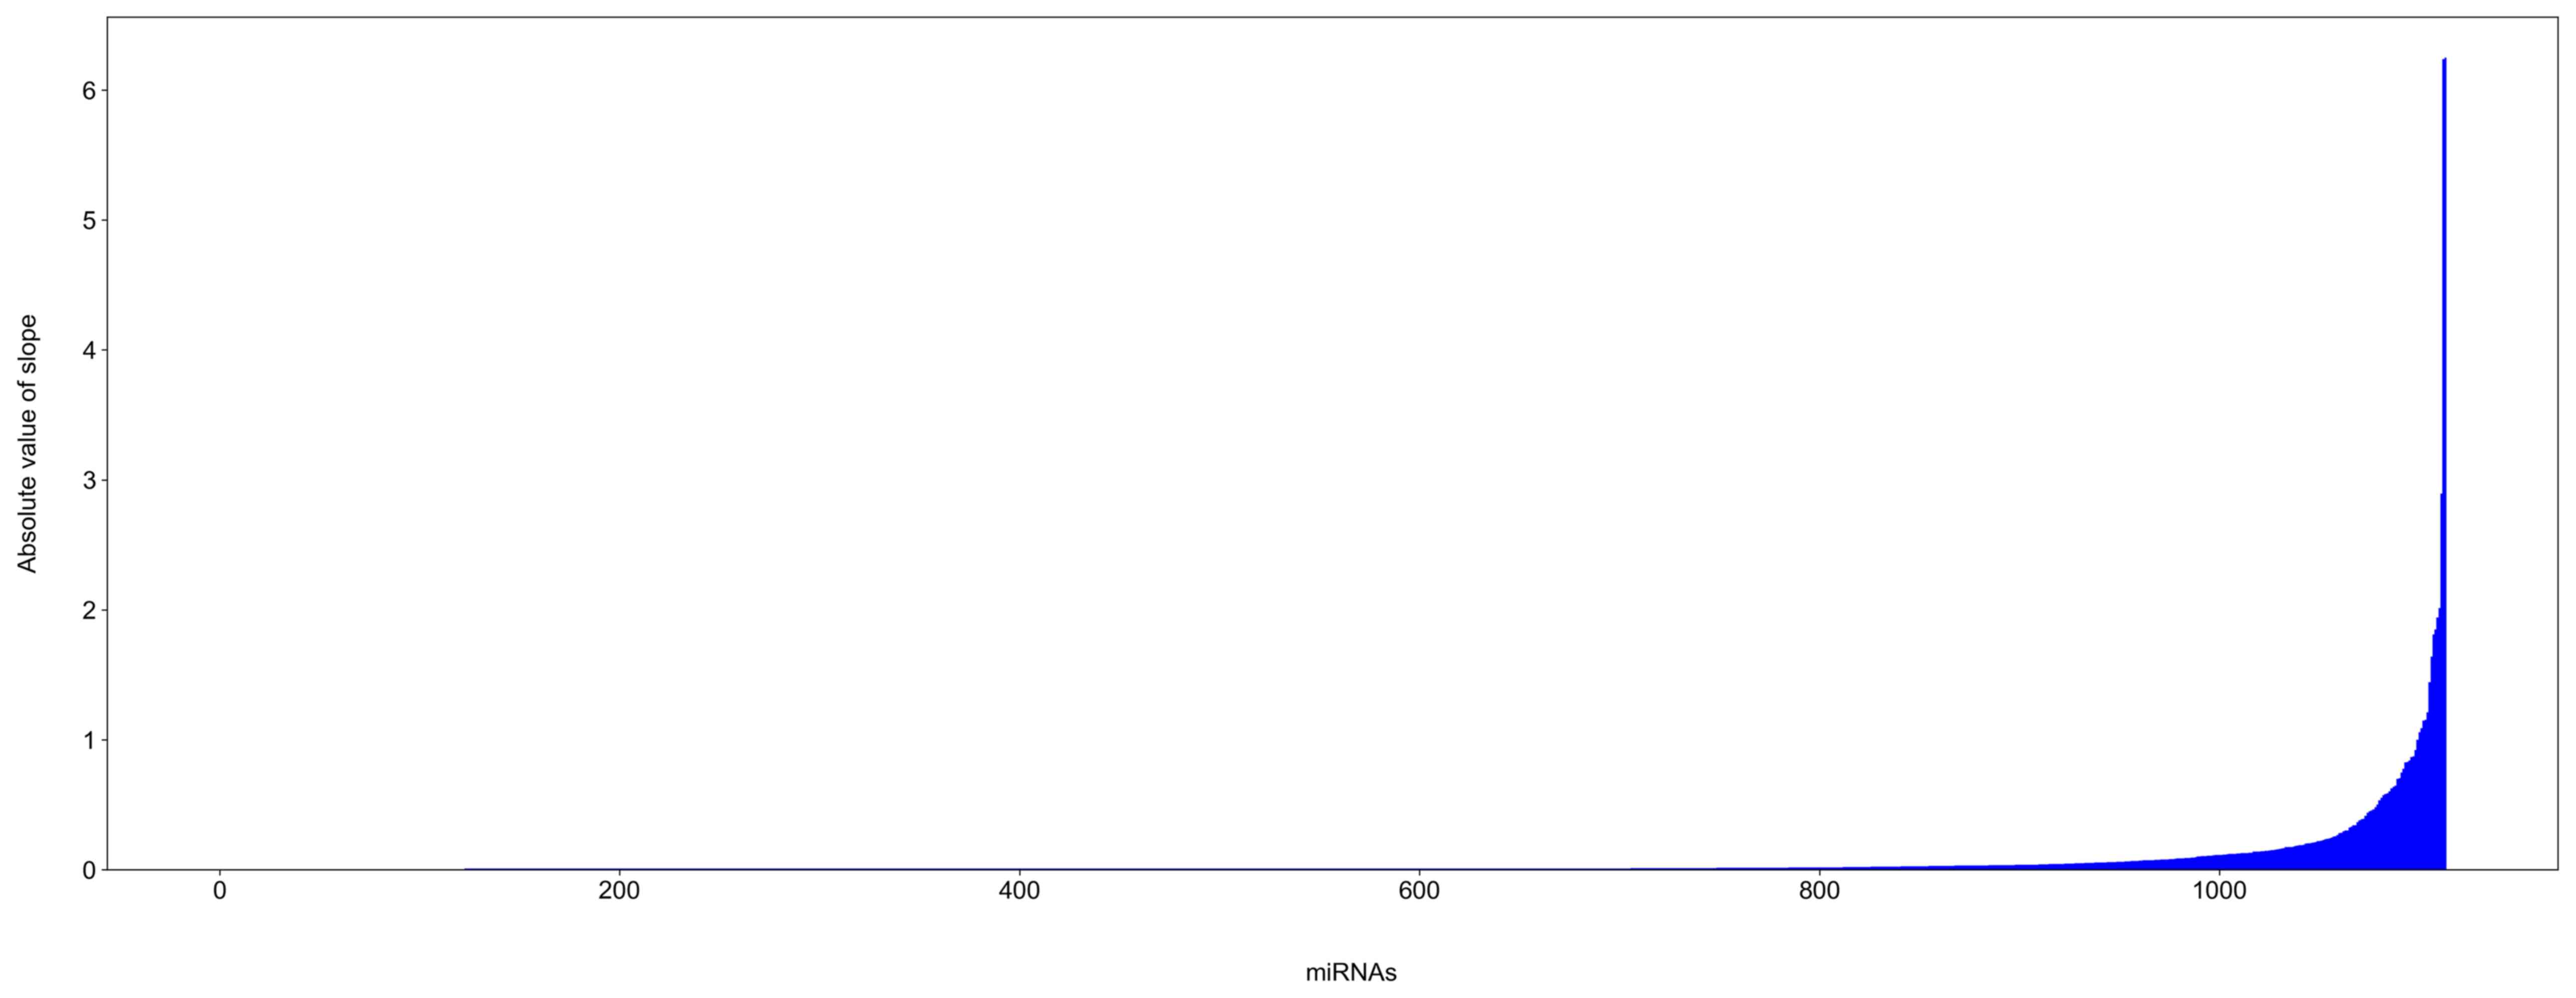
A total of 1,114 mouse miRNAs were identified and analyzed from the
microarrays. The slope values for the majority of the miRNAs were
equal or nearly equal to 0, indicating that the expression of these
miRNAs did not significantly change during mouse retinal
development (Fig. 2).
A change in slope value can be seen at
the far right of the horizontal axis (Fig. 2)
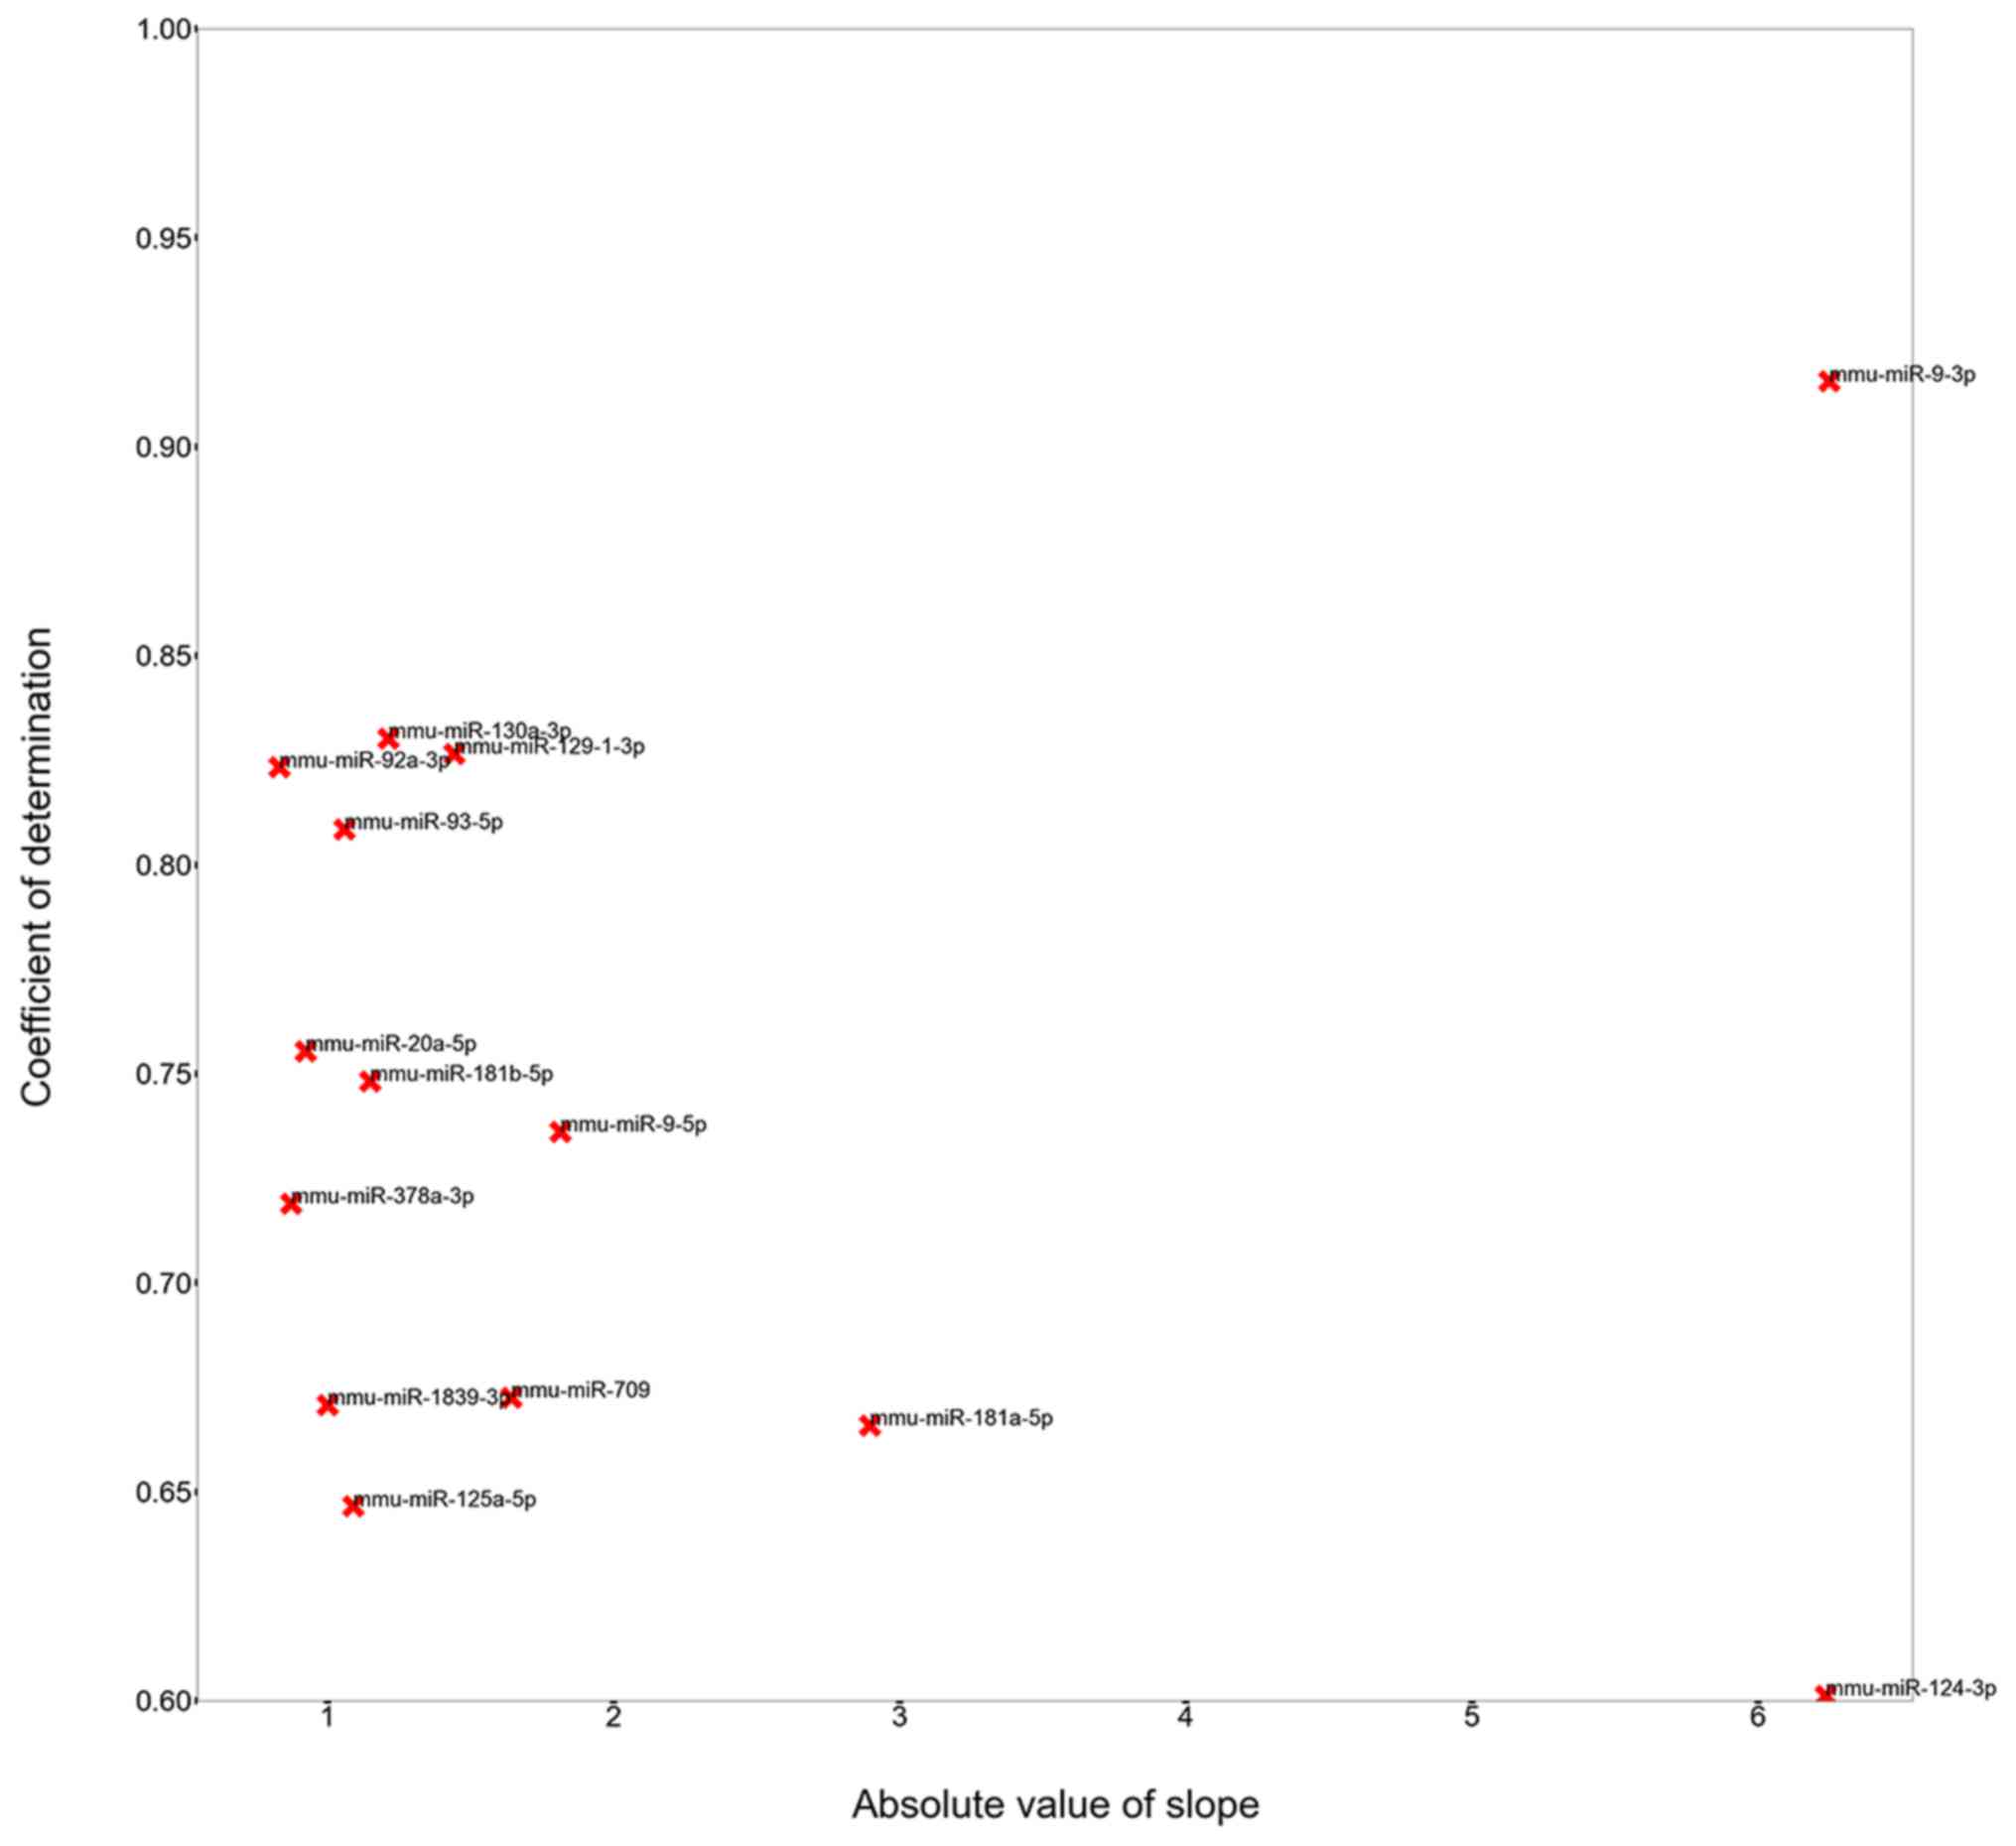
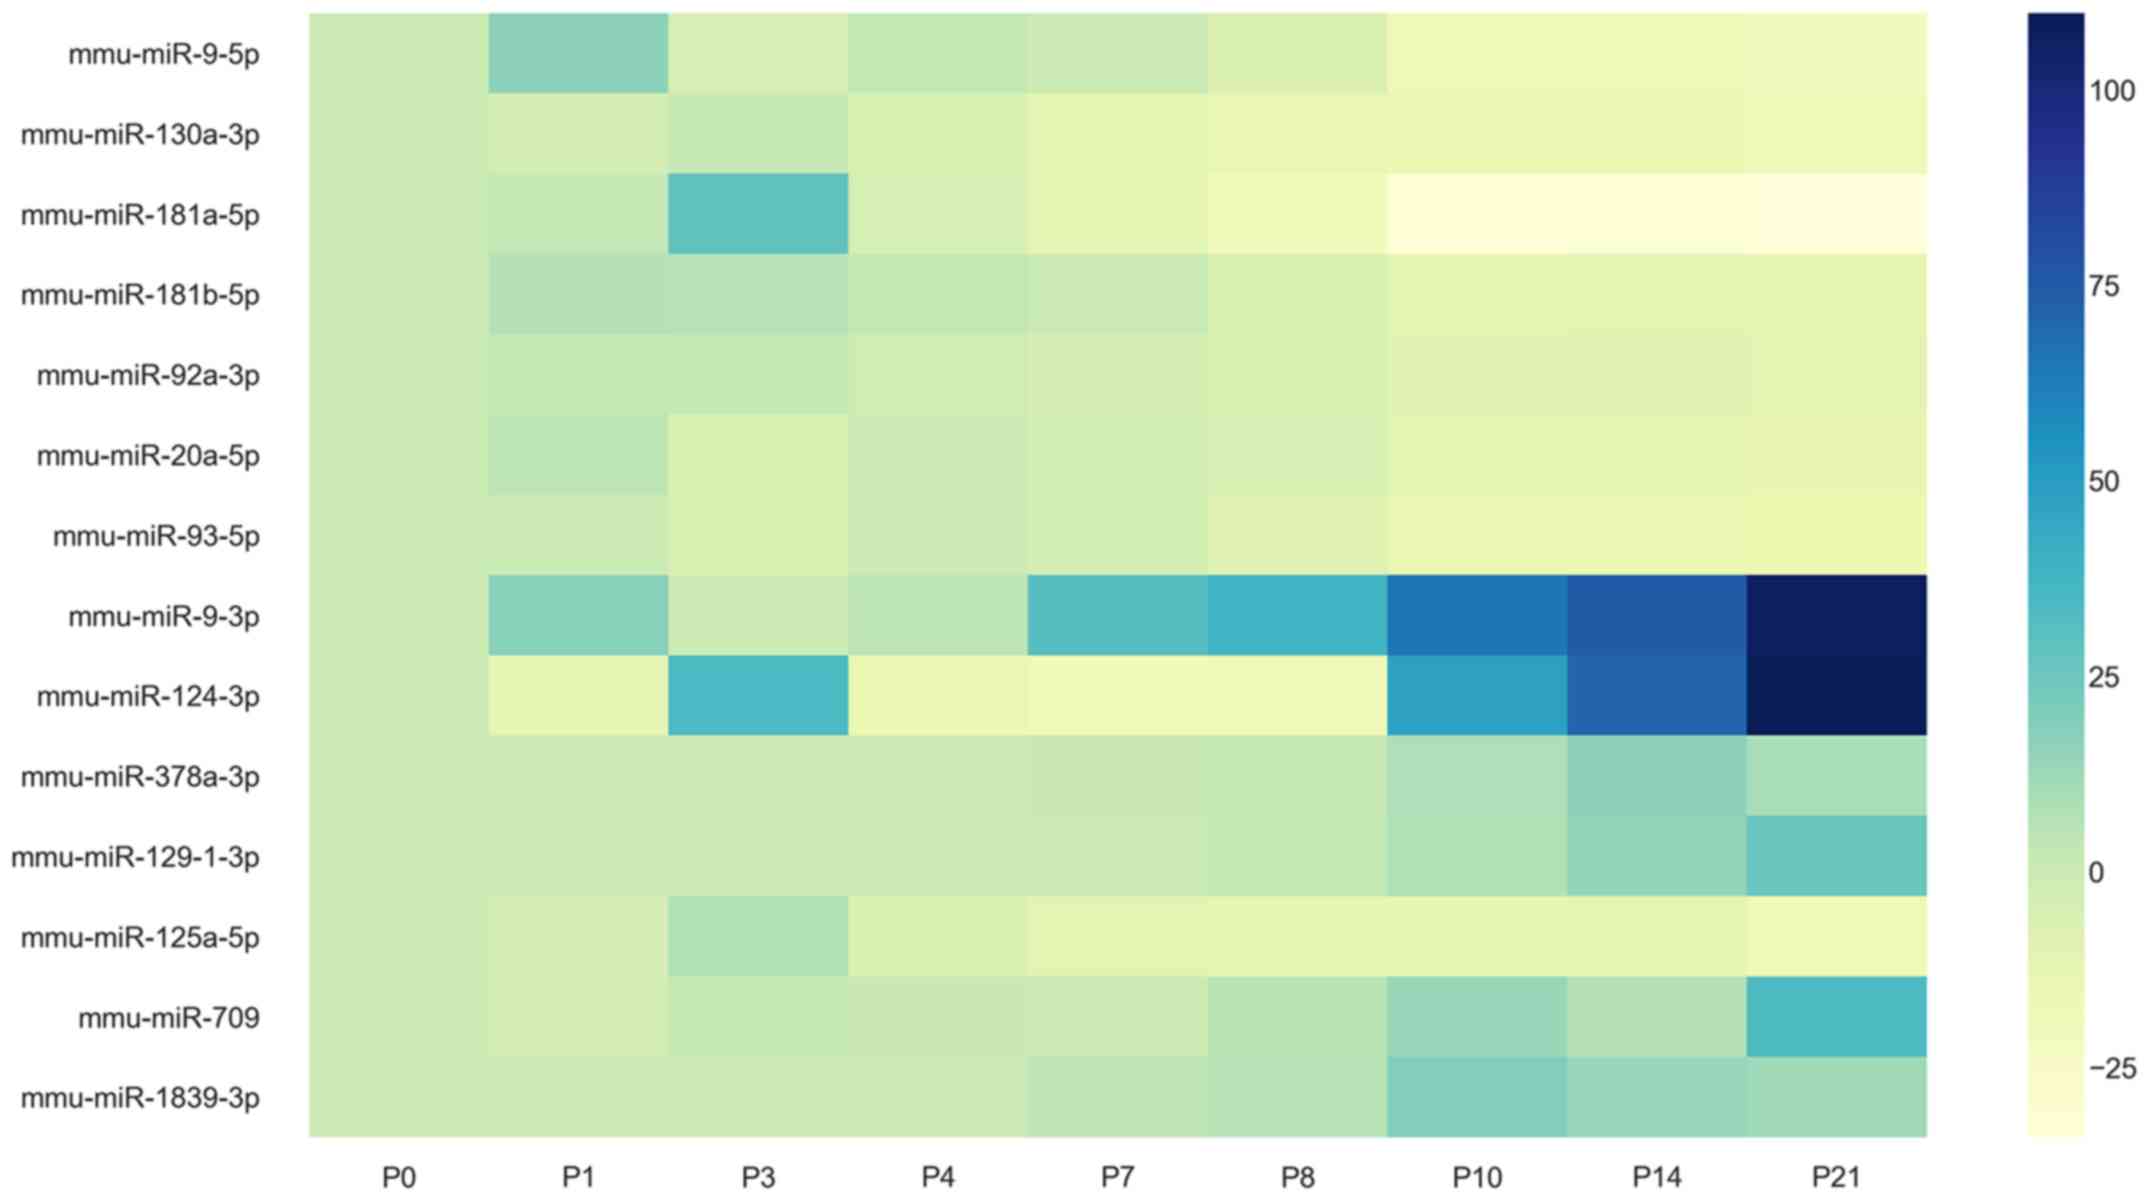
Using a top 1% cut-off, miRNAs with no significant
trend were excluded. The R2 of each identified
miRNA was evaluated and miRNAs were considered to be DE-miRNAs if
the absolute value of the slope was in the top 1% and
R2>0.6. Using this threshold, a total of 14
miRNAs were identified and included miR-709, miR-1839-3p, miR-9-5p,
miR-130a-3p, miR-181a-5p, miR-181b-5p, miR-92a-3p, miR-20a-5p,
miR-93-5p, miR-9-3p, miR-124-3p, miR-378a-3p, miR-129-1-3p and
miR-125a-5p (Figs. 3 and 4).
Enrichment analyses of GO and KEGG
pathway
A target gene set was retrieved from TargetScan and
miRDB for each DE-miRNA. After target genes had been retrieved, GO
and KEGG enrichment analyses were performed through the DAVID
online tool. With an adjusted P<0.05, each gene set generated
both a GO and a KEGG enrichment result. For biological processes,
GO analysis results revealed that target genes of DE-miRNAs were
enriched in cellular metabolic process-related terms (Table I).
 | Table I.Gene ontology analysis for the
biological process of predicted target genes associated with retina
development. |
Table I.
Gene ontology analysis for the
biological process of predicted target genes associated with retina
development.
| miRNA | Term | Gene count | Adjusted
P-valuea |
|---|
| miR-9-5p |
GO:0043161~proteasome-mediated
ubiquitin-dependent protein catabolic process | 21 |
8.37×10⁻³ |
|
| GO:0036211~protein
modification process | 96 |
8.98×10⁻³ |
|
| GO:0006464~cellular
protein modification process | 96 |
8.98×10⁻³ |
| miR-130a-3p | GO:0036211~protein
modification process | 107 |
2.31×10⁻⁷ |
|
| GO:0006464~cellular
protein modification process | 107 |
2.31×10⁻⁷ |
|
|
GO:0010556~regulation of macromolecule
biosynthetic process | 112 |
6.45×10⁻⁶ |
| miR-181a/b-5p |
‘GO:0006351~transcription,
DNA-templated’ | 129 |
5.97×10⁻⁹ |
|
|
GO:0006357~regulation of transcription
from RNA polymerase II promoter | 88 |
3.98×10⁻⁹ |
|
|
GO:0051252~regulation of RNA metabolic
process | 140 |
6.23×10⁻⁹ |
| miR-93-5p |
GO:0010556~regulation of macromolecule
biosynthetic process | 169 |
1.87×10⁻⁸ |
|
|
GO:0006357~regulation of transcription
from RNA polymerase II promoter | 96 |
2.90×10⁻⁸ |
|
|
‘GO:0006351~transcription,
DNA-templated’ | 141 |
6.37×10⁻⁸ |
| miR-92a-3p | GO:0006464~cellular
protein modification process | 97 |
4.68×10⁻⁷ |
|
| GO:0036211~protein
modification process | 97 |
4.68×10⁻⁷ |
|
|
GO:0006796~phosphate-containing compound
metabolic process | 78 |
6.62×10⁻⁸ |
| miR-20a-5p |
GO:0010556~regulation of macromolecule
biosynthetic process | 169 |
6.83×10⁻¹² |
|
|
GO:0006357~regulation of transcription
from RNA polymerase II promoter | 95 |
2.03×10⁻¹¹ |
|
|
‘GO:0006351~transcription,
DNA-templated’ | 140 |
4.40×10⁻¹¹ |
| miR-9-3p | GO:0031325~positive
regulation of cellular metabolic process | 87 |
3.67×10⁻³ |
|
| GO:0010604~positive
regulation of macromolecule metabolic process | 86 |
5.11×10⁻³ |
|
| GO:0009893~positive
regulation of metabolic process | 90 |
5.48×10⁻³ |
| miR-124 |
GO:0006357~regulation of transcription
from RNA polymerase II promoter | 113 |
2.51×10⁻⁸ |
|
| GO:0007155~cell
adhesion | 103 |
4.41×10⁻⁸ |
|
|
GO:0022610~biological adhesion | 103 |
4.57×10⁻⁸ |
| miR-709 | GO:0050839~cell
adhesion molecule binding | 44 |
1.39×10⁻⁸ |
|
| GO:0098632~protein
binding involved in cell-cell adhesion | 33 |
3.48×10⁻⁸ |
|
| GO:0098631~protein
binding involved in cell adhesion | 33 |
5.24×10⁻⁸ |
KEGG pathway enrichment analysis indicated that
target genes of DE-miRNAs were significantly enriched in
development-related pathways, including PI3K/AKT/mTOR signaling,
class O of forkhead box transcription factors (FOXO) signaling,
mitogen-activated protein kinase (MAPK) signaling, neurotrophin
signaling, transforming growth factor (TGF)-β signaling, focal
adhesion and axon guidance pathways (Table II). miR-1839-3p, miR-378a-3p,
miR-129-1-3p and miR-125a-5p showed no significant enrichment
associated with retinal development in KEGG analysis.
| Table II.KEGG pathway analysis of predicted
target genes associated with retina development. |
Table II.
KEGG pathway analysis of predicted
target genes associated with retina development.
| miRNA | Term | Gene count | Adjusted
P-valuea | Genes |
|---|
| miR-9-5p | Neurotrophin
signaling pathway | 10 |
3.84×10⁻² | ‘MAP3K3, MAP3K1,
GSK3B, SORT1, NFKB1, SHC1, MAPKAPK2, SHC2, MAP2K7,
ARHGDIA’ |
|
| MAPK signaling
pathway | 14 |
3.03×10⁻² | ‘MEF2C, RPS6KA4,
MAP3K3, MAP3K1, TGFBR1, TGFBR2, PDGFRB, CACNB2, NFKB1, MAPKAPK2,
MAP2K7, NFATC3, STK3, ATF2’ |
| miR-130a-3p | TGF-β signaling
pathway | 9 |
3.92×10⁻³ | ‘INHBB, ACVR2A,
MAPK1, TNF, TGFBR2, SMAD5, BMPR2, TGFB2, ACVR1’ |
|
| mTOR signaling
pathway | 7 |
1.65×10⁻² | ‘MAPK1, TNF,
TSC1, PIK3CB, ULK2, PRKAA1, PTEN’ |
|
| FOXO signaling
pathway | 9 |
4.32×10⁻² | ‘MAPK1, S1PR1,
PIK3CB, TGFBR2, PRKAA1, PTEN, GADD45A, BCL2L11, TGFB2’ |
| miR-181a/b-5p | FOXO signaling
pathway | 12 |
5.37×10⁻³ | ‘CCNB1, MAPK1,
S1PR1, MAP2K1, SOS1, TGFBR1, NLK, GRM1, PTEN, SIRT1, AKT3,
BCL2L11’ |
|
| mTOR signaling
pathway | 7 |
2.30×10⁻² | ‘RPS6KA6, MAPK1,
TNF, RPS6KB1, PTEN, AKT3, DDIT4’ |
|
| TGF-β signaling
pathway | 8 |
2.88×10⁻² | ‘MAPK1, TNF,
E2F5, SMAD7, TGFBR1, RPS6KB1, TGIF2, ACVR1C’ |
| miR-93-5p | Axon guidance | 13 |
1.49×10⁻² | ‘SEMA5A, EPHA5,
PAK7, EPHA4, EPHA7, LIMK1, CFL2, SEMA7A, DPYSL5, PPP3R1, SEMA4B,
DPYSL2, SRGAP1’ |
| miR-92a-3p | PI3K-Akt signaling
pathway | 19 |
1.67×10⁻⁴ | ‘IBSP, PHLPP2,
PIK3CB, PTEN, COL5A1, BCL2L11, CCNE2, TSC1, ITGA6, CHRM2, ITGA5,
ITGAV, COL27A1, ITGA8, CREB3L2, COL1A2, PIK3CA, FASL,
PRKAA2’ |
|
| Focal adhesion | 14 |
7.07×10⁻⁴ | ‘IBSP, PIK3CB,
PPP1R12C, PTEN, COL5A1, ITGA6, ITGA5, ITGAV, ITGA8, COL27A1,
COL1A2, PIK3CA, RAP1B, MAPK8’ |
| miR-20a-5p | Axon guidance | 13 |
1.57×10⁻² | ‘SEMA5A, EPHA5,
PAK7, EPHA4, EPHA7, LIMK1, CFL2, SEMA7A, DPYSL5, PPP3R1, SEMA4B,
DPYSL2, SRGAP1’ |
| miR-9-3p | Axon guidance | 10 |
5.32×10⁻² | ‘LRRC4, DCC,
GNAI2, PLXNA2, GNAI1, CFL2, SEMA3A, SEMA4D, ITGB1, RASA1’ |
| miR-124 | Axon guidance | 14 |
2.95×10⁻² | ‘PLXNA3, NRP1,
GNAI3, ROCK1, GNAI1, PLXNB2, SLIT1, ITGB1, EPHA2, SEMA6A, SEMA6D,
UNC5D, NFATC2, SRGAP1’ |
|
| Focal adhesion | 18 |
2.84×10⁻² | ‘CAV1, TLN1,
COL4A1, ROCK1, ACTN4, PGF, GRB2, ITGA3, ITGB1, FLNB, CRKL, CCND2,
SOS1, SOS2, ITGA7, SHC1, LAMC1, RAPGEF1’ |
| miR-709 | Axon guidance | 15 |
1.88×10⁻⁴ | ‘PLXNA4, EFNB3,
EFNA1, LIMK1, PLXNA2, EFNB1, PAK6, NCK2, EPHA4, MAPK1, SEMA4G,
SEMA3F, ROBO2, PAK1, SRGAP2’ |
PI3K, AKT, PTEN, mitogen-activated protein kinase
(MAPK)1, Son of Sevenless (SOS), sphingosine-1-phosphate receptor 1
(S1PR1), BCL2L11, TGF-β receptor (TGFBR)1/2 and integrin α
(ITGA)/ITGB are important components of the significantly enriched
pathways. Each gene was predicted for several DE-miRNAs in the
present study. PI3K/AKT were predicted as target genes of
miR-130a-3p and miR-9-3p. SOS, S1PR1 and BCL2L11 were predicted as
the target of miR-124. PTEN and MAPK1 were predicted as the target
of miR-181a/b-5p, miR-92a-3p, miR-709 and miR-130a-3p. TGFBR1/2
were predicted as target genes of miR-181a/b-5p, miR-130a-5p,
miR-93-5p and miR-9-5p and ITGA/ITGB predicted for miR-9-3p,
miR-124 and miR-92a-3p.
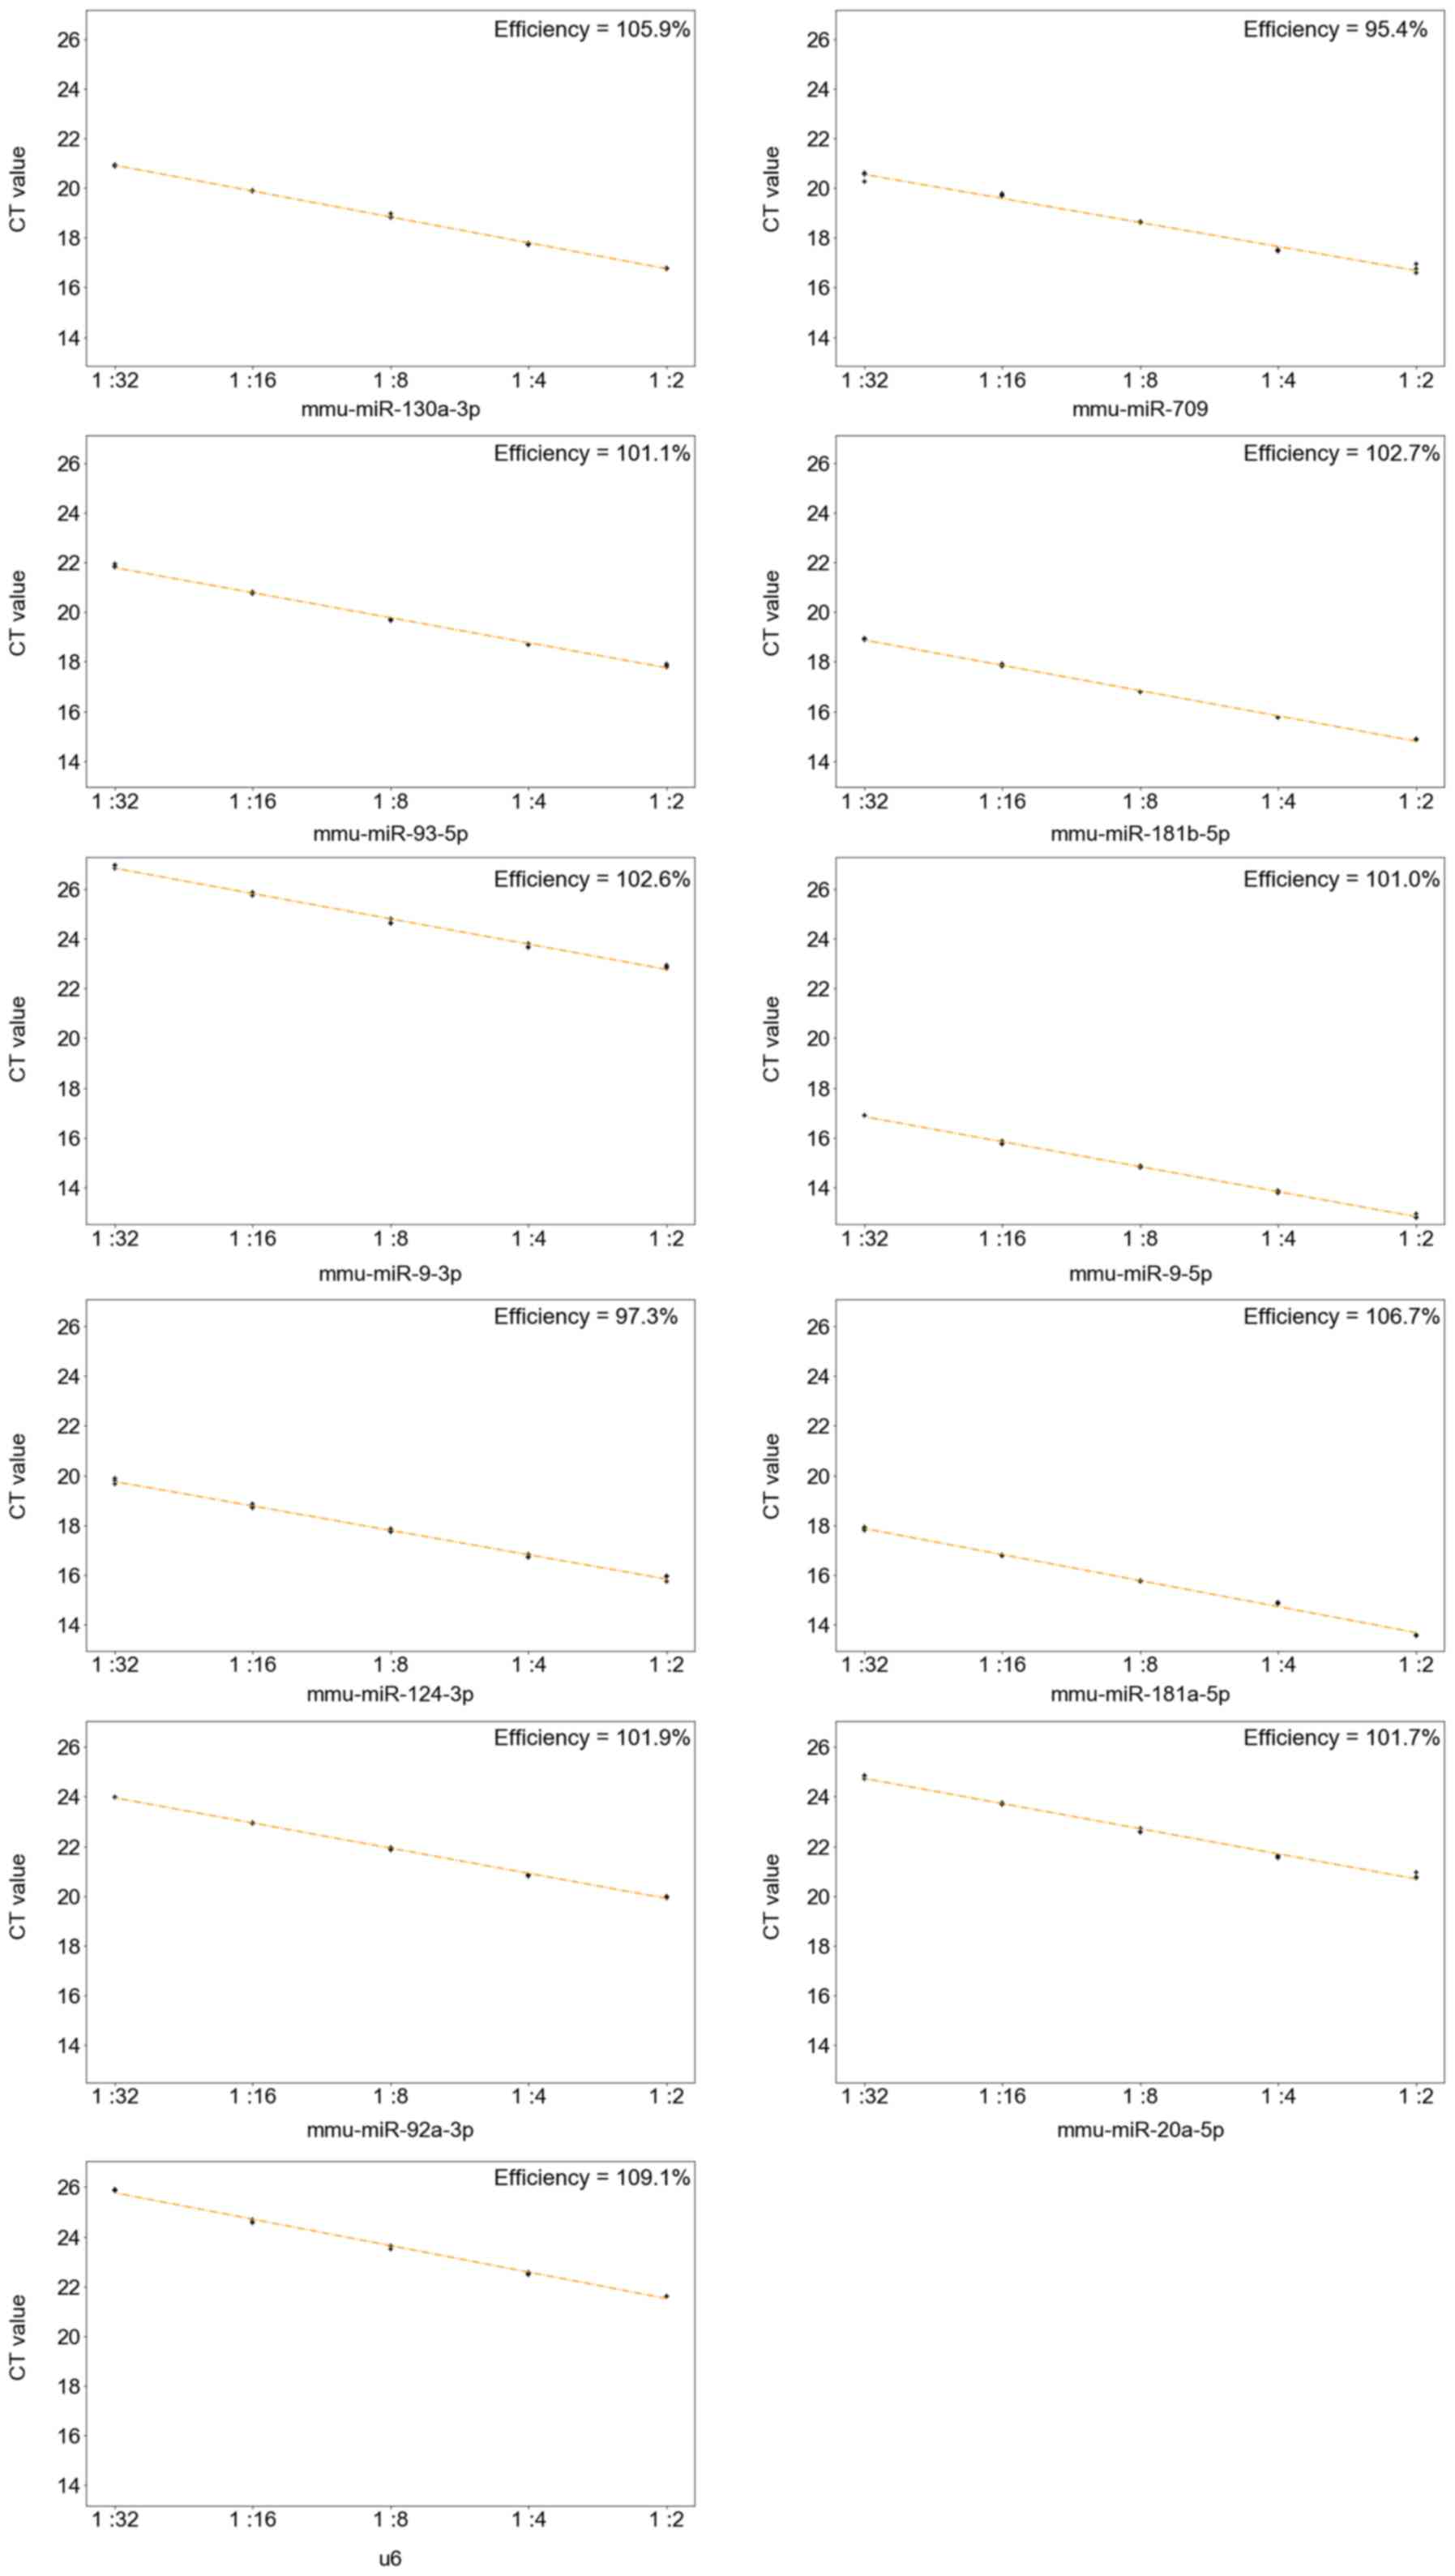
RT-qPCR validation
RT-qPCR was performed to validate the microarray
results. The efficiencies calculated from the standard curves were
all between 0.9 and 1.1 (Fig. 5),
indicating that it was appropriate to use 2 as the base number for
the 2−ΔΔCq method. The melt curves of the 10 DE-miRNAs
exhibited only one peak at a similar temperature, indicating that
the amplification was specific. Apart from miR-181a-5p and
miR-181b-5p, the 8 remaining miRNAs exhibited a similar trend to
the microarray results (Fig.
6).
Discussion
miRNAs regulate the expression of target genes and
are involved in a number of cellular processes, including the cell
cycle, self-renewal and differentiation. Tissue-specific and
spatiotemporal changes in miRNA expression suggest that miRNAs are
involved in the regulation of differentiation, development and
maturation during mouse retinal development. Therefore, the present
study filtered several key miRNAs according to the temporal
characteristics of mouse retinal development.
In the field of genomics, the aim is to find the
‘trend’ or ‘difference’ among data sets. Previous studies often
used an independent t-test or one-way analysis of variance (ANOVA)
to compare 2 or more data sets. It is appropriate to use a t-test
and ANOVA to process cross-sectional data when comparisons among
experimental and control groups are performed at the same time and
statistical results suggest an association between the data sets.
The expression data of each miRNA during retinal development,
however, were taken at successive time-points. Therefore, a t-test
or ANOVA would not reflect the overall expression trend involving
all time-points. For example, in a study conducted by Hackler et
al (10), the expression
change for each miRNA was defined as the difference between the
maximum and minimum values among five time-points using a t-test.
Therefore, data on the three remaining time-points were lost. In
order to overcome the difficulty of identifying the ‘trend’ in the
present study, linear regression models were used to analyze the
expression of each miRNA at the developmental times. Slopes with a
greater absolute value indicated a greater change in miRNA
expression.
As the microarray data had high variability, the
R2 was used to evaluate the variance in miRNA
expression. The closer the value of R2 was to 1,
the better the linear regression fit the expression data. The
miRNAs with high slope and R2 values tended to
have biological significance and were identified as DE-miRNAs.
Subsequently, DE-miRNAs were screened for functional analysis.
Retinal vascular and neuron development are of great
importance in the functionalization of the retina.
Functionalization is a complex process with rapid changes in infant
mice. Previous studies have reported that the blood plexus was
almost completely absent in mice at P1 but became dense at P3. By
P5, arterioles and venules had formed (11,22).
Research has demonstrated that the period between P0 and P21 is
critical for retinal neuron development and angiogenesis in mice
(11,12). To obtain a more detailed
description of the miRNA expression profile in the mouse retina in
the present study, a total of 9 developmental time-points between
P0 and P21 were used, with increased sampling density at the
earlier time-points.
The linear model used allowed all the developmental
time-points of interest to be considered. The miRNAs with absolute
values of the slope in the top 1% were selected for further
analysis. Along with the evaluation of R2, GO and
KEGG analyses and RT-qPCR validation, 8 key DE-miRNAs were
identified (Fig. 7). These were:
miR-9-5p, miR-130a-3p, miR-92a-3p, miR-20a-5p, miR-93-5p, miR-9-3p,
miR-709 and miR-124.
miR-124 and miR-9-5p/3p have been reported to be
enriched in the mammalian retina (9,23,24).
The present study revealed that miR-124a-3p exhibited an increasing
trend in both the microarray and RT-qPCR. Previous studies have
revealed that miR-124 promoted the human brain tumor growth and
angiogenesis (25,26). Additionally, miR-124 is required
for normal retinal neuronal development in Xenopus and rats
(27,28).
A number of studies have considered miR-9-5p and
miR-9-3p as a single combined entity (29,30).
miR-9/9*. Yoo et al (29)
reported that miR-9/9* and miR-124 induce the conversion of human
fibroblasts into neurons. Other studies revealed that the 5′ strand
and 3′ strand of miR-9 showed different effects. Sim et al
(31) found that miR-9-3p, but not
miR-9-5p, served an important role in hippocampal long-term
potentiation in the adult mouse. miR-9-3p and miR-9-5p were
reported to serve key roles in neurogenesis (32). In the present study, miR-9-3p and
miR-9-5p were analyzed separately and each showed significant
expression trends with high R2 values.
miR-181a-5p and miR-181b-5p are highly homologous
and share similar predicted target genes. Therefore, in the present
study, these 2 miRNAs were considered as miR-181a/b-5p. KEGG
analysis revealed that miR-181a/b-5p was enriched in TGF-β and MAPK
signaling pathways. Carrella et al (33) demonstrated that miR-181a/b is a key
factor in the specification and growth of retinal axons in medaka
fish and is involved in MAPK/ERK and TGF-β signaling. In the
microarray data in the present study, they had similar expression
patterns with a correlation coefficient >0.9 and were
undetectable after P10. However, RT-qPCR in the present study
revealed that miR-181a/b-5p exhibited minimal changes during
retinal development. A previous study used RNA in situ
hybridization to demonstrate that miR-181a was strongly expressed
in both postnatal and adult mouse retina (34).
miR-92a-3p and miR-20a-5p are members of the
mir-17–92 cluster, while miR-93-5p is a paralog. In the present
study, these three miRNAs shared similar expression pattern.
Previous studies have revealed associations between the
aforementioned three miRNAs and angiogenesis (35–37).
Blood vessel growth in a mouse model of limb ischemia and
myocardial infarction is enhanced following inhibition of
miR-92a-3p (35). miR-20a is shown
to target MKK3 and to regulate the migration and angiogenesis of
human endothelial cells in vitro (36). Fang et al (37) demonstrated that miR-93 promotes
angiogenesis in a human breast carcinoma cell line by targeting
LATS2. However, to the best of the authors' knowledge, in
vivo studies investigating the effect of these three miRNAs on
retinal development under normal conditions have not previously
been performed.
Functional studies of miR-709, miR-125a-5p,
miR-129-1-3p, miR-130a-3p and miR-378a-3p on retinal development
are lacking. The present authors are not aware of any studies
identifying that miR-709 is associated with angiogenesis or
neurogenesis. It has been reported that miR-125 was linked to
neurogenesis by promoting cell differentiation in mice and humans
(38–40). La Torre et al (41) demonstrated that miR-125 is one of
the key regulators of retinal progenitors and that overexpression
of miR-125 increases progenitor progression in Dicer-CKO retinas in
mice. miR-129 has been revealed to be highly expressed at the early
stages of development in the Xenopus retina (42). Furthermore, miR-129-1 suppresses
angiogenesis in human umbilical vein endothelial cells (43). miR-130a regulates neurodevelopment
by inhibiting neurite outgrowth in rat brains (44). Previous studies have suggested that
miR-378a-3p may promote tumor angiogenesis (45,46).
However, apart from miR-709, KEGG analysis in the present study did
not identify enrichment of miR-378a-3p, miR-129-1-3p or
miR-125a-5p.
The enriched pathways identified in the present
study are all associated with neurodevelopment or angiogenesis.
Previous studies have reported that the PI3K/AKT/mTOR pathway can
promote the growth of neural stem cells in mammal (47,48).
In vivo, the PI3K/AKT/mTOR pathway has an important role in
mammalian brain development, under both physiological and
pathological conditions (49–51).
The MAPK signaling pathway is highly conserved and is associated
with various cellular functions (52). It has been reported that, together
with the PI3K/AKT pathway, the MAPK signaling pathway exhibits
neuroprotective effects in neurons in rat retina (53) and increases their proliferation and
transdifferentiation (54). The
FOXO family of transcription factions serves essential roles in
regulating the expression of genes. FOXO shows a temporal
expression pattern in the developing zebra fish retina (55) and may promote angiogenesis by
increasing the metabolism and proliferation of endothelial cells
(56). Neurotrophin signaling and
the axon guidance pathway are involved in the formation of the
neuronal network. In the mouse retina, these 2 pathways regulate
survival, differentiation and cytoskeletal organization of neural
cells (57) and are also
associated with other pathways. The axon guidance factor netrin-4
increases angiogenesis and the neurotrophin brain-derived
neurotrophic factor promotes the maturation of neurons in mammals,
both by increasing activation of MAPK (58,59).
TGF-β signaling pathway regulates several cellular
processes, including proliferation, apoptosis, differentiation and
migration. Studies have demonstrated that this pathway regulates
the survival and growth of neurons and is associated with
angiogenesis in both physiological and pathological conditions in
the mammalian retina (33,60–63).
Focal adhesions serve important roles in biological processes. It
has been reported that focal adhesions are associated with
angiogenesis and neuron growth in humans and mice (64,65).
Researchers have found that focal adhesion-associated proteins and
signaling were necessary for retinal development in Xenopus
and Drosophila (66,67).
The overexpression of focal adhesion kinase, a focal
adhesion-associated protein kinase, contributed to retinal
angiogenesis in oxygen-induced retinopathy mice (68).
PI3K, AKT, PTEN, MAPK1, SOS, S1PR1, BCL2L11,
TGFBR1/2 and ITGA/ITGAB serve essential roles in the enriched
pathways identified in the present study and interact with the
identified DE-miRNAs. PI3K and AKT are key factors in the majority
of the enriched pathways, including PI3K/AKT/mTOR, MAPK, FOXO and
neurotrophin signaling, as well as the focal adhesion pathway.
PTEN, MAPK1 and SOS are important secondary effectors that
participate in a number of signaling pathways (47,69).
A previous study reported that S1PR1 is associated with vascular
growth and development in mouse (70). Furthermore, Chae et al
(71) demonstrated that S1PR1
promoted mouse limb morphogenesis. BCL2L11 acts as an apoptotic
activator (72). S1PR1 and BCL2L11
are both downstream effectors, while TGFBR1/2 and ITGA/ITGB are
upstream regulators that coordinate a series of downstream
effects.
In conclusion, the present study identified several
key DE-miRNAs using a linear model. Furthermore, the target genes
and pathways that were identified may serve crucial roles in mouse
retinal development. Following RT-qPCR validation, eight miRNAs
were identified associated with retinal development. These were:
miR-9-5p, miR-130a-3p, miR-92a-3p, miR-20a-5p, miR-93-5p, miR-9-3p,
miR-709 and miR-124. The results obtained in the present study may
provide the groundwork for further experiments.
Acknowledgements
Not applicable.
Funding
The present study was supported by grants from the
National Natural Science Foundation of China (grant no. 81770971)
and the Natural Science Foundation of Guangdong Province (grant no.
2017A030313787) to YL.
Availability of data and materials
The datasets generated and analyzed during the
current study are available in the GEO repository (https://www.ncbi.nlm.nih.gov/geo/query/acc.cgi?acc=GSE115581).
Authors' contributions
YW performed the bioinformatics analysis and
contributed to writing manuscript. XW, RL and DC performed the
microarray and RT-qPCR experiments. YJ and JP assisted with the
bioinformatics analysis. YL designed the study. All authors read
and approved the final manuscript.
Ethics approval and consent to
participate
The procedures for care and use of animals were
approved by the Ethics Committee of the Sun Yat-Sen University,
Zhongshan Ophthalmic Center (ethical approval no. 2017-069).
Patient consent for publication
Not applicable.
Competing interests
The authors declare that they have no competing
interests.
References
|
1
|
Suárez Y, Fernández-Hernando C, Yu J,
Gerber SA, Harrison KD, Pober JS, Iruela-Arispe ML, Merkenschlager
M and Sessa WC: Dicer-dependent endothelial microRNAs are necessary
for postnatal angiogenesis. Proc Natl Acad Sci USA.
105:14082–14087. 2008. View Article : Google Scholar : PubMed/NCBI
|
|
2
|
Zamore PD and Haley B: Ribo-gnome: The big
world of small RNAs. Science. 309:1519–1524. 2005. View Article : Google Scholar : PubMed/NCBI
|
|
3
|
Leonardo TR, Schultheisz HL, Loring JF and
Laurent LC: The functions of microRNAs in pluripotency and
reprogramming. Nat Cell Biol. 14:1114–1121. 2012. View Article : Google Scholar : PubMed/NCBI
|
|
4
|
de Chevigny A, Coré N, Follert P, Gaudin
M, Barbry P, Béclin C and Cremer H: miR-7a regulation of Pax6
controls spatial origin of forebrain dopaminergic neurons. Nat
Neurosci. 15:1120–1126. 2012. View Article : Google Scholar : PubMed/NCBI
|
|
5
|
Surzenko N, Crowl T, Bachleda A, Langer L
and Pevny L: SOX2 maintains the quiescent progenitor cell state of
postnatal retinal Muller glia. Development. 140:1445–1456. 2013.
View Article : Google Scholar : PubMed/NCBI
|
|
6
|
Damiani D, Alexander JJ, O'Rourke JR,
McManus M, Jadhav AP, Cepko CL, Hauswirth WW, Harfe BD and Strettoi
E: Dicer inactivation leads to progressive functional and
structural degeneration of the mouse retina. J Neurosci.
28:4878–4887. 2008. View Article : Google Scholar : PubMed/NCBI
|
|
7
|
Lin S and Gregory RI: MicroRNA biogenesis
pathways in cancer. Nat Rev Cancer. 15:321–333. 2015. View Article : Google Scholar : PubMed/NCBI
|
|
8
|
Rupaimoole R and Slack FJ: MicroRNA
therapeutics: Towards a new era for the management of cancer and
other diseases. Nat Rev Drug Discov. 16:203–222. 2017. View Article : Google Scholar : PubMed/NCBI
|
|
9
|
Karali M, Peluso I, Marigo V and Banfi S:
Identification and characterization of microRNAs expressed in the
mouse eye. Invest Ophthalmol Vis Sci. 48:509–515. 2007. View Article : Google Scholar : PubMed/NCBI
|
|
10
|
Hackler L Jr, Wan J, Swaroop A, Qian J and
Zack DJ: MicroRNA profile of the developing mouse retina. Invest
Ophthalmol Vis Sci. 51:1823–1831. 2010. View Article : Google Scholar : PubMed/NCBI
|
|
11
|
Stahl A, Connor KM, Sapieha P, Chen J,
Dennison RJ, Krah NM, Seaward MR, Willett KL, Aderman CM, Guerin
KI, et al: The mouse retina as an angiogenesis model. Invest
Ophthalmol Vis Sci. 51:2813–2826. 2010. View Article : Google Scholar : PubMed/NCBI
|
|
12
|
Fan WJ, Li X, Yao HL, Deng JX, Liu HL, Cui
ZJ, Wang Q, Wu P and Deng JB: Neural differentiation and
synaptogenesis in retinal development. Neural Regen Res.
11:312–318. 2016. View Article : Google Scholar : PubMed/NCBI
|
|
13
|
Agarwal V, Bell GW, Nam JW and Bartel DP:
Predicting effective microRNA target sites in mammalian mRNAs.
eLife. 4:42015. View Article : Google Scholar
|
|
14
|
Wong N and Wang X: miRDB: An online
resource for microRNA target prediction and functional annotations.
Nucleic Acids Res. 43:D146–D152. 2015. View Article : Google Scholar : PubMed/NCBI
|
|
15
|
Ashburner M, Ball CA, Blake JA, Botstein
D, Butler H, Cherry JM, Davis AP, Dolinski K, Dwight SS, Eppig JT,
et al The Gene Ontology Consortium, : Gene ontology: Tool for the
unification of biology. Nat Genet. 25:25–29. 2000. View Article : Google Scholar : PubMed/NCBI
|
|
16
|
The Gene Ontology Consortium, . Expansion
of the Gene Ontology knowledgebase and resources. Nucleic Acids
Res. 45:D331–D338. 2017. View Article : Google Scholar : PubMed/NCBI
|
|
17
|
Ogata H, Goto S, Sato K, Fujibuchi W, Bono
H and Kanehisa M: KEGG: Kyoto Encyclopedia of Genes and Genomes.
Nucleic Acids Res. 27:29–34. 1999. View Article : Google Scholar : PubMed/NCBI
|
|
18
|
Huang W, Sherman BT and Lempicki RA:
Bioinformatics enrichment tools: Paths toward the comprehensive
functional analysis of large gene lists. Nucleic Acids Res.
37:1–13. 2009. View Article : Google Scholar : PubMed/NCBI
|
|
19
|
Huang W, Sherman BT and Lempicki RA:
Systematic and integrative analysis of large gene lists using DAVID
bioinformatics resources. Nat Protoc. 4:44–57. 2009. View Article : Google Scholar : PubMed/NCBI
|
|
20
|
Livak KJ and Schmittgen TD: Analysis of
relative gene expression data using real-time quantitative PCR and
the 2(-Delta Delta C(T)) method. Methods. 25:402–408. 2001.
View Article : Google Scholar : PubMed/NCBI
|
|
21
|
Larionov A, Krause A and Miller W: A
standard curve based method for relative real time PCR data
processing. BMC Bioinformatics. 6:622005. View Article : Google Scholar : PubMed/NCBI
|
|
22
|
Aubert M, Chaplain MA, McDougall SR,
Devlin A and Mitchell CA: A continuum mathematical model of the
developing murine retinal vasculature. Bull Math Biol.
73:2430–2451. 2011. View Article : Google Scholar : PubMed/NCBI
|
|
23
|
Xu S, Witmer PD, Lumayag S, Kovacs B and
Valle D: MicroRNA (miRNA) transcriptome of mouse retina and
identification of a sensory organ-specific miRNA cluster. J Biol
Chem. 282:25053–25066. 2007. View Article : Google Scholar : PubMed/NCBI
|
|
24
|
Lavker RM and Ryan DG: MicroRNAs of the
mammalian eye display distinct and overlapping tissue specificity.
Invest Ophthalmol Vis Sci. 47:5410. 2006.
|
|
25
|
Shi Z, Chen Q, Li C, Wang L, Qian X, Jiang
C, Liu X, Wang X, Li H, Kang C, et al: MiR-124 governs glioma
growth and angiogenesis and enhances chemosensitivity by targeting
R-Ras and N-Ras. Neuro Oncol. 16:1341–1353. 2014. View Article : Google Scholar : PubMed/NCBI
|
|
26
|
Silber J, Lim DA, Petritsch C, Persson AI,
Maunakea AK, Yu M, Vandenberg SR, Ginzinger DG, James CD, Costello
JF, et al: miR-124 and miR-137 inhibit proliferation of
glioblastoma multiforme cells and induce differentiation of brain
tumor stem cells. BMC Med. 6:142008. View Article : Google Scholar : PubMed/NCBI
|
|
27
|
He Y, Li HB, Li X, Zhou Y, Xia XB and Song
WT: MiR-124 promotes the growth of retinal ganglion cells derived
from Müller cells. Cell Physiol Biochem. 45:973–983. 2018.
View Article : Google Scholar : PubMed/NCBI
|
|
28
|
Baudet ML, Zivraj KH, Abreu-Goodger C,
Muldal A, Armisen J, Blenkiron C, Goldstein LD, Miska EA and Holt
CE: miR-124 acts through CoREST to control onset of Sema3A
sensitivity in navigating retinal growth cones. Nat Neurosci.
15:29–38. 2011. View Article : Google Scholar : PubMed/NCBI
|
|
29
|
Yoo AS, Sun AX, Li L, Shcheglovitov A,
Portmann T, Li Y, Lee-Messer C, Dolmetsch RE, Tsien RW and Crabtree
GR: MicroRNA-mediated conversion of human fibroblasts to neurons.
Nature. 476:228–231. 2011. View Article : Google Scholar : PubMed/NCBI
|
|
30
|
Kania EE, Carvajal-Moreno J, Hernandez VA,
English A, Papa JL, Shkolnikov N, Ozer HG, Yilmaz AS, Yalowich JC
and Elton TS: hsa-miR-9-3p and hsa-miR-9-5p as post-transcriptional
modulators of DNA topoisomerase IIα in human leukemia K562 cells
with acquired resistance to etoposide. Mol Pharmacol. 97:159–170.
2020. View Article : Google Scholar : PubMed/NCBI
|
|
31
|
Sim SE, Lim CS, Kim JI, Seo D, Chun H, Yu
NK, Lee J, Kang SJ, Ko HG, Choi JH, et al: The brain-enriched
MicroRNA miR-9-3p regulates synaptic plasticity and memory. J
Neurosci. 36:8641–8652. 2016. View Article : Google Scholar : PubMed/NCBI
|
|
32
|
Coolen M, Katz S and Bally-Cuif L: miR-9:
A versatile regulator of neurogenesis. Front Cell Neurosci.
7:2202013. View Article : Google Scholar : PubMed/NCBI
|
|
33
|
Carrella S, Barbato S, D'Agostino Y,
Salierno FG, Manfredi A, Banfi S and Conte I: TGF-β controls
miR-181/ERK regulatory network during retinal axon specification
and growth. PLoS One. 10:e01441292015. View Article : Google Scholar : PubMed/NCBI
|
|
34
|
Karali M, Persico M, Mutarelli M,
Carissimo A, Pizzo M, Singh Marwah V, Ambrosio C, Pinelli M,
Carrella D, Ferrari S, et al: High-resolution analysis of the human
retina miRNome reveals isomiR variations and novel microRNAs.
Nucleic Acids Res. 44:1525–1540. 2016. View Article : Google Scholar : PubMed/NCBI
|
|
35
|
Bonauer A, Carmona G, Iwasaki M, Mione M,
Koyanagi M, Fischer A, Burchfield J, Fox H, Doebele C, Ohtani K, et
al: MicroRNA-92a controls angiogenesis and functional recovery of
ischemic tissues in mice. Science. 324:1710–1713. 2009. View Article : Google Scholar : PubMed/NCBI
|
|
36
|
Pin AL, Houle F, Guillonneau M, Paquet ER,
Simard MJ and Huot J: miR-20a represses endothelial cell migration
by targeting MKK3 and inhibiting p38 MAP kinase activation in
response to VEGF. Angiogenesis. 15:593–608. 2012. View Article : Google Scholar : PubMed/NCBI
|
|
37
|
Fang L, Du WW, Yang W, Rutnam ZJ, Peng C,
Li H, O'Malley YQ, Askeland RW, Sugg S, Liu M, et al: MiR-93
enhances angiogenesis and metastasis by targeting LATS2. Cell
Cycle. 11:4352–4365. 2012. View Article : Google Scholar : PubMed/NCBI
|
|
38
|
Akerblom M, Petri R, Sachdeva R,
Klussendorf T, Mattsson B, Gentner B and Jakobsson J: microRNA-125
distinguishes developmentally generated and adult-born olfactory
bulb interneurons. Development. 141:1580–1588. 2014. View Article : Google Scholar : PubMed/NCBI
|
|
39
|
Boissart C, Nissan X, Giraud-Triboult K,
Peschanski M and Benchoua A: miR-125 potentiates early neural
specification of human embryonic stem cells. Development.
139:1247–1257. 2012. View Article : Google Scholar : PubMed/NCBI
|
|
40
|
Le MT, Xie H, Zhou B, Chia PH, Rizk P, Um
M, Udolph G, Yang H, Lim B and Lodish HF: MicroRNA-125b promotes
neuronal differentiation in human cells by repressing multiple
targets. Mol Cell Biol. 29:5290–5305. 2009. View Article : Google Scholar : PubMed/NCBI
|
|
41
|
La Torre A, Georgi S and Reh TA: Conserved
microRNA pathway regulates developmental timing of retinal
neurogenesis. Proc Natl Acad Sci USA. 110:E2362–E2370. 2013.
View Article : Google Scholar : PubMed/NCBI
|
|
42
|
Decembrini S, Bressan D, Vignali R, Pitto
L, Mariotti S, Rainaldi G, Wang X, Evangelista M, Barsacchi G and
Cremisi F: MicroRNAs couple cell fate and developmental timing in
retina. Proc Natl Acad Sci USA. 106:21179–21184. 2009. View Article : Google Scholar : PubMed/NCBI
|
|
43
|
Soufi-Zomorrod M, Hajifathali A, Kouhkan
F, Mehdizadeh M, Rad SM and Soleimani M: MicroRNAs modulating
angiogenesis: miR-129-1 and miR-133 act as angio-miR in HUVECs.
Tumour Biol. 37:9527–9534. 2016. View Article : Google Scholar : PubMed/NCBI
|
|
44
|
Zhang Y, Chen M, Qiu Z, Hu K, McGee W,
Chen X, Liu J, Zhu L and Wu JY: MiR-130a regulates neurite
outgrowth and dendritic spine density by targeting MeCP2. Protein
Cell. 7:489–500. 2016. View Article : Google Scholar : PubMed/NCBI
|
|
45
|
Lee DY, Deng Z, Wang CH and Yang BB:
MicroRNA-378 promotes cell survival, tumor growth, and angiogenesis
by targeting SuFu and Fus-1 expression. Proc Natl Acad Sci USA.
104:20350–20355. 2007. View Article : Google Scholar : PubMed/NCBI
|
|
46
|
Chan JK, Kiet TK, Blansit K, Ramasubbaiah
R, Hilton JF, Kapp DS and Matei D: MiR-378 as a biomarker for
response to anti-angiogenic treatment in ovarian cancer. Gynecol
Oncol. 133:568–574. 2014. View Article : Google Scholar : PubMed/NCBI
|
|
47
|
Rafalski VA and Brunet A: Energy
metabolism in adult neural stem cell fate. Prog Neurobiol.
93:182–203. 2011. View Article : Google Scholar : PubMed/NCBI
|
|
48
|
Zhang X, He X, Li Q, Kong X, Ou Z, Zhang
L, Gong Z, Long D, Li J, Zhang M, et al: PI3K/AKT/mTOR signaling
mediates valproic acid-induced neuronal differentiation of neural
stem cells through epigenetic modifications. Stem Cell Reports.
8:1256–1269. 2017. View Article : Google Scholar : PubMed/NCBI
|
|
49
|
Adams HH, Hibar DP, Chouraki V, Stein JL,
Nyquist PA, Rentería ME, Trompet S, Arias-Vasquez A, Seshadri S,
Desrivières S, et al: Novel genetic loci underlying human
intracranial volume identified through genome-wide association. Nat
Neurosci. 19:1569–1582. 2016. View Article : Google Scholar : PubMed/NCBI
|
|
50
|
Peltier J, O'Neill A and Schaffer DV:
PI3K/Akt and CREB regulate adult neural hippocampal progenitor
proliferation and differentiation. Dev Neurobiol. 67:1348–1361.
2007. View Article : Google Scholar : PubMed/NCBI
|
|
51
|
Hevner RF: Brain overgrowth in disorders
of RTK-PI3K-AKT signaling: A mosaic of malformations. Semin
Perinatol. 39:36–43. 2015. View Article : Google Scholar : PubMed/NCBI
|
|
52
|
Zhang W and Liu HT: MAPK signal pathways
in the regulation of cell proliferation in mammalian cells. Cell
Res. 12:9–18. 2002. View Article : Google Scholar : PubMed/NCBI
|
|
53
|
Nakazawa T, Tamai M and Mori N:
Brain-derived neurotrophic factor prevents axotomized retinal
ganglion cell death through MAPK and PI3K signaling pathways.
Invest Ophthalmol Vis Sci. 43:3319–3326. 2002.PubMed/NCBI
|
|
54
|
Galy A, Néron B, Planque N, Saule S and
Eychène A: Activated MAPK/ERK kinase (MEK-1) induces
transdifferentiation of pigmented epithelium into neural retina.
Dev Biol. 248:251–264. 2002. View Article : Google Scholar : PubMed/NCBI
|
|
55
|
Lin SJ, Chiang MC, Shih HY, Chiang KC and
Cheng YC: Spatiotemporal expression of foxo4, foxo6a, and foxo6b in
the developing brain and retina are transcriptionally regulated by
PI3K signaling in zebrafish. Dev Genes Evol. 227:219–230. 2017.
View Article : Google Scholar : PubMed/NCBI
|
|
56
|
Wilhelm K, Happel K, Eelen G, Schoors S,
Oellerich MF, Lim R, Zimmermann B, Aspalter IM, Franco CA, Boettger
T, et al: FOXO1 couples metabolic activity and growth state in the
vascular endothelium. Nature. 529:216–220. 2016. View Article : Google Scholar : PubMed/NCBI
|
|
57
|
Llamosas MM, Cernuda-Cernuda R, Huerta JJ,
Vega JA and García-Fernández JM: Neurotrophin receptors expression
in the developing mouse retina: An immunohistochemical study. Anat
Embryol (Berl). 195:337–344. 1997. View Article : Google Scholar : PubMed/NCBI
|
|
58
|
Lange J, Yafai Y, Noack A, Yang XM, Munk
AB, Krohn S, Iandiev I, Wiedemann P, Reichenbach A and Eichler W:
The axon guidance molecule Netrin-4 is expressed by Müller cells
and contributes to angiogenesis in the retina. Glia. 60:1567–1578.
2012. View Article : Google Scholar : PubMed/NCBI
|
|
59
|
Rohrer B, Korenbrot JI, LaVail MM,
Reichardt LF and Xu B: Role of neurotrophin receptor TrkB in the
maturation of rod photoreceptors and establishment of synaptic
transmission to the inner retina. J Neurosci. 19:8919–8930. 1999.
View Article : Google Scholar : PubMed/NCBI
|
|
60
|
Wang X, Abraham S, McKenzie JAG, Jeffs N,
Swire M, Tripathi VB, Luhmann UF, Lange CAK, Zhai Z, Arthur HM, et
al: LRG1 promotes angiogenesis by modulating endothelial TGF-β
signalling. Nature. 499:306–311. 2013. View Article : Google Scholar : PubMed/NCBI
|
|
61
|
Zhao M, Hu Y, Jin J, Yu Y, Zhang S, Cao J,
Zhai Y, Wei R, Shou J, Cai W, et al: Interleukin 37 promotes
angiogenesis through TGF-β signaling. Sci Rep. 7:61132017.
View Article : Google Scholar : PubMed/NCBI
|
|
62
|
Bialas AR and Stevens B: TGF-β signaling
regulates neuronal C1q expression and developmental synaptic
refinement. Nat Neurosci. 16:1773–1782. 2013. View Article : Google Scholar : PubMed/NCBI
|
|
63
|
Braunger BM, Pielmeier S, Demmer C,
Landstorfer V, Kawall D, Abramov N, Leibinger M, Kleiter I, Fischer
D, Jägle H, et al: TGF-β signaling protects retinal neurons from
programmed cell death during the development of the mammalian eye.
J Neurosci. 33:14246–14258. 2013. View Article : Google Scholar : PubMed/NCBI
|
|
64
|
Chacón MR, Navarro AI, Cuesto G, del Pino
I, Scott R, Morales M and Rico B: Focal adhesion kinase regulates
actin nucleation and neuronal filopodia formation during axonal
growth. Development. 139:3200–3210. 2012. View Article : Google Scholar : PubMed/NCBI
|
|
65
|
Zhao X and Guan JL: Focal adhesion kinase
and its signaling pathways in cell migration and angiogenesis. Adv
Drug Deliv Rev. 63:610–615. 2011. View Article : Google Scholar : PubMed/NCBI
|
|
66
|
Li M and Sakaguchi DS: Expression patterns
of focal adhesion associated proteins in the developing retina. Dev
Dyn. 225:544–553. 2002. View Article : Google Scholar : PubMed/NCBI
|
|
67
|
Xie X, Gilbert M, Petley-Ragan L and Auld
VJ: Loss of focal adhesions in glia disrupts both glial and
photoreceptor axon migration in the Drosophila visual
system. Development. 141:3072–3083. 2014. View Article : Google Scholar : PubMed/NCBI
|
|
68
|
Kornberg LJ, Shaw LC, Spoerri PE,
Caballero S and Grant MB: Focal adhesion kinase overexpression
induces enhanced pathological retinal angiogenesis. Invest
Ophthalmol Vis Sci. 45:4463–4469. 2004. View Article : Google Scholar : PubMed/NCBI
|
|
69
|
Margolis B and Skolnik EY: Activation of
Ras by receptor tyrosine kinases. J Am Soc Nephrol. 5:1288–1299.
1994.PubMed/NCBI
|
|
70
|
Lee MJ, Thangada S, Claffey KP, Ancellin
N, Liu CH, Kluk M, Volpi M, Sha'afi RI and Hla T: Vascular
endothelial cell adherens junction assembly and morphogenesis
induced by sphingosine-1-phosphate. Cell. 99:301–312. 1999.
View Article : Google Scholar : PubMed/NCBI
|
|
71
|
Chae SS, Paik JH, Allende ML, Proia RL and
Hla T: Regulation of limb development by the sphingosine
1-phosphate receptor S1p1/EDG-1 occurs via the hypoxia/VEGF axis.
Dev Biol. 268:441–447. 2004. View Article : Google Scholar : PubMed/NCBI
|
|
72
|
O'Connor L, Strasser A, O'Reilly LA,
Hausmann G, Adams JM, Cory S and Huang DC: Bim: A novel member of
the Bcl-2 family that promotes apoptosis. EMBO J. 17:384–395. 1998.
View Article : Google Scholar : PubMed/NCBI
|