Introduction
As the most well-known form of neurodegenerative
diseases, Alzheimer's disease (AD) destroys neurons and disrupts
transmission of signals which are required for memories to form and
be processed; there are currently 50 million patients who suffer
from dementia worldwide (1,2).
Although there are numerous studies (3–6) on
peripheral biomarkers for AD, suitable peripheral markers present
in the blood have not been identified (7).
Exosomes are a type of extracellular vesicle with a
diameter of 30–150 nm, which contain several nucleic acids and
proteins and are released by almost all types of cells (8). The substances present in exosomes are
not easily digested by enzymes as they are protected by lipid
membrane bilayers (9,10). Due to their small size, exosomes
can pass through the blood-brain barrier (BBB) freely (11–13).
Exosomes can be used as biomarkers for several neurodegenerative
diseases, including Parkinson's disease and prion diseases
(14–16). Exosomes have been shown to contain
full-length amyloid precursor protein, β-secretase, γ-secretase and
amyloid (A)β, which are involved in the pathological process of
development of AD (17).
Long noncoding RNAs (lncRNAs) are abundantly
expressed in the brain and exhibit tissue specificity (18). Expression of β-site amyloid
precursor protein cleaving enzyme-1-antisense transcript (BACE1-AS)
is upregulated in the brains of patient with AD (18–20).
Post-mortem studies have demonstrated that high levels and
upregulation of brain cytoplasmic 200 RNA (BC200) and 51A in
patients with AD were specific to the brain regions associated with
AD (18–22).
The atrophy detected by structural magnetic
resonance imaging (sMRI) involving the medial temporal lobes,
including hippocampus, entorhinal cortex, parahippocampal gyrus and
subiculum and amygdala, has been used as a criterion to support a
diagnosis of AD. The sensitivities are 70–92% and specificities are
80–95% in diagnosing AD using sMRI analysis (23–30).
Based on previous research (16,18,19),
it was hypothesized that plasma exosomal lncRNA may be used as a
biomarker of AD. As such, the relative expression levels of several
lncRNAs from plasma exosomes that are associated with AD were
assessed, with the aim of the identifying promising peripheral
blood biomarkers for AD. Additionally, the volume of the
hippocampus and four parameters of entorhinal cortex were measured
using sMRI; entorhinal cortex volume, mean thickness, surface area
and mean curvature, and combined with exosomal lncRNAs to improve
the sensitivity and specificity of AD prediction.
Materials and methods
Participants
A total of 134 Chinese Han participants (72 patients
with AD and 62 controls) were recruited from the Second Hospital of
Shandong University, Shandong, China between May 2017 and July
2019. The patient's age range was 53 to 86 years, and the ratio of
male to female patients was 0.89:1. All subjects received a cranial
MRI and/or CT scan in order to assess the degree of brain atrophy
and to exclude patients with other diseases which may cause
cognitive impairment, including acute cerebrovascular disease,
hydrocephalus and brain tumors. No cerebrospinal fluid (CSF)
samples were tested.
All participants underwent neuropsychological tests
including the Montreal Cognitive Assessment Beijing Version
(31,32), the Chinese version of the Mini
Mental State Examination (MMSE) (33), the Clinical Dementia Rating (CDR)
scale (34), the Activities of
Daily Living scale (35), and the
Hamilton Depression (HAMD) scale (36). Probable AD dementia was diagnosed
according to the National Institute on Aging and the Alzheimer's
Association criteria (2011) (23).
Participants were excluded from the study if they had: i) A history
of stroke; ii) psychosis; iii) severe depression (HAMD score ≥24
points); iv) other nervous system diseases, such as Lewy body
dementia, Parkinson's disease, encephalitis, brain tumors and
traumatic brain injury; or v) some systemic diseases, such as
thyroid dysfunction, severe anemia, syphilis or HIV infection
(37).
The present study was performed in accordance with
the recommendations of the Medical Research Ethics Committee of the
Second Hospital of Shandong University. Written informed consent
was obtained from all controls and guardians of patients with
AD.
Plasma collection and exosome
isolation
A total of 5 ml whole blood samples were collected
from all participants in EDTA tubes and were centrifuged at 3,000 ×
g at 4°C for 15 min to obtain the platelet-free plasma, which was
subsequently aliquoted and stored at −80°C. Exosomes were isolated
from the plasma using the ExoQuick Plasma prep and Exosome
Precipitation kit (EXOQ5TM-1; System Biosciences, LLC). The primary
experimental steps were: 0.5 ml plasma was added to 4 µl thrombin
(611 U/ml) and incubated at room temperature for 5 min with
agitation, then subsequently centrifuged at 14,000 × g for 5 min at
4°C. The serum-like supernatant was collected and further
centrifuged at 3,000 × g for 15 min at 4°C to remove cells and
debris and then the appropriate volume of ExoQuick Exosome
Precipitation Solution was added according to the manufacturer's
protocol. After refrigerating the mixture overnight at 4°C, samples
were centrifuged at 1,500 × g for 30 min at 4°C. The pellets were
resuspended in PBS and stored at −80°C (38).
Western blot analysis
Western blotting was performed to identify the
marker proteins of exosomes. Exosome pellets were cleaved using
radioimmunoprecipitation assay lysis buffer (Beyotime Institute of
Technology) at 4°C, and protein concentration was determined using
a bicinchoninic acid protein assay kit (cat. no. P0012, Beyotime
Institute of Technology). Equal quantities of protein (20 µg) were
loaded onto a 10% SDS-gel and resolved using SDS-PAGE.
Subsequently, the resolved proteins were transferred to PVDF
membranes (EMD Millipore) and incubated overnight at 4°C with
either apoptosis-linked gene 2-interacting protein X (ALIX;
1:5,000, cat. no. ab186429, Abcam) or cluster of differentiation
(CD)63 (1:2,000, cat. no. ab217345, Abcam) antibodies. The
membranes were incubated for 1 h at room temperature with the goat
anti-rabbit IgG/horseradish peroxidase (1:5,000, cat. no. ab6721,
Abcam). Signals were visualized using chemiluminescence reagent
(EMD Millipore) and densitometry analysis was performed using
ImageJ version 1.46 (National Institutes of Health) (39).
Transmission electron microscopy
(TEM)
The fresh exosomes were resuspended in PBS. After
placing on copper grids coated with a layer of formvar/carbon, the
specimens were fixed with 3% glutaraldehyde for 5 min at room
temperature. Subsequently, they were stained negatively with 1%
uranyl acetate for 10 min at room temperature. Finally, the
exosomes were observed using a JEOL 1200EX electron microscope at
×10,000 magnification (JEOL, Ltd.) at 80 kV as described previously
(40).
Nanoparticle analysis
Nanoparticle tracking analysis (NTA) was performed
using Nanoparticle Tracking Analysis (ZetaView; Particle Metrix) to
measure the size distribution of particles. Samples were diluted in
PBS at a ratio of 1:6,000 to achieve a particle count of
1×10⁸ particles per ml, the desired concentration. Then,
3 cycles were performed by scanning 11 cell positions for every
measurement and capturing 60 frames per position. All pictures were
processed and analyzed using the built-in ZetaView Software
(41).
Reverse transcription-quantitative
polymerase chain reaction (RT-qPCR)
Previous studies have demonstrated that expression
levels of lncRNA BACE1-AS, 51A, BC200 and BACE1 mRNA are
upregulated in the brains of patients with AD and may be detected
in the peripheral blood (18,19,22).
To expand on these studies, the expression levels of these RNAs in
peripheral blood exosomes were examined. Of the 134 recruited
participants, the expression levels of BACE1-AS were assessed in
all subjects, but the expression of BACE1 mRNA, BC200 and 51A were
detected in only 123 subjects due to the limitation of blood
specimens.
Total RNA was extracted from the plasma exosomes
using RNAiso Plus (Takara Bio, Inc.). The RNA was reverse
transcribed using PrimeScript™RT reagent kit (Takara Bio, Inc.) in
a total volume of 20 µl with the following conditions: 15 min at
37°C, and 5 sec at 85°C. The expression of RNA was detected using
quantitative PCR using TB Green Premix Ex Taq (Takara Bio, Inc) on
a Bio-Rad CFX 96 Real-Time system (Bio-Rad Laboratories, Inc.). All
reactions were performed in triplicate. The thermocycling
conditions were: 95°C for 10 min; followed by 40 cycles of 95°C for
15 sec and 60°C for 60 sec. GAPDH was used as the internal control.
The expression of RNA was calculated using the 2−ΔΔCq
method (42). The primer sequences
are presented in Table I.
 | Table I.Primer sequence for reverse
transcription-quantitative PCR. |
Table I.
Primer sequence for reverse
transcription-quantitative PCR.
| Gene | Primer sequences
(5′→3′) |
|---|
|
BACE1-AS | F:
CTTGGGCAAACGAAGGTTGG |
|
| R:
CCCAGAGCCCAGCATCAAAA |
| 51A | F:
TGGGAGAGTCAGCATCTTGAAG |
|
| R:
ACCCTCTCAGTCGTAGAACTTC |
| BC200 | F:
CTGGGCAATATAGCGAGAC |
|
| R:
TGCTTTGAGGGAAGTTACG |
| BACE1
mRNA | F:
CACTCTGTTCTGGGTGGTCC |
|
| R:
CATGGGGGATGCTTACCAGG |
| GAPDH | F:
ACTTTGGTATCGTGGAAGGACTCAT |
|
| R:
GTTTTTCTAGACGGCAGGTCAGG |
Acquisition of brain images
Of all the participants, there were 22 patients with
AD and 26 controls who received brain MRI scans that met the
analysis criteria. The 3.0T magnetic resonance (Discovery MR750W;
GE Healthcare) was used for image acquisition. T1-weighted MRI
scans were acquired using a 3D-BRAin VOlume (BRAVO) sequence with
the following parameters: Repetition time (TR)=8.2 msec, echo time
(TE)=.2 msec, flip angle=12°, inversion time (TI)=450 msec,
matrix=256 × 256, slices=140, and slice thickness=1.0 mm (43).
Image processing
In order to extract effective analytical features
from MR brain T1 structure images, a collaborating company (QED
Technique Co., Ltd.) developed a set of automated analysis tools
for brain structure for the present study. Hybrid processing
algorithms which assisted in the complete removal of non-brain
tissue, subcortical volume segmentation and cortical reconstruction
without human intervention were used. The specific steps were: i)
Tissue segmentation; all MR brain T1 images were registered to a
standard ICBM-152 template which then calculated the maximum
probabilities and corrected intensity non-uniformities, created an
effective brain mask (GM, WM, CSF), and completed tissue
segmentation associated with AD, including caudate, putamen,
hippocampus, amygdala, ventricles and other regions; ii) cortical
morphometric analyses; all T1 spatially normalized images were
registered nonlinearly to a surface unbiased group template using
surface-based with a spherical warping algorithm. Subsequently,
cortical surfaces between WM-GM and GM-CSF were estimated, and then
cortical thickness was calculated between these surfaces
(WM-GM/GM-CSF). In previous studies, convex (gyri) and concave
(sulci) surfaces had different anatomical and connective
characteristics; therefore, these units were also analyzed
separately to calculate local curvature and surface area. These
features were used to distinguish between patients with AD and
control subjects (44,45).
Statistical analysis
Statistical analysis was performed using SPSS
Statistics version 24.0 (IBM Corp.) and GraphPad Prism Version 5.0
(GraphPad Software, Inc.). A Kolmogorov-Smirnov or Shapiro-Wilk
test was used to check the Gaussian distribution. Gaussian
distributed numerical data are presented as the mean ± standard
deviation and skewed distribution variables are expressed as the
median and interquartile range. Categorical variable data are
expressed as a frequency and percentage. The correlation between
lncRNA and clinical features was analyzed using a Spearman's rank
or Pearson correlation tests. Logistic regression was used to
compute probabilities, the corresponding 95% confidence interval
(CI) and the odds ratio. Quantitative values were compared using a
Mann-Whitney U test or Student's t-test. A χ2 test was
used to assess differences in categorical data. Receiver operating
characteristic (ROC) curves and the areas under curve (AUC) were
used to assess the sensitivity and specificity of the predictive
ability of using plasma exosomal lncRNAs and MRI measurement
parameters as biomarkers for AD. Multi-index combined detection for
diagnosis was based on series-parallel test and logistic regression
model. P<0.05 was considered to indicate a statistically
significant difference.
Results
Demographics and clinical
features
A total of 72 patients with AD and 62 control
subjects were recruited in the present study. The two groups were
matched based on sex, age and education level. As shown in Table II, the MMSE scores of patients
with AD was significantly lower compared with the controls
(P<0.001). According to the CDR score, there were 9 mild, 36
moderate and 27 severe AD patients. In order to examine potential
biomarkers, other clinical characteristics were analyzed, including
blood pressure, blood lipid, blood glucose, hemoglobin (Hb),
thyroid hormone levels, heart disease, history of anesthesia, and
smoking and drinking status. Results demonstrated a significant
decrease in triglyceride (TG), total cholesterol (TC), high-density
lipoprotein cholesterol (HDL-C) levels, in patients with AD, and in
Hb levels in male patients with AD (P<0.05), and none of the
other assessed characteristics were significantly different
(P>0.05).
| Table II.Demographics and clinical
characteristics of all participants. |
Table II.
Demographics and clinical
characteristics of all participants.
|
Characteristics | All (n=134) | AD (n=72) | Control (n=62) | P-value |
|---|
| Age, years | 72.9±8.0 | 73.7±7.7 | 71.8±8.1 | 0.172a |
| Sex,
female/male | 77/57 | 38/34 | 39/23 | 0.241b |
| Education,
years | 5.0 (3.8–3.0) | 5.0 (4.8–3.0) | 6.0 (3.0–3.5) | 0.940c |
| MMSE | 16.5±8.2 | 13.7±6.7 | 27.2±2.1 |
<0.001a |
| CDR | 0/1/2/3
(62/9/36/27) | 1/2/3
(9/36/27) | 0 (62) | – |
| Onset time,
years | – | 3 (2–6.8) | – | – |
| Hypertension | 97 (72.4%) | 51 (70.8%) | 46 (74.2%) | 0.673b |
| FPG, mmol/l | 5.2 (4.7–3.2) | 5.3 (4.6–3.7) | 5.1 (4.8–3.7) | 0.564c |
| HbA1c, % | 6.76±1.86 | 7.09±2.1 | 6.3±1.38 | 0.132a |
| Blood lipid level,
mmol/l |
|
|
|
|
| TG | 0.99
(0.78–3.40) | 0.91
(0.71–3.21) | 1.12
(0.87–3.58) | 0.009c |
| TC | 4.48±1.13 | 4.14±0.99 | 4.89±1.16 | 0.001a |
| LDL-C | 2.44±0.79 | 2.33±0.74 | 2.58±0.83 | 0.125a |
| HDL-C | 1.38±0.45 | 1.28±0.42 | 1.50±0.45 | 0.016a |
| HCY, µmol/l | 20.9±7.2 | 21.0±7.9 | 20.6±4.35 | 0.852a |
| Hb (female),
g/l | 120.6±14.1 | 117.9±15.5 | 124.1±11.6 | 0.194a |
| Hb (male), g/l | 135.2±16.3 | 130.9±17.5 | 142.4±11.2 | 0.032a |
| Abnormal thyroid
hormone levels | 45 (33.6%) | 29 (40.2%) | 16 (26.0%) | 0.274b |
| Heart disease | 62 (46.3%) | 41 (57%) | 21 (33.9%) | 0.091b |
| Smoking status | 45 (33.6%) | 22 (30.5%) | 23 (37%) | 0.643b |
| Drinking
status | 39 (29.1%) | 19 (26.4%) | 20 (32.3%) | 0.672b |
| History of
anesthesia | 50 (37.3%) | 28 (38.9%) | 22 (35.5%) | 0.791b |
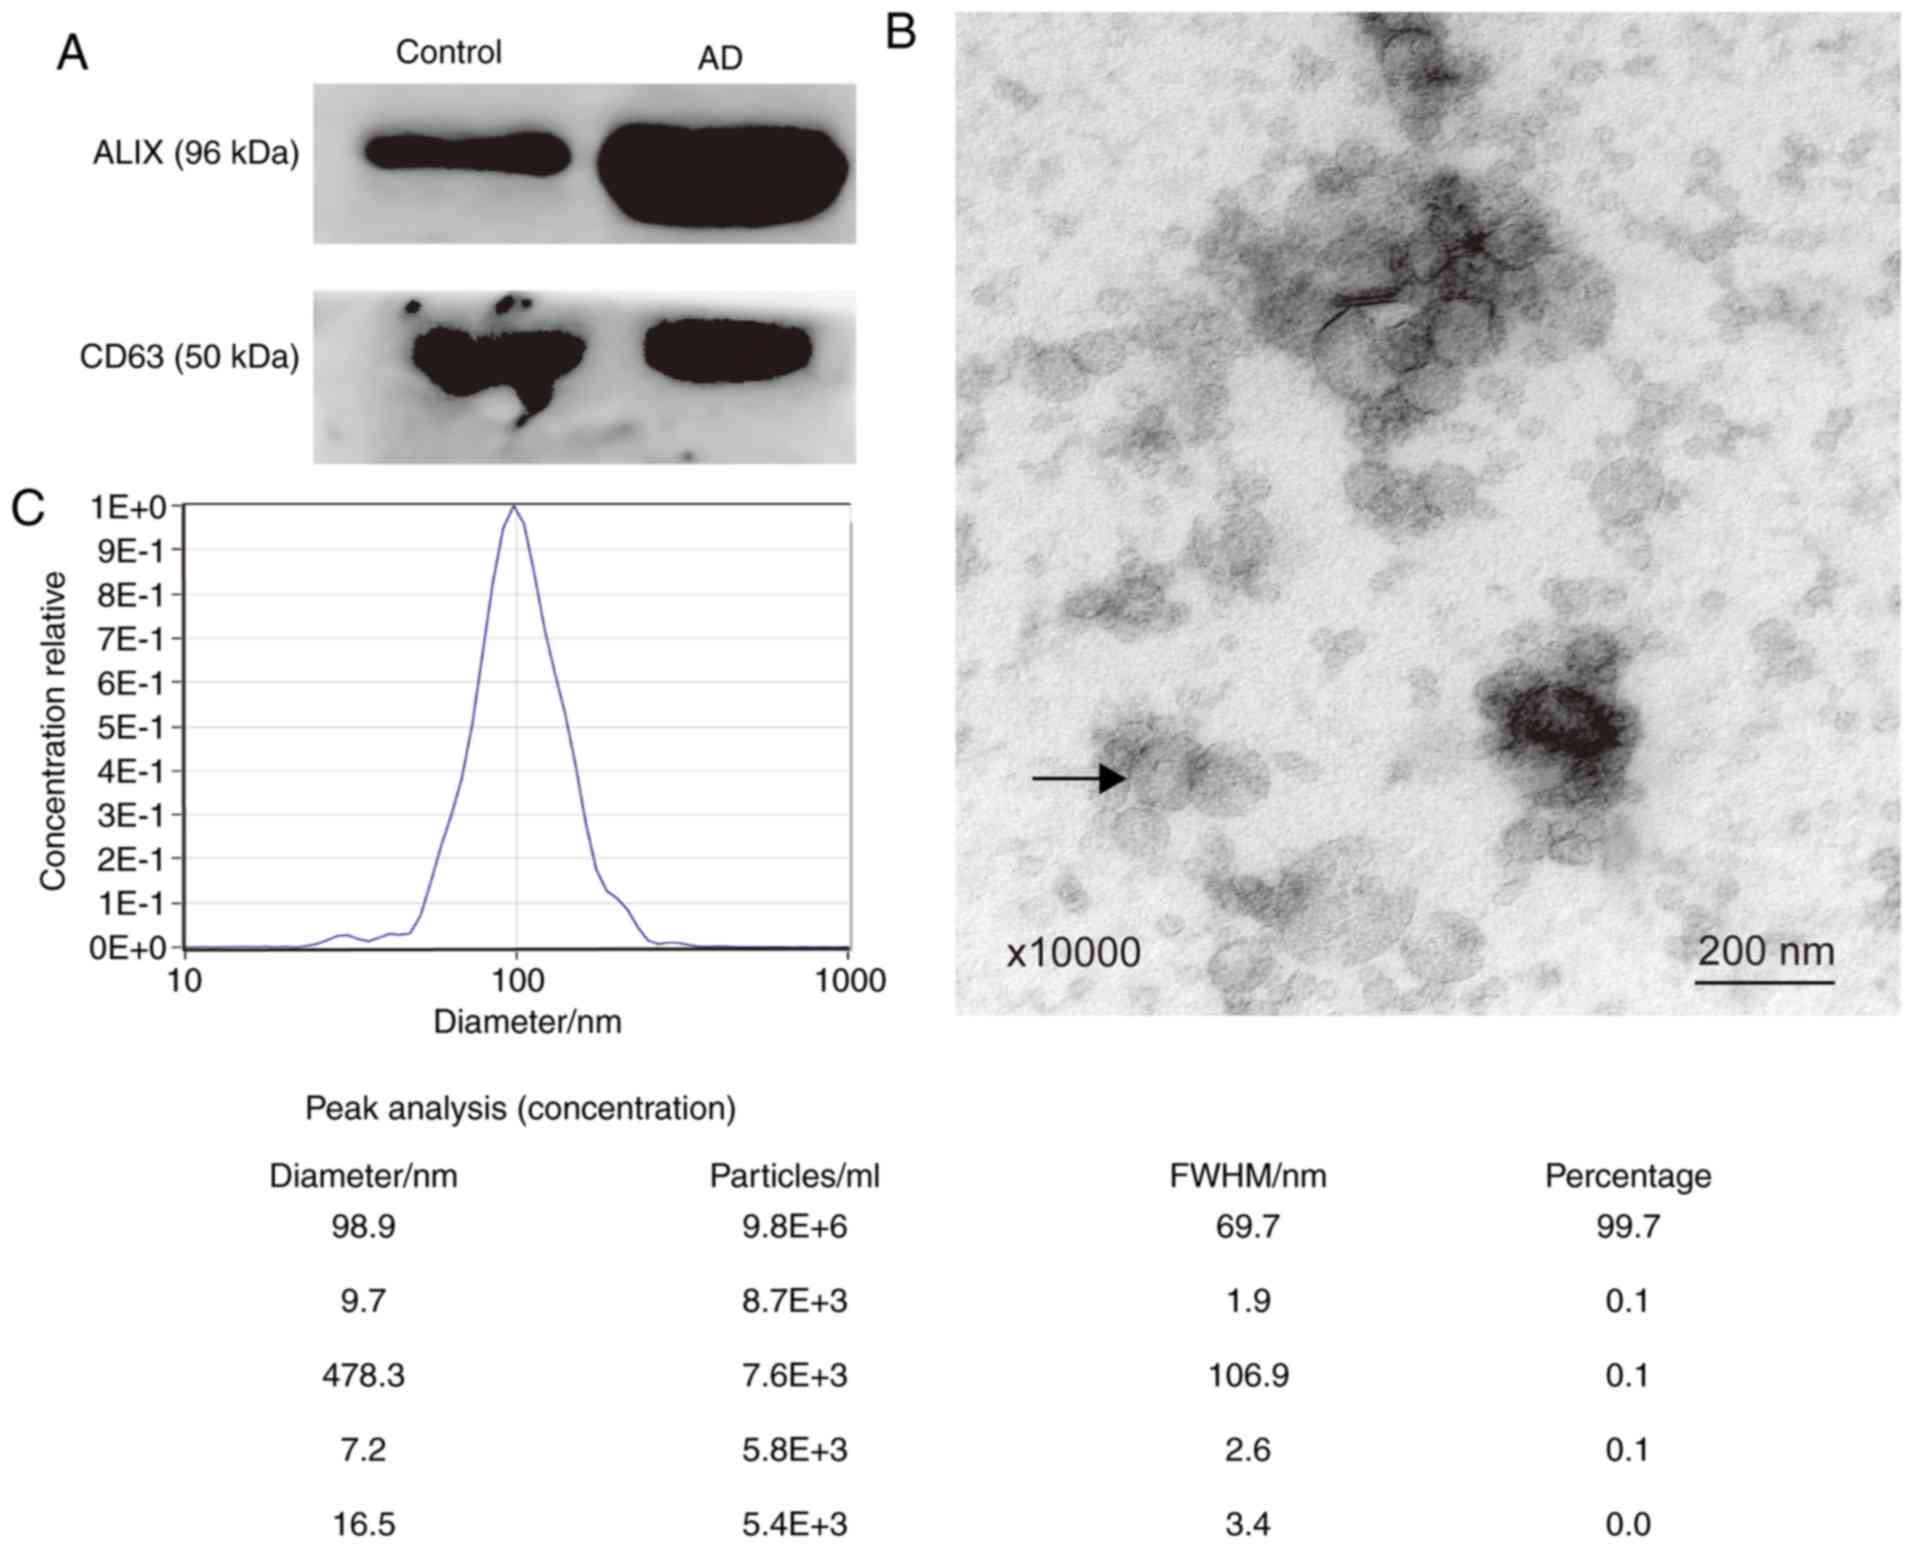
Identification and characterization of
plasma exosomes
The exosome marker proteins, ALIX and CD63, were
detected using western blotting (Fig.
1A). To further confirm that the sediment extracted from plasma
was exosomes, TEM and NTA analyses were performed. Using electron
microscopy, it was shown that the vesicles were spherical and had a
diameter ranging between 30–150 nm. The arrow in Fig. 1B indicates a vesicle that was ~100
nm in diameter. The particle diameters ranged between 16.5 and
478.3 nm. The majority of the diameters were 98.9 nm, accounting
for 99.7% of all particles (Fig.
1C). Therefore, the extracellular vesicles extracted matched
the characteristics of exosomes (10).
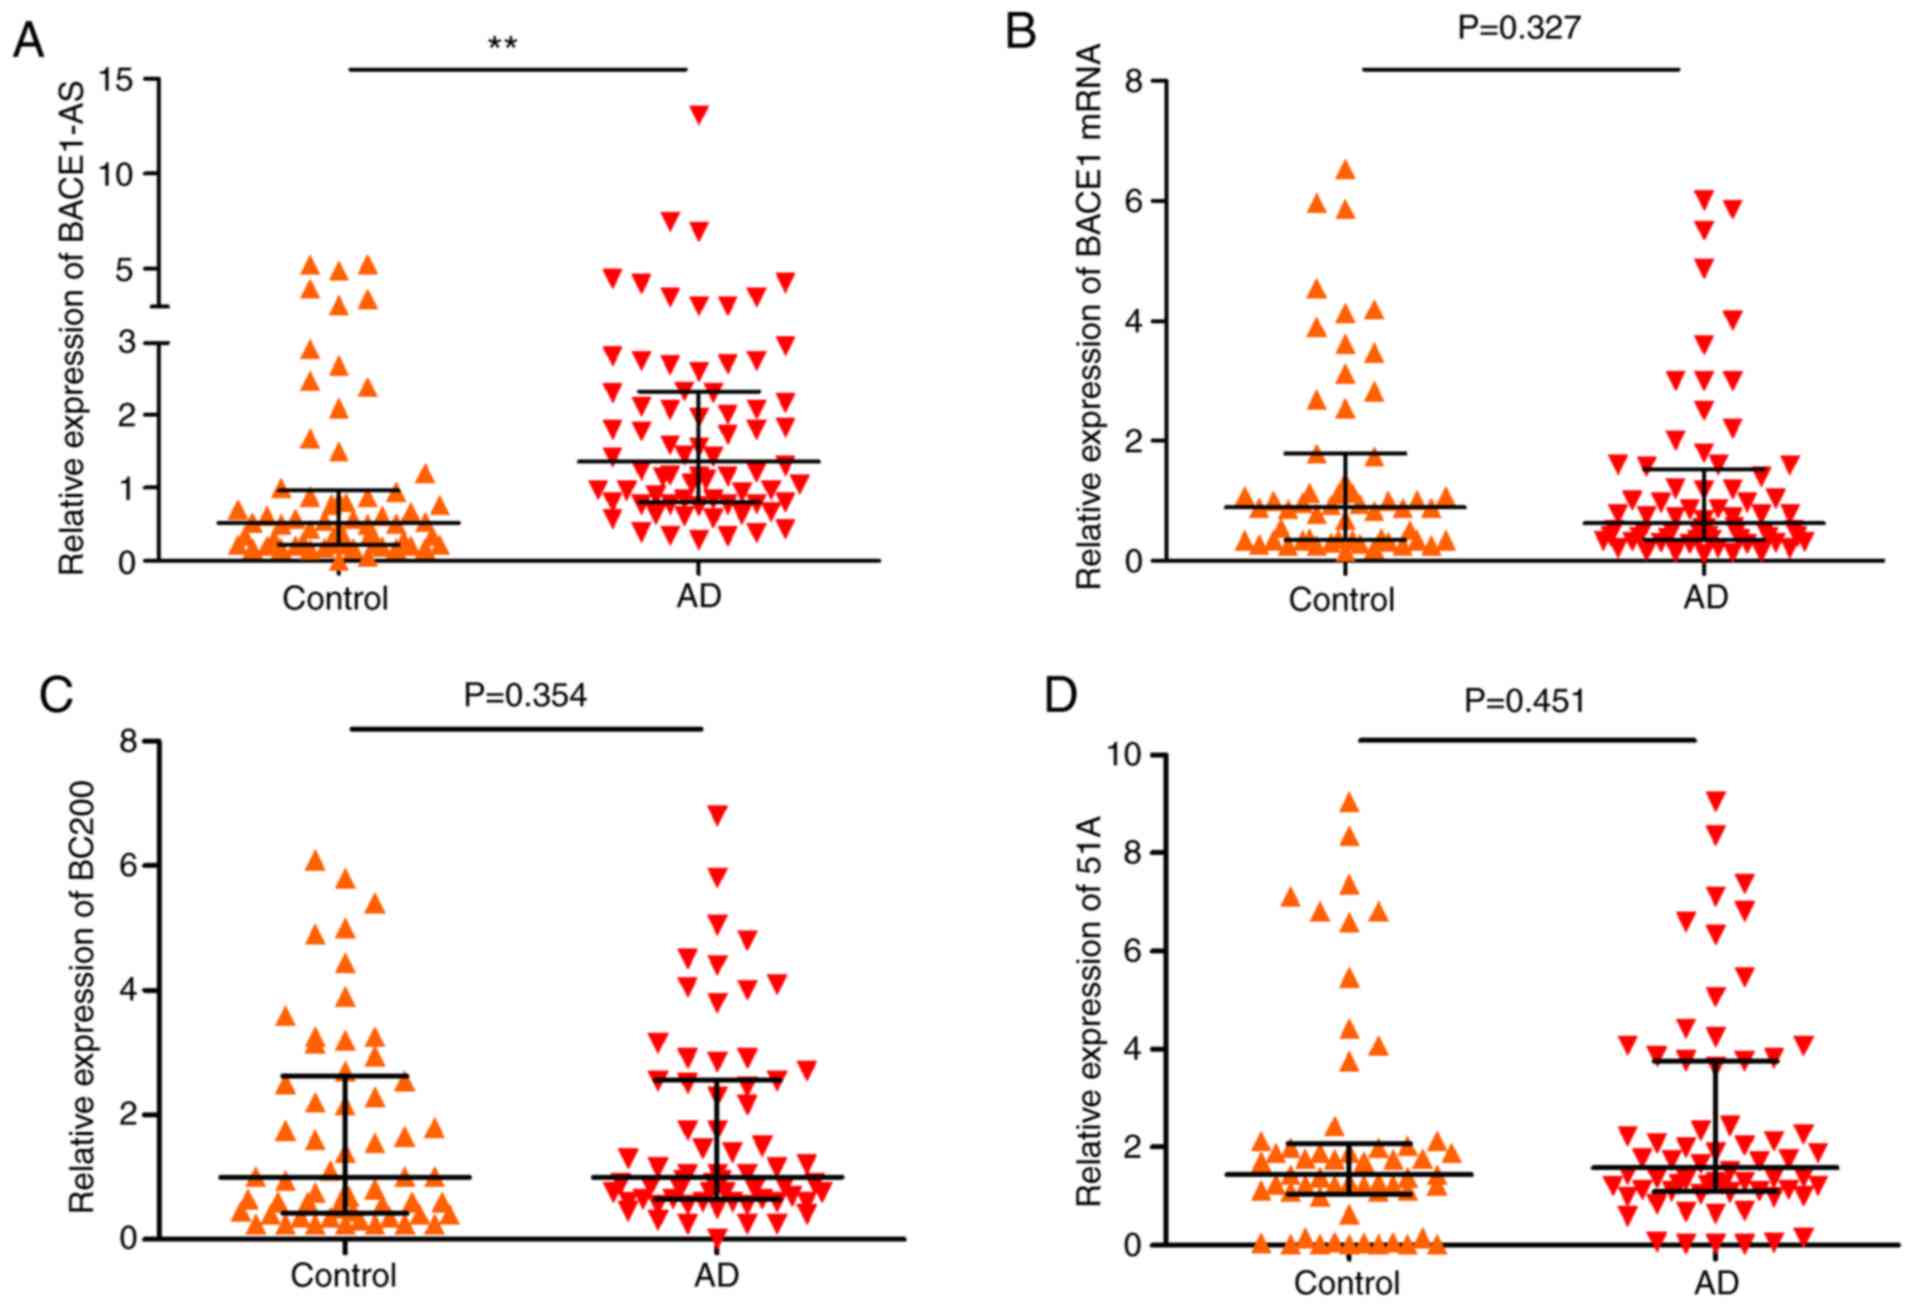
Detection of plasma exosomal
lncRNA
The relative expression of lncRNA BACE1-AS, 51A,
BC200 and BACE1 mRNA was determined (Table III). As shown in Fig. 2, BACE1-AS levels in patients with
AD were significantly higher compared with the controls (Fig. 2A; P<0.005). There were no
significant differences in the expression levels of BACE1 mRNA
(Control, 55; AD, 68; Fig. 2B;
P=0.327), BC200 (Control, 57; AD, 66; Fig. 2C; P=0.354) and 51A (Control, 57;
AD, 66; Fig. 2D; P=0.451) between
the two groups.
| Table III.Comparison of plasma RNA expression
levels between AD and controls. |
Table III.
Comparison of plasma RNA expression
levels between AD and controls.
| RNA | AD | Control | P-value |
|---|
| BACE1-AS | 1.36
(0.80–3.33) | 0.52
(0.22–3.96) | <0.005 |
| BACE1 mRNA | 0.62
(0.35–3.53) | 0.89
(0.34–3.79) | 0.327 |
| BC200 | 1.00
(0.64–3.55) | 1.00
(0.43–3.62) | 0.354 |
| 51A | 1.58
(1.09–3.75) | 1.44
(1.05–3.08) | 0.451 |
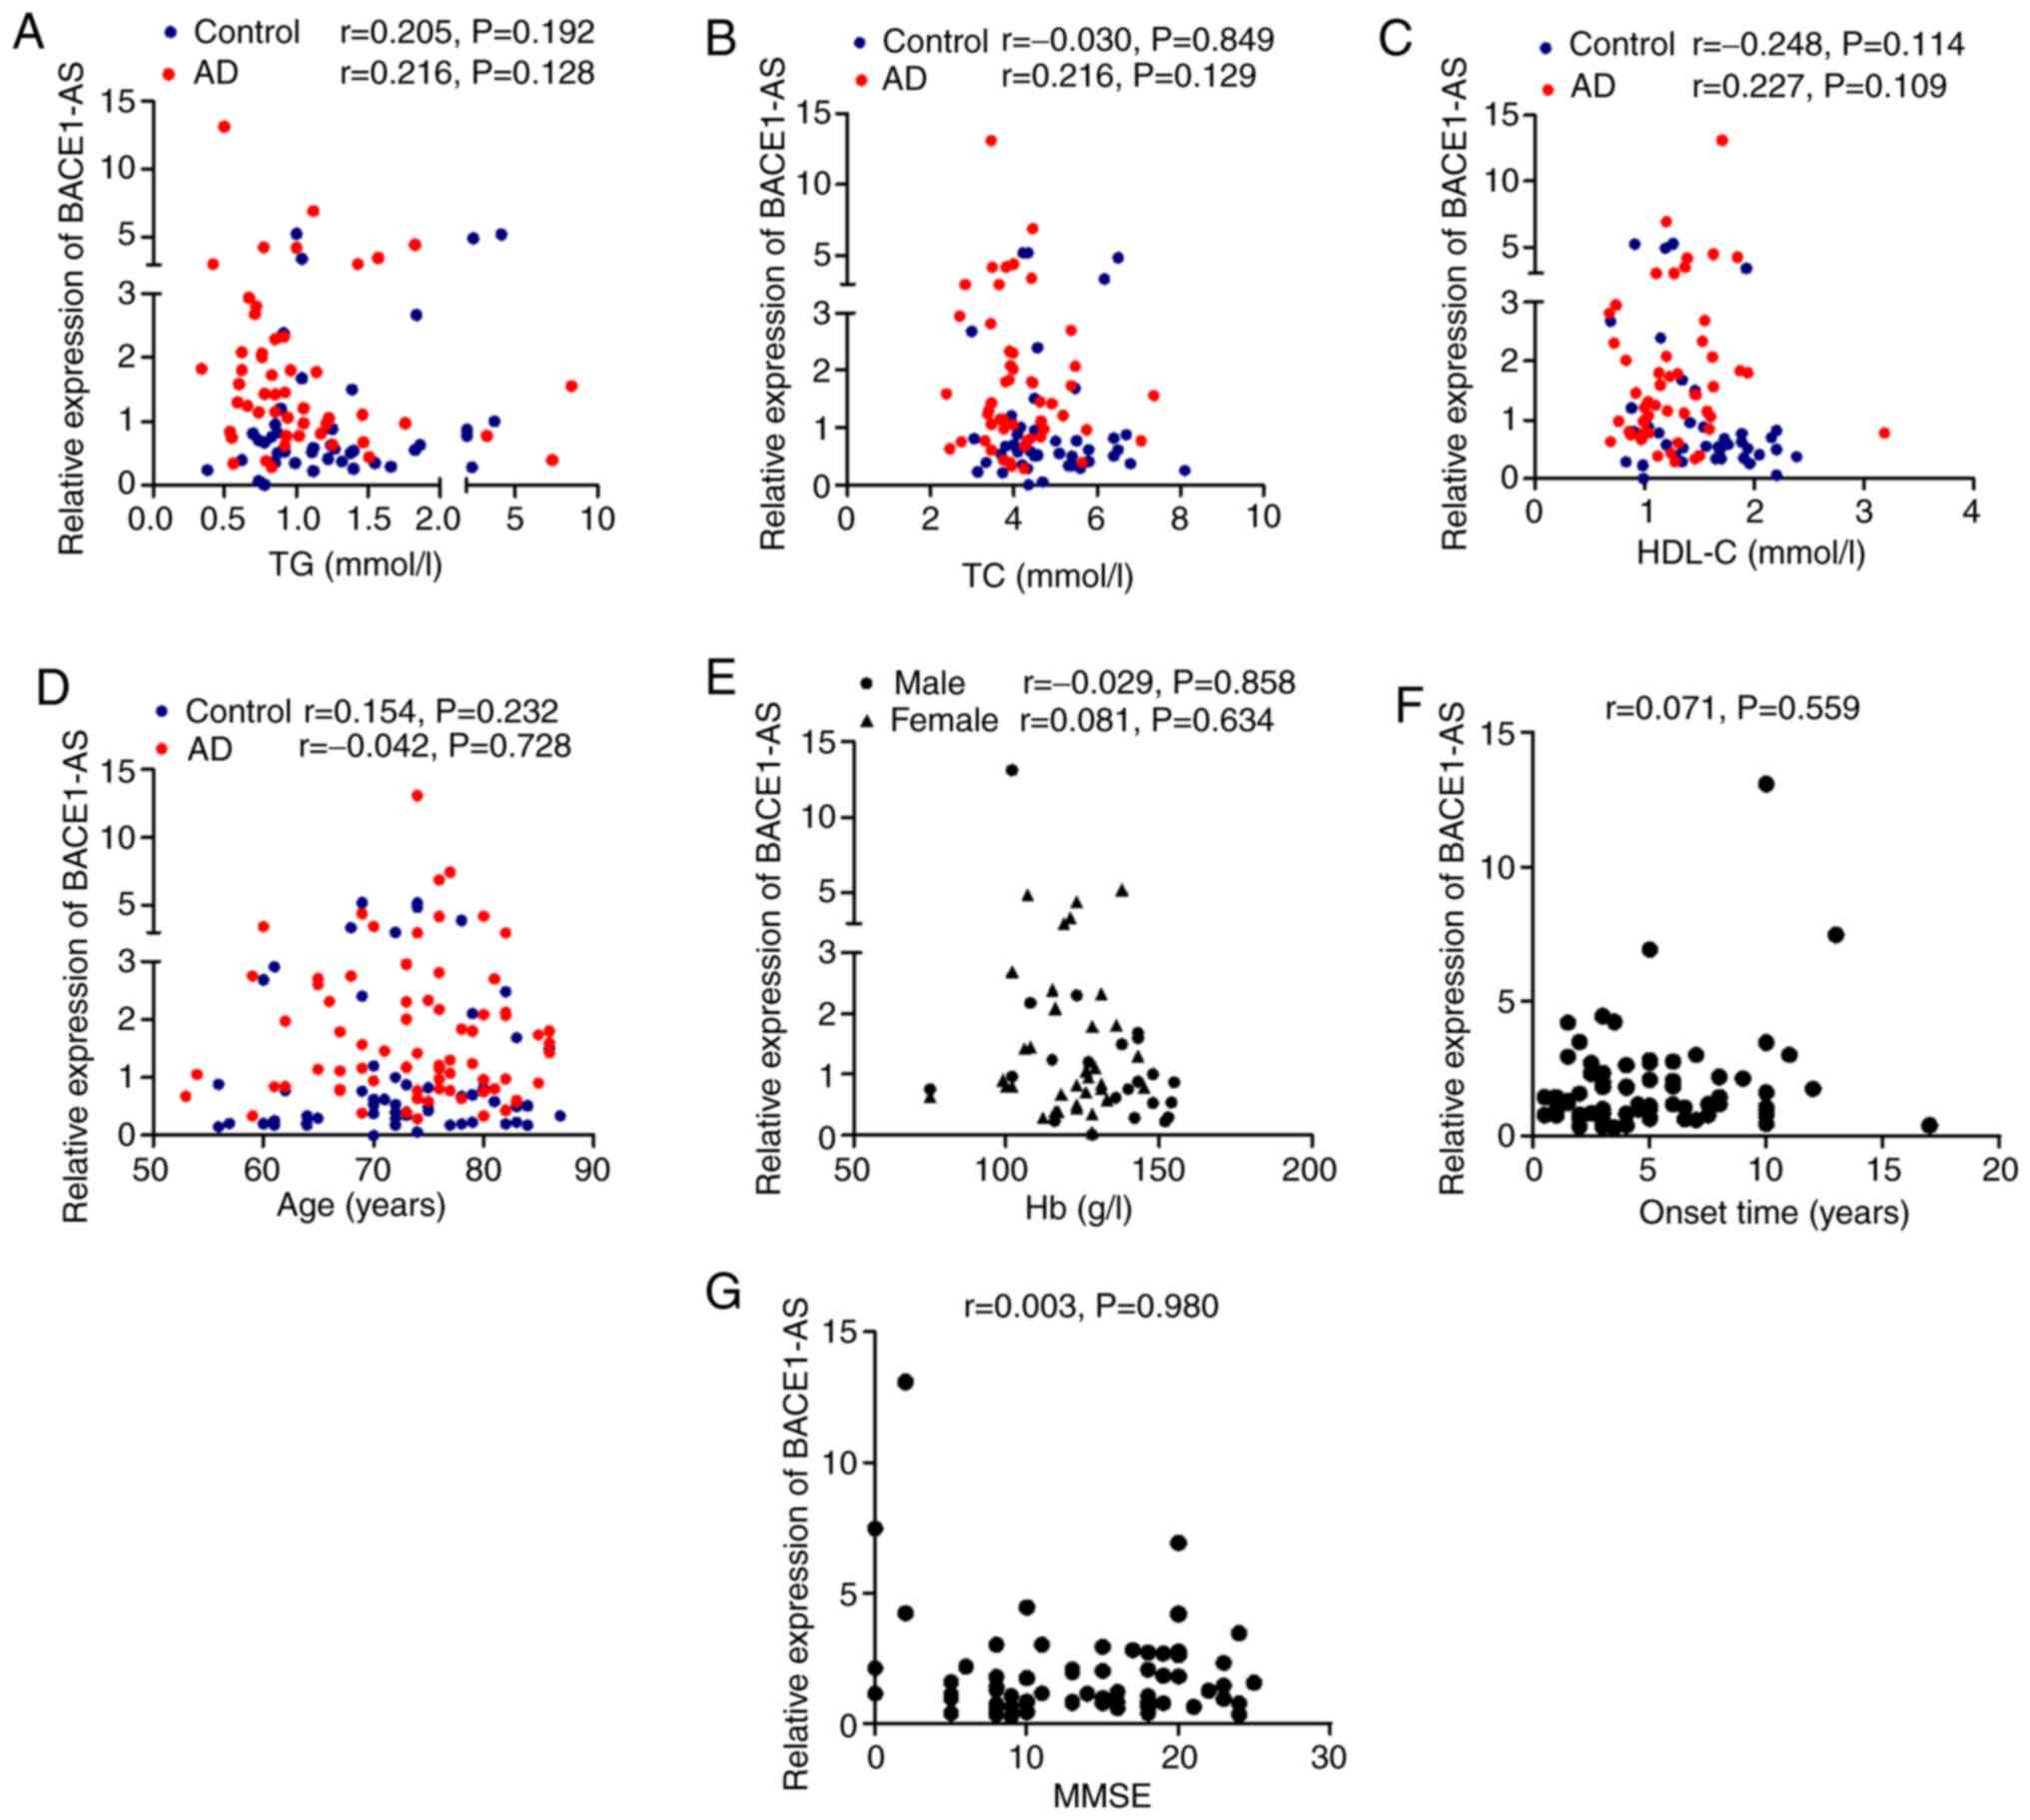
Correlation of clinical data and
exosomal BACE1-AS
As mentioned above, the blood TG, TC and HDL-C
levels in patients with AD were significantly lower compared with
controls (Table II). In order to
determine whether the diagnostic value of BACE1-AS was independent
of other clinical characteristics, correlation analyses between
BACE1-AS and blood levels of TG, TC and HDL-C and age in both
groups, as well as onset time and MMSE scores in patients with AD,
was performed. As shown in Fig. 3,
there were no significant correlations between these indices and
BACE1-AS in both the AD and control group (Fig. 3A-D, F and G; all P>0.05). As
previously mentioned, the blood levels of Hb in male AD patients
were significantly lower compared with the females. The correlation
between BACE1-AS and Hb levels in men and women was assessed
separately, but no significant correlations were observed (Fig. 3E; P>0.05).
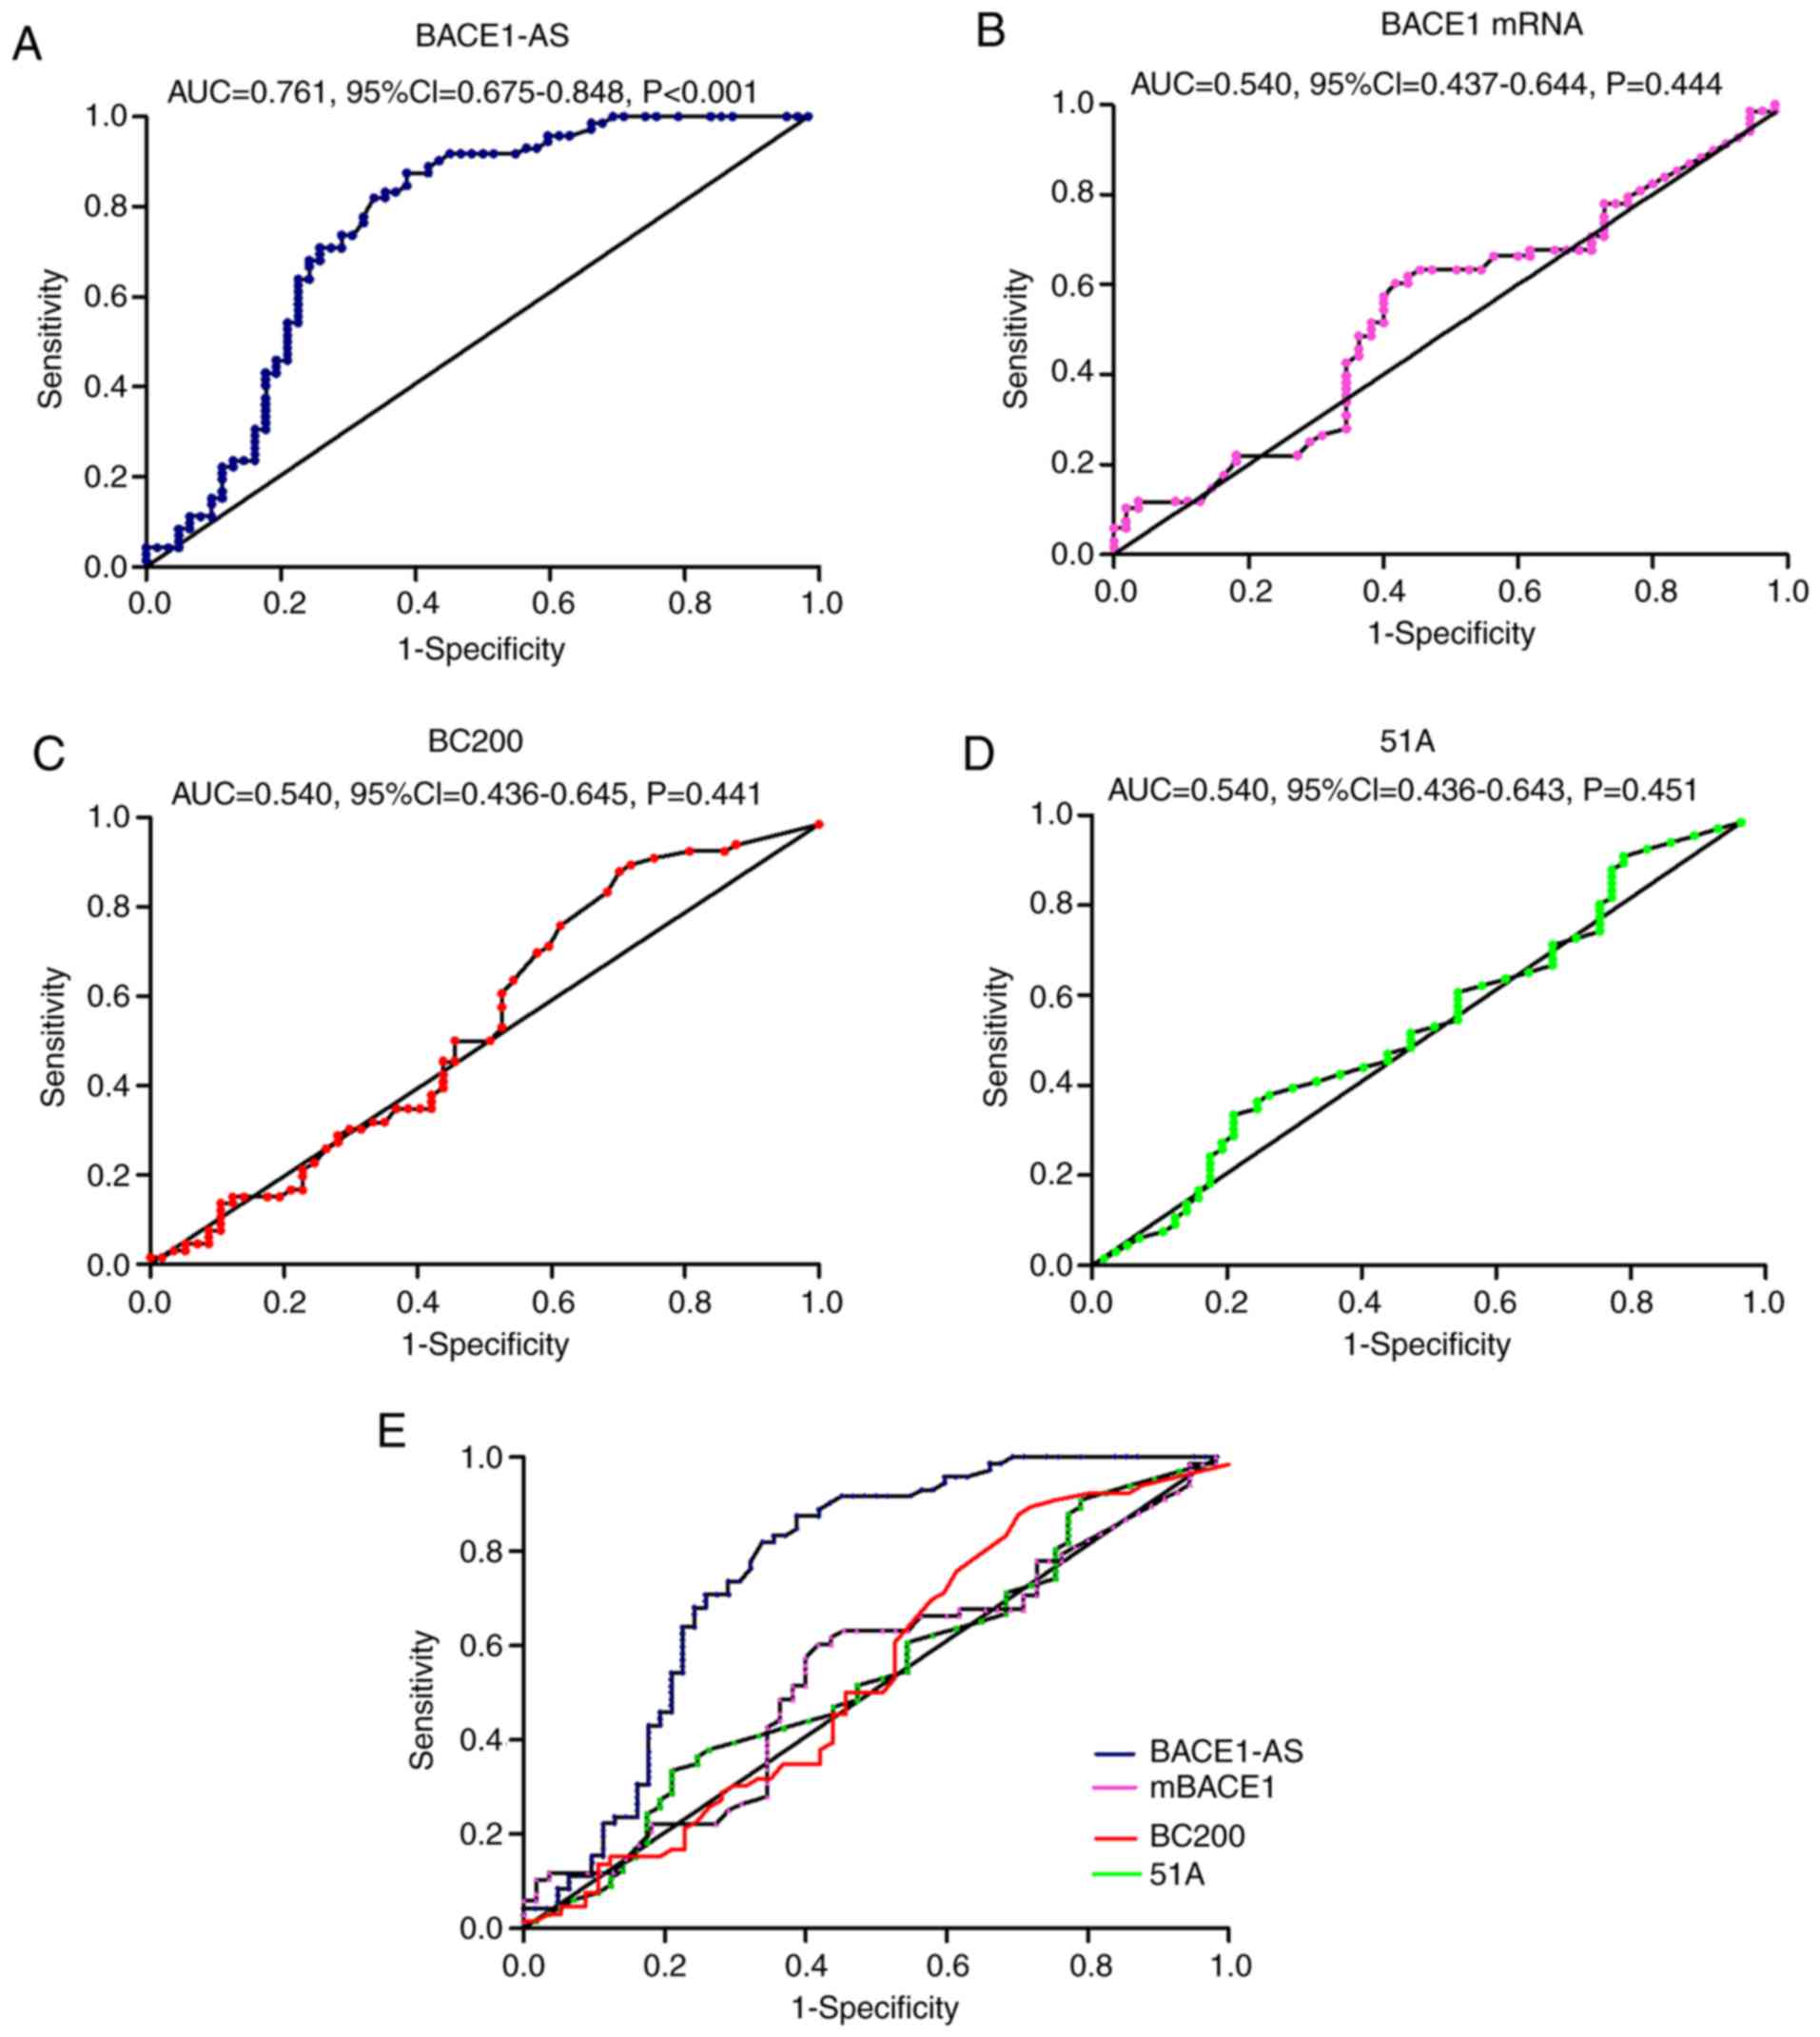
ROC curve analysis of exosomal
lncRNAs
As shown in Fig. 2,
the BACE1-AS levels of the patients with AD were significantly
higher compared with the controls. ROC curve analysis was performed
to determine the diagnostic value of BACE1-AS; the AUC was 0.761
(95% CI, 0.675–3.848; P<0.001). Although there were no
statistically significant differences in expression levels of BACE1
mRNA, BC200 or 51A between the two groups, ROC curve analyses were
also performed to evaluate their diagnostic value. For 51A, the AUC
was 0.540 (95% CI, 0.436–3.643; P=0.451), the AUC of BC200 was
0.541 (95% CI, 0.436–3.645; P=0.441) and the AUC of BACE1 mRNA was
0.540 (95% CI, 0.437–3.644; P=0.444; Fig. 4).
Acquisition of brain images
There were 22 patients with AD and 26 controls who
underwent 3D-BRAVO sequence MRI scans and met the automated
analysis criteria. The hippocampus and entorhinal cortex MRI
parameters in patients with AD and in the control group were
analyzed, including the bilateral hippocampus volume, entorhinal
cortex volume, entorhinal cortex mean thickness, entorhinal cortex
surface area and entorhinal cortex mean curvature. As shown in
Fig. 5F, the 3 images show the
axial, coronal and sagittal position of a brain MRI of a subject
from left to right, with the yellow region showing the hippocampus
and the green region showing the entorhinal cortex. The results
demonstrated that the right entorhinal cortex volume (P=0.015) and
right entorhinal cortex mean thickness (P=0.022) of patients with
AD were significantly lower compared with the controls (Table IV; Fig. 5A and B). There were no significant
correlations between the right entorhinal cortex volume (r=−0.247,
P=0.094), mean thickness and BACE1-AS in both groups (r=−0.246,
P=0.096; Fig. 5C and D).
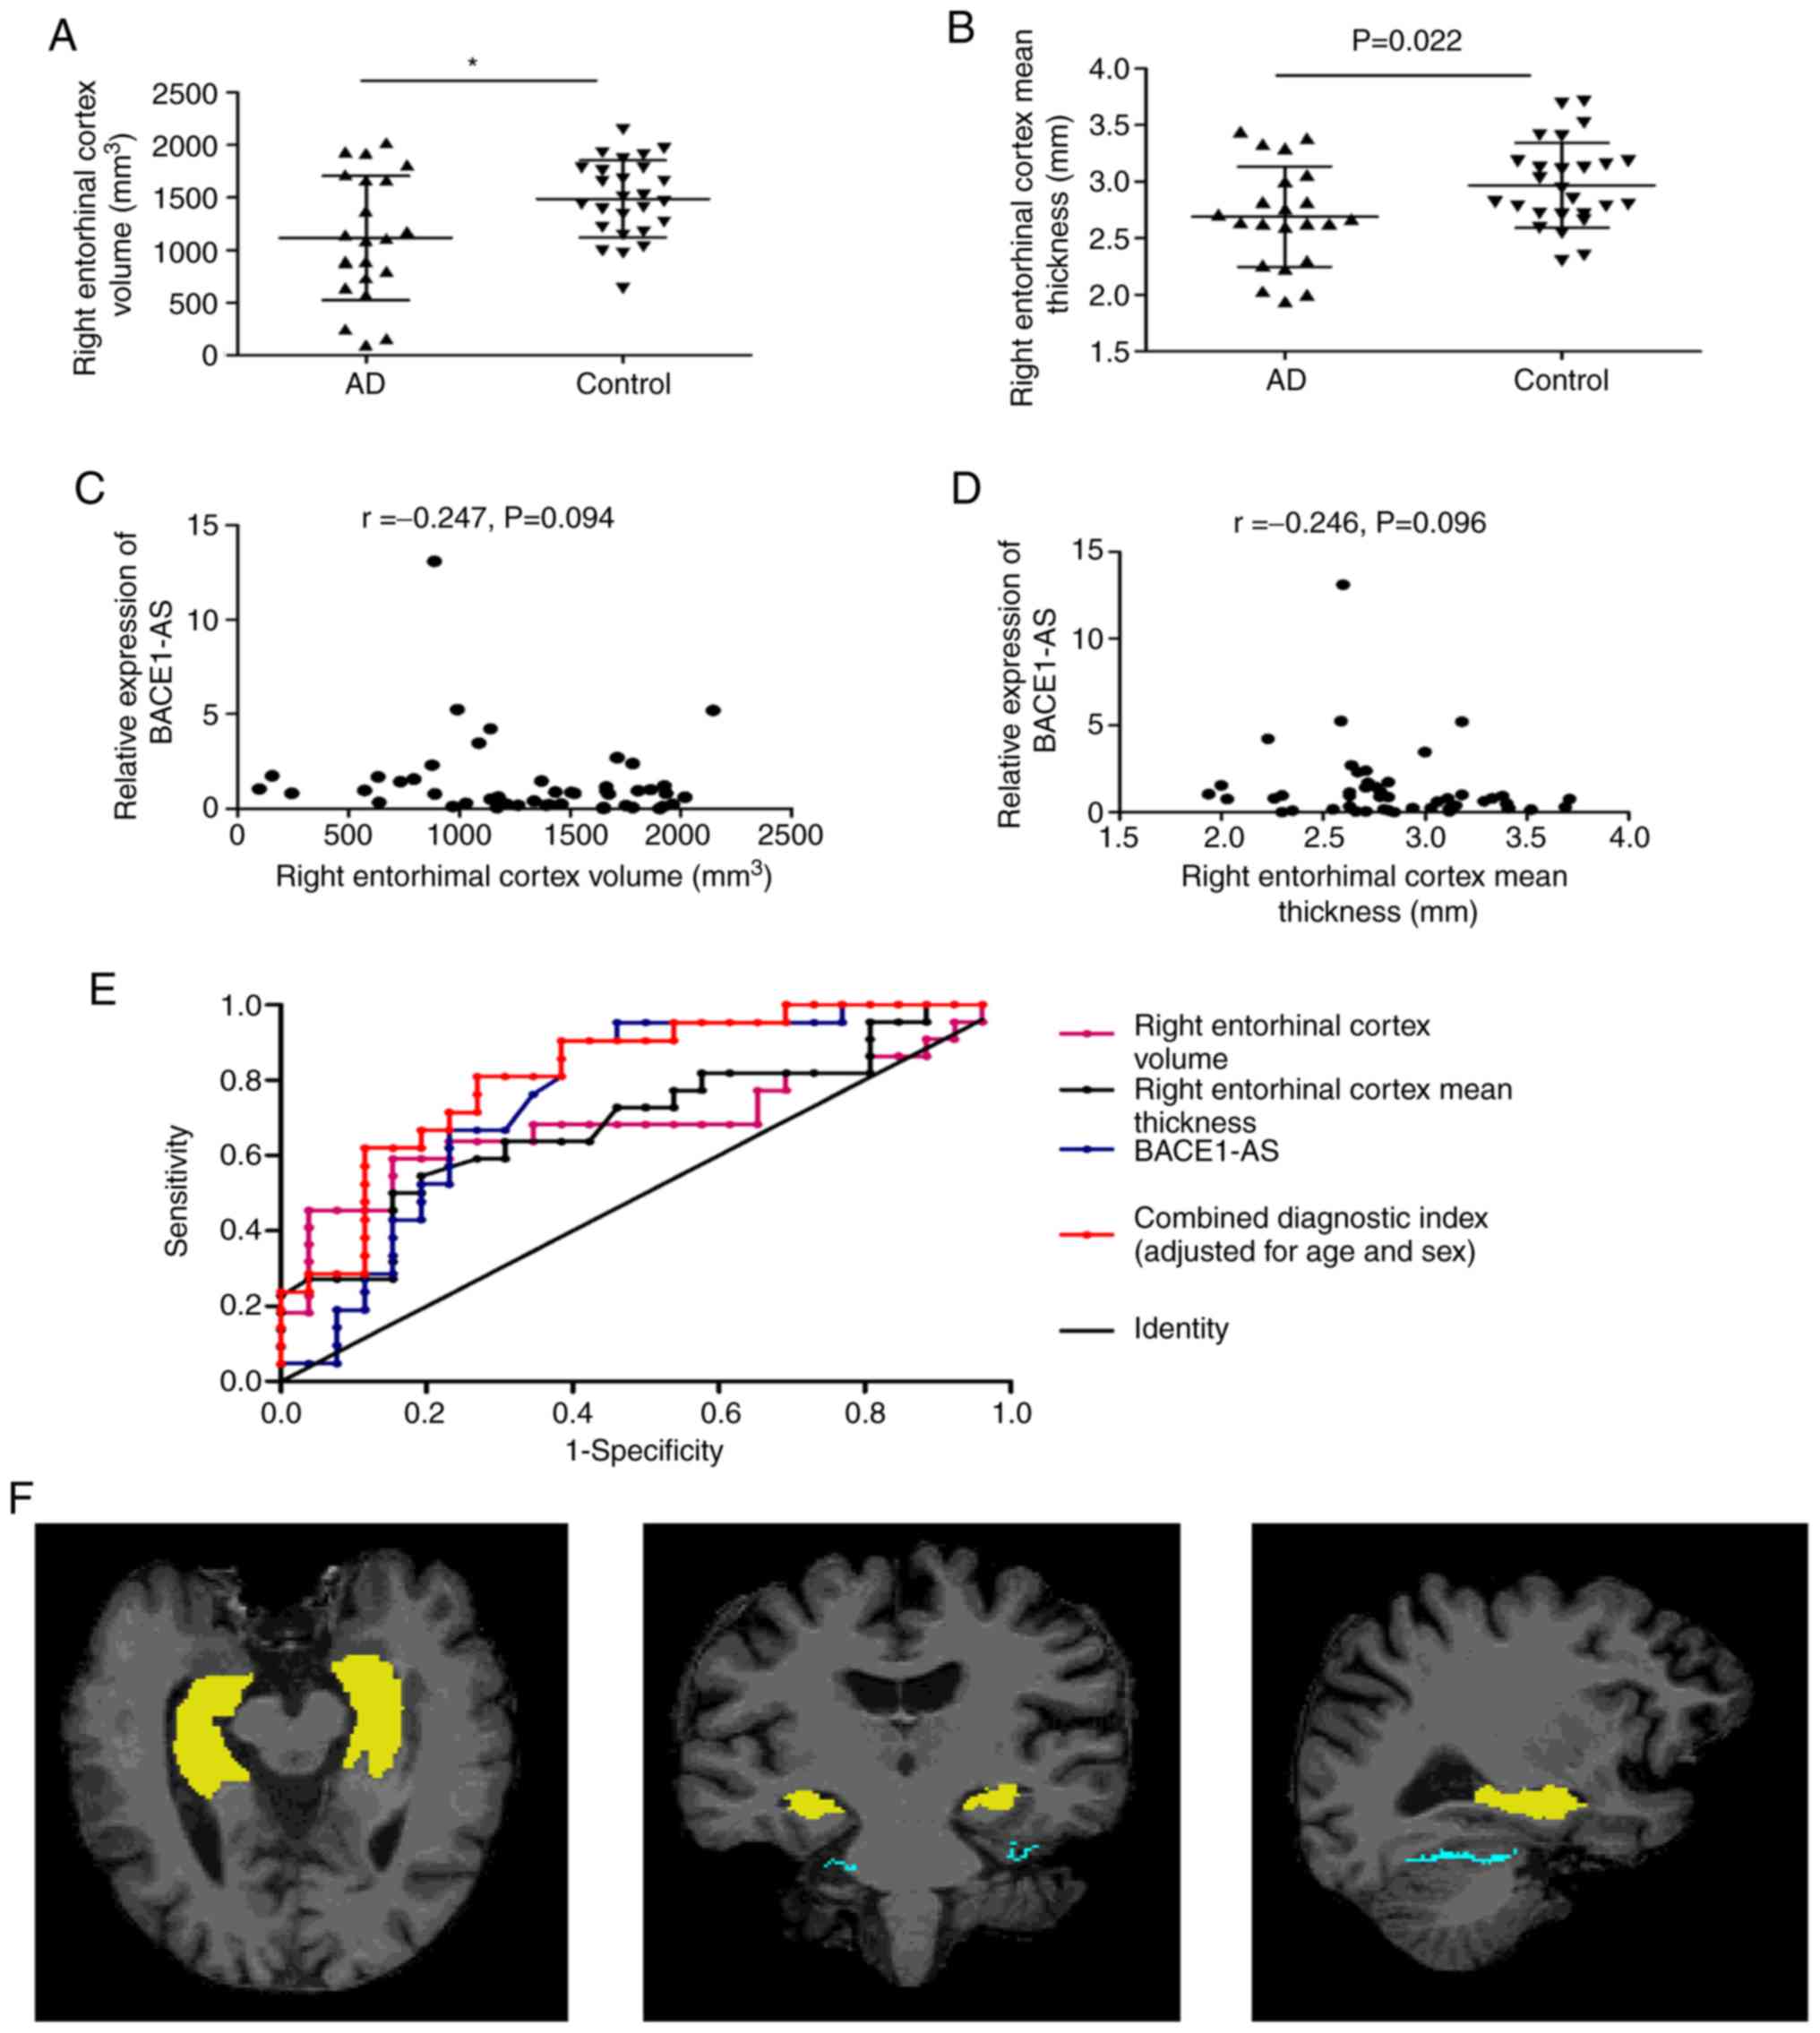 | Figure 5.The diagnostic value of MRI indices
and combined detection with BACE1-AS. (A and B) The right
entorhinal cortex volume and right entorhinal cortex mean thickness
in AD patients were significantly lower than in controls. (C and D)
There were no significant correlations between the right entorhinal
cortex volume, mean thickness of the right entorhinal cortex and
BACE1-AS, respectively, in 48 participants. (E) The ROC curves of
right entorhinal cortex volume, right entorhinal cortex mean
thickness, BACE1-AS and combined diagnostic index based on a
regression model (adjusted age and sex). (F) The axial, coronal and
sagittal positions of brain MRI of a subject from left to right,
with the yellow area being the hippocampus and the green area being
the entorhinal cortex. *P<0.05 vs. the control group. MRI,
magnetic resonance imaging; BACE1-AS, β-site amyloid precursor
protein cleaving enzyme-1-antisense transcript; ROC, receiver
operating characteristic; AD, Alzheimer's disease. |
| Table IV.Comparison of hippocampus and
entorhinal cortex parameters in AD patients and controls. |
Table IV.
Comparison of hippocampus and
entorhinal cortex parameters in AD patients and controls.
| Brain MRI data | AD (n=22) | Control (n=26) | P-value |
|---|
| Left hippocampus
volume, mm3 |
3,666.01±1,188.36 | 4,085±775.80 | 0.149 |
| Right hippocampus
volume, mm3 |
3,926.13±871.56 |
4,238.11±756.22 | 0.191 |
| Left entorhinal
cortex volume, mm3 |
1,354.27±528.29 |
1,337.04±525.24 | 0.911 |
| Right entorhinal
cortex volume, mm3 |
1,114.68±588.63 |
1,484.50±365.55 | 0.015 |
| Left entorhinal
cortex mean thickness, mm | 2.87±0.45 | 3.02±0.43 | 0.238 |
| Right entorhinal
cortex mean thickness, mm | 2.69±0.44 | 2.97±0.38 | 0.022 |
| Left entorhinal
cortex surface area, mm2 | 340.18±125.23 | 342.31±160.38 | 0.960 |
| Right entorhinal
cortex surface area, mm2 | 293.55±165.68 | 365.08±117.75 | 0.088 |
| Left entorhinal
cortex mean curvature | 0.28±0.59 | 0.17±0.04 | 0.368 |
| Right entorhinal
cortex mean curvature | 0.32±0.70 | 0.17±0.02 | 0.318 |
To evaluate the potential of the right entorhinal
cortex volume and mean thickness as novel biomarkers for AD, ROC
curves were plotted (Fig. 5E). The
AUC was 0.688 (95% CI, 0.527–3.850; P=0.015) for the right
entorhinal cortex volume, the sensitivity was 59.1%, and the
specificity was 84.6% (cutoff point, 1,142.5). The AUC was 0.689
(95% CI, 0.536–3.843; P=0.025) for the right entorhinal cortex mean
thickness, the sensitivity was 80.8%, and the specificity was 59.1%
(cutoff point, 2.705; Table
V).
| Table V.Performance of BACE1-AS, right
entorhinal cortex volume and right entorhinal cortex mean thickness
in the differential diagnosis of Alzheimer's disease patients from
controls. |
Table V.
Performance of BACE1-AS, right
entorhinal cortex volume and right entorhinal cortex mean thickness
in the differential diagnosis of Alzheimer's disease patients from
controls.
| Diagnostic
Indices | AUC | Cutoff point | Sensitivity, % | Specificity, % | Accuracy, % |
|---|
| BACE1-AS | 0.761 | 0.623 | 87.5 | 61.3 | 75.37 |
| Right entorhinal
cortex volume | 0.688 | 1,142.5 | 59.1 | 84.6 | 72.92 |
| Right entorhinal
cortex mean thickness | 0.689 | 2.705 | 80.8 | 59.1 | 68.75 |
| Series test | – | – | 36.36 | 96.15 | 68.75 |
| Parallel test | – | – | 90.91 | 42.31 | 64.58 |
| Combined diagnostic
indices of BACE1-AS, right entorhinal cortex volume and mean
thickness | 0.747 | – | 76.2 | 76.9 | 76.60 |
| Combined diagnostic
index of BACE1-AS, right entorhinal cortex volume and mean
thickness (adjusted for age and sex) | 0.819 | – | 81 | 73.1 | 76.60 |
The diagnostic value of combined
detection of BACE1-AS and the two MRI indices
As shown in Table
V, none of the 3 indicators (BACE1-AS, right entorhinal cortex
volume and mean thickness) had a high sensitivity and specificity
at the same time for diagnosis of AD. Therefore, the cumulative
performance of the 3 indices together was assessed using a
series-parallel test and binary logistic regression models. The
series-parallel test of BACE1-AS, right entorhinal cortex volume
and right entorhinal cortex mean thickness raised the specificity
and sensitivity to 96.15 and 90.91%, respectively. The combination
of the 3 indices using a logistic regression model offered improved
sensitivity and specificity simultaneously, particularly when
adjusting for age and sex (AUC, 0.819; sensitivity, 81%;
specificity, 73.1%; accuracy, 76.6%; Table V).
Discussion
The present study demonstrated that lncRNA BACE1-AS
expression levels in plasma exosomes isolated from patients with AD
was significantly increased compared with the controls.
Furthermore, the diagnostic value of BACE1-AS levels in combination
with brain MRI indices were assessed. To the best of the authors'
knowledge, the present study is the first to demonstrate that
peripheral blood exosomal BACE1-AS levels combined with the volume
and thickness of the right entorhinal cortex may serve as a
potential biomarker for diagnosis of AD.
The concentrations of Aβ42 and tau protein in CSF
and positron emission tomography (PET) imaging are strongly
recommended as diagnostic biomarkers for AD (23). However, given the potential trauma
caused by lumbar puncture and the high cost of PET, their
applications are limited clinically (46). A previous study demonstrated that
neuron-derived exosomes in patients with AD contained Aβ and tau
proteins (47). A recent study
demonstrated that the exosomal concentrations of Aβ42, tau protein
phosphorylated at threonine residue 181 (P-T181-tau) and total tau
protein (T-tau) were higher in patients with AD compared with the
control group. The levels of Aβ42, P-T181-tau and T-tau in plasma
neuronal-derived exosomes were highly correlated with that in the
CSF (48). These peripheral blood
neuronal-derived exosomal proteins may be used as markers for
diagnosis of AD, highlighting the potential of exosomes as
biomarkers of AD. In addition to proteins, exosomes contain genetic
material, including lncRNAs (10).
Several studies have shown that the expression of
lncRNAs, including BACE1-AS, is increased in the brains of patients
with AD. BACE1-AS is transcribed from one strand of chromosome 11,
which is on the opposite strand to BACE1. BACE1-AS increases BACE1
mRNA stability, which is essential for the production of the toxic
Aβ (18–20). Our previous study demonstrated that
BACE1-AS was involved in the generation of Aβ and regulation of
BACE1 expression in APPsw transgenic cells (49). Therefore, it was hypothesized that
BACE1-AS may be a promising biomarker and therapeutic target for
diagnosis and treatment of AD. The expression levels of BACE1-AS in
human peripheral blood have been examined, but the results are
contradictory. Feng et al (50) demonstrated that the expression of
BACE1-AS was increased in the plasma of patients with AD. In
another study, the expression levels of BACE1-AS were assessed,
both in plasma and plasma exosomes, but no significant differences
were observed between the patients with AD and the controls. There
was a significant decrease in the levels of BACE1-AS in the plasma
of patients who were considered pre-AD (MMSE≥20), and the levels
were significantly higher in those considered full-AD (MMSE<20),
compared with the controls. Notably, there were no significant
differences in BACE1-AS levels in the plasma exosomes between the
pre-AD, full-AD and control groups (51).
The present study enrolled more participants than
previous studies (50,51). In order to further verify whether
BACE1-AS can be used as a biomarker for AD, the BACE1-AS expression
levels from plasma exosomes were assessed in patients with AD and
age, sex and education level matched controls. The BACE1-AS levels
were significantly higher compared with the control group, but
there were no differences in the levels between patients with a
varying severity of dementia. The plasma BACE1-AS levels were not
simultaneously detected, thus it was not possible to clarify the
association between BACE1-AS expression levels in the plasma and
exosomes. A previous study demonstrated that exosomes serve a role
in communication across the BBB between the periphery and the
central nervous system (12).
Further research is required to determine whether BACE1-AS crosses
the BBB via exosomes.
BACE1-AS affects the expression of Aβ and is
involved in the pathogenesis of AD (19,49);
however, whether it is associated with the severity of brain
atrophy has not been determined. To examine this, 3D-BRAVO sequence
MRI scans of the brains of a portion of the recruited cohort in
both groups were taken, and correlation analysis between BACE1-AS
and the atrophy of hippocampus and entorhinal cortex was performed.
However, the results demonstrated that there was no correlation
between these factors. There are two possible reasons for this: i)
The cause of AD is complex and abnormal expression of lncRNA is
only one of the possible pathogenic mechanisms (18); and ii) 3D-BRAVO sequence required
more strict scanning parameters and longer scanning times, and for
several patients it was not possible to complete the MRI
examination, particularly in patients with severe dementia.
Therefore, the MRI parameters of only 48 participants in total were
analyzed, which may have made the results biased. Additional
participants are required in future studies to further analyze the
correlation between BACE1-AS and atrophy of the cortex.
The volume and thickness of the right entorhinal
cortex in patients with AD was significantly lower compared with
the control group. ROC curve analysis demonstrated that the
sensitivity of the volume of the right entorhinal cortex in the
diagnosis of AD was 59.1% and the specificity was 84.6%. Regarding
the thickness of the right entorhinal cortex, the sensitivity was
80.8% and the specificity was 59.1%. These results are consistent
with those of previous studies reporting the reliability of
volumetric imaging of medial temporal lobe structures for the
diagnosis of AD (26). Typical AD
imaging manifestations observed are temporal lobe atrophy,
particularly in the medial temporal lobe, including the
hippocampus, parahippocampal gyrus, subiculum, entorhinal cortex
and amygdala, which can be used as a diagnostic criterion (25,30).
However, there was no difference in the hippocampal volume between
patients with AD and the control group in the present study. A
number of studies have demonstrated that hippocampal atrophy can be
used as an imaging marker for the diagnosis of AD (27,29,37);
however, the results of the present study contradict this
conclusion. This may be due to the insufficient number of cases
eligible for imaging analysis. In future studies, the number of
participants who undergo 3D-BRAVO sequence MRI scans should be
increased to verify the reliability of hippocampal volume as a
diagnostic marker of AD.
Although the sensitivity of plasma exosomal BACE1-AS
expression levels for the diagnosis of AD was 87.5%, the
specificity was unsatisfactory at 61.3%. Therefore, exosomal
BACE1-AS levels and the entorhinal cortex parameters were combined
to improve the accuracy of diagnosis of AD. The cumulative
performance of the 3 indices was determined using 2 statistical
analysis methods; series-parallel test and binary logistic
regression models. Through the series-parallel test, the
specificity and sensitivity were raised to 96.15% and 90.91%,
respectively. By applying a logistic regression model, it was shown
that the combination of the 3 indices resulted in improved
sensitivity and specificity simultaneously, particularly when
adjusted for age and sex.
Additionally, other clinical characteristics in both
groups were analyzed. Results demonstrated a significant decrease
in the levels of TG, TC and HDL-C, and in the Hb levels in males in
the plasma of patients with AD, but these were not significantly
correlated with BACE1-AS levels. Previous studies have shown that
high HDL and TC levels are positively correlated with the risk of
AD (52,53), in contrast to the results of the
present study. This may be due to differences in the proportions of
patients with moderate to severe dementia in the AD group between
the two studies; the severity of AD increases the risk of
malnutrition, leading to a decrease in plasma cholesterol levels
(54,55). In addition, the results of the
present study demonstrated that Hb levels in male patients with AD
were reduced, consistent with a previous study which suggested that
abnormal Hb levels may result in differences in white matter
integrity and cerebral perfusion (56).
In the present study, the expression levels of
BACE1-AS were assessed in all 134 participants, and the expression
of BACE1 mRNA, BC200 and 51A was only detected in 123 subjects. Due
to the small quantity of the samples, the expression of the four
RNAs was first detected in parts of the samples in order to save
the samples, and it was found that only the level of BACE1-AS was
different in the two groups. Subsequently, the expression of
BACE1-AS was verified in all samples by RT-qPCR. However, some of
the remaining sample quantity was too small to complete 3 repeat
experiments when detecting other RNAs, so these subjects were
excluded.
There were some other certain limitations in the
present study. The sample size was small, and more participants are
required in future studies to validate the conclusions drawn. The
present study did not simultaneously detect the plasma total
BACE1-AS level and it was uncertain if this lncRNA primarily
existed in exosomes in the peripheral blood. Only the total
exosomal BACE1-AS levels in plasma were detected; neuron-derived
exosomes alone were not detected. Finally, although the MRI
parameters of hippocampus and entorhinal cortex were also measured,
there was no correlation between BACE1-AS and MRI data. Therefore,
determination on whether the abnormal expression of BACE1-AS in the
peripheral blood of patients with AD is caused by pathological
changes in brain neurons requires further study.
In summary, the present study demonstrated that
plasma exosomal BACE1-AS expression levels in patients with AD were
significantly higher compared with the controls. Furthermore,
BACE1-AS levels combined with right entorhinal cortex MRI
parameters may improve the accuracy of diagnosis of AD.
Acknowledgements
Not applicable.
Funding
The present study was supported by the National
Natural Science Foundation of China (grant nos. 81870848 and
81702538), the Young Talents Fund of the Second Hospital of
Shandong University (grant no. 2018YT16), the Fundamental Research
Funds of Chinese Academy of Medical Sciences (grant no.
2019-RC-HL-026), the Natural Science Foundation of Shandong
Province (grant no. ZR201702160271) and the Shandong University
Multidisciplinary Research and Innovation Team of Young Scholars
(grant no. 2020QNQT019).
Availability of data and materials
The datasets used and/or analyzed during the current
study are available from the corresponding author on reasonable
request.
Authors' contributions
ZX, YJ, YZ and DW conceived and designed the study,
and interpreted the data. DW, XB, MH, MD and LH performed
laboratory experiments. PW, SX, QZ, MH, JB and ZX contributed
toward sample collection and processing. DW, XB, and ZX wrote the
manuscript. YZ, JB, YJ and QZ reviewed and edited the manuscript.
All authors read and approved the final manuscript.
Ethics approval and consent to
participate
The present study was approved by the Medical
Research Ethics Committee of the Second Hospital of Shandong
University (approval no. KYLL-2019[LW] 019). All subjects or their
guardians provided written informed consent.
Patient consent for publication
Not applicable.
Competing interests
The authors declare that they have no competing
interests.
References
|
1
|
Bianchi VE, Herrera PF and Laura R: Effect
of nutrition on neurodegenerative diseases. A systematic review.
Nutr Neurosci. 4:1–25. 2019.(Epub ahead of print). View Article : Google Scholar
|
|
2
|
Arvanitakis Z, Shah RC and Bennett DA:
Diagnosis and management of dementia: Review. JAMA. 322:1589–1599.
2019. View Article : Google Scholar : PubMed/NCBI
|
|
3
|
Smedinga M, Tromp K, Schermer MHN and
Richard E: Ethical arguments concerning the use of Alzheimer's
disease biomarkers in individuals with no or mild cognitive
impairment: A systematic review and framework for discussion. J
Alzheimers Dis. 66:1309–1322. 2018. View Article : Google Scholar : PubMed/NCBI
|
|
4
|
Hampel H, O'Bryant SE, Molinuevo JL,
Zetterberg H, Masters CL, Lista S, Kiddle SJ, Batrla R and Blennow
K: Blood-based biomarkers for Alzheimer disease: Mapping the road
to the clinic. Nat Rev Neurol. 14:639–652. 2018. View Article : Google Scholar : PubMed/NCBI
|
|
5
|
Molinuevo JL, Ayton S, Batrla R, Bednar
MM, Bittner T, Cummings J, Fagan AM, Hampel H, Mielke MM, Mikulskis
A, et al: Current state of Alzheimer's fluid biomarkers. Acta
Neuropathol. 136:821–853. 2018. View Article : Google Scholar : PubMed/NCBI
|
|
6
|
Li X, Wang H, Long J, Pan G, He T,
Anichtchik O, Belshaw R, Albani D, Edison P, Green EK and Scott J:
Systematic analysis and biomarker study for Alzheimer's disease.
Sci Rep. 8:173942018. View Article : Google Scholar : PubMed/NCBI
|
|
7
|
Gleerup HS, Hasselbalch SG and Simonsen
AH: Biomarkers for Alzheimer's disease in saliva: A systematic
review. Dis Markers. 2019:47610542019. View Article : Google Scholar : PubMed/NCBI
|
|
8
|
Quek C and Hill AF: The role of
extracellular vesicles in neurodegenerative diseases. Biochem
Biophys Res Commun. 483:1178–1186. 2017. View Article : Google Scholar : PubMed/NCBI
|
|
9
|
Liu W, Bai X, Zhang A, Huang J, Xu S and
Zhang J: Role of exosomes in central nervous system diseases. Front
Mol Neurosci. 12:2402019. View Article : Google Scholar : PubMed/NCBI
|
|
10
|
Pegtel DM and Gould SJ: Exosomes. Annu Rev
Biochem. 88:487–514. 2019. View Article : Google Scholar : PubMed/NCBI
|
|
11
|
Zhao Z and Zlokovic BV: Remote control of
BBB: A tale of exosomes and microRNA. Cell Res. 27:849–850. 2017.
View Article : Google Scholar : PubMed/NCBI
|
|
12
|
Matsumoto J, Stewart T, Banks WA and Zhang
J: The transport mechanism of extracellular vesicles at the
blood-brain barrier. Curr Pharm Des. 23:6206–6214. 2017. View Article : Google Scholar : PubMed/NCBI
|
|
13
|
Yoo YK, Lee J, Kim H, Hwang KS, Yoon DS
and Lee JH: Toward exosome-based neuronal diagnostic devices.
Micromachines (Basel). 9:E6342018. View Article : Google Scholar : PubMed/NCBI
|
|
14
|
Si X, Tian J, Chen Y, Yan Y, Pu J and
Zhang B: Central nervous system-derived exosomal alpha-synuclein in
serum may be a biomarker in Parkinson's disease. Neuroscience.
413:308–316. 2019. View Article : Google Scholar : PubMed/NCBI
|
|
15
|
Hartmann A, Muth C, Dabrowski O, Krasemann
S and Glatzel M: Exosomes and the prion protein: More than one
truth. Front Neurosci. 11:1942017. View Article : Google Scholar : PubMed/NCBI
|
|
16
|
Yang TT, Liu CG, Gao SC, Zhang Y and Wang
PC: The serum exosome derived MicroRNA-135a, −193b, and −384 were
potential Alzheimer's disease biomarkers. Biomed Environ Sci.
31:87–96. 2018.PubMed/NCBI
|
|
17
|
Bellingham SA, Guo BB, Coleman BM and Hill
AF: Exosomes: Vehicles for the transfer of toxic proteins
associated with neurodegenerative diseases. Front Physiol.
3:1242012. View Article : Google Scholar : PubMed/NCBI
|
|
18
|
Cortini F, Roma F and Villa C: Emerging
roles of long non-coding RNAs in the pathogenesis of Alzheimer's
disease. Ageing Res Rev. 50:19–26. 2019. View Article : Google Scholar : PubMed/NCBI
|
|
19
|
Luo Q and Chen Y: Long noncoding RNAs and
Alzheimer's disease. Clin Interv Aging. 11:867–872. 2016.
View Article : Google Scholar : PubMed/NCBI
|
|
20
|
Faghihi MA, Modarresi F, Khalil AM, Wood
DE, Sahagan BG, Morgan TE, Finch CE, St Laurent G 3rd, Kenny PJ and
Wahlestedt C: Expression of a noncoding RNA is elevated in
Alzheimer's disease and drives rapid feed-forward regulation of
beta-secretase. Nat Med. 14:723–730. 2008. View Article : Google Scholar : PubMed/NCBI
|
|
21
|
Ciarlo E, Massone S, Penna I, Nizzari M,
Gigoni A, Dieci G, Russo C, Florio T, Cancedda R and Pagano A: An
intronic ncRNA-dependent regulation of SORL1 expression affecting
Aβ formation is upregulated in post-mortem Alzheimer's disease
brain samples. Dis Model Mech. 6:424–433. 2013. View Article : Google Scholar : PubMed/NCBI
|
|
22
|
Mus E, Hof PR and Tiedge H: Dendritic
BC200 RNA in aging and in Alzheimer's disease. Proc Natl Acad Sci
USA. 104:10679–10684. 2007. View Article : Google Scholar : PubMed/NCBI
|
|
23
|
McKhann GM, Knopman DS, Chertkow H, Hyman
BT, Jack CR Jr, Kawas CH, Klunk WE, Koroshetz WJ, Manly JJ, Mayeux
R, et al: The diagnosis of dementia due to Alzheimer's disease:
Recommendations from the national institute on aging-Alzheimer's
association workgroups on diagnostic guidelines for Alzheimer's
disease. Alzheimers Dement. 7:263–269. 2011. View Article : Google Scholar : PubMed/NCBI
|
|
24
|
Jack CR Jr, Bennett DA, Blennow K,
Carrillo MC, Dunn B, Haeberlein SB, Holtzman DM, Jagust W, Jessen
F, Karlawish J, et al: NIA-AA research framework: Toward a
biological definition of Alzheimer's disease. Alzheimers Dement.
14:535–562. 2018. View Article : Google Scholar : PubMed/NCBI
|
|
25
|
Calvini P, Chincarini A, Gemme G, Penco
MA, Squarcia S, Nobili F, Rodriguez G, Bellotti R, Catanzariti E,
Cerello P, et al: Automatic analysis of medial temporal lobe
atrophy from structural MRIs for the early assessment of Alzheimer
disease. Med Phys. 36:3737–3747. 2009. View Article : Google Scholar : PubMed/NCBI
|
|
26
|
Menéndez-González M, de Celis Alonso B,
Salas-Pacheco J and Arias-Carrión O: Structural neuroimaging of the
medial temporal lobe in Alzheimer's disease clinical trials. J
Alzheimers Dis. 48:581–589. 2015. View Article : Google Scholar : PubMed/NCBI
|
|
27
|
Juottonen K, Laakso MP, Partanen K and
Soininen H: Comparative MR analysis of the entorhinal cortex and
hippocampus in diagnosing Alzheimer disease. AJNR Am J Neuroradiol.
20:139–144. 1999.PubMed/NCBI
|
|
28
|
Ou YN, Xu W, Li JQ, Guo Y, Cui M, Chen KL,
Huang YY, Dong Q, Tan L and Yu JT; Alzheimer's Disease Neuroimaging
Initiative, : FDG-PET as an independent biomarker for Alzheimer's
biological diagnosis: A longitudinal study. Alzheimers Res Ther.
11:572019. View Article : Google Scholar : PubMed/NCBI
|
|
29
|
Pennanen C, Kivipelto M, Tuomainen S,
Hartikainen P, Hänninen T, Laakso MP, Hallikainen M, Vanhanen M,
Nissinen A, Helkala EL, et al: Hippocampus and entorhinal cortex in
mild cognitive impairment and early AD. Neurobiol Aging.
25:303–310. 2004. View Article : Google Scholar : PubMed/NCBI
|
|
30
|
Kantarci K: Magnetic resonance markers for
early diagnosis and progression of Alzheimer's disease. Expert Rev
Neurother. 5:663–670. 2005. View Article : Google Scholar : PubMed/NCBI
|
|
31
|
Yu J, Li J and Huang X: The Beijing
version of the montreal cognitive assessment as a brief screening
tool for mild cognitive impairment: A community-based study. BMC
Psychiatry. 12:1562012. View Article : Google Scholar : PubMed/NCBI
|
|
32
|
Lu J, Li D, Li F, Zhou A, Wang F, Zuo X,
Jia XF, Song H and Jia J: Montreal cognitive assessment in
detecting cognitive impairment in Chinese elderly individuals: A
population-based study. J Geriatr Psychiatry Neurol. 24:184–190.
2011. View Article : Google Scholar : PubMed/NCBI
|
|
33
|
Yang Z, Holt HK, Fan JH, Ma L, Liu Y, Chen
W, Como P, Zhang L and Qiao YL: Optimal cutoff scores for
Alzheimer's disease using the Chinese version of mini-mental state
examination among Chinese population living in rural areas. Am J
Alzheimers Dis Other Demen. 31:650–657. 2016. View Article : Google Scholar : PubMed/NCBI
|
|
34
|
Morris JC: The clinical dementia rating
(CDR): Current version and scoring rules. Neurology. 43:2412–2414.
1993. View Article : Google Scholar : PubMed/NCBI
|
|
35
|
Juva K, Sulkava R, Erkinjuntti T, Ylikoski
R, Valvanne J and Tilvis R: Staging the severity of dementia:
Comparison of clinical (CDR, DSM-III-R), functional (ADL, IADL) and
cognitive (MMSE) scales. Acta Neurol Scand. 90:293–298. 1994.
View Article : Google Scholar : PubMed/NCBI
|
|
36
|
Mulsant BH, Sweet R, Rifai AH, Pasternak
RE, McEachran A and Zubenko GS: The use of the hamilton rating
scale for depression in elderly patients with cognitive impairment
and physical Illness. Am J Geriatr Psychiatry. 2:220–229. 1994.
View Article : Google Scholar : PubMed/NCBI
|
|
37
|
Zhao W, Wang X, Yin C, He M, Li S and Han
Y: Trajectories of the hippocampal subfields atrophy in the
Alzheimer's disease: A structural imaging study. Front Neuroinform.
13:132019. View Article : Google Scholar : PubMed/NCBI
|
|
38
|
Zhang X, Lu A, Li Z, Sun J, Dai D and Qian
L: Exosomes secreted by endothelial progenitor cells improve the
bioactivity of pulmonary microvascular endothelial cells exposed to
hyperoxia in vitro. Ann Transl Med. 7:2542019. View Article : Google Scholar : PubMed/NCBI
|
|
39
|
Pua HH, Happ HC, Gray CJ, Mar DJ, Chiou
NT, Hesse LE and Ansel KM: Increased hematopoietic extracellular
RNAs and vesicles in the lung during allergic airway responses.
Cell Rep. 26:933–944.e4. 2019. View Article : Google Scholar : PubMed/NCBI
|
|
40
|
Hannafon BN, Trigoso YD, Calloway CL, Zhao
YD, Lum DH, Welm AL, Zhao ZJ, Blick KE, Dooley WC and Ding WQ:
Plasma exosome microRNAs are indicative of breast cancer. Breast
Cancer Res. 18:902016. View Article : Google Scholar : PubMed/NCBI
|
|
41
|
Bachurski D, Schuldner M, Nguyen PH, Malz
A, Reiners KS, Grenzi PC, Babatz F, Schauss AC, Hansen HP, Hallek M
and Pogge von Strandmann E: Extracellular vesicle measurements with
nanoparticle tracking analysis-an accuracy and repeatability
comparison between NanoSight NS300 and ZetaView. J Extracell
Vesicles. 8:15960162019. View Article : Google Scholar : PubMed/NCBI
|
|
42
|
Livak KJ and Schmittgen TD: Analysis of
relative gene expression data using real-time quantitative PCR and
the 2(-Delta Delta C(T)) method. Methods. 25:402–408. 2001.
View Article : Google Scholar : PubMed/NCBI
|
|
43
|
Yang ST, Lee JD, Chang TC, Huang CH, Wang
JJ, Hsu WC, Chan HL, Wai YY and Li KY: Discrimination between
Alzheimer's disease and mild cognitive impairment using SOM and
PSO-SVM. Comput Math Methods Med. 2013:2536702013. View Article : Google Scholar : PubMed/NCBI
|
|
44
|
Pagnozzi AM, Fripp J and Rose SE:
Quantifying deep grey matter atrophy using automated segmentation
approaches: A systematic review of structural MRI studies.
Neuroimage. 201:1160182019. View Article : Google Scholar : PubMed/NCBI
|
|
45
|
Allison SL, Koscik RL, Cary RP, Jonaitis
EM, Rowley HA, Chin NA, Zetterberg H, Blennow K, Carlsson CM,
Asthana S, et al: Comparison of different MRI-based morphometric
estimates for defining neurodegeneration across the Alzheimer's
disease continuum. Neuroimage Clin. 23:1018952019. View Article : Google Scholar : PubMed/NCBI
|
|
46
|
Olsson B, Lautner R, Andreasson U, Öhrfelt
A, Portelius E, Bjerke M, Hölttä M, Rosén C, Olsson C, Strobel G,
et al: CSF and blood biomarkers for the diagnosis of Alzheimer's
disease: A systematic review and meta-analysis. Lancet Neurol.
15:673–684. 2016. View Article : Google Scholar : PubMed/NCBI
|
|
47
|
Fiandaca MS, Kapogiannis D, Mapstone M,
Boxer A, Eitan E, Schwartz JB, Abner EL, Petersen RC, Federoff HJ,
Miller BL and Goetzl EJ: Identification of preclinical Alzheimer's
disease by a profile of pathogenic proteins in neurally derived
blood exosomes: A case-control study. Alzheimers Dement.
11:600–607.e1. 2015. View Article : Google Scholar : PubMed/NCBI
|
|
48
|
Jia L, Qiu Q, Zhang H, Chu L, Du Y, Zhang
J, Zhou C, Liang F, Shi S, Wang S, et al: Concordance between the
assessment of Aβ42, T-tau, and P-T181-tau in peripheral blood
neuronal-derived exosomes and cerebrospinal fluid. Alzheimers
Dement. 15:1071–1080. 2019. View Article : Google Scholar : PubMed/NCBI
|
|
49
|
Li F, Wang Y, Yang H, Xu Y, Zhou X, Zhang
X, Xie Z and Bi J: The effect of BACE1-AS on β-amyloid generation
by regulating BACE1 mRNA expression. BMC Mol Biol. 20:232019.
View Article : Google Scholar : PubMed/NCBI
|
|
50
|
Feng L, Liao YT, He JC, Xie CL, Chen SY,
Fan HH, Su ZP and Wang Z: Plasma long non-coding RNA BACE1 as a
novel biomarker for diagnosis of Alzheimer disease. BMC Neurol.
18:42018. View Article : Google Scholar : PubMed/NCBI
|
|
51
|
Fotuhi SN, Khalaj-Kondori M, Hoseinpour
Feizi MA and Talebi M: Long non-coding RNA BACE1-AS may serve as an
Alzheimer's disease blood-based biomarker. J Mol Neurosci.
69:351–359. 2019. View Article : Google Scholar : PubMed/NCBI
|
|
52
|
Anstey KJ, Ashby-Mitchell K and Peters R:
Updating the evidence on the association between serum cholesterol
and risk of late-life dementia: Review and meta-analysis. J
Alzheimers Dis. 56:215–228. 2017. View Article : Google Scholar : PubMed/NCBI
|
|
53
|
Espinosa Del Pozo PH, Espinosa PS, Donadi
EA, Martinez EZ, Salazar-Uribe JC, Guerrero MA, Moriguti JC, Colcha
MC, Garcia SE, Naranjo R, et al: Cognitive decline in adults aged
65 and older in cumbayá, quito, ecuador: Prevalence and risk
factors. Cureus. 10:e32692018.PubMed/NCBI
|
|
54
|
Kimura A, Sugimoto T, Kitamori K, Saji N,
Niida S, Toba K and Sakurai T: Malnutrition is associated with
behavioral and psychiatric symptoms of dementia in older women with
mild cognitive impairment and early-stage Alzheimer's disease.
Nutrients. 11:E19512019. View Article : Google Scholar : PubMed/NCBI
|
|
55
|
Doorduijn AS, van de Rest O, van der Flier
WM, Visser M and de van der Schueren MAE: Energy and protein intake
of Alzheimer's disease patients compared to cognitively normal
controls: Systematic review. J Am Med Dir Assoc. 20:14–21. 2019.
View Article : Google Scholar : PubMed/NCBI
|
|
56
|
Wolters FJ, Zonneveld HI, Licher S,
Cremers LGM; Heart Brain Connection Collaborative Research Group, ;
Ikram MK, Koudstaal PJ, Vernooij MW and Ikram MA: Hemoglobin and
anemia in relation to dementia risk and accompanying changes on
brain MRI. Neurology. 93:e917–917e926. 2019. View Article : Google Scholar : PubMed/NCBI
|