Introduction
Peritoneal dialysis (PD) is widely used for the
treatment of end-stage renal disease (ESRD) (1). Glucose is the primary osmotic medium
used in most PD solutions, and most PD patients undergo
ultrafiltration through the use of high concentrations of glucose.
Long-term exposure to a high concentration of glucose alters the
structure and function of the peritoneal membrane, which may result
in the development of peritoneal fibrosis and eventually cause
peritoneal failure in PD patients (2,3).
Certain studies have revealed that the immune function of the
peritoneal cavity may be crucial for the development of PD-related
perineal fibrosis (4,5).
Macrophages are ubiquitous tissue-resident
components under homeostatic physiological conditions and are
thought to serve as the first line of defence against infection
(6). However, an increasing number
of studies have revealed that they are a diverse set of cells
polarized by different T-cell responses and cytokine environments.
Generally, macrophages can be divided into classically activated
macrophages (M1) and alternatively activated macrophages (M2)
(7). M1 macrophages can be induced
by Th1 cytokines, including interferon (IFN)-γ and
lipopolysaccharide (LPS), which can phagocytose and destroy
microbes, kill tumour cells and present antigens to T cells to
evoke an adaptive immune response (8,9).
In contrast, M2 macrophages are induced in response
to stimulation with IL-4, IL-10, and IL-13. Macrophages of this
phenotype upregulate the surface levels of mannose (CD206),
scavenger (CD204) and galactose-type receptors involved in debris
clearance. Furthermore, M2 macrophages constitutively produce
functional cytokines [including transforming growth factor β
(TGF-β)] and express the enzyme Arginase 1 (Arg1) (10,11).
Through the cytokines and enzyme pathways mentioned aforementioned,
M2 macrophages may be involved in the downregulation of
inflammation, the promotion of tumour growth, long-term tissue
repair and tissue fibrosis. Our previous study also revealed that
M2 macrophages contributed to the development of PD-related
peritoneal fibrosis in a rat model (12).
However, the differentiation of macrophages in high
glucose is not well understood. It is hypothesized that macrophages
will polarize to the M2 phenotype in a high glucose environment. To
test this hypothesis, the percentage of M1 and M2 macrophages in
the 1.5 or 2.5% glucose dialysates of patients with CAPD was
detected and the effect of high glucose on the phenotypic
polarization of cultured murine macrophages from ascites was
investigated. The functions of the cytokine TGF-β1 and the enzyme
Arg1 were also detected.
Materials and methods
Subjects
The study was approved by the Ethics Committee of
the First Affiliated Hospital of Sun Yat-sen University. Written
informed consent was obtained from all participating subjects. A
total of 107 patients with CAPD (age, ≥18 years; age range, 22–76
years; mean age, 50.94 years) were recruited from the First
Affiliated Hospital of Sun Yat-sen University between January 2010
and March 2011, including 58 male patients and 49 female patients.
The subjects were patients maintained on CAPD without peritonitis,
another active infection or evident inflammation.
Sample collection
The night before the study visit, patients were
instilled with 2,000 ml of PD solution (1.5% glucose dialysate or
2.5% glucose dialysate) for an overnight dwell (10 h). Effluent
samples from patients with CAPD were centrifuged at 1,500 × g for
15 min at 4°C, and the cell sediment was washed twice with PBS.
Subsequently, the cell concentration was adjusted to
1×10⁶ cells/ml for flow cytometry. The supernatant of
the dialysis effluent was stored at −80°C immediately to detect
cytokines by ELISA.
Cell culture
J774A.1 cells, murine macrophages from ascites, were
obtained from the American Type Culture Collection. Cells were
maintained in RPMI-1640 media (Sigma-Aldrich; Merck KGaA)
supplemented with 10% heat-inactivated foetal bovine serum (Gibco;
Thermo Fisher Scientific, Inc.) at 37°C with 5% CO2 in
6-well cell culture plates (3 cm/well) until they formed a
confluent monolayer.
Determination of viable cell
number
A total of 2×10⁶ cells/ml cells were
incubated with 0.2 mg/ml MTT to determine cell viability. Following
the MTT incubation, the purple formazan crystals were dissolved
using DMSO and viability was assessed at a wavelength of 560 nm
using an Infinite F50 R plate reader (Tecan Group, Ltd.).
Flow cytometry
To identify and measure the proportion of peritoneal
cell types, markers on peritoneal macrophages from patients with
CAPD were measured by triple colour flow cytometry using a FACSort
flow cytometer (Beckman Coulter, Inc.). Anti-CD14 (clone M5E2; cat.
no. 550787; 1:100; BD Biosciences), anti-CCr7 (clone 3D12; cat. no.
552176; 1:50; BD Biosciences) and anti-CD206 (clone 19.2; cat. no.
551135; 1:50; BD Biosciences) antibodies were labelled with PerCP,
PE, and FITC, respectively. Class-matched isotype immunoglobulin
PerCP, PE and FITC-conjugated negative control monoclonal
antibodies were added to individual tubes for all samples to
identify nonspecific binding. The broad macrophage gate was refined
by plotting side scatter against CD14. In patients with CAPD, CD14-
and CCr7-positive cells were considered M1 macrophages, and CD14-
and CD206-positive cells were considered M2 macrophages. Murine
macrophages (J774A.1 cells) cultured in different concentrations of
glucose were considered M1 or M2 cells based on the expression of
CCr7 or CD206, respectively. The flow cytometry data were analysing
using WinMDI software (version 2.9; The Scripps Research
Institute).
ELISA
The cytokine profiles of the dialysates of patients
with CAPD were determined using ELISA kits, including IFN-γ (cat.
no. BMS228), IL-2 (cat. no. BMS221-2), IL-4 (BMS225-2), and IL-13
(BMS231-3; eBioscience; Thermo Fisher Scientific, Inc.), according
to the manufacturer's instructions. The concentrations of cytokines
driving M2 in dialysate (including IL-4 and IL-13) could not be
detected by ELISA, possibly because the concentration was too low
in the dialysis effluent.
Arginase activity
The activity of murine macrophage Arg1 was
determined in the aforementioned in vivo experiments using
the QuantiChrom Arginase assay kit (cat. no. DARG-200; BioAssay
Systems), according to the manufacturer's protocol, which measures
the conversion of arginine into urea by arginase. Murine
macrophages were lysed for 10 min at 4°C in 500 µl Tris-HCl (10 mM;
pH 7.4) containing 1 µM pepstatin A, 1 µM leupeptin, and 0.4% (w/v)
Triton X-100. Protein concentration was quantified using the
bicinchoninic acid protein assay (Pierce Biotechnology; Thermo
Fisher Scientific, Inc.), and the protein samples were standardized
to the same concentration. Samples (40 µl) were incubated with 10
µl arginine buffer at 37°C for 2 h. Urea detection reagent
containing anti-isonitrosopropiophenone was added and incubated at
room temperature for 60 min. Subsequently, the optical density (OD)
was measured at a wavelength of 430 nm. The readings were
standardized to total protein against the OD of the control well of
each sample (reaction without the incubation step).
Statistical analysis
Statistical analyses were performed using SPSS
(version 20.0; IBM Corp.). Data are presented as the mean ± SE. The
Kolmogorov-Smirnov (K-S) test was used to analyse normality, and
variance analysis was used to test variance equality before
analysis by t-test. Comparisons between groups were performed using
the independent sample Student's t-test and paired sample Student's
t-test. One-way ANOVA followed by the LSD post hoc test was used
for multiple groups. The χ2 was used to analyse nominal
variables. P<0.05 was considered to indicate a statistically
significant difference.
Results
Percentage of M1 and M2 macrophages in
1.5 and 2.5% glucose dialysates in an overnight dwell
To evaluate the difference in macrophage phenotypes
between patients using 1.5% glucose solution and those using 2.5%
glucose solution, the expression of surface markers on macrophages
in overnight dialysates of PD patients was examined. In total, 107
CAPD subjects (92 patients using 1.5% glucose and 15 patients using
2.5% glucose) were recruited. Patient characteristics, including
age, sex, and biological and haematological data, are listed in
Table I. Compared to patients
using 1.5% glucose dialysate, patients using 2.5% glucose dialysate
exhibited a longer follow-up duration, a higher ratio of diabetes,
and lower levels of haemoglobin, haemotocrit, and albumin. However,
there were no differences in these clinical characteristics between
the two groups (P>0.05).
 | Table I.Clinical characteristics of patients
using 1.5 and 2.5% glucose dialysates. |
Table I.
Clinical characteristics of patients
using 1.5 and 2.5% glucose dialysates.
| Characteristics | Patients using 1.5%
glucose dialysate (n=92) | Patients using 2.5%
glucose dialysate (n=15) | P-value |
|---|
| Age (years) | 50.9±14.8 | 51.2±12.4 | 0.95 |
| Sex
(male:female) | 50:42
(54.3:45.7%) | 8:7 (53.3:46.7%) | 0.69 |
| Follow-up duration
(months) | 18.7±22.5 | 21.5±24.7 | 0.62 |
| Diabetes
mellitus | 17 (20.1%) | 4 (28.6%) | 0.83 |
| White blood cell
count (109) |
7.5±2.5 |
7.1±2.1 | 0.86 |
| Percentage of
neutrophils (%) | 65.8±8.0 | 65.2±10.2 | 0.52 |
| Haemoglobin
(g/l) | 104.3±19.4 | 101.4±12.3 | 0.65 |
| Haemotocrit (%) | 31.7±5.7 | 30.7±4.2 | 0.62 |
| Albumin (g/l) | 38.1±4.8 | 35.5±4.3 | 0.09 |
| Blood urine nitrogen
(mmol/l) | 18.6±6.7 | 19.1±5.4 | 0.80 |
| Creatinine
(µmol/l) | 986.9±334.5 | 1,039.5±367.8 | 0.65 |
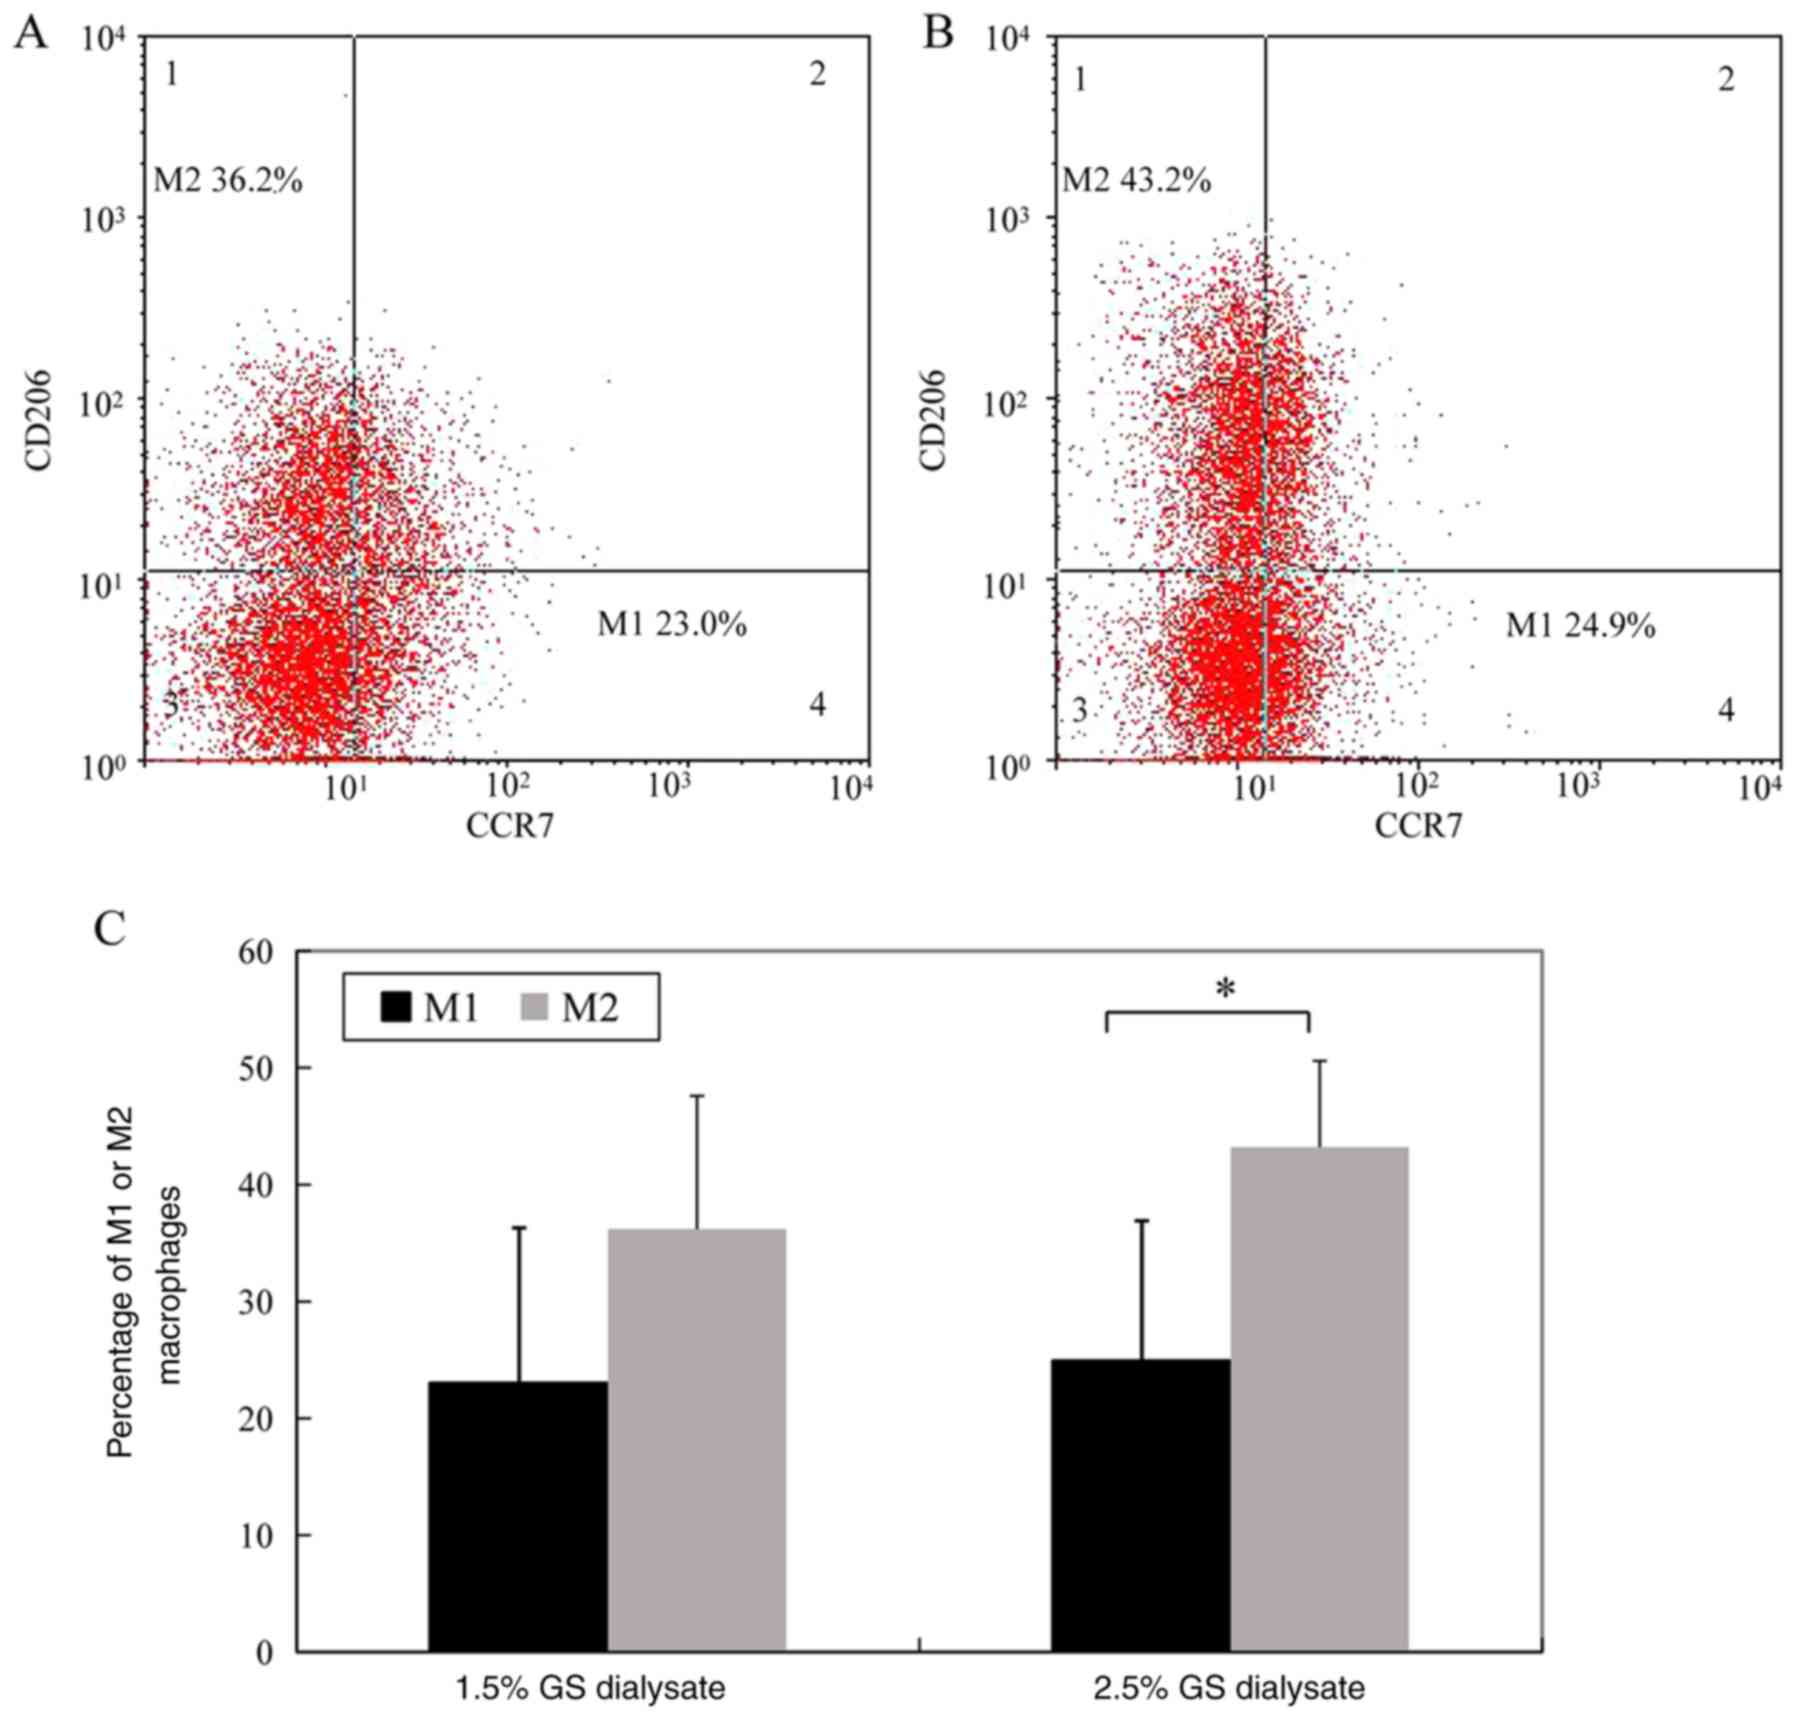
The percentage of M1 macrophages (CD14- and
CCr7-positive cells) in the 1.5% glucose solution group and the
2.5% glucose dialysis solution group was 23.0±13.3 and 24.9±12.0%,
respectively. The difference between the two groups was not
significant. However, the percentage of M2 macrophages (CD14- and
CD206-positive cells) in the 1.5% glucose solution group was
significantly decreased compared 2.5% glucose solution group
(36.2±11.4 vs. 43.2±7.4%, P<0.05) (Fig. 1; the cells in Fig. 1 were gated by CD14 as total
macrophages).
Determination of the number of viable
cells
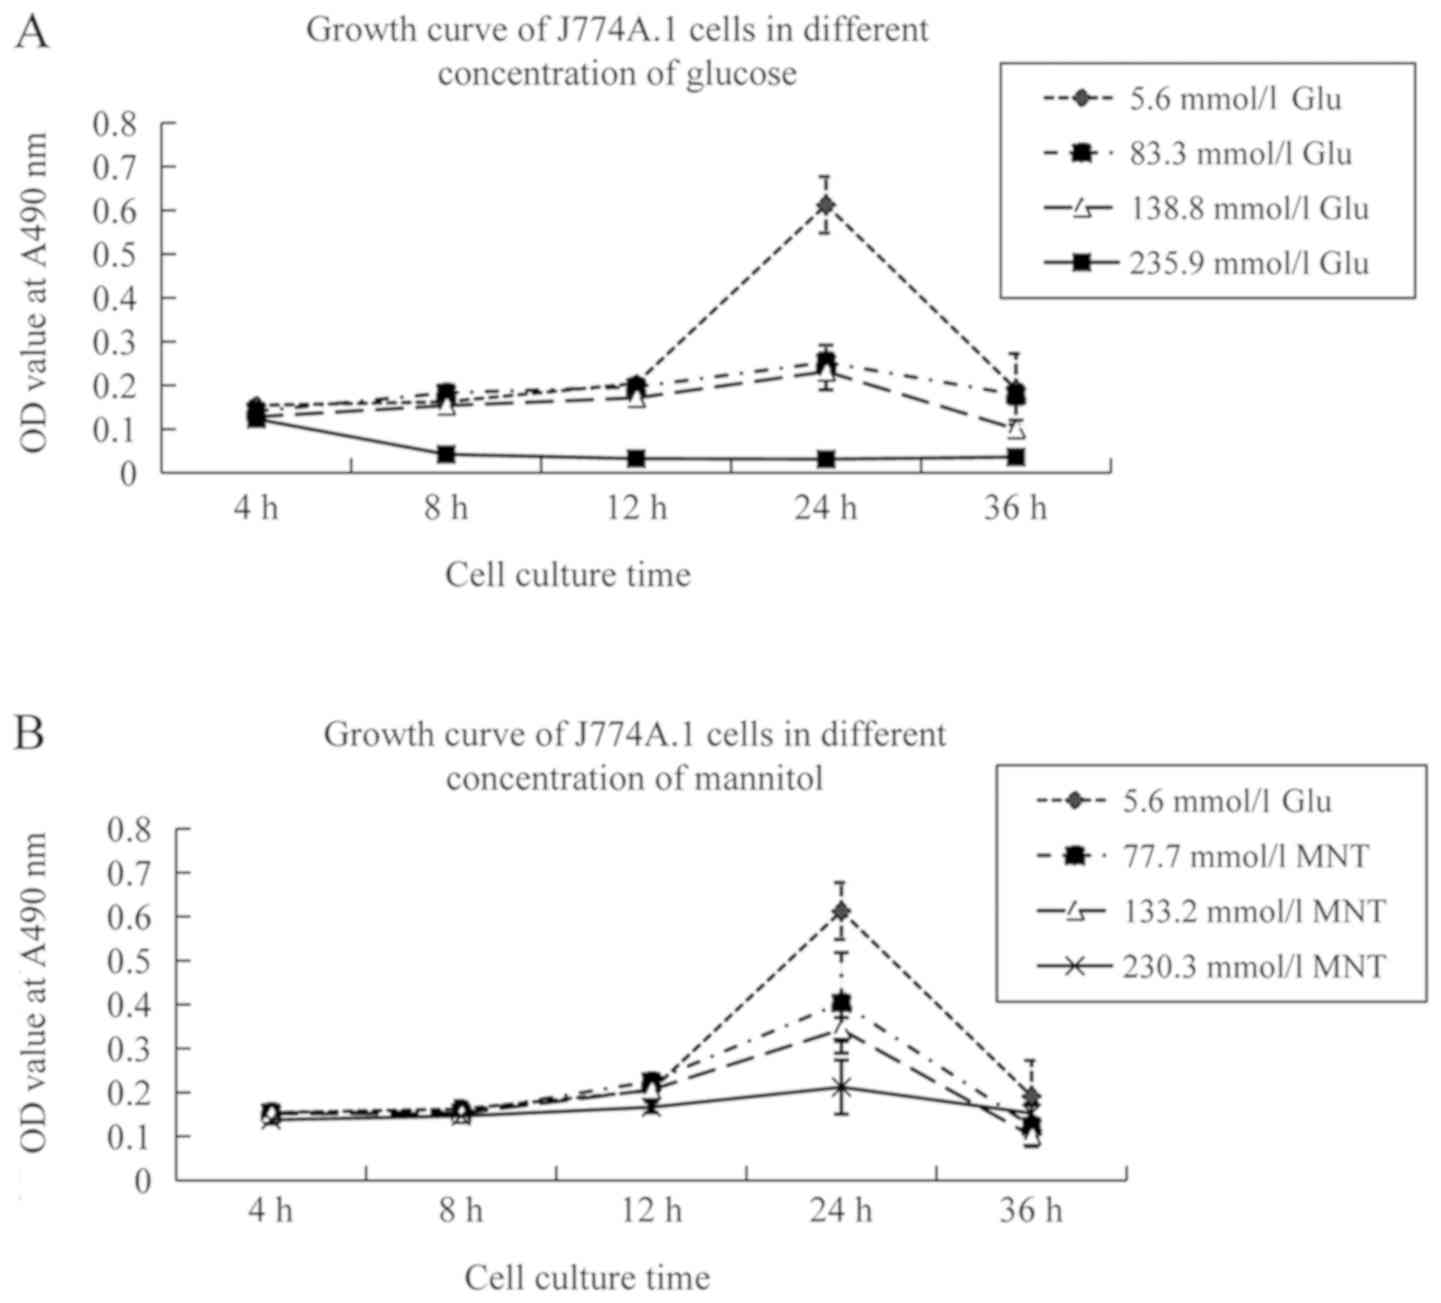
Four types of culture media were prepared: 5.6
mmol/l glucose was equivalent to the physiological glucose
concentration, 83.3 mmol/l glucose was equivalent to 1.5% glucose,
138.8 mmol/l glucose was equivalent to 2.5% glucose, and 235.9
mmol/l glucose was equivalent to 4.25% glucose. A concentration of
5.6 mmol/l glucose was selected as the control concentration
because 5.6 mmol/l glucose is the physiological glucose
concentration in a healthy body. The latter three glucose
concentrations were in accord with the glucose levels in the PD
solution.
The growth of murine peritoneal macrophages
incubated in 83.3 and 138.8 mmol/l glucose medium for 24 h was
inhibited compared to that of macrophages incubated in 5.6 mmol/l
glucose medium. Cell death was common when murine peritoneal
macrophages were incubated in 235.9 mmol/l glucose medium for 4 h.
To investigate the effect of osmotic pressure on the cell growth of
murine peritoneal macrophages, these cells were incubated in the
same osmotic media with 5.6 mmol/l glucose, 77.7 mmol/l mannitol,
133.2 mmol/l mannitol or 235.9 mmol/l mannitol. The data revealed
that cell viability was not decreased at 4, 8 or 12 h (P>0.05).
The aforementioned results indicated that osmotic pressure had a
weaker effect on the growth of murine peritoneal macrophages within
12 h. Therefore, 5.6, 83.3 and 138.8 mmol/l concentrations were
selected to study the differentiation of macrophages (Fig. 2).
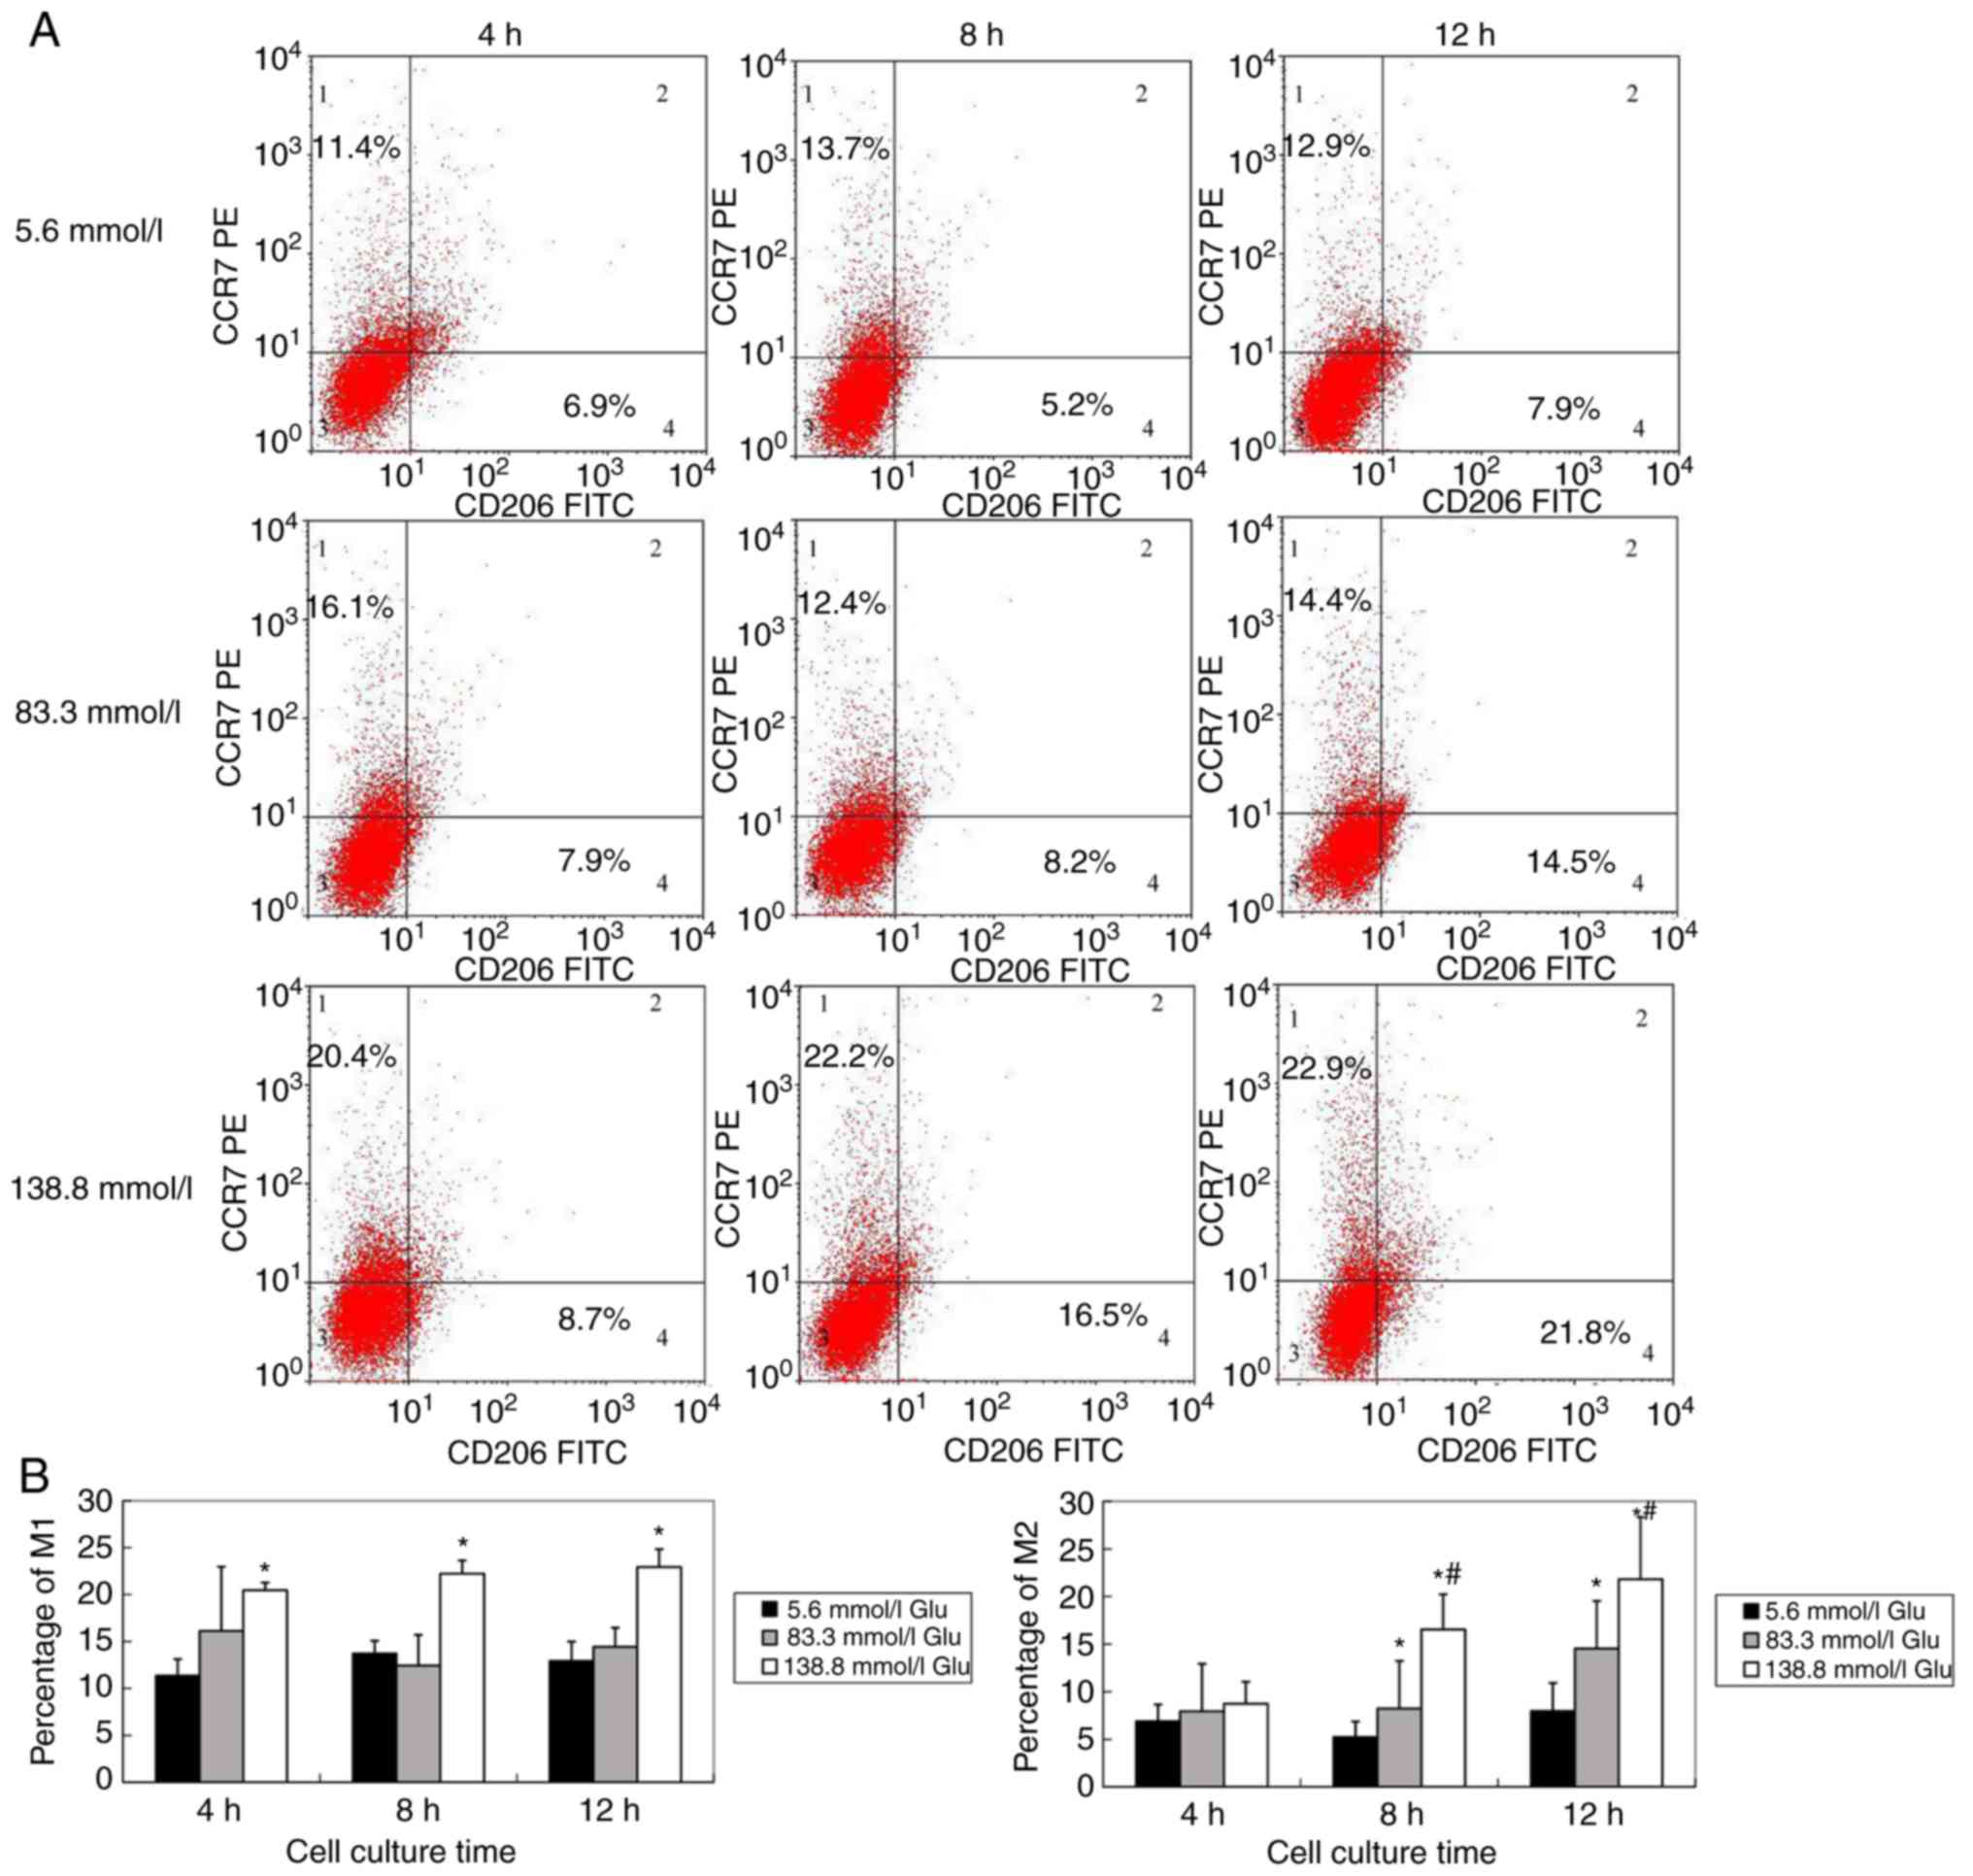
Differentiation of M1 and M2
macrophages in a high-glucose environment
J774A.1 cells, a murine macrophage line from
ascites, were cultured in 5.6, 83.3 or 138.8 mmol/l glucose medium
for 4, 8 or 12 h. The percentage of M1 macrophages (CCr7-positive
cells) in 138.8 mmol/l glucose medium increased as time progressed
(P<0.05). The percentage of M2 macrophages (CD206-positive
cells) increased in a glucose concentration-dependent and
time-dependent manner. The differences were significant (P<0.05)
(Fig. 3A and B).
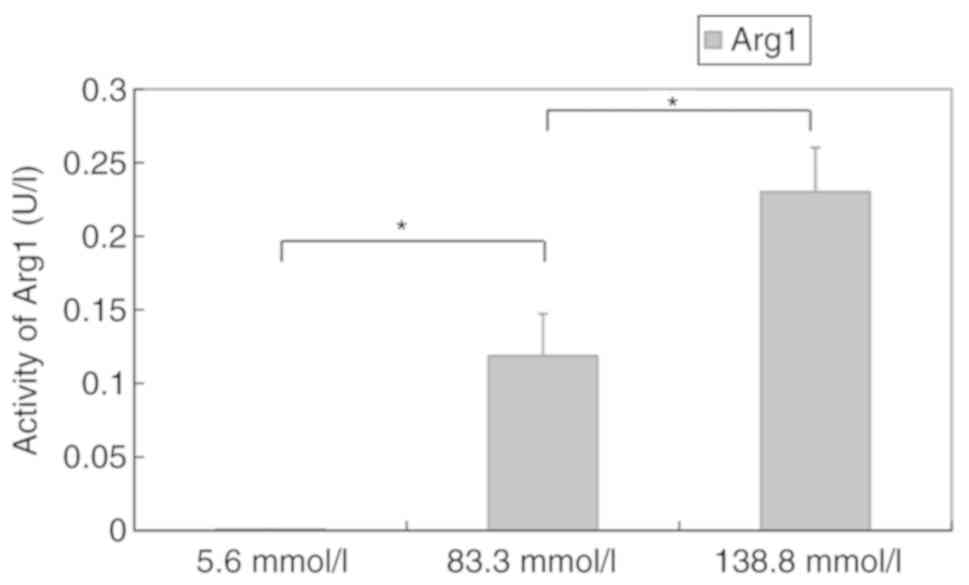
Activity of Arg1 in macrophages under
different glucose concentrations
To determine the effect of high glucose on
functional enzymes in M2 macrophages, arginase activity in murine
peritoneal macrophages exposed to different concentrations of
glucose were examined. Quantitative colorimetric analysis revealed
that the activity of Arg1 in macrophages incubated in different
media for 12 h was 0.0008±0.0001 U/l (5.6 mmol/l), 0.1187±0.0287
U/l (83.3 mmol/l) and 0.2301±0.03013 U/l (138.8 mmol/l). The
activity increased in a concentration-dependent manner (P<0.05)
(Fig. 4).
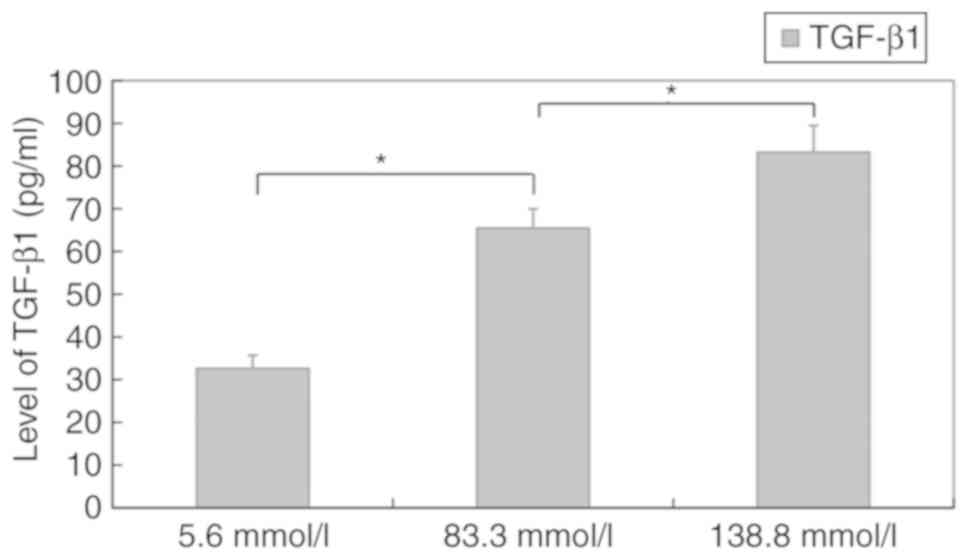
Level of TGF-β1 in murine macrophages
cultured in different glucose concentrations
ELISA revealed that the levels of TGF-β1 in
macrophages incubated in different media for 12 h were 32.6±3.1
pg/ml (5.6 mmol/l), 65.47±4.5 pg/ml (83.3 mmol/l) and 83.2±6.3
pg/ml (138.8 mmol/l). The levels also increased in a
concentration-dependent manner (P<0.05) (Fig. 5).
Discussion
In the present study, it was demonstrated that the
percentage of M2 macrophages significantly increased in PD patients
using 2.5% glucose dialysate compared with patients using 1.5%
glucose dialysate. Moreover, murine peritoneal macrophages were
cultured in high glucose, and the percentage of M2 macrophages
increased in a glucose concentration-dependent and time-dependent
manner. The percentage of M1 macrophages in 138.8 mmol/l glucose
medium increased over time. In addition, the activity of Arg1, the
functional enzyme of M2 macrophages, in murine macrophages exposed
to different concentrations of glucose increased in a
concentration-dependent manner. The level of TGF-β1 in the
supernatant of murine macrophages also increased in a glucose
concentration-dependent manner.
During PD, peritoneal membranes are continuously
exposed to PD fluids. However, these solutions have glucose
concentrations 10–50-fold higher than physiological concentrations,
as well as lactate and an acidic pH (13). PD is limited by chronic fibrotic
remodelling of the peritoneal wall after years of therapy (14). Local peritoneal inflammation is the
driver of these chronic changes (15). Macrophages are a population of
immune cells; they have been identified as key players in the
fibrotic cascade and have the capacity to exert either
injury-inducing or repair-promoting effects (16,17).
Habib et al revealed that a characteristic mononuclear cell
infiltrate consisting of CD4-positive T cells and M2 macrophages
dominated the peritoneum of encapsulating peritoneal sclerosis
(EPS) patients, which indicated that these mononuclear cells
participated in the pathogenesis of EPS (18). Another study revealed that when a
scavenger of macrophages was used to intervene in an animal model
of peritoneal fibrosis, peritoneal thickness, collagen-I,
fibronectin and CD206 were downregulated (19). Our previous data revealed that the
number and ratio of peritoneal M2 macrophages were significantly
increased in peritoneal fibrosis model rats (12,20).
In the present study, the results also revealed that the percentage
of M2 macrophages was much higher in the effluent of patients using
a 2.5% glucose solution than in that of patients using a 1.5%
glucose solution. These data indicated that macrophages were
polarized to the M2 phenotype in high glucose in vivo.
To mimic the high-glucose microenvironment of
peritoneal dialysis in vivo, murine peritoneal macrophages
in a high-glucose in vitro environment were cultured. The
present research revealed that the percentage of M2 macrophages
increased in a glucose concentration-dependent and time-dependent
manner, which was in accord with the observations of peritoneal
macrophages in PD patients using high-glucose PD solution. The
number of M1 and M2 macrophages was markedly decreased after
treatment with 5.6 mmol/l glucose at 36 h since cell death was
common when macrophages were incubated in glucose-containing
medium, especially high-glucose-containing medium, for more than 24
h (21). Pavlou et al
cultured bone marrow cells long-term in high-glucose and
normal-glucose medium. They revealed that long-term exposure to
high glucose increased the expression of M2 macrophage markers
(Arg-1 and IL-10) (22). This
result is in accordance with our data. The in vitro study
and other previous research suggest that high glucose contributes
to macrophage polarization to the M2 phenotype, which may be an
important step in PD-related fibrosis.
Murine macrophages were cultured in a high-glucose
in vitro environment to detect M1 macrophage markers. The
present results revealed that the percentage of M1 macrophages in
138.8 mmol/l glucose medium increased over time. Hyperglycaemia has
been reported to act directly on monocyte macrophage cell lines by
driving the activation of these immunocytes towards an M1 phenotype
(a proinflammatory state) (23).
Qin et al also revealed that treating Ana-1 macrophages with
advanced glycation end-products (AGEs) caused higher mRNA levels
and increased production of IL-1β and TNF-α (proinflammatory
cytokines) (24). These results
suggest that high glucose and AGEs increase the secretion of
inflammatory cytokines by macrophages to initiate an inflammatory
response. Inflammation is another potential mechanism through which
high glucose may damage peritoneal membranes and eventually result
in peritoneal fibrosis.
The cytokine environment is the key factor for
macrophage differentiation. In the presence of IFN-γ, macrophages
may polarize to the M1 phenotype. In the presence of Th2 cytokines,
macrophages are alternatively activated towards the M2 phenotype
(9). Thus, the levels of Th1
cytokines and Th2 cytokines were detected to observe the
microenvironment of the abdominal cavity for macrophage
polarization. The present data revealed that cytokines driving the
M1 phenotype, including IL-2 and INF-γ, were enhanced in the
effluent of patients using 2.5% solution. The difference was not
significant. This phenomenon was consistent with the trend of M1
macrophages. However, cytokines driving M2, including IL-4 and
IL-13, were undetectable because their concentrations were too
low.
Arginase is a marker enzyme of M2 macrophages, and
its expression is strictly regulated by exogenous stimulation with
IL-4, IL-10, and IL-13 (25). It
is important in nitrogen elimination through its hydrolysis of
L-arginine to L-ornithine. L-ornithine can be used to generate
proline and hydroxyproline, the latter of which is an amino acid
essential for the synthesis of collagen. Arg1 also competes with
iNOS, an enzyme that controls the production of NO in Th1
cytokine-stimulated M1 macrophages (26). In the present study, it was
demonstrated that the activity of arginase in murine macrophages
was increased in a concentration-dependent manner when macrophages
were exposed to different concentrations of glucose, which
indicated that M2 macrophages may promote peritoneal tissue
fibrosis through the Arg1 pathway.
M2 activation is provoked in response to stimulation
with Th2 cytokines, and functional cytokines (including TGF-β1) are
produced (9). Numerous studies
have revealed that TGF-β1 is a central mediator in fibrogenic
processes and that the activation of the TGF-β1 signalling pathway
plays a detrimental role in the pathogenesis of progressive
fibrosis (27–29). In the present study, it was
demonstrated that the level of TGF-β1 also increased in the
supernatant of murine macrophages in a glucose
concentration-dependent manner. The present results indicated that
the participation of M2 macrophages in PD-related fibrosis was
partially resolved by the secretion of the functional cytokine
TGF-β1.
Overall, it was demonstrated that high glucose
contributed to the polarization of macrophages to the M2 phenotype,
which may be involved in the pathogenesis of peritoneal fibrosis
induced by PD solutions with high concentrations of glucose.
Moreover, M2 macrophage function in PD-related fibrosis may be
associated with arginase production and the TGF-β1 signalling
pathway. These results also indicated that the blockade of M2
macrophage polarization may be a favorable candidate for
therapeutic intervention for PD-related fibrosis, however, the
latter will require further studies.
Acknowledgements
Not applicable.
Funding
The present study was supported by the National
Natural Science Foundation of China (grant no. 81700670) and the
Medical Research Fund of Guangdong Province (grant no.
20161182070992).
Availability of data and materials
The datasets used and/or analyzed during the current
study are available from the corresponding author on reasonable
request.
Authors' contributions
JL performed the cell experiments and wrote the
manuscript. QK collected the tissue samples and analyzed the data.
WHa designed the study. WHu designed the study and revised the
manuscript. All the authors read and approved the final
manuscript.
Ethics approval and consent to
participate
The present study was approved by the Ethics
Committee of the First Affiliated Hospital of Sun Yat-sen
University. Written informed consent was obtained from all
participating subjects.
Patient consent for publication
Not applicable.
Competing interests
The authors declare that they have no competing
interests.
References
|
1
|
Wong B, Ravani P, Oliver MJ, Holroyd-Leduc
J, Venturato L, Garg AX and Quinn RR: Comparison of patient
survival between hemodialysis and peritoneal dialysis among
patients eligible for both modalities. Am J Kidney Dis. 71:344–351.
2018. View Article : Google Scholar : PubMed/NCBI
|
|
2
|
Cho Y, Badve S, Hawley C, Wiggins K and
Johnson D: Biocompatible peritoneal dialysis fluids: Clinical
outcomes. Int J Nephrol. 2012:8126092012. View Article : Google Scholar : PubMed/NCBI
|
|
3
|
Davies S: Unraveling the mechanisms of
progressive peritoneal membrane fibrosis. Kidney Int. 89:1185–1187.
2016. View Article : Google Scholar : PubMed/NCBI
|
|
4
|
Liappas G, González-Mateo GT, Sánchez-Díaz
R, Lazcano JJ, Lasarte S, Matesanz-Marín A, Zur R, Ferrantelli E,
Ramírez LG, Aguilera A, et al: Immune-regulatory molecule CD69
controls peritoneal fibrosis. J Am Soc Nephrol. 27:3561–3576. 2016.
View Article : Google Scholar : PubMed/NCBI
|
|
5
|
Liao CT, Andrews R, Wallace LE, Khan MW,
Kift-Morgan A, Topley N, Fraser DJ and Taylor PR: Peritoneal
macrophage heterogeneity is associated with different peritoneal
dialysis outcomes. Kidney Int. 91:1088–1103. 2017. View Article : Google Scholar : PubMed/NCBI
|
|
6
|
Locati M, Curtale G and Mantovani A:
Diversity, mechanisms, and significance of macrophage plasticity.
Annu Rev Pathol. 15:123–147. 2020. View Article : Google Scholar : PubMed/NCBI
|
|
7
|
Gordon S, Plüddemann A and Martinez
Estrada F: Macrophage heterogeneity in tissues: Phenotypic
diversity and functions. Immunol Rev. 262:36–55. 2014. View Article : Google Scholar : PubMed/NCBI
|
|
8
|
Mantovani A, Sica A, Sozzani S, Allavena
P, Vecchi A and Locati M: The chemokine system in diverse forms of
macrophage activation and polarization. Trends Immunol. 25:677–686.
2004. View Article : Google Scholar : PubMed/NCBI
|
|
9
|
Murray P, Allen J, Biswas S, Fisher E,
Gilroy D, Goerdt S, Gordon S, Hamilton J, Ivashkiv L, Lawrence T,
et al: Macrophage activation and polarization: Nomenclature and
experimental guidelines. Immunity. 41:14–20. 2014. View Article : Google Scholar : PubMed/NCBI
|
|
10
|
Gordon S and Martinez F: Alternative
activation of macrophages: Mechanism and functions. Immunity.
32:593–604. 2010. View Article : Google Scholar : PubMed/NCBI
|
|
11
|
Xue J, Sharma V, Hsieh M, Chawla A, Murali
R, Pandol S and Habtezion A: Alternatively activated macrophages
promote pancreatic fibrosis in chronic pancreatitis. Nat Commun.
6:71582015. View Article : Google Scholar : PubMed/NCBI
|
|
12
|
Hu W, Jiang Z, Zhang Y, Liu Q, Fan J, Luo
N, Dong X and Yu X: Characterization of infiltrating macrophages in
high glucose-induced peritoneal fibrosis in rats. Mol Med Rep.
6:93–99. 2012.PubMed/NCBI
|
|
13
|
Bartosova M, Schaefer B, Vondrak K, Sallay
P, Taylan C, Cerkauskiene R, Dzierzega M, Milosevski-Lomic G,
Büscher R, Zaloszyc A, et al: Peritoneal dialysis vintage and
glucose exposure but not peritonitis episodes drive peritoneal
membrane transformation during the first years of PD. Front
Physiol. 10:3562019. View Article : Google Scholar : PubMed/NCBI
|
|
14
|
Mehrotra R, Devuyst O, Davies S and
Johnson D: The current state of peritoneal dialysis. J Am Soc
Nephrol. 27:3238–3252. 2016. View Article : Google Scholar : PubMed/NCBI
|
|
15
|
Helmke A, Nordlohne J, Balzer MS, Dong L,
Rong S, Hiss M, Shushakova N, Haller H and von Vietinghoff S:
CX3CL1-CX3CR1 interaction mediates macrophage-mesothelial cross
talk and promotes peritoneal fibrosis. Kidney Int. 95:1405–1417.
2019. View Article : Google Scholar : PubMed/NCBI
|
|
16
|
Pellicoro A, Ramachandran P, Iredale J and
Fallowfield J: Liver fibrosis and repair: Immune regulation of
wound healing in a solid organ. Nat Rev Immunol. 14:181–194. 2014.
View Article : Google Scholar : PubMed/NCBI
|
|
17
|
Palomar R, López-Hoyos M, Morales P, Marín
MJ, Alvarez L, Ruiz-Soto M, Rodrigo E, Fernandez-Fresnedo G, Lm de
Francisco A and Arias M: Analysis of peritoneal leukocyte
population with different dialysis fluids. Clin Nephrol.
72:137–142. 2009. View
Article : Google Scholar : PubMed/NCBI
|
|
18
|
Habib SM, Abrahams AC, Korte MR, Zietse R,
de Vogel LL, Boer WH, Dendooven A, Clahsen-van Groningen MC and
Betjes MG: CD4-positive T Cells and M2 macrophages dominate the
peritoneal infiltrate of patients with encapsulating peritoneal
sclerosis. PLoS One. 10:e01201742015. View Article : Google Scholar : PubMed/NCBI
|
|
19
|
Kushiyama T, Oda T, Yamada M, Higashi K,
Yamamoto K, Oshima N, Sakurai Y, Miura S and Kumagai H: Effects of
liposome-encapsulated clodronate on chlorhexidine gluconate-induced
peritoneal fibrosis in rats. Nephrol Dial Transplant. 26:3143–3154.
2011. View Article : Google Scholar : PubMed/NCBI
|
|
20
|
Wang J, Jiang ZP, Su N, Fan JJ, Ruan YP,
Peng WX, Li YF and Yu XQ: The role of peritoneal alternatively
activated macrophages in the process of peritoneal fibrosis related
to peritoneal dialysis. Int J Mol Sci. 14:10369–10382. 2013.
View Article : Google Scholar : PubMed/NCBI
|
|
21
|
Shang Y, Fang N, Wang F, Wang H, Wang Z,
Tang M, Peng J, Zhang Y, Zhang W and Zhong M: MicroRNA-21, induced
by high glucose, modulates macrophage apoptosis via programmed cell
death 4. Mol Med Rep. 12:463–469. 2015. View Article : Google Scholar : PubMed/NCBI
|
|
22
|
Pavlou S, Lindsay J, Ingram R, Xu H and
Chen M: Sustained high glucose exposure sensitizes macrophage
responses to cytokine stimuli but reduces their phagocytic
activity. BMC Immunol. 19:242018. View Article : Google Scholar : PubMed/NCBI
|
|
23
|
Pan Y, Wang Y, Cai L, Cai Y, Hu J, Yu C,
Li J, Feng Z, Yang S, Li X and Liang G: Inhibition of high
glucose-induced inflammatory response and macrophage infiltration
by a novel curcumin derivative prevents renal injury in diabetic
rats. Br J Pharmacol. 166:1169–1182. 2012. View Article : Google Scholar : PubMed/NCBI
|
|
24
|
Qin Q, Niu J, Wang Z, Xu W, Qiao Z and Gu
Y: Astragalus membranaceus inhibits inflammation via phospho-P38
mitogen-activated protein kinase (MAPK) and nuclear factor (NF)-κB
pathways in advanced glycation end product-stimulated macrophages.
Int J Mol Sci. 13:8379–8387. 2012. View Article : Google Scholar : PubMed/NCBI
|
|
25
|
Pauleau AL, Rutschman R, Lang R, Pernis A,
Watowich S and Murray P: Enhancer-mediated control of
macrophage-specific arginase I expression. J Immunol.
172:7565–7573. 2004. View Article : Google Scholar : PubMed/NCBI
|
|
26
|
Gotoh T, Sonoki T, Nagasaki A, Terada K,
Takiguchi M and Mori M: Molecular cloning of cDNA for nonhepatic
mitochondrial arginase (arginase II) and comparison of its
induction with nitric oxide synthase in a murine macrophage-like
cell line. FEBS Lett. 395:119–122. 1996. View Article : Google Scholar : PubMed/NCBI
|
|
27
|
Strippoli R, Moreno-Vicente R, Battistelli
C, Cicchini C, Noce V, Amicone L, Marchetti A, Del Pozo M and
Tripodi M: Molecular mechanisms underlying peritoneal EMT and
fibrosis. Stem Cells Int. 2016:35436782016. View Article : Google Scholar : PubMed/NCBI
|
|
28
|
Zhou Q, Bajo MA, Del Peso G, Yu X and
Selgas R: Preventing peritoneal membrane fibrosis in peritoneal
dialysis patients. Kidney Int. 90:515–524. 2016. View Article : Google Scholar : PubMed/NCBI
|
|
29
|
Kariya T, Nishimura H, Mizuno M, Suzuki Y,
Matsukawa Y, Sakata F, Maruyama S, Takei Y and Ito Y: TGF-β1-VEGF-A
pathway induces neoangiogenesis with peritoneal fibrosis in
patients undergoing peritoneal dialysis. Am J Physiol Renal
Physiol. 314:F167–F180. 2018. View Article : Google Scholar : PubMed/NCBI
|