Introduction
Immunotherapy using anti-PD-1 monoclonal antibodies
(mAbs) has made significant progress in the treatment of multiple
types of cancers, such as melanoma, non-small cell lung cancer,
head and neck cancer, and bladder cancer, by modulating the
interaction between immune and tumor cells (1–4).
However, there is still a substantial proportion of patients with
tumors that do not benefit from the treatment (5). Robust biomarkers are essential for
patient selection. In general, two categories of biomarkers
associated with responses to PD-1 inhibitors have been recognized,
including those indicative of tumor neoantigen burden (6,7) and
those related to a T cell-inflamed tumor microenvironment (8,9). T
cell receptor (TCR) sequencing provided additional insight into the
responses to anti-PD-1 immunotherapy by demonstrating that a more
clonal TCR repertoire at both pre- and peri-treatment time points
was associated with an improved response to anti-PD-1 treatment in
patients with melanoma (10,11).
Despite these advances, the molecular mechanisms of anti-PD-1
therapy in treating cancers remain the subject of ongoing
investigation.
Anti-PD-1 mAbs function by regulating the adaptive
immune response (10), the
selectivity of which derives from the enormous diversity of TCRs
and B cell receptors (BCRs) (12).
It is commonly known that anti-PD-1 treatment can activate
tumor-specific T cells by blocking the immune suppressive PD-1
pathway. On the other hand, in addition to T cells, PD-1 is also
expressed on human and mouse B cells, the blockade of which can
induce B cell activation (13,14).
There is a limited but growing body of evidence that supports the
notion that B cells have an important role in cancer immunotherapy.
Hollern et al (15)
reported that B cells and T follicular helper cells act as direct
mediators of immunotherapy responses in mouse models of breast
cancer. Selitsky et al (16) found that the absence of an
assembled BCR in pre-treatment tumor tissues was associated with
poor responses to a cytotoxic T lymphocyte antigen-4 (CTLA-4)
inhibitor in metastatic skin cutaneous melanoma. Recently, B cells
within tertiary lymphoid structures were shown to promote
immunotherapy responses in patients with metastatic melanoma and
renal cell carcinoma (17).
Therefore, more in-depth investigation of the effects of anti-PD-1
mAbs on TCR and BCR repertoires is crucial for the development of
anti-PD-1 mAbs in precision cancer treatment.
Mouse models are widely used to investigate
mechanisms of action of immunotherapy (18). Previous studies from our group and
others revealed that the MC38 tumor model is highly responsive to
anti-PD-1 treatment (19–22). Recently, Efremova et al
(23) demonstrated that the MC38
cell line is valid for modelling
hypermutated/microsatellite-instable (MSI) colorectal cancer (CRC).
Consistent with the high response rates of MSI and hypermutated
CRC, the MC38 model also responds well to immune checkpoint
inhibitors (ICIs). The high response rates of MSI and hypermutated
CRC may be due to the high number of neoantigens. To further reveal
the molecular mechanisms mediating the robust treatment responses
in terms of immune responses, in-depth studies of the TCR and BCR
repertoires of patients with hypermutated/MSI CRC or the MC38 model
receiving anti-PD-1 treatment are essential. However, to the best
of the authors' knowledge, until now there has not been a
comprehensive description of the TCR and BCR repertoires of
patients with hypermutated/MSI CRC or MC38-bearing mice receiving
anti-PD-1 treatment. To fill this gap, the BCR and TCR repertoires
of three tissues, including tumor, tumor draining lymph node (DLN)
and spleen, were investigated from MC38-bearing mice treated with
anti-PD-1 mAbs. The findings of this study may provide further
mechanistic insights into cancer therapy using anti-PD-1 mAbs.
Materials and methods
Ethics
The care and use of mice were reviewed and approved
by Merck's Institutional Animal Care and Use Committee (approval
no. 200321). During the study, the care and use of animals were
conducted in accordance with the guidelines of the Association for
Assessment and Accreditation of Laboratory Animal Care (24). For tumor cell inoculation, animals
were briefly anesthetized with 1–4% isoflurane inhalation. After
tumor cell inoculation, the animals were checked daily for
morbidity and mortality. At the time of routine monitoring, the
animals were checked for any effects of tumor growth on normal
behavior, such as mobility, food and water consumption, body weight
gain/loss, eye/hair matting and any other abnormal effects. The
maximal tumor volume permitted was 2,000 mm3, but other
criteria were also used for the determination of humane endpoints.
The other criteria included ≥20% body weight loss, emaciation,
self-induced trauma, a tumor that interferes with basic or vital
functions, and a tumor that is ulcerated. Carbon dioxide inhalation
was used for euthanasia and death was confirmed by cervical
dislocation.
Cell culture
The murine colon adenocarcinoma MC38 cell line
(Developmental Therapeutics Program Tumor Repository, Frederick
National Laboratory, Frederick, USA) was grown using early passage
vials. Early passage MC38 cells were maintained as a monolayer
culture in DMEM (Thermo Fisher Scientific, Inc.) supplemented with
10% heat-inactivated fetal bovine serum (Thermo Fisher Scientific,
Inc.) and 2 mM L-glutamine at 37°C in an atmosphere with 5%
CO2. The tumor cells were subcultured twice a week. The
cells growing in an exponential growth phase were harvested and
centrifuged at 335 × g in a refrigerated centrifuge at 4°C for 5
min with the medium aspirated. Cell pellets were resuspended in 10X
volume serum-free DMEM, filtered through a 70-µm nylon mesh cell
strainer and counted. The cell suspension was centrifuged again as
above and resuspended in serum-free and phenol red-free DMEM to
obtain 1×10⁷ cells/ml.
Mice
A total of 40 (20 experimental + 100% extra as
spare) female C57BL/6 mice were purchased from Model Animal
Research Center of Nanjing University (Nanjing, China). An
acclimation period of ~1 week was allowed before tumor inoculation.
Mice were kept in a special pathogen-free environment in
microisolator cages at constant temperature (20-26°C), constant
humidity (40-70%) and on a 12 h light/dark cycle. Animals had free
access to food and water throughout the study. At the time of MC38
cell inoculation, the animals were 7–8 weeks of age and weighed
18–22 g. Before implantation, mice were lightly anesthetized via
1–4% isoflurane inhalation. Each mouse was inoculated
subcutaneously into the right lower flank with 1×10⁶
single cells of ≥95% viability suspended in 0.1 ml of DMEM (without
serum and without phenol red).
Group designation and sampling
Groups were staged and treatments were started when
the mean tumor volume reached ~150 mm3. Based on the
tumor volume and body weight, mice were randomly assigned to murine
anti-PD-1 (mDX400; Merck & Co., Inc.) treatment group or mouse
immunoglobulin G1 (mIgG1; Merck & Co., Inc.) vehicle control
group. Tumor sizes were measured on day 0, 2, 4 and 7 using a
digital caliper. Tumor volume (V) was estimated using the formula:
V = (a × b2)/2, where ‘a’ and ‘b’ are long and short
diameters of a tumor.
On day 0 and day 5, 5 mg/kg mDX400 or mIgG1 was
administered intraperitoneally to each mouse of the corresponding
group. A total of three types of tissue, including tumor, DLN and
spleen, were sampled from each mouse on day 8 to obtain enough
samples for sequencing, which is explained as follows.
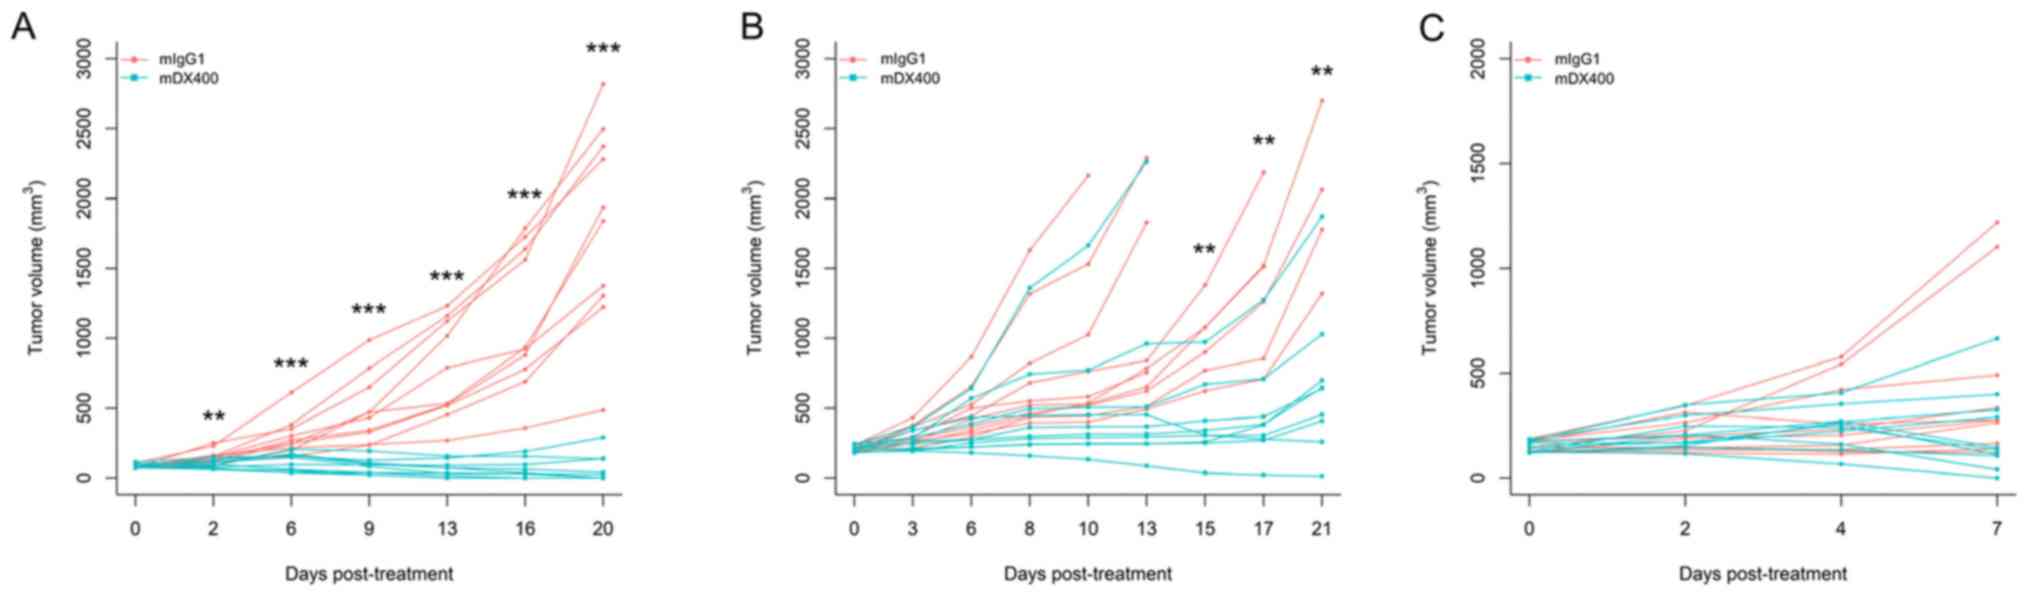
mDX400 can induce significant tumor growth
inhibition in MC38-bearing mice, which is also influenced by the
initial tumor volume (tumor volume at the beginning of treatment).
Our preliminary efficacy studies using MC38 tumor models and the
same treatment regimen (treatment every 5 days) showed that mDX400
significantly (P<0.01) inhibited tumor growth from day 2
post-initial treatment onwards, and resulted in complete response
in 50% of the mice on day 20 when treatment is initiated at an
initial tumor volume of ~85 mm3 (Fig. 1A). However, when treatment was
started at an initial tumor volume of ~210 mm3, mDX400
significantly (P<0.01) inhibited tumor growth from day 15 onward
(Fig. 1B). In the present study,
treatment was initiated when the initial tumor volume reached ~150
mm3 (between the sizes of 85 and 210 mm3 from
preliminary studies), so significant tumor growth inhibition should
begin to occur between day 2 and day 15 post-initial treatment. In
the present study, as expected based on the starting tumor size,
significant differences in tumor volume were not detected between
mDX400 and mIgG1-group mice on day 7 post-initial treatment
(Fig. 1C). Significant differences
were predicted to occur at a later time point. The mice were
euthanized on day 8 to obtain enough samples for sequencing.
Library construction and
sequencing
A total of 500 ng total RNA purified using a RNeasy
Mini Kit (cat. no. 74106; Qiagen, Inc.) was used for each mouse
tissue sample for library construction. Quality of RNA was assessed
using an Agilent 2100 Bioanalyzer (Agilent Technologies, Inc.), and
samples with an RNA integrity number <7 were excluded from
further analysis. Multiple iRepertoire primer kits with different
barcodes were used to amplify the samples separately for TCR β
chain (TRB) (cat. no. MTBI-M; iRepertoire, Inc.) and immunoglobulin
heavy chain (IgH) (cat. no. MBHI-M; iRepertoire, Inc.) sequences
through the amplicon rescued multiplex (ARM)-PCR technology
(iRepertoire, Inc.). ARM-PCR employs communal primers at the
exponential phase of PCR amplification to minimize amplification
biases. Library integrity was verified by gel electrophoresis and
samples with abnormal profiles were excluded. After construction,
the libraries were sequenced on Illumina MiSeq platform (Illumina,
Inc.) using a 2×250 base pair (bp) paired-end sequencing protocol.
From the 60 samples derived from the 3 tissues of the 20 mice, 54
samples were used for TCR repertoire sequencing and 52 samples were
used for BCR repertoire sequencing, with the remaining samples
excluded due to RNA degradation and abnormal library construction
(Table I).
 | Table I.Number of tissue samples used for
BCR/TCR repertoire sequencinga. |
Table I.
Number of tissue samples used for
BCR/TCR repertoire sequencinga.
| A, mDX400
group |
|---|
|
|---|
| Immune
repertoire | Tumor | Tumor draining
lymph node | Spleen |
|---|
| BCR | 7 | 10 | 9 |
| TCR | 7 | 10 | 9 |
|
| B, mIgG1
group |
|
| Immune
repertoire | Tumor | Tumor draining
lymph node | Spleen |
|
| BCR | 8 | 9 | 9 |
| TCR | 9 | 10 | 9 |
Sequence processing
Sequence quality was checked by FastQC v0.11.2
(bioinformatics.babraham.ac.uk/projects/fastqc). Paired-end reads
were assembled using PANDAseq v2.10 (25) with a minimum overlap region of 30
bp. The assembled TCR and BCR reads were aligned to IMGT reference
sequences (v3.1.13) (26) using
IgBLAST v1.6.1 (27).
Non-productive reads identified by IgBLAST were removed from
further analysis.
To calculate somatic hypermutations (SHMs), BCR
reads with common variable-joining (VJ) genes and identical
complementarity determining region (CDR)2 to CDR3 nucleotide
sequences were grouped as non-redundant reads as the forward IgH
variable region primers are located within the framework region
(FWR)2 region. SHMs were quantified for CDR2 and FWR3, separately
and together, with ShazaM R package v0.1.11 (28). To diminish the impact of sequencing
error, only non-redundant reads with at least three copies were
included in the mutation analysis.
Assignment of repertoire sequences to
clones
For BCR repertoires, IgH variable-diversity-joining
(VDJ) sequences were assigned into clones using ‘DefineClones.py’
of Change-O (28). Sequences were
first partitioned into groups based on common IgH VJ genes and
identical lengths of junction nucleotide sequences. Then, within
each group, sequences differing from one another by a length
normalized nucleotide hamming distance <0.06 within the junction
region were clustered together as a clone. The threshold 0.06 was
determined by plotting the normalized hamming distance of each
sequence to its nearest neighbor in the same group (Fig. S1). If a clone contained at least
two different sequences, each possessing no less than three copies,
the clone was recognized as a clonal family. After obtaining clonal
families in each sample independently, the sequences of clonal
families from all samples were clustered together for comparison
purposes. To quantify selection pressure within BCR repertoires,
BASELINe implemented in ShazaM was employed to calculate the
posterior distribution based on observed mutation rates and
expected mutation rates derived from a default human 5-mer mutation
model. Selection strengths in CDR2 and FWR3 were calculated by
using an effective sequence for each clone.
For TCR repertoires, a clone was represented as the
combination of a TRB V, J gene and a CDR3 amino acid sequence. VJ
usage and CDR3 lengths of BCR/TCR repertoires were calculated using
BCR/TCR clones with clone abundance of at least three to minimize
the impact of sequencing error on the calculation.
Clonal diversity analysis
For each sample, the clonal diversity of the BCR/TCR
repertoire was characterized by Hill's diversity indices (29) for diversity orders (q) from 0 to 30
in 0.1 increments using the rarefyDiversity function of Alakazam
package (28). To eliminate the
effect of variations in sequencing depth, each repertoire was
randomly sub-sampled to the number of sequences in the smallest
sample and the diversity indices for each sample were averaged over
1,000 sub-samples. Cross-classification based on the two treatments
and three tissues resulted in six groups. For each group, the Hill
diversity index value at each q was obtained by calculating the
mean and standard deviation.
Identification of TCR clones
consistently enriched in mDX400-group tumors
To detect TCR clones consistently expanded in
mDX400-group tumors compared with mIgG1-group tumors,
high-frequency TCR clones with frequencies of at least 0.1% in
mDX400-group tumors were investigated. The cutoff 0.1% was chosen
because for each mDX400-group tumor, the frequencies of the top 10
most frequent TCR clonotypes were >0.1% (Fig. S2). A TCR clone with a frequency of
at least 0.1% in an mDX400-group tumor was recognized as expanded
in the tumor if its frequency is at least 10-fold larger than the
mean frequency of the clone in mIgG1-group tumors. If a TCR clone
was detected to be expanded in >50% of the seven mDX400-group
tumors, the TCR clone was recognized as a consistently expanded TCR
clone. In addition, the presence of the consistently expanded
clones in tissues other than tumor was also investigated.
Statistical analysis
Wilcoxon rank-sum test was used to compare
differences between two groups and produce the P-values. Multiple
comparisons were corrected by Benjamini-Hochberg procedure to
control the false discovery rate (FDR). P<0.05 and FDR<0.05
were considered to indicate statistically significant differences
in single comparisons and multiple comparisons, respectively. For
each tissue, the comparisons between treatment and control groups
were performed using 7–10 biological replicates per group (Table I).
Results
V, J usage and CDR3 lengths
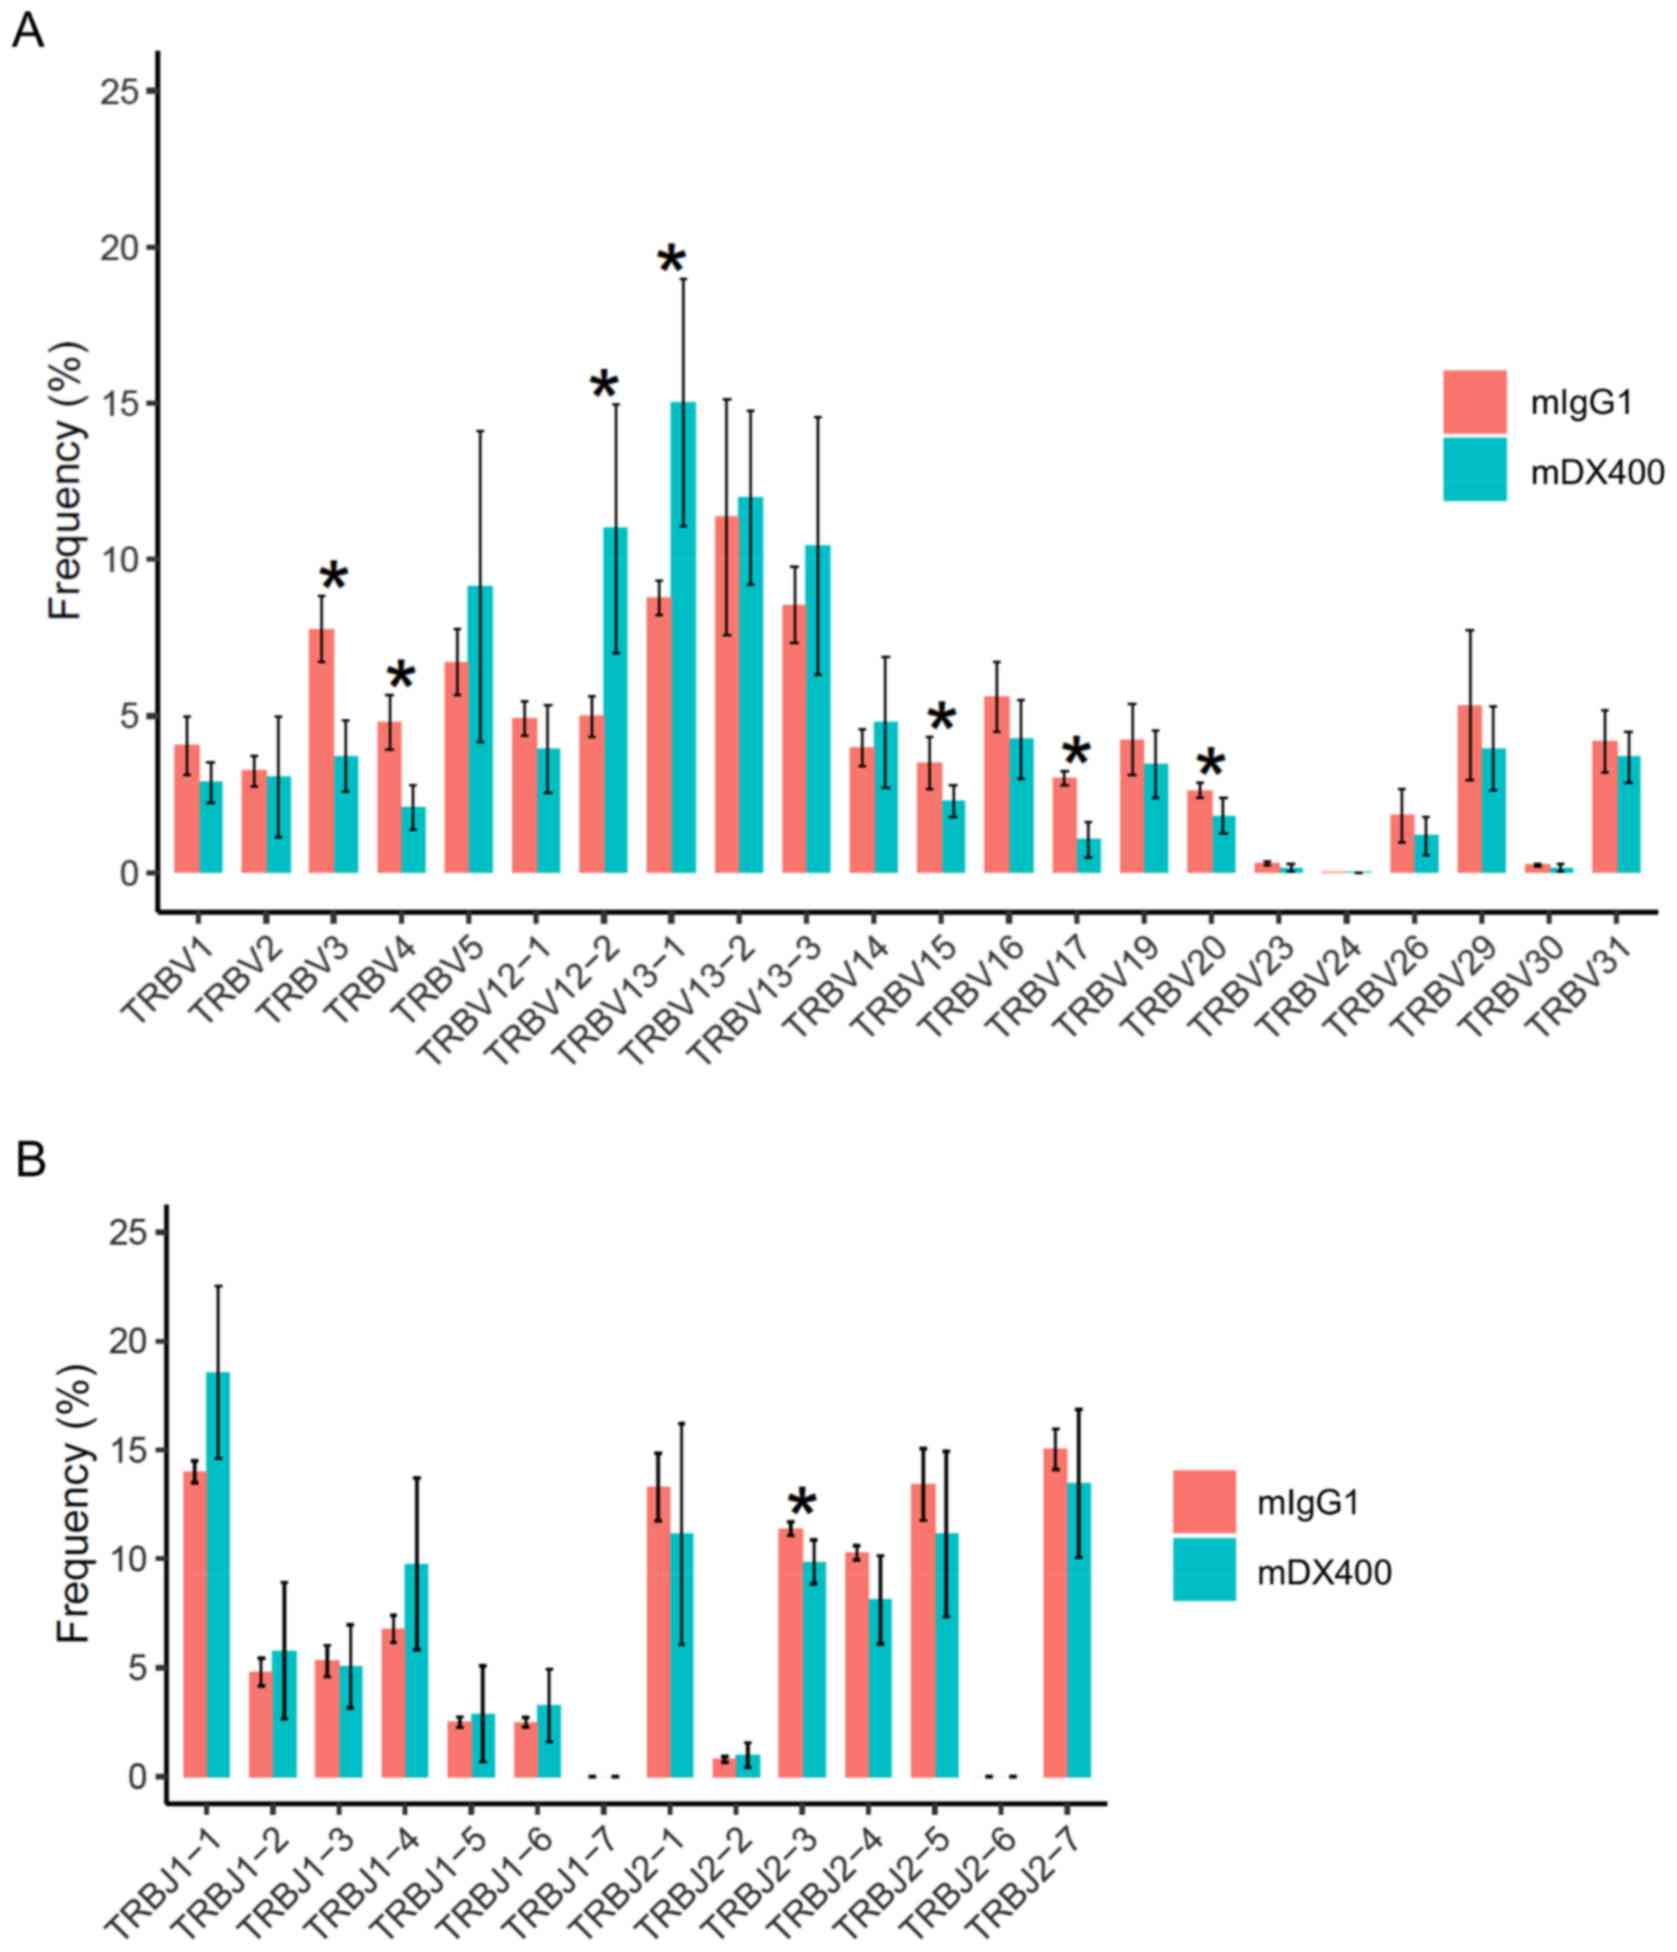
For TCR repertoires, comparing tumor samples between
the two treatment groups showed that frequencies of seven TRBV
genes and one TRBJ gene were significantly different (FDR<0.05),
including TRBV12-2, TRBV13-1, TRBV3, TRBV4, TRBV15, TRBV17, TRBV20
and TRBJ2-3, with the first two TRBV genes (TRBV12-2 and TRBV13-1)
more frequent in mDX400-group tumors (Fig. 2A and B). In addition, TRBV19 was
expressed at a significantly (FDR<0.01) higher frequency in
mDX400-group spleen samples compared with mIgG1-group spleen
samples (data not shown). As for BCR repertoires, no significant
differences in the usage frequencies of IgHV or IgHJ genes were
detected between the two treatment groups derived from any of the
three tissues (data not shown).
Regarding the CDR3 lengths of TCR/BCR repertoires,
no significant differences were detected between the two treatment
groups derived from any of the three tissues. For TCR repertoires
in any tissue and BCR repertoires in DLN, the average CDR3 length
is 12 amino acids. For BCR repertoires in the tumor and spleen, the
average CDR3 length is 11 amino acids (Fig. S3).
Clonal diversity and tissue
distribution of TCR repertoires
The intratumoral TCR repertoires of mDX400-treated
mice had significantly lower qD values (FDR<0.01)
compared with those of mIgG1-treated mice at each q from 0 to 30,
indicating lower TCR repertoire diversity of mDX400-group tumors
(Fig. 3A). As diversity leveled
off after q=2, only q-values 1–10 are presented in Fig. 3A. In contrast, there were no
significant differences in the qD values of TCR
repertoires in DLN or spleen tissues between the two treatment
groups at any q value (Fig.
S4).
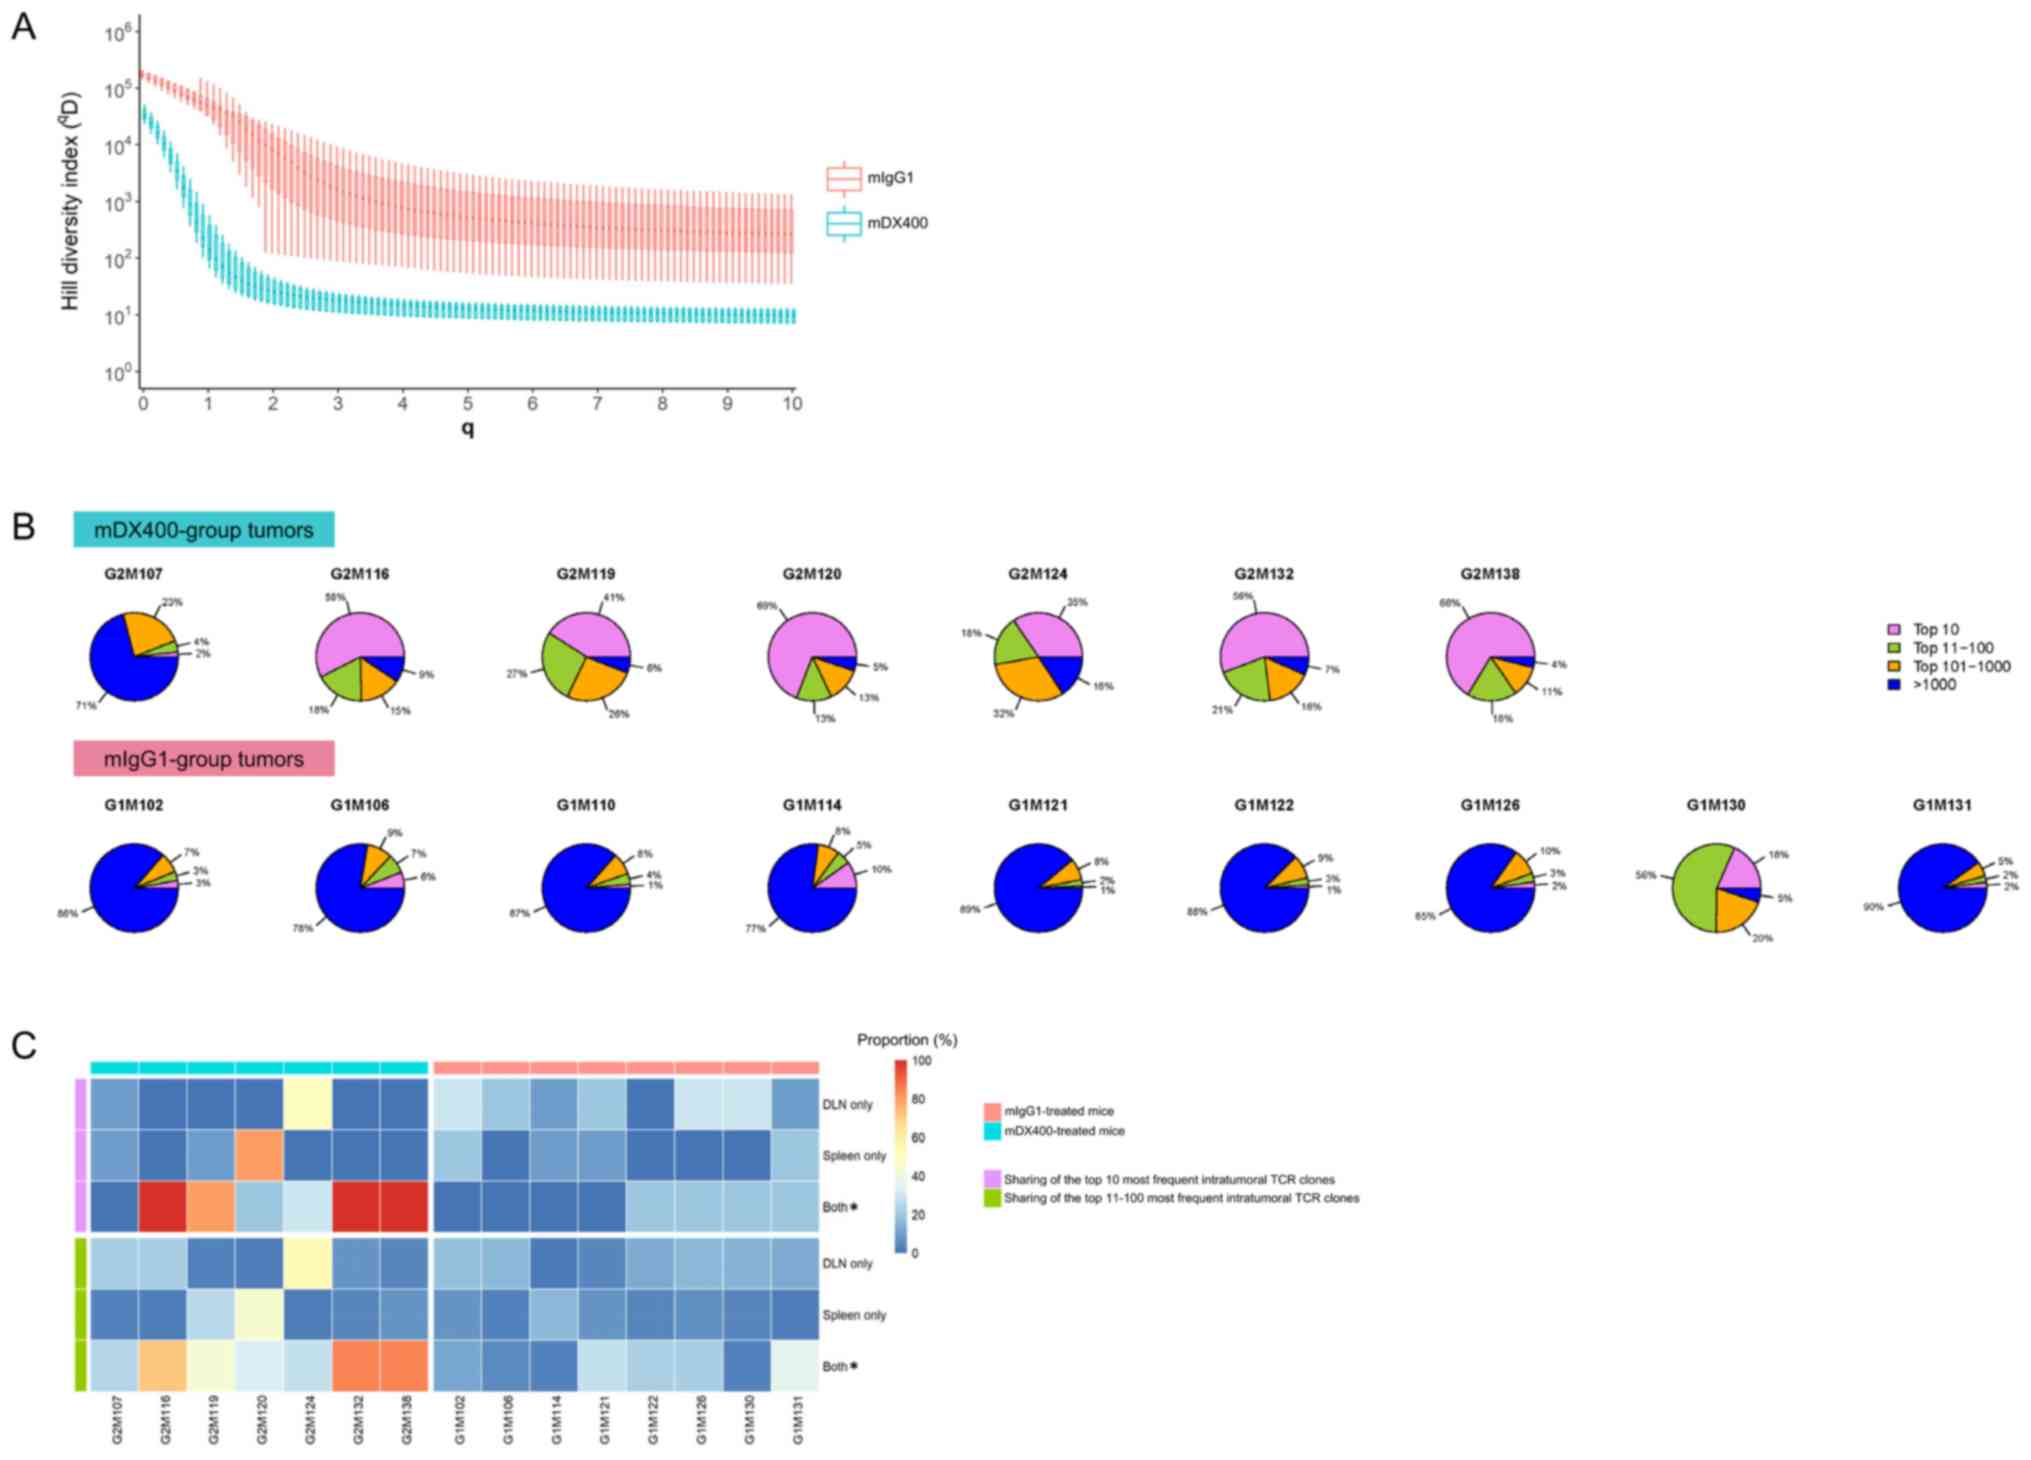 | Figure 3.Clonal diversity and tissue
distribution of TCR repertoires. (A) Hill diversity profiles of
intratumoral TCR repertoires. mDX400- and mIgG1-group tumor samples
are depicted in blue and red, respectively. The diversity profile
of each group is represented by a set of boxplots with each boxplot
displaying the diversity values in qD relative to a
certain q. The q values ranging from 0 to 10 in 0.1 increments are
shown on the plot. For each q, the Hill index value is
significantly (FDR<0.01) lower in mDX400- compared with
mIgG1-group tumor samples. The FDR values are not shown on the
plot. (B) Sectional proportions of intratumoral TCR clonotypes.
mDX400- and mIgG1-group tumor samples are shown in the upper and
lower row, respectively. For each pie chart, sections depicting the
proportions of the top 10, top 11–100, top 101–1,000 and >1,000
most frequent clonotypes are depicted in violet, green, orange and
blue, respectively. (C) Sharing of the most frequent intratumoral
TCR clonotypes across other tissues. The plot depicts the sharing
of the top 10 (marked with violet bars on the left side) and the
top 11–100 (marked with green bars on the left side) most frequent
intratumoral TCR clonotypes with DLN only, spleen only and both DLN
and spleen. mDX400-treated mice were marked with blue bars on top,
while mIgG1-treated mice were marked with red bars on top. The
scale of the proportions of shared TCR clonotypes are shown in the
color key. *P<0.05, mIgG1 vs. mDX400. TCR, T cell receptor;
mDX400, murine anti-PD-1; mIgG1, murine immunoglobulin G1; FDR,
false discovery rate; DLN, tumor draining lymph node. |
To further investigate the abundance profile of
intratumoral TCR clones between the two treatment groups, segmental
frequency distribution of TCR clones in each tumor sample was
calculated. It was found that the proportion of the top 10 most
frequent TCR clonotypes in mDX400-group tumors were significantly
greater (P<0.01) than that in mIgG1-group tumors, with an
average proportion of 46.7% vs. 5.5% (Fig. 3B). In addition, there was also a
significant increase in the cumulative frequencies of the top
11–100 (P<0.05) and top 101–1,000 (P<0.01) TCR clonotypes and
a significant decrease in the cumulative frequencies of >1,000
TCR clonotypes (P<0.01) by frequency in the mDX400-group tumor
samples compared with the mIgG1-group tumor samples.
Distribution and frequencies of intratumoral TCR
clonotypes in other tissues were also investigated. On average, 60%
of the top 10 most frequent TCR clonotypes in mDX400-group tumors
can also be detected both in the spleen and DLN of the
corresponding mice, which is significantly (P<0.05) higher than
that (10%) in mIgG1-group tumors (Fig.
3C). As to the top 10 most frequent intratumoral TCR clonotypes
irrespective of treatments, the frequency of every shared TCR
clonotype is higher in the tumor compared to the corresponding
spleen or DLN with enrichment up to 232,829 and 35,877 folds,
respectively, and mean enrichment of 4,972 and 2,073 folds,
respectively. Likewise, 53% of the top 11–100 most frequent TCR
clonotypes in mDX400-group tumors can also be detected in both the
spleen and DLN of the corresponding mice, which is significantly
(P<0.05) higher than that (16%) in mIgG1-group tumors (Fig. 3C).
TCR clones consistently expanded in
mDX400-group tumor samples
As mDX400-group tumors had significantly more
focused TCR repertoires, highly frequent TCR clones consistently
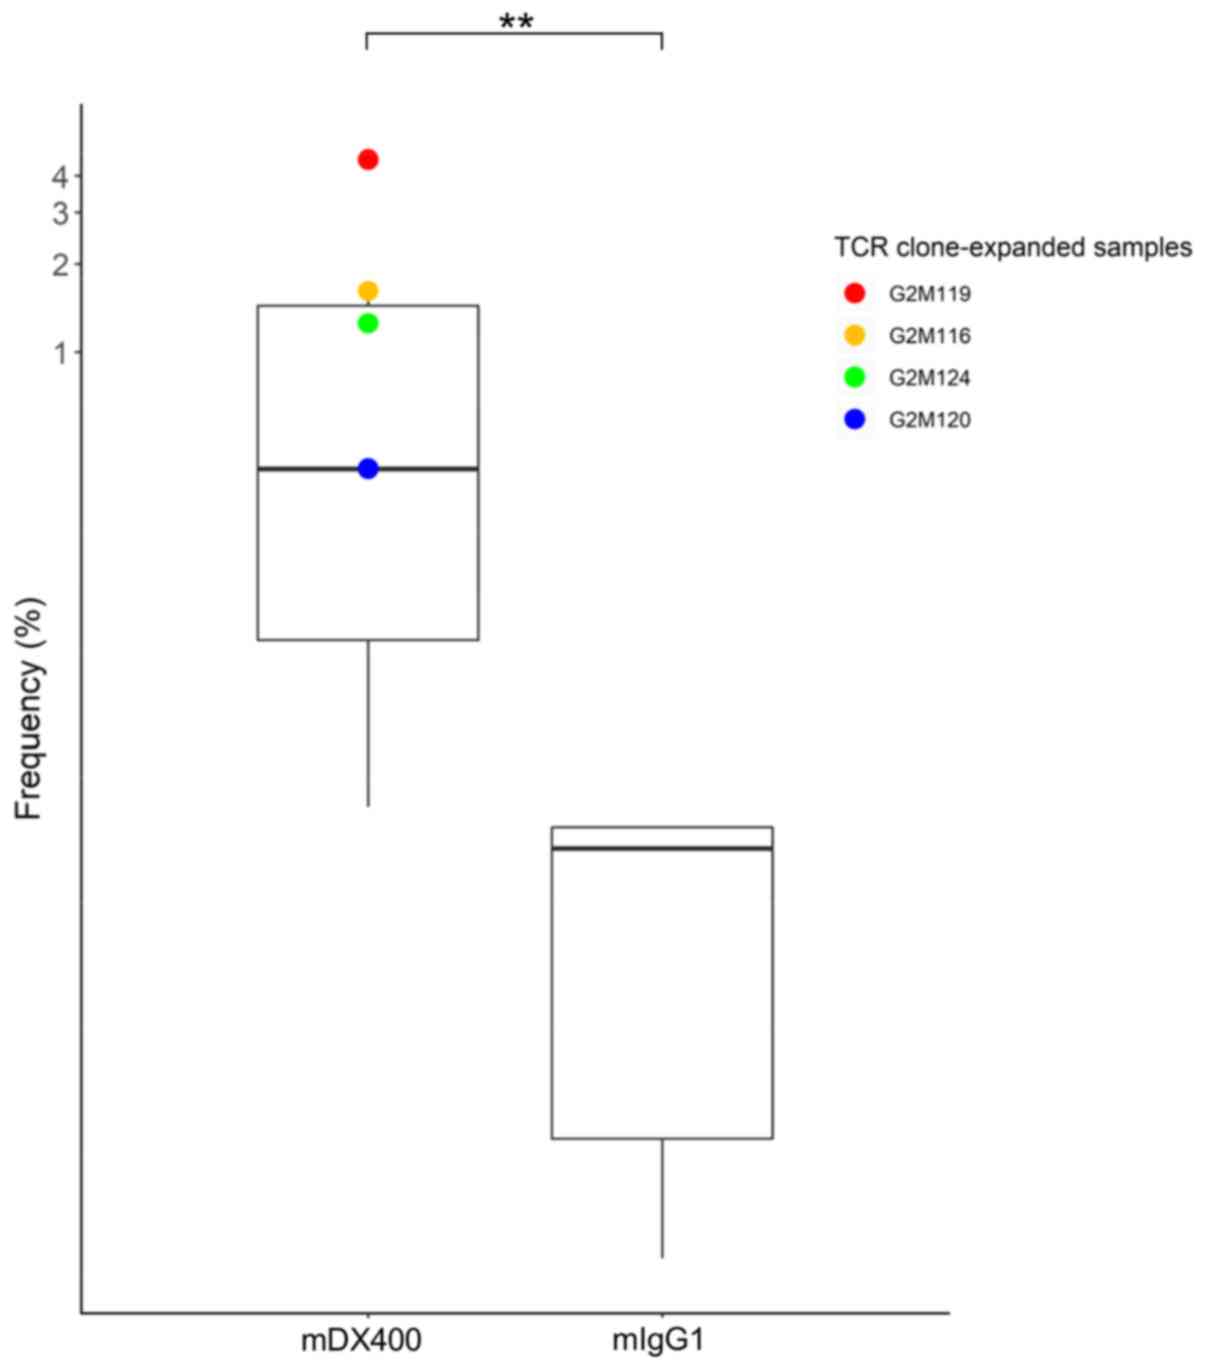
expanded in mDX400-group tumors were investigated. One TCR clone
with CDR3 sequence ASSPDRGDTEVF, as well as VJ genes TRBV15 and
TRBJ1-1, was significantly upregulated in mDX400-group tumors
compared with mIgG1-group tumors (P<0.01) and was expanded in
four of the seven mDX400-group tumor samples (G2M119, G2M116,
G2M124 and G2M120; Fig. 4). The
clone was also present in the spleen and DLN of the two groups of
mice, with mean frequency of 0.02% for spleen samples of both
groups, as well as 0.07% and 0.009% for mIgG1- and mDX400-group DLN
samples, respectively. In mDX400-group mice the frequency of the
clone was significantly upregulated in the tumor samples compared
with the spleen (P<0.01) or DLN (P<0.001) samples. There were
no significant differences in the frequencies of the clone between
the tumor and spleen samples, or between the tumor and DLN samples
in mIgG1-group mice (data not shown). The clone was not recorded in
databases VDJdb (June 2018 release) or McPAS-TCR (April 2019
release), which are two curated databases of known antigen-specific
TCR sequences (30,31).
Mutation rate, clonal diversity and
tissue distribution of BCR Repertoires
To confirm that the B cells from different tissues
of the MC38 tumor model were antigen-driven, selection pressure was
quantified by analyzing mutation patterns in IgH sequences. This
analysis showed evidence of negative selection in the FWR3 and
positive selection in the CDR2 of all BCR repertoires, with
estimated selection strength significantly different from zero in
all cases (P<10−7), except selection strength in the
CDR2 of intratumoral BCR repertoires (P=0.16), which were
consistent with the characteristics of affinity-matured B cells
(Fig. S5). Further confirming the
antigen experience of the different BCR repertories of the MC38
tumor model, most of the BCR sequences from different repertoires
were distributed into clonal families. On average, >98% of tumor
BCR sequences were distributed into clonal families (Table SI). For spleen and DLN samples,
the mean proportions of BCR sequences belonging to clonal families
were 84% and 83%, respectively.
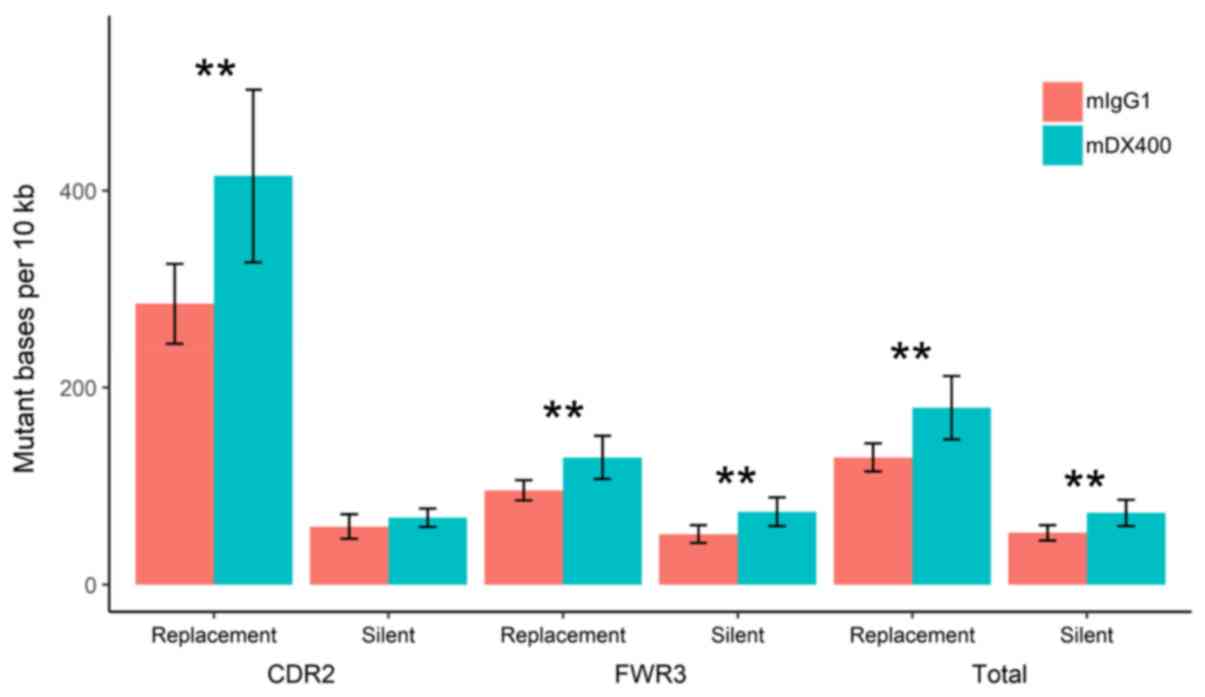
Analysis of mutations showed that the number of
replacement mutations per 104 bp in the CDR2, as well as
the number of silent and replacement mutations in the FWR3 (or in
the two regions together), were significantly higher in IgH
sequences from mDX400-group spleen samples compared with those from
mIgG1-group spleen samples (P<0.01; Fig. 5). In addition, as presented in
Fig. S6, the replacement mutation
rate shows a trend of upregulation in the CDR2 of IgH sequences
from mDX400-group tumor samples compared with those from
mIgG1-group tumor samples, although this was not statistically
significant.
In terms of BCR repertoire diversity, no significant
differences were detected between mDX400 and mIgG1 groups derived
from any of the three tissues, with no significant differences in
Hill diversity indices qD values detected at any q from
0 to 30 between the BCR repertoires of the two groups derived from
any of three tissues (Fig. S7).
As diversity leveled off after q=2, only q-values 1–10 are
presented in Fig. S7. On the
other hand, irrespective of treatments, the diversity of BCR
repertoire in tumor samples was significantly lower compared with
that in DLN (FDR<0.01) and spleen samples (FDR<0.01) based on
qD values at any q from 0 to 30 (Fig. S8). As diversity leveled off after
q=2, only q-values 1–10 are presented in Fig. S8. Analysis of tissue distribution
of BCR repertoires showed that there were no significant
differences in the number of intratumoral BCR clonal families
shared with BCR clones in spleen or DLN tissues between the two
treatment groups (Fig. S9).
Expansion of a BCR clonal family in
mDX400-group tumor samples
By analyzing BCR repertoire sequences, one BCR
clonal family was highly expanded in four of the seven mDX400-group
tumor samples (Table SII). The
clonal family was the most abundant clone in two mDX400-group tumor
samples (G2M107 and G2M138), accounting for 85.2% and 18.7% of the
total BCR sequences, respectively, and was the second most abundant
clone in another two mDX400-group tumor samples (G2M119 and
G2M124), constituting 14.9% and 7.4% of the BCR repertoires,
respectively (Fig. 6A and B). The
mean frequency of the clonal family in mDX400-group tumors was
10-fold greater than that of mIgG1-group tumors, and 55–470-fold
higher than that of other tissue samples, although the differences
in frequencies between mDX400- and mIgG1-group tumors were not
significant. The BCR clone and the aforementioned consistently
expanded TCR clone were co-expanded in two (G2M119 and G2M124) of
the seven mDX400-group tumor samples. Furthermore, in the tumor
samples of six mDX400-group mice, high expansion of the top 100
most frequent TCR clonotypes were detected, except that of G2M107
(Fig. 3B). On the contrary, it was
only in G2M107 that the extreme expansion, with a frequency of
85.2%, of the aforementioned BCR clone could be detected (Fig. 6B), suggesting that the extreme
expansion of the BCR clone may affect the expansion of the most
frequent TCR clones.
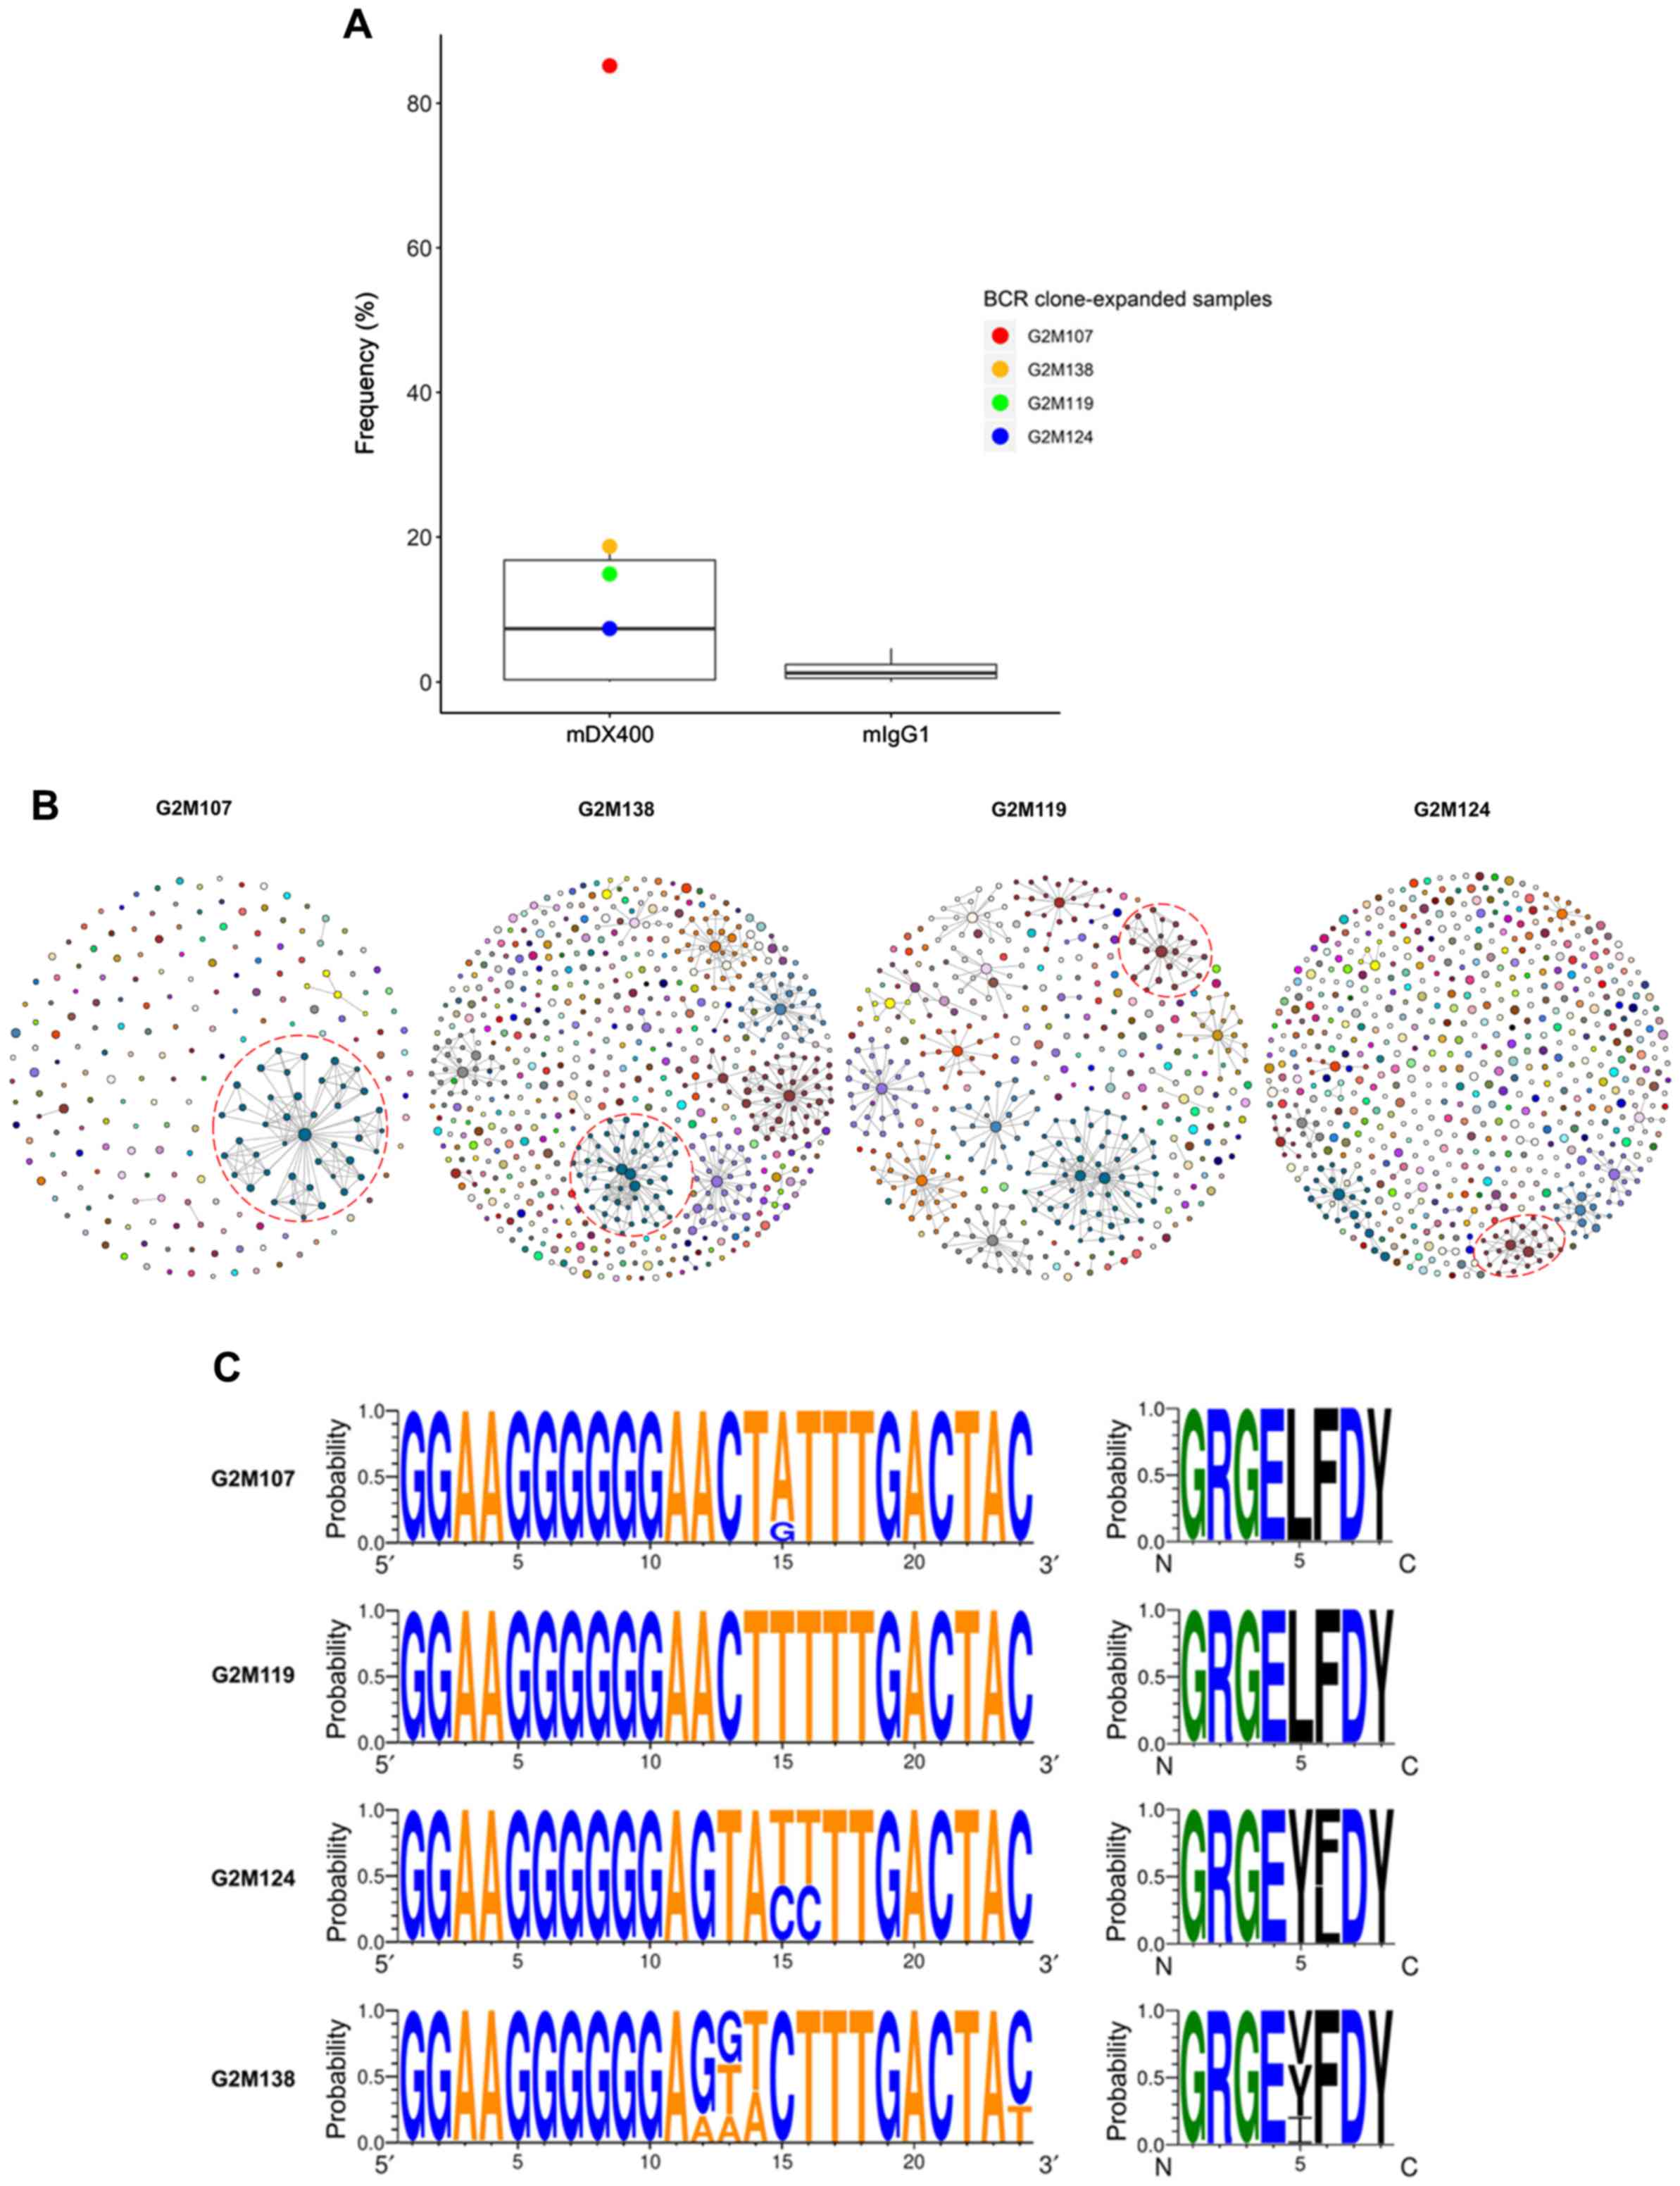 | Figure 6.BCR clone consistently expands in
mDX400-group tumor samples. (A) BCR clone was highly expanded in
four mDX400-group tumor samples, which are depicted by four dots in
red, yellow, green and blue, with each color representing an
mDX400-group tumor sample. (B) Intratumoral BCR clones of the four
mDX400-group tumor samples where the consistently expanded BCR
clone was expanded. For each sample, a clone with a unique
junctional sequence was displayed by a colored dot. A clone with
>1 unique junctional sequence is displayed by interconnected
dots of the same color. Each color corresponds to the frequency
rank of a clone and the size of a dot is proportional to the
abundance of the read. For each sample, the consistently expanded
BCR clone is enclosed by a red dashed circle. (C) Complementarity
determining region 3 nucleotide (left) and amino acid (right)
composition of the consistently expanded BCR clonal family. Logos
were created for each of the four mDX400-group tumor samples
G2M107, G2M119, G2M124 and G2M138 where the BCR clonal family
expanded. For each sequence logo, the height of symbols within a
stack indicates the probability of each symbol to occur at that
position. For nucleic acids, letter colors were used according to
number of Watson-Crick hydrogen bonds, while for amino acids,
letter colors correspond to hydrophobicity with hydrophilic,
neutral and hydrophobic amino acids represented by blue, green and
black colors, respectively. BCR, B cell receptor; mDX400, murine
anti-PD-1; mIgG1, murine immunoglobulin G1. |
The BCR clonal family contained significantly
(P<0.05) more silent mutations within the CDR2 of IgH sequences
from the four mDX400-group tumor samples where the clonal family
expanded compared with those from the other three mDX400-group
tumor samples where the clonal family was not expanded (Fig. S10). A lineage tree from the clonal
family was constructed for each of the four clone-expanded
mDX400-group tumor samples using the top 50 most frequent sequences
of variable region stretching from the beginning of CDR2 to the
start of CDR3 (Fig. S11). The
germline V and J genes of the clonal family are IGHV1-11 and IGHJ2.
The sequence logos of the CDR3 nucleotide and amino acid
composition of the clonal family for each of the four tumor samples
are shown in Fig. 6C.
Discussion
Previous studies demonstrated that the MC38 tumor
model is highly responsive to anti-PD-1 treatment (19–22).
To further understand the molecular mechanism underlying the high
response rate, the present study investigated the effects of
anti-PD-1 antibody on the adaptive immune receptor repertoires of
the MC38 tumor model in detail, an improved understanding of which
may facilitate the development of anti-PD-1 mAbs in precision
medicine for cancer.
In terms of T cell-mediated immunity, a significant
decrease in TCR repertoire diversity and a notable expansion of the
top 10 most frequent TCR clones were observed in mDX400-group
tumors. It has been previously reported that decreased TCR
repertoire diversity at both pre- and peri-treatment time points
was associated with an increased response to anti-PD-1 treatment in
patients with melanoma (10,11).
In addition, a consistently expanded TCR clonotype was detected in
mDX400-group tumors, which may be a tumor-reactive TCR clone
activated and expanded by mDX400 treatment. Several studies have
demonstrated that the most remarkably expanded TRB clonotypes in
CD8+ and CD8+PD-1+
tumor-infiltrating lymphocyte populations are tumor- and mutated
antigen-reactive in metastatic melanoma (32,33).
Further research is warranted to explore the interaction among the
consistently expanded TCR clone, anti-PD-1 mAbs and tumor
responses. It was observed that compared with mIgG1-treated mice,
there were significantly more intratumoral high-frequency TCR
clonotypes present both in DLN and spleen tissues of mDX400-treated
mice with the shared TCR clonotypes significantly enriched in
tumors. Similarly, Hosoi et al (34) also found that immunotherapy
increased the number of TCR clonotypes shared between the tumor and
spleen.
In addition to T cell responses, which are often the
main focus of immunotherapy, the present study also investigated B
cell responses of the MC38 model during checkpoint inhibition.
Analysis of selection pressure and proportion of clonal families
confirmed the antigen experience of different BCR repertoires of
the MC38 model. In addition, significantly higher mutation rates
were detected in the CDR2 and FWR3 of IgH sequences from the
mDX400-group spleen samples compared with those from the
mIgG1-group spleen samples. The spleen is a highly active site of B
cell antigen training. The significant upregulation of mutations in
IgH sequences from spleen samples induced by mDX400 treatment
suggested that mDX400 can modulate B cell immunity in the spleen.
The upregulation of mutations may increase the BCR affinity,
thereby enhancing antigen capture and presentation in the spleen,
which may be associated with tumor responses. Notably, Lehmann-Horn
et al (35) observed a more
pronounced antigen-driven process in the spleen and ectopic
lymphoid tissue, but not in the lymph node and blood, by examining
mutational patterns of mouse BCR repertoires. This is consistent
with the present finding that the mutational pattern of the spleen
is different from that of the DLN.
Quantification of the BCR repertoire diversity
revealed that irrespective of treatments the diversity of BCR
repertoires in tumor samples was significantly lower compared with
that in DLN and spleen samples, which is consistent with a previous
report (36). In addition, one BCR
clonal family was highly expanded in >50% of the mDX400-group
tumor samples, which may target public tumor antigens. In line with
the present results, in the blood plasmablasts of patients with
non-progressing cancer treated by anti-PD-1 or anti-CTLA-4, DeFalco
et al (37) also detected B
cell responses represented by increased somatic hypermutation and
clonal expansion. Furthermore, they demonstrated that the
anti-tumor B cell responses express shared antibody paratopes
targeting public tumor antigens. In the present study, the somatic
hypermutation and clonal expansion of B cells in the mDX400 group
suggested that anti-PD-1 treatment may promote activation of
humoral immunity. The activation of B cell responses may rely on
interleukin-21 and T follicular helper cells induced by ICIs, as
suggested by Hollern et al (15).
The BCR clone and the aforementioned consistently
expanded TCR clone were co-expanded in 29% of the mDX400-group
tumor samples, which may be related to tumor responses. Of note,
the extreme expansion of the BCR clone may affect the expansion of
the most frequent TCR clones, as the mouse with extreme expansion
of the BCR clone was the only mouse without the high expansion of
the top 100 most frequent TCR clones in the mDX400 group. The
inhibitory effect of the increased expansion of the BCR clone on
the expansion of high-frequency TCR clones needs to be further
confirmed with larger sample sizes.
As for CDR3 lengths, the present study showed that
applying anti-PD-1 had no effects on the CDR3 lengths of the
TCR/BCR repertoires. Similarly, cytokine-based immunotherapy of
murine CT26 colorectal tumors did not lead to significant changes
of CDR3 length distribution (38).
In addition, it has been reported that there is no correlation
between the CDR3 length distributions and genetic variability of
the CDR3 region (39), suggesting
that the repertoire divergence between the treatment and control
group in this study is not represented in terms of CDR3 length.
In summary, the effect of anti-PD-1 treatment on
immune repertoires of the MC38 tumor model were elucidated.
Anti-PD-1 treatment changed the usage frequency of some TRB VJ
genes, decreased the diversity of intratumoral TCR repertoires,
increased the proportion of intratumoral TCR clones that were
shared between tumor and peripheral immune organs, and induced the
expansion of a TCR and a BCR clone in >50% of tumors. In
addition, the consistently expanded TCR and BCR clone were
co-expanded in 29% of anti-PD-1-group tumor samples. Anti-PD-1
treatment also upregulated the mutation rates of IgH sequences in
spleen samples. These results showed that anti-PD-1 therapy
promoted the activation of both cellular and humoral immunity in
the MC38 model. The enhanced treatment efficacy in the MC38 model
may be attributed to the enrichment of the putative tumor-reactive
T and B cells, as well as increased BCR affinity in the spleen. As
MC38 is a valid model for hypermutated and/or MSI CRC, it can be
deduced that the molecular changes detected in the MC38 model may
mirror those occurring in patients with hypermutated and/or MSI
CRC. The decreased intratumoral TCR diversity, and the expansion of
TCR and BCR clones may be used as biomarkers for prognostic rates
in the clinical setting.
The present study also provided insights into novel
treatment strategies. The significantly expanded intratumoral TCR
clones induced by anti-PD-1 treatment may be reactive to tumor
antigens, which opens the possibility of employing tumor-reactive T
cell clones for adoptive T cell transfer as a passive immunization
option. It has been demonstrated that the combination of adoptive T
cell and anti-PD-1 immunotherapy potently enhances antitumor
efficacy in a mouse model (40).
There is also a possibility to develop cancer vaccines consisting
of immunogenic peptides derived from antigens of poorly immunogenic
tumors as an active immunization option. Vaccination with cancer
vaccines may stimulate immune responses that will offset the
inherently weak antigenicity of lowly immunogenic tumors. An early
clinical trial testing the effect of a combination of anti-PD-1
antibodies with p53-expressing modified vaccinia Ankara virus
vaccine in patients with advanced solid cancers showed encouraging
results; it worked by increasing the frequency and persistence of
p53-reactive CD8+ T cells (41). On the other hand, strategies
modulating B cell responses may also have potential to improve
treatment responses. Further investigation of the prognostic and
therapeutic values of the molecular changes detected in the present
study is warranted.
Supplementary Material
Supporting Data
Supporting Data
Supporting Data
Acknowledgements
The authors would like to thank Principal Scientist
Cai Li of Merck & Co., Inc. (Kenilworth, NJ, USA) for helpful
discussion and advice on the writing of the manuscript.
Funding
The present study was supported by Merck & Co.,
Inc.
Availability of data and materials
The datasets used and/or analyzed during the present
study are available from the corresponding author on reasonable
request.
Authors' contributions
BL and NS conceived and designed the study,
coordinated trials and provided data. IW coordinated the project
and contributed key scientific insights in the analysis and
interpretation of data. RC and GZ were involved in the analysis and
interpretation of data. LZ analyzed the data and drafted the
manuscript. All authors critically reviewed or revised the
manuscript. All authors read and approved the final manuscript.
Ethics approval and consent to
participate
The care and use of mice were reviewed and approved
by Merck's Institutional Animal Care and Use Committee prior to
conducting the study (approval no. 200321). During the study, the
care and use of animals was conducted in accordance with the
guidelines of the Association for Assessment and Accreditation of
Laboratory Animal Care.
Patient consent for publication
Not applicable.
Competing interests
LZ, IW, NS, RC, GZ and BL are employees or former
employees of Merck & Co., Inc., Kenilworth, NJ, USA.
References
|
1
|
Hamid O, Robert C, Daud A, Hodi FS, Hwu
WJ, Kefford R, Wolchok JD, Hersey P, Joseph R, Weber JS, et al:
Five-year survival outcomes for patients with advanced melanoma
treated with pembrolizumab in KEYNOTE-001. Ann Oncol. 30:582–588.
2019. View Article : Google Scholar : PubMed/NCBI
|
|
2
|
Gandhi L, Rodríguez-Abreu D, Gadgeel S,
Esteban E, Felip E, De Angelis F, Domine M, Clingan P, Hochmair MJ,
Powell SF, et al KEYNOTE-189 Investigators, : Pembrolizumab plus
Chemotherapy in Metastatic Non-Small-Cell Lung Cancer. N Engl J
Med. 378:2078–2092. 2018. View Article : Google Scholar : PubMed/NCBI
|
|
3
|
Bauml J, Seiwert TY, Pfister DG, Worden F,
Liu SV, Gilbert J, Saba NF, Weiss J, Wirth L, Sukari A, et al:
Pembrolizumab for platinum- and cetuximab-refractory head and neck
cancer: Results from a single-arm, phase II study. J Clin Oncol.
35:1542–1549. 2017. View Article : Google Scholar : PubMed/NCBI
|
|
4
|
Sarfaty M, Hall PS, Chan KKW, Virik K,
Leshno M, Gordon N, Moore A, Neiman V, Rosenbaum E and Goldstein
DA: Cost-effectiveness of Pembrolizumab in Second-line Advanced
Bladder Cancer. Eur Urol. 74:57–62. 2018. View Article : Google Scholar : PubMed/NCBI
|
|
5
|
Carretero-González A, Lora D, Ghanem I,
Zugazagoitia J, Castellano D, Sepúlveda JM, López-Martin JA,
Paz-Ares L and de Velasco G: Analysis of response rate with ANTI
PD1/PD-L1 monoclonal antibodies in advanced solid tumors: A
meta-analysis of randomized clinical trials. Oncotarget.
9:8706–8715. 2018. View Article : Google Scholar : PubMed/NCBI
|
|
6
|
Le DT, Durham JN, Smith KN, Wang H,
Bartlett BR, Aulakh LK, Lu S, Kemberling H, Wilt C, Luber BS, et
al: Mismatch repair deficiency predicts response of solid tumors to
PD-1 blockade. Science. 357:409–413. 2017. View Article : Google Scholar : PubMed/NCBI
|
|
7
|
Yarchoan M, Hopkins A and Jaffee EM: Tumor
Mutational burden and response rate to PD-1 inhibition. N Engl J
Med. 377:2500–2501. 2017. View Article : Google Scholar : PubMed/NCBI
|
|
8
|
Garon EB, Rizvi NA, Hui R, Leighl N,
Balmanoukian AS, Eder JP, Patnaik A, Aggarwal C, Gubens M, Horn L,
et al KEYNOTE-001 Investigators, : Pembrolizumab for the treatment
of non-small-cell lung cancer. N Engl J Med. 372:2018–2028. 2015.
View Article : Google Scholar : PubMed/NCBI
|
|
9
|
Ayers M, Lunceford J, Nebozhyn M, Murphy
E, Loboda A, Kaufman DR, Albright A, Cheng JD, Kang SP, Shankaran
V, et al: IFN-γ-related mRNA profile predicts clinical response to
PD-1 blockade. J Clin Invest. 127:2930–2940. 2017. View Article : Google Scholar : PubMed/NCBI
|
|
10
|
Tumeh PC, Harview CL, Yearley JH, Shintaku
IP, Taylor EJ, Robert L, Chmielowski B, Spasic M, Henry G, Ciobanu
V, et al: PD-1 blockade induces responses by inhibiting adaptive
immune resistance. Nature. 515:568–571. 2014. View Article : Google Scholar : PubMed/NCBI
|
|
11
|
Roh W, Chen P-L, Reuben A, Spencer CN,
Prieto PA, Miller JP, Gopalakrishnan V, Wang F, Cooper ZA, Reddy
SM, et al: Integrated molecular analysis of tumor biopsies on
sequential CTLA-4 and PD-1 blockade reveals markers of response and
resistance. Sci Transl Med. 9:eaah35602017. View Article : Google Scholar : PubMed/NCBI
|
|
12
|
Minervina A, Pogorelyy M and Mamedov I:
T-cell receptor and B-cell receptor repertoire profiling in
adaptive immunity. Transpl Int. 32:1111–1123. 2019. View Article : Google Scholar : PubMed/NCBI
|
|
13
|
Agata Y, Kawasaki A, Nishimura H, Ishida
Y, Tsubata T, Yagita H and Honjo T: Expression of the PD-1 antigen
on the surface of stimulated mouse T and B lymphocytes. Int
Immunol. 8:765–772. 1996. View Article : Google Scholar : PubMed/NCBI
|
|
14
|
Thibult ML, Mamessier E, Gertner-Dardenne
J, Pastor S, Just-Landi S, Xerri L, Chetaille B and Olive D: PD-1
is a novel regulator of human B-cell activation. Int Immunol.
25:129–137. 2013. View Article : Google Scholar : PubMed/NCBI
|
|
15
|
Hollern DP, Xu N, Thennavan A, Glodowski
C, Garcia-Recio S, Mott KR, He X, Garay JP, Carey-Ewend K, Marron
D, et al: B cells and T follicular helper cells mediate response to
checkpoint inhibitors in high mutation burden mouse models of
breast cancer. Cell. 179:1191–1206.e21. 2019. View Article : Google Scholar : PubMed/NCBI
|
|
16
|
Selitsky SR, Mose LE, Smith CC, Chai S,
Hoadley KA, Dittmer DP, Moschos SJ, Parker JS and Vincent BG:
Prognostic value of B cells in cutaneous melanoma. Genome Med.
11:362019. View Article : Google Scholar : PubMed/NCBI
|
|
17
|
Helmink BA, Reddy SM, Gao J, Zhang S,
Basar R, Thakur R, Yizhak K, Sade-Feldman M, Blando J, Han G, et
al: B cells and tertiary lymphoid structures promote immunotherapy
response. Nature. 577:549–555. 2020. View Article : Google Scholar : PubMed/NCBI
|
|
18
|
Olson B, Li Y, Lin Y, Liu ET and Patnaik
A: Mouse Models for cancer immunotherapy research. Cancer Discov.
8:1358–1365. 2018. View Article : Google Scholar : PubMed/NCBI
|
|
19
|
Hossain DMS, Javaid S, Cai M, Zhang C,
Sawant A, Hinton M, Sathe M, Grein J, Blumenschein W, Pinheiro EM,
et al: Dinaciclib induces immunogenic cell death and enhances
anti-PD1-mediated tumor suppression. J Clin Invest. 128:644–654.
2018. View
Article : Google Scholar : PubMed/NCBI
|
|
20
|
Ngiow SF, Young A, Jacquelot N, Yamazaki
T, Enot D, Zitvogel L and Smyth MJ: A threshold level of intratumor
CD8+ T-cell PD1 expression dictates therapeutic response to
anti-PD1. Cancer Res. 75:3800–3811. 2015. View Article : Google Scholar : PubMed/NCBI
|
|
21
|
Homet Moreno B, Zaretsky JM, Garcia-Diaz
A, Tsoi J, Parisi G, Robert L, Meeth K, Ndoye A, Bosenberg M,
Weeraratna AT, et al: Response to Programmed cell death-1 blockade
in a murine melanoma syngeneic model requires costimulation, CD4,
and CD8 T Cells. Cancer Immunol Res. 4:845–857. 2016. View Article : Google Scholar : PubMed/NCBI
|
|
22
|
Grasselly C, Denis M, Bourguignon A, Talhi
N, Mathe D, Tourette A, Serre L, Jordheim LP, Matera EL and
Dumontet C: The Antitumor activity of combinations of cytotoxic
chemotherapy and immune checkpoint inhibitors is model-dependent.
Front Immunol. 9:21002018. View Article : Google Scholar : PubMed/NCBI
|
|
23
|
Efremova M, Rieder D, Klepsch V,
Charoentong P, Finotello F, Hackl H, Hermann-Kleiter N, Löwer M,
Baier G, Krogsdam A, et al: Targeting immune checkpoints
potentiates immunoediting and changes the dynamics of tumor
evolution. Nat Commun. 9:322018. View Article : Google Scholar : PubMed/NCBI
|
|
24
|
National Research Council (US) Committee
for the Update of the Guide for the Care and Use of Laboratory
Animals, . Guide for the Care and Use of Laboratory Animals. (8th).
National Academies Press. (Washington, DC). 2011.
|
|
25
|
Masella AP, Bartram AK, Truszkowski JM,
Brown DG and Neufeld JD: PANDAseq: Paired-end assembler for
illumina sequences. BMC Bioinformatics. 13:312012. View Article : Google Scholar : PubMed/NCBI
|
|
26
|
Giudicelli V, Chaume D and Lefranc MP:
IMGT/GENE-DB: A comprehensive database for human and mouse
immunoglobulin and T cell receptor genes. Nucleic Acids Res.
33:D256–D261. 2005. View Article : Google Scholar : PubMed/NCBI
|
|
27
|
Ye J, Ma N, Madden TL and Ostell JM:
IgBLAST: An immunoglobulin variable domain sequence analysis tool.
Nucleic Acids Res. 41((W1)): W34–40. 2013. View Article : Google Scholar : PubMed/NCBI
|
|
28
|
Gupta NT, Vander Heiden JA, Uduman M,
Gadala-Maria D, Yaari G and Kleinstein SH: Change-O: A toolkit for
analyzing large-scale B cell immunoglobulin repertoire sequencing
data. Bioinformatics. 31:3356–3358. 2015. View Article : Google Scholar : PubMed/NCBI
|
|
29
|
Hill MO: Diversity and Evenness: A
unifying notation and its consequences. Ecology. 54:427–432. 1973.
View Article : Google Scholar
|
|
30
|
Shugay M, Bagaev DV, Zvyagin IV, Vroomans
RM, Crawford JC, Dolton G, Komech EA, Sycheva AL, Koneva AE, Egorov
ES, et al: VDJdb: A curated database of T-cell receptor sequences
with known antigen specificity. Nucleic Acids Res. 46(D1):
D419–D427. 2018. View Article : Google Scholar : PubMed/NCBI
|
|
31
|
Tickotsky N, Sagiv T, Prilusky J, Shifrut
E and Friedman N: McPAS-TCR: A manually curated catalogue of
pathology-associated T cell receptor sequences. Bioinformatics.
33:2924–2929. 2017. View Article : Google Scholar : PubMed/NCBI
|
|
32
|
Gros A, Robbins PF, Yao X, Li YF, Turcotte
S, Tran E, Wunderlich JR, Mixon A, Farid S, Dudley ME, et al: PD-1
identifies the patient-specific CD8+ tumor-reactive
repertoire infiltrating human tumors. J Clin Invest. 124:2246–2259.
2014. View Article : Google Scholar : PubMed/NCBI
|
|
33
|
Pasetto A, Gros A, Robbins PF, Deniger DC,
Prickett TD, Matus-Nicodemos R, Douek DC, Howie B, Robins H,
Parkhurst MR, et al: Tumor- and Neoantigen-reactive T-cell
receptors can be identified based on their frequency in fresh
tumor. Cancer Immunol Res. 4:734–743. 2016. View Article : Google Scholar : PubMed/NCBI
|
|
34
|
Hosoi A, Takeda K, Nagaoka K, Iino T,
Matsushita H, Ueha S, Aoki S, Matsushima K, Kubo M, Morikawa T, et
al: Increased diversity with reduced “diversity evenness” of tumor
infiltrating T-cells for the successful cancer immunotherapy. Sci
Rep. 8:10582018. View Article : Google Scholar : PubMed/NCBI
|
|
35
|
Lehmann-Horn K, Wang SZ, Sagan SA, Zamvil
SS and von Büdingen HC: B cell repertoire expansion occurs in
meningeal ectopic lymphoid tissue. JCI Insight. 1:e872342016.
View Article : Google Scholar : PubMed/NCBI
|
|
36
|
Katoh H, Komura D, Konishi H, Suzuki R,
Yamamoto A, Kakiuchi M, Sato R, Ushiku T, Yamamoto S, Tatsuno K, et
al: Immunogenetic profiling for gastric cancers identifies sulfated
glycosaminoglycans as major and functional b cell antigens in human
malignancies. Cell Rep. 20:1073–1087. 2017. View Article : Google Scholar : PubMed/NCBI
|
|
37
|
DeFalco J, Harbell M, Manning-Bog A, Baia
G, Scholz A, Millare B, Sumi M, Zhang D, Chu F, Dowd C, et al:
Non-progressing cancer patients have persistent B cell responses
expressing shared antibody paratopes that target public tumor
antigens. Clin Immunol. 187:37–45. 2018. View Article : Google Scholar : PubMed/NCBI
|
|
38
|
Probst P, Stringhini M and Neri D:
Immunotherapy of CT26 murine tumors is characterized by an
oligoclonal response against the AH1 tumor rejection antigen.
bioRxiv. doi.org/10.1101/789784.
|
|
39
|
Rock EP, Sibbald PR, Davis MM and Chien
YH: CDR3 length in antigen-specific immune receptors. J Exp Med.
179:323–328. 1994. View Article : Google Scholar : PubMed/NCBI
|
|
40
|
John LB, Devaud C, Duong CP, Yong CS,
Beavis PA, Haynes NM, Chow MT, Smyth MJ, Kershaw MH and Darcy PK:
Anti-PD-1 antibody therapy potently enhances the eradication of
established tumors by gene-modified T cells. Clin Cancer Res.
19:5636–5646. 2013. View Article : Google Scholar : PubMed/NCBI
|
|
41
|
Chung V, Kos FJ, Hardwick N, Yuan Y, Chao
J, Li D, Waisman J, Li M, Zurcher K, Frankel P, et al: Evaluation
of safety and efficacy of p53MVA vaccine combined with
pembrolizumab in patients with advanced solid cancers. Clin Transl
Oncol. 21:363–372. 2019. View Article : Google Scholar : PubMed/NCBI
|