Introduction
Colon cancer accounts for the third highest
incidence of cancer in the world, and its mortality rate is also
increasing (1). Previous studies
have revealed that a family or personal history of colorectal
cancer, colorectal polyps or chronic inflammatory bowel disease are
the most common risk factors for colorectal cancer (2–4).
Despite the development of early diagnostic techniques, more than
25% of patients present with metastases when they are diagnosed
(5). Notably ~50% of patients with
colon cancer will exhibit recurrence and succumb to the disease
within 5 years; although chemotherapy and targeted therapy have
significantly improved the efficacy of treatment, the internal
mechanism underlying colon cancer tumorigenesis has yet to be
elucidated (6). Hence, it is
imperative to study the molecular mechanism underlying colon cancer
and identify novel biomarkers to improve the prognosis of patients
with colon cancer.
The competing endogenous (ce)RNA network hypothesis
was proposed by Salmena et al (7) as early as 2011 and ceRNA represents a
novel mechanism of gene expression regulation. The ceRNA hypothesis
is a supplement to the traditional micro(mi)RNA regulation of RNA
theory, and there is a reverse RNA to miRNA action mode, that is,
ceRNAs, through miRNA response elements (MREs), compete for the
same miRNAs, to regulate the expression of target genes. Recently,
the molecules that influence ceRNA networks include long non-coding
(lnc)RNAs, pseudogenes, circular (circ)RNAs and other molecules
(8–10). Numerous experimental studies have
supported the theory of ceRNA network regulation (11,12).
For example, PTEN, SNHG6, lncRNA-H19 and other molecules
regulate the expression of corresponding target genes and influence
the occurrence and progression of cancer through their conservative
3′UTR competitive adsorption of miRNA molecules (7,13).
In the present study, the disciplinary advantages of
molecular biology and bioinformatics were integrated in order to
construct a molecular regulatory network in colon cancer, with
lncRNA at the core, which may provide evidence to improve
understanding of the mechanism underpinning the occurrence and
progression of colon cancer. Similarly, the current methodology
provides a novel concept for the study of other cancer-associated
mechanisms.
Materials and methods
Data source and processing
The RNA-Seq V2 data and corresponding clinical
information of patients with colon cancer were downloaded from The
Cancer Genome Atlas (TCGA) data portal (https://tcga-data.nci.nih.gov/tcga/). Registration
data from a total of 546 patients were retrieved; 75 patients were
excluded because they had only clinical information and not
sequencing data. Finally, 471 patients with complete clinical and
sequencing information were included in the present study. Of the
471 patients, 41 had paracancerous tissues which were sequenced
simultaneously. The mRNA and miRNA sequencing data were processed
using R software (R version 3.5.2; http://www.R-project.org/), and any lncRNAs with a
description from Ensembl (https://asia.ensembl.org/index.html) were selected for
further study. The data of human miRNA-target gene interaction were
retrieved from the TargetScan (http://www.targetscan.org/vert_72/), miRDB (http://www.mirdb.org/) (14), PITA (https://genie.weizmann.ac.il/pubs/mir07/mir07
_data.html) and miRanda databases (http://miranda.org.uk/), and the lncRNA-miRNA
interaction data came from the miRcode (http://www.mircode.org/) (15), StarBase (http://starbase.sysu.edu.cn/) and lncBase databases
(http://carolina.imis.athena-innovation.gr/diana_tools/web/index.php?r-lncbasev2%2Findex)
(16). RNA-seq profile data and
the clinical characteristics of colon cancer are available on
open-access databases; therefore, there was no requirement for
approval by the local ethics committee.
miRNA-mRNA interactive data
acquisition
The interaction data of human miRNA- target genes
were downloaded from TargetScan, miRDB, PITA and miRanda databases.
The miRNA-mRNA interacting pairs common to >3 databases were
selected as credible miRNA-target gene pairs. Among them,
TargetScan, miRanda and PITA are miRNA-gene symbol interacting
pairs, while miRDB is miRNA-refseq ID interacting pairs. Therefore,
refseq ID was converted to gene symbols via the hg38 annotation
file. Then, if the miRNA-mRNA interacting pair was common to >3
databases, it was regarded as a significant miRNA-mRNA interacting
pair. Finally, the interacting pairs were de-duplicated.
miRNA-lncRNA interactive data
acquisition
The human lncRNA-miRNA interaction data was
downloaded from three databases (miRcode, StarBase and lncBase),
and the lncRNA-miRNA interacting pairs common to >2 databases
were selected as lncRNA-miRNA interacting pairs. Finally, the
repeated interacting pairs were removed.
Data acquisition of lncRNA-mRNA
expression profiles in colon cancer
The RNASeqV2 data were downloaded from TCGA
database. First, the expression values of genes with the same gene
name were selected as the mean value, and the lncRNA expression
profile and mRNA expression profile were obtained by separating
RNA.
Construction of the ceRNA network
Using the target interacting database, it was
considered that the number of shared target miRNA between lncRNA
and mRNA was >3 and the hypergeometric test false discovery rate
(FDR) <0.01 was the cutoff used to identify potential
lncRNA-mRNA ceRNA interacting pairs. The Spearman correlation
coefficient of potential lncRNA-mRNA ceRNA pairs was calculated
using the lncRNA and mRNA expression profile of colon cancer. An R
>0, adjusted P-value <0.01, lncRNA-mRNA relationship combined
with its shared miRNA constituted a competitive endogenous RNA
network of lncRNA-miRNA-mRNA in colon cancer.
Analysis of ceRNA network
properties
Cytoscape was used for ceRNA network presentation
(17), and Molecular Complex
Detection (MCODE) was used to identify four modules in the ceRNA
network (17). The topological
properties of the network were analyzed (degree distribution,
clustering coefficient and hub analysis), in which hub miRNA and
hub lncRNA were selected as the core regulatory factors of colon
cancer, and hub mRNA was selected as the core gene of colon cancer.
Then, the random walk algorithm was used to mine the function
factor (lncRNA/miRNA/mRNA) in the ceRNA network. Furthermore,
enrichR was used to analyze the function and pathway of the genes
(18). Finally, hub mRNA and
lncRNA were selected for survival analysis using the UALCAN
database (http://ualcan.path.uab.edu/index.html) to verify that
whether they could be used as a prognostic biomarker of colon
cancer (19).
Identifying the lncRNA-miRNA-mRNA
regulatory axis of colon cancer from extracted lncRNA-miRNA-mRNA
interaction pairs using GEO datasets
GEPIA (http://gepia.cancer-pku.cn/) was used to analyze the
ceRNA interacting pairs extracted from a colon cancer dataset
(20). Person correlation analysis
was conducted on lncRNA and mRNA, to obtain the most positive
correlation between lncRNA and mRNA relationship pairs. Next,
LncACTdb 2.0 (http://www.bio-bigdata) was used to
verify the regulatory association between lncRNA and miRNA that had
been validated by relevant experiments (21), and finally the GSE26334 dataset was
used to verify the regulatory association between miRNA and mRNA
(22). The expression of mRNAs,
lncRNAs and miRNAs in LoVo colon cancer lines was determined using
R and visualized using GGPLOT2 3.1.0 (https://cran.r-project.org/web/packages/ggplot2/index.html).
Target set of core regulators and
functional enrichment analysis of core genes
The target genes (target set) of the core regulatory
factors of top 10 were screened, and the function and pathway
enrichment of the target genes were analyzed using enrichR. Then,
enrichR was used to analyze the function and pathway of core genes
in colon cancer.
Drug design
The core genes of colon cancer were combined with
all the drugs on Drugbank5.0 (https://www.drugbank.ca) (23), and significance analysis was
performed using a hypergeometric test to identify the drugs that
may have therapeutic effect on colon cancer.
Statistical analysis
Student's t test was used to estimate the
significance of difference in gene expression levels between
groups. The t-test was performed using a PERL script with
Comprehensive Perl Archive Network (CPAN) module ‘Statistics: T
Test’.
Available TCGA patient survival data were used for
Kaplan-Meier survival analyses and to generate overall survival
plots. The P-value obtained from log-rank test was used to indicate
statistical significance of survival correlation between groups
(19). P<0.05 was considered to
indicate a statistically significant difference.
Results
Characteristics of the subjects
included in the study
The detailed clinical and pathological
characteristics of all the 546 colon cancer patients downloaded
from TCGA are listed in Table
I.
 | Table I.Clinicopathological characteristics
of all the 546 patients with colon cancer downloaded from TCGA. |
Table I.
Clinicopathological characteristics
of all the 546 patients with colon cancer downloaded from TCGA.
| Clinical
features | Patients n (%) |
|---|
| Age (years) |
|
|
>67 | 302 (55.31) |
|
≤67 | 244 (44.69) |
| Sex |
|
|
Male | 284 (52.01) |
|
Female | 262 (47.99) |
| Pathology
stage |
|
| I | 86 (15.75) |
| II | 219 (40.11) |
|
III | 152 (27.84) |
| IV | 78 (14.29) |
|
Unknown | 11 (2.01) |
| Pathology M
stage |
|
| M0 | 398 (72.89) |
| M1 | 78 (14.29) |
| MX | 62 (11.36) |
|
Unknown | 8 (1.47) |
| Pathology N
stage |
|
| N0 | 323 (59.16) |
| N1 | 124 (22.71) |
| N2 | 99 (18.13) |
| Pathology T
stage |
|
| T1 | 11 (2.01) |
| T2 | 90 (16.48) |
| T3 | 377 (69.05) |
| T4 | 67 (12.27) |
| TX | 1 (0.18) |
Screening miRNA-mRNA interaction
pairs
The human miRNA-target gene interaction data were
downloaded from four databases (TargetScan, miRDB, PITA and
miRanda). If the miRNA-mRNA interacting pair appeared in >3
databases, it was included as a miRNA-mRNA interacting pair. As a
result, 160,345 miRNA-mRNA interacting pairs were selected.
Screening lncRNA-miRNA interaction
pairs
The human lncRNA-miRNA interaction data was
downloaded from three databases including miRcode, StarBase,
lncBase, and the lncRNA-miRNA interacting pairs that appeared in
more than two databases were selected as lncRNA-miRNA interacting
pairs. Finally, 3,158 lncRNA-miRNA interacting pairs were
obtained.
Construction of the ceRNA network
Identification of candidate ceRNA
interacting pairs
Combined with the miRNA-mRNA interacting pair and
lncRNA-miRNA interacting pair data, if each pair of lncRNA and mRNA
sharedthe same miRNA, the lncRNA and mRNA were connected as an
interacting pair. Using the R package, the hypergeometric test was
applied to calculate the significance of association between lncRNA
and mRNA pairs and miRNAs for each pair of lncRNA and mRNA. The
parameters were as follows: Q, the number of miRNAs shared by the
lncRNA and mRNA to be tested; k, number of miRNAs interacting with
the gene to be tested; m, number of miRNAs interacting with the
lncRNA to be tested; and n, total number of miRNAs minus the number
of miRNAs to be tested. lncRNA-mRNA interacting pairs with the
number of shared target miRNA >3 and FDR <0.01 between
lncRNAs and mRNAs were selected as potential ceRNA interacting
pairs. Eventually, 28,668 potential ceRNA interactions were
obtained.
Acquisition of the candidate ceRNA
interaction pairs
The Spearman correlation coefficient of each
potential lncRNA-mRNA ceRNA pair was calculated using the lncRNA
and mRNA expression profile in colon cancer. If R>0, the
lncRNA-mRNA association of P-adjusted <0.01 was identified as a
ceRNA network of lncRNA-mRNA in colon cancer. Finally, a total of
6,933 colon cancer lncRNA-miRNA-mRNA interaction pairs and 1,258
colon cancer lncRNA-mRNA interaction pairs were identified.
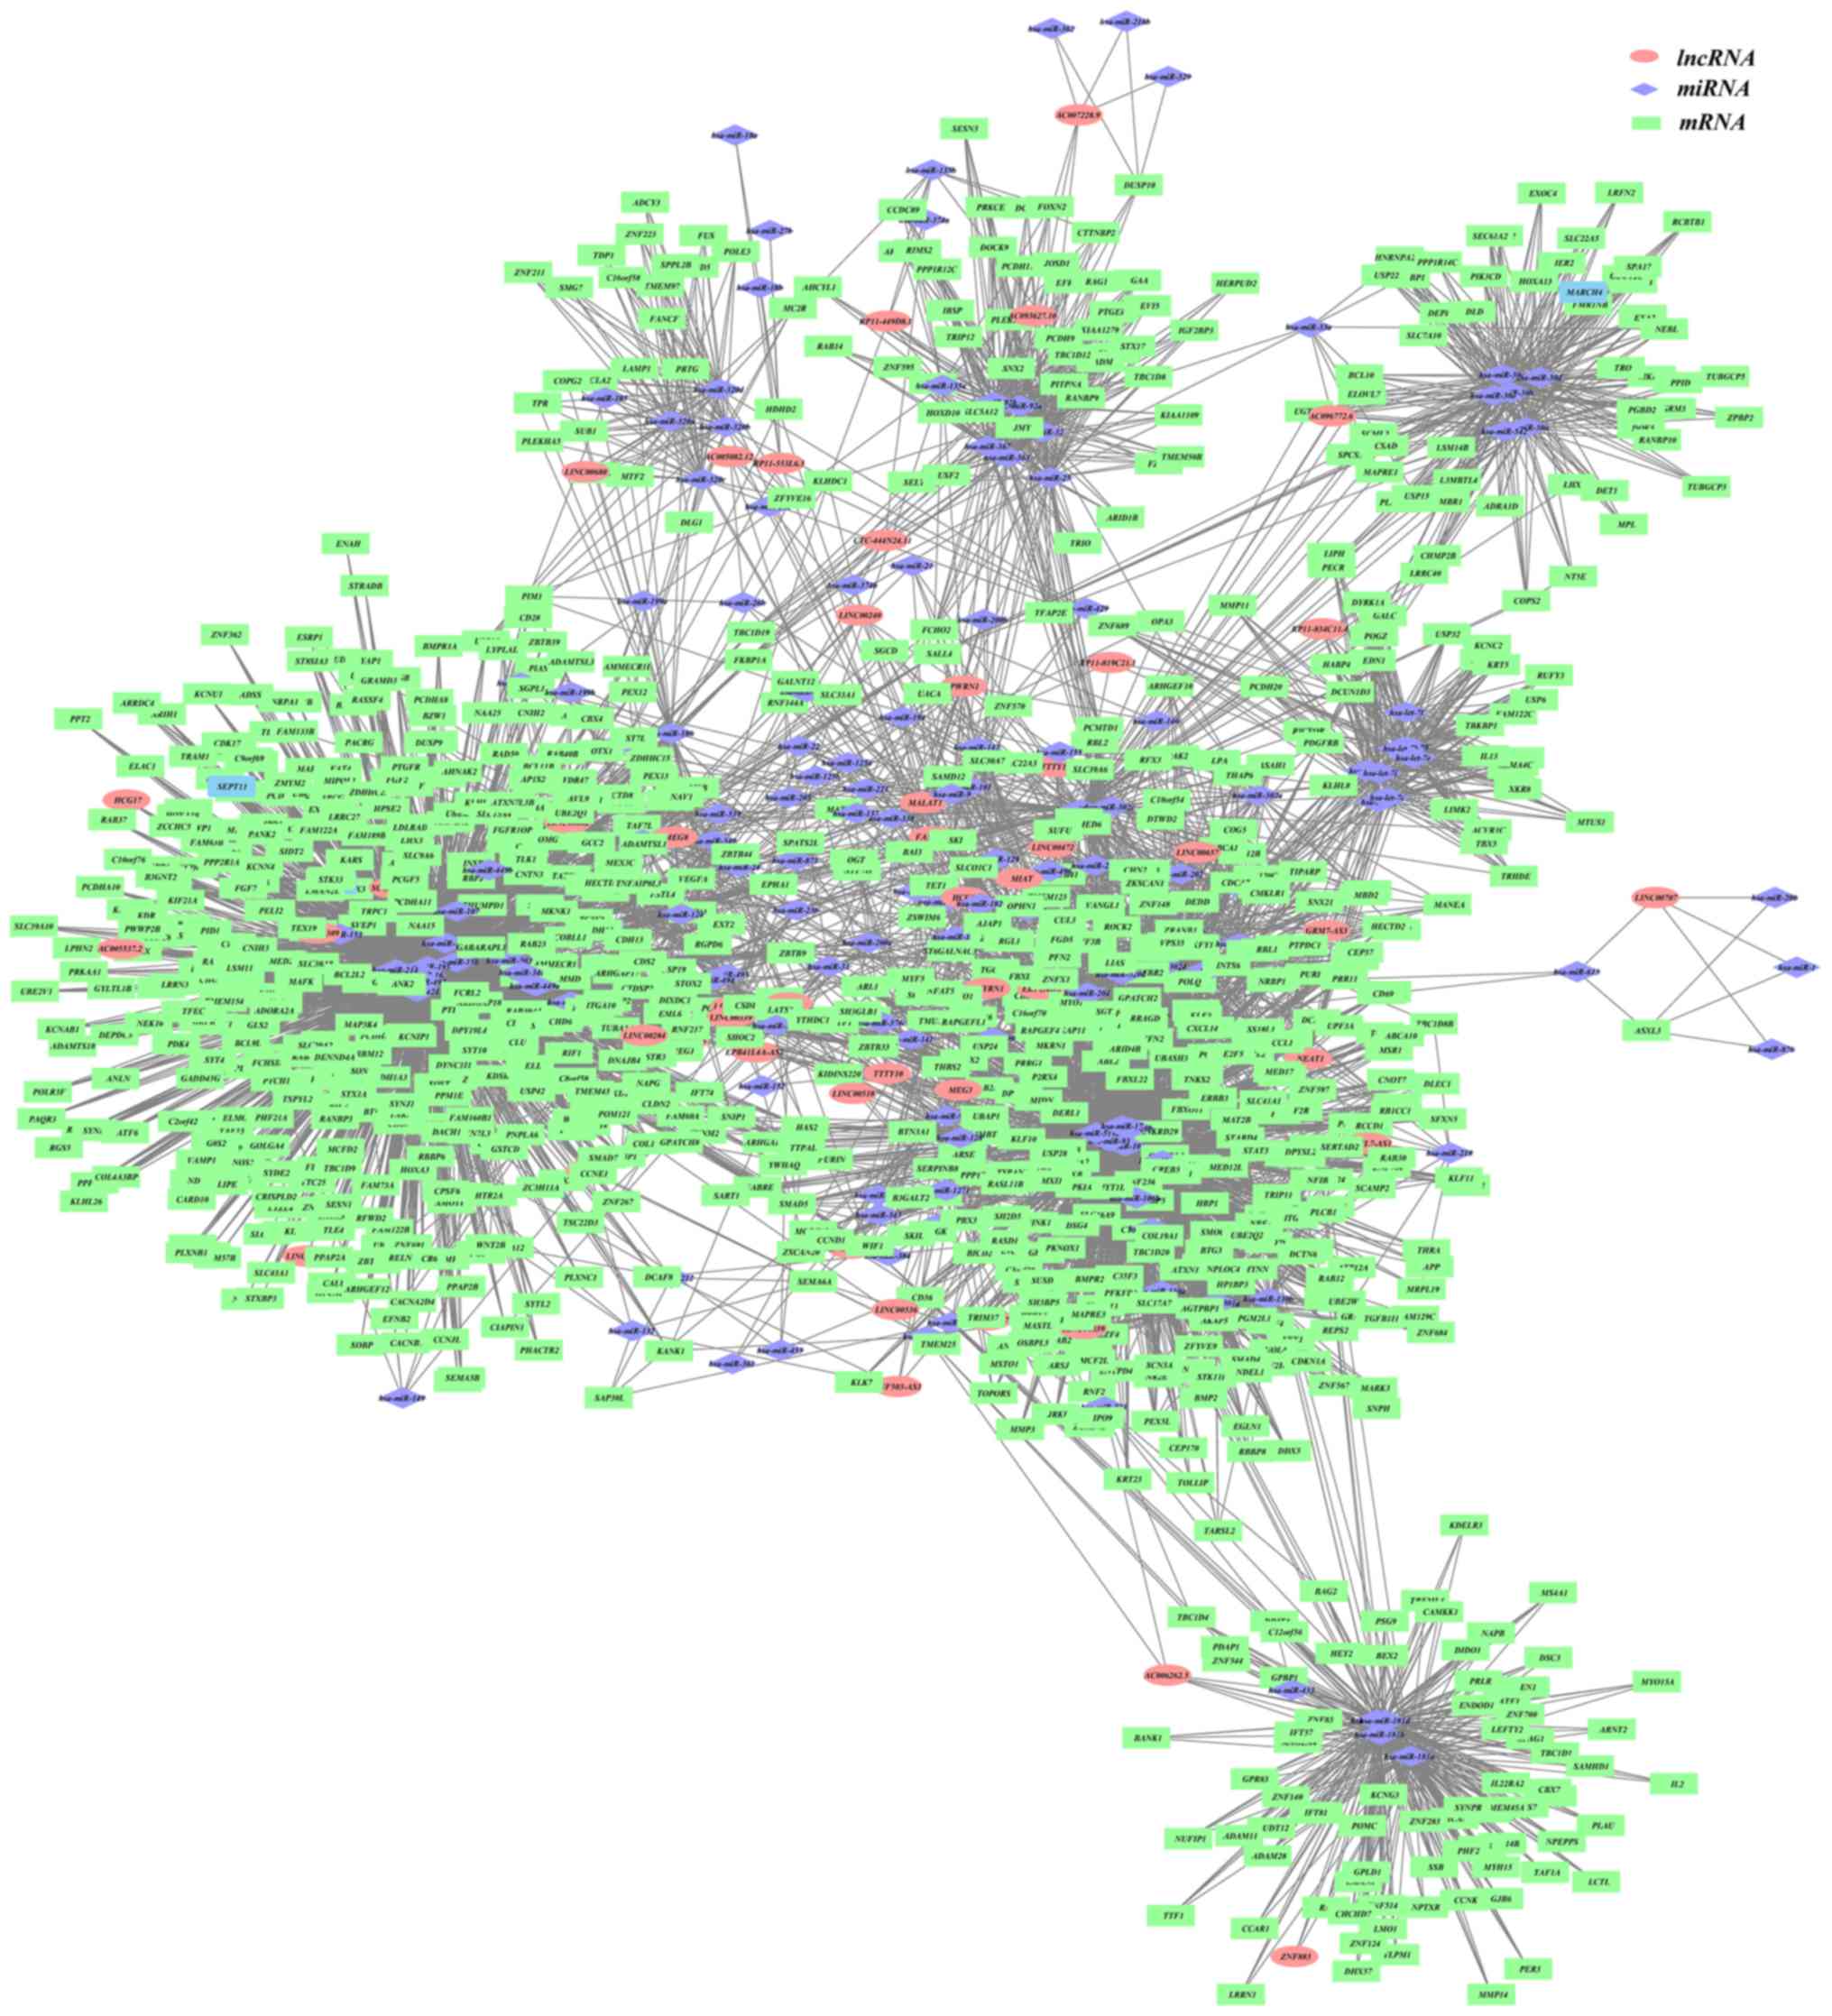
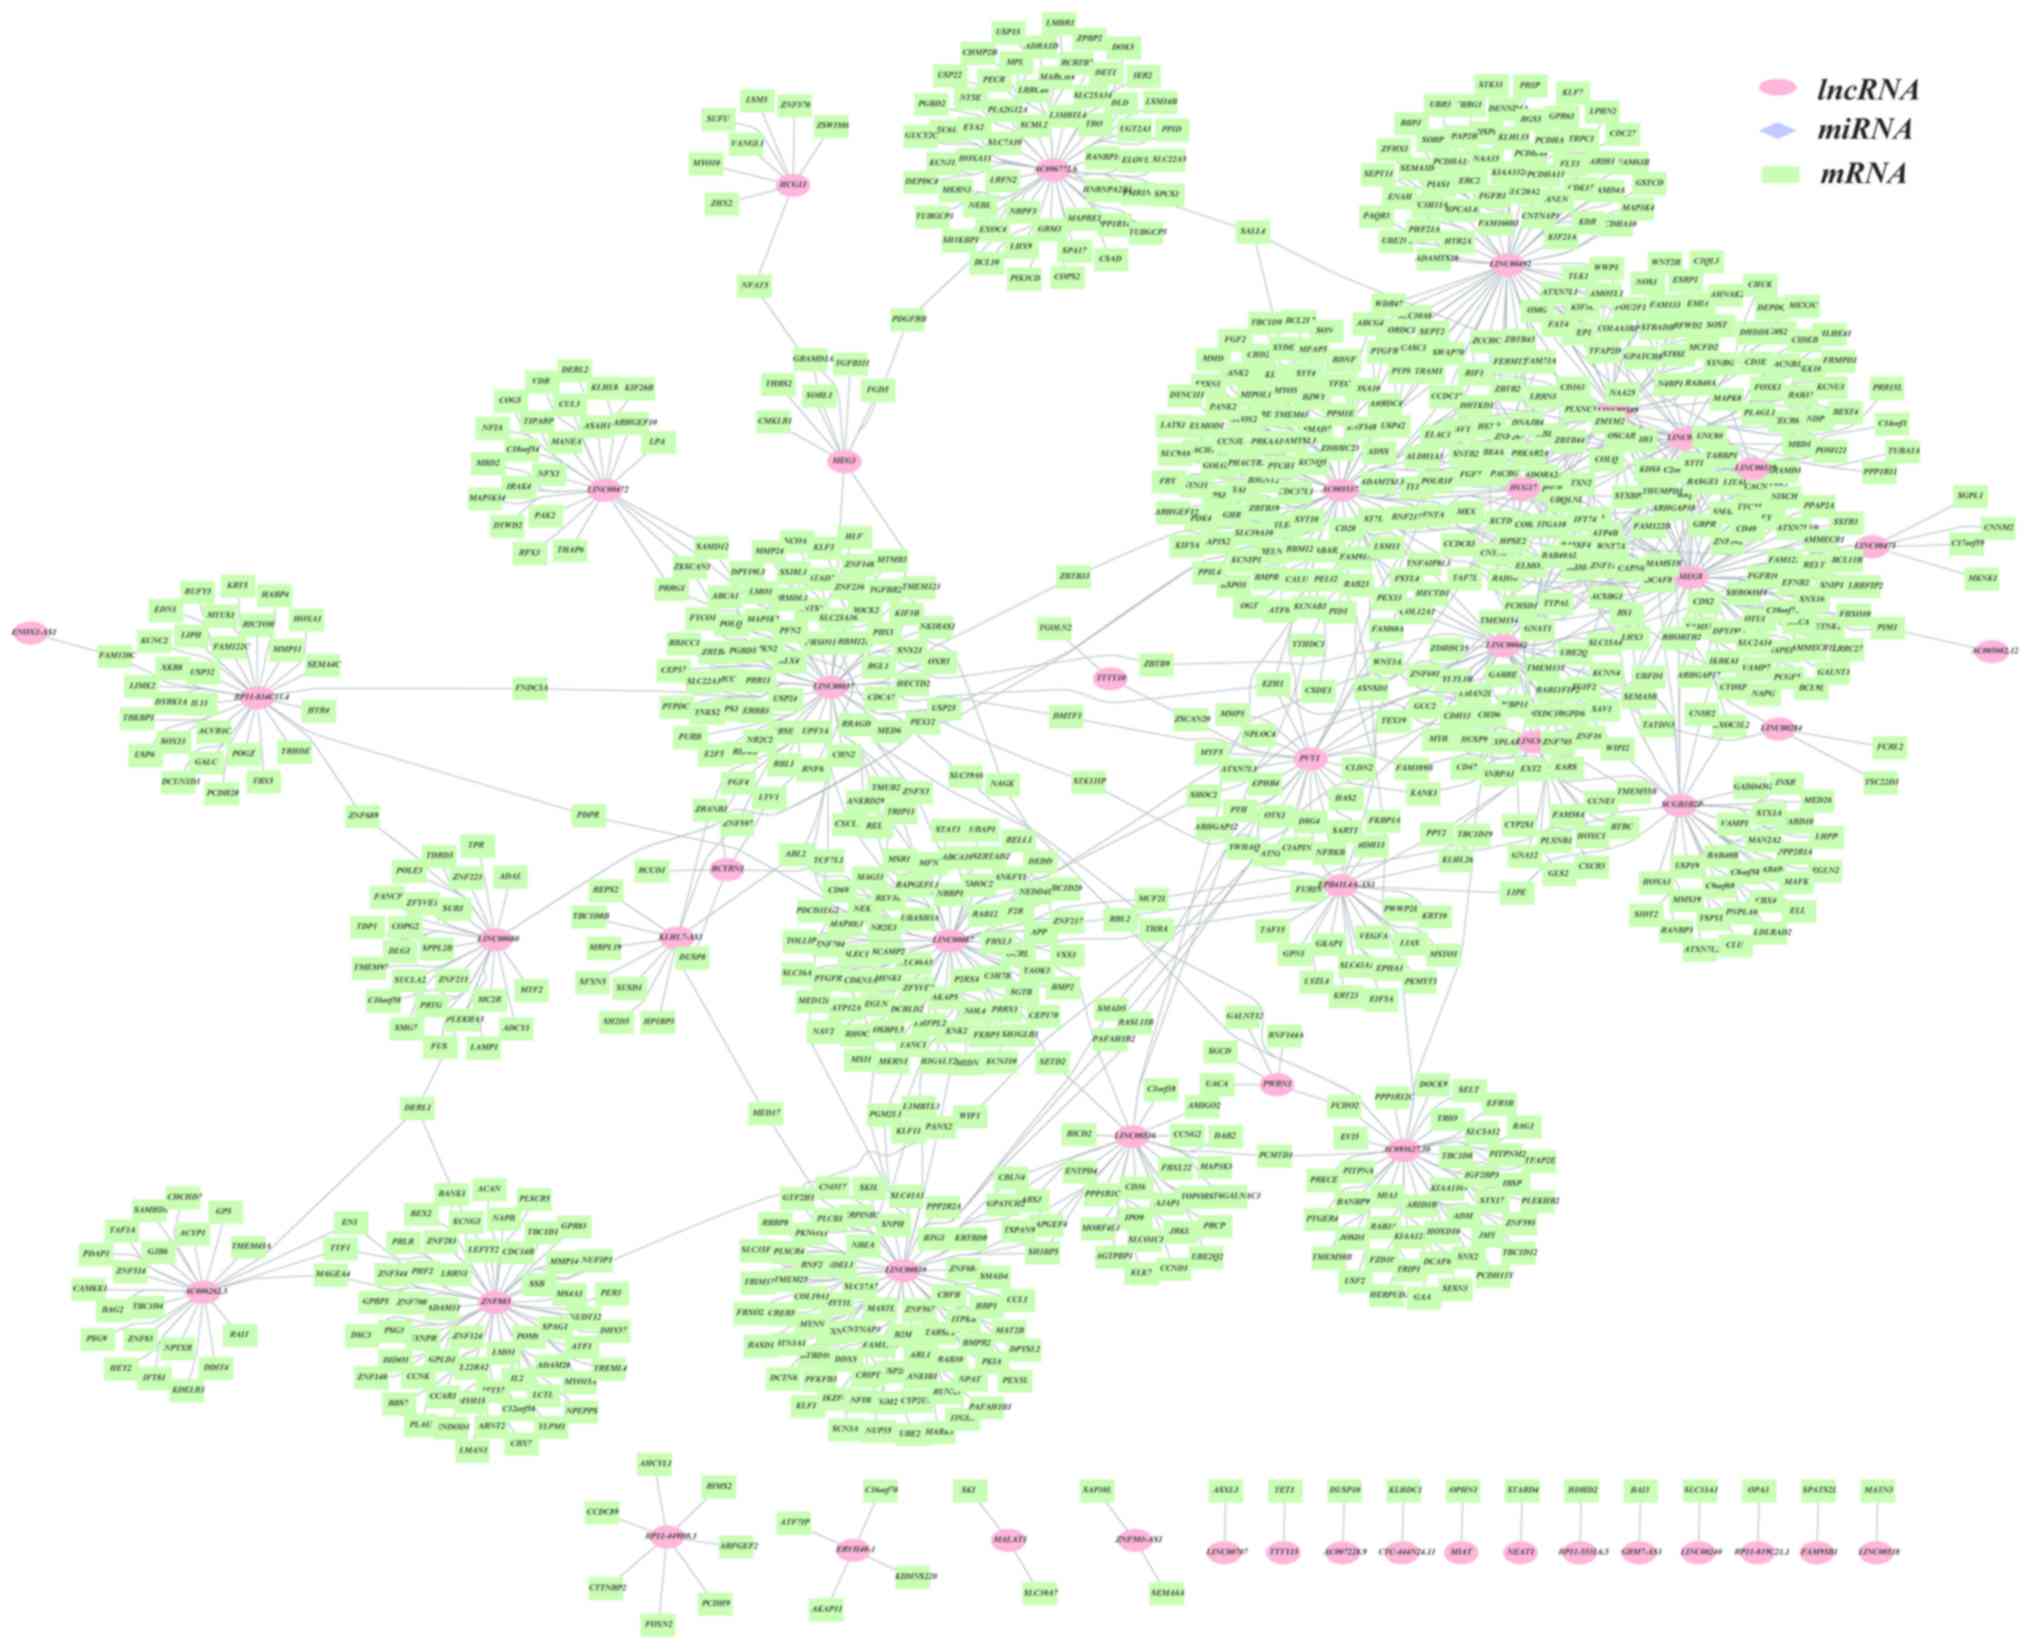
Display of the ceRNA network and
analysis of topological properties in colon cancer
Cytoscape was utilized to demonstrate the colon
cancer ceRNA network (lncRNA-miRNA-mRNA), as displayed in Fig. 1. The binary network (lncRNA-mRNA)
is shown in Fig. 2.
In the present study, the topological properties of
the network were analyzed in the network shown in Fig. 1. The miRNA with a degree >10 was
selected as the hub miRNA, the lncRNA with a degree >10 was
selected as the hub lncRNA and the mRNA with a degree >10 was
selected as the hub mRNAs. Finally, a total of 17 hub lncRNAs, 87
hub miRNAs and 144 hub genes of colon cancer were included
(Table SI). MCODE was used to
identify four modules in the ceRNA network, and the module diagram
is presented in Figs. S1-4. The
random walk algorithm was used to find the important nodes in the
ceRNA network. The functional enrichment analysis of the genes was
as listed in Fig. 3.
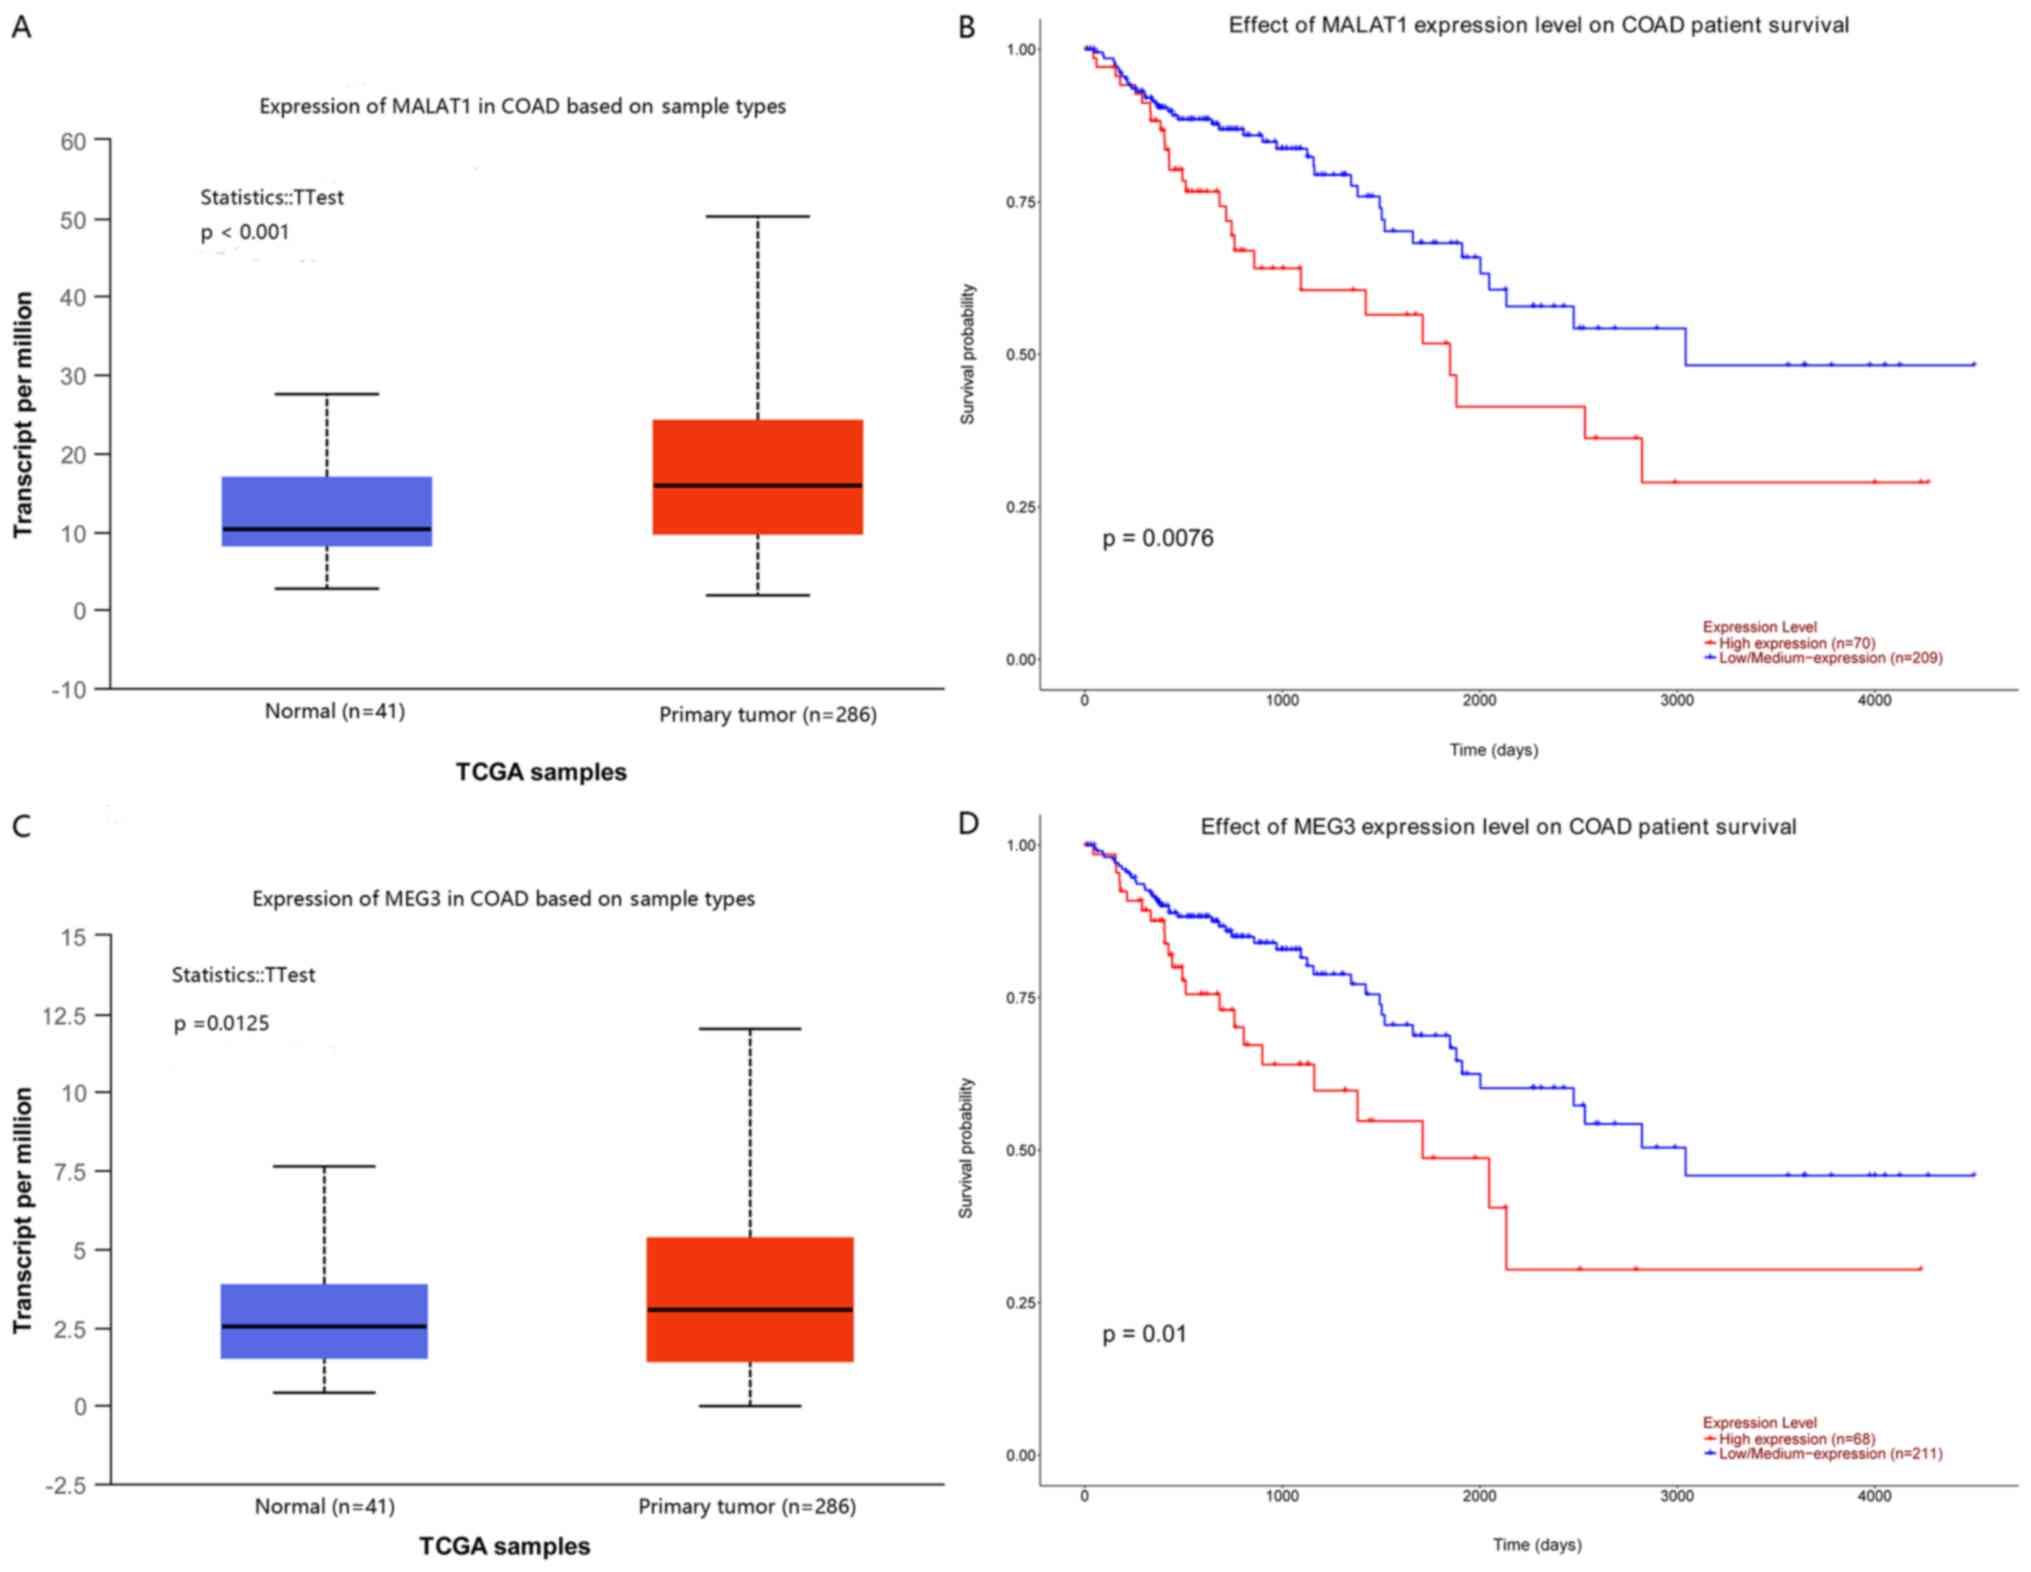
Screening of biomarkers associated
with prognosis via survival analysis
In order to demonstrate that the expression of colon
cancer-related lncRNAs was associated with the prognosis of colon
cancer, the survival curve of 17 colon cancer-related lncRNAs was
identified in the UALCAN database and it was revealed that 2 of
these were associated with the overall survival of patients with
colon cancer. The results are presented in Fig. 4.
Among the results, lncRNA metastasis-associated lung
adenocarcinoma transcript (MALAT1) and lncRNA maternally
expressed gene 3 (MEG3) were upregulated in colon cancer
tissue compared with that in normal tissue (Fig. 4A and C), and high expression of
these lncRNAs was significantly associated with poor overall
survival in patients with colon cancer (Fig. 4B and D).
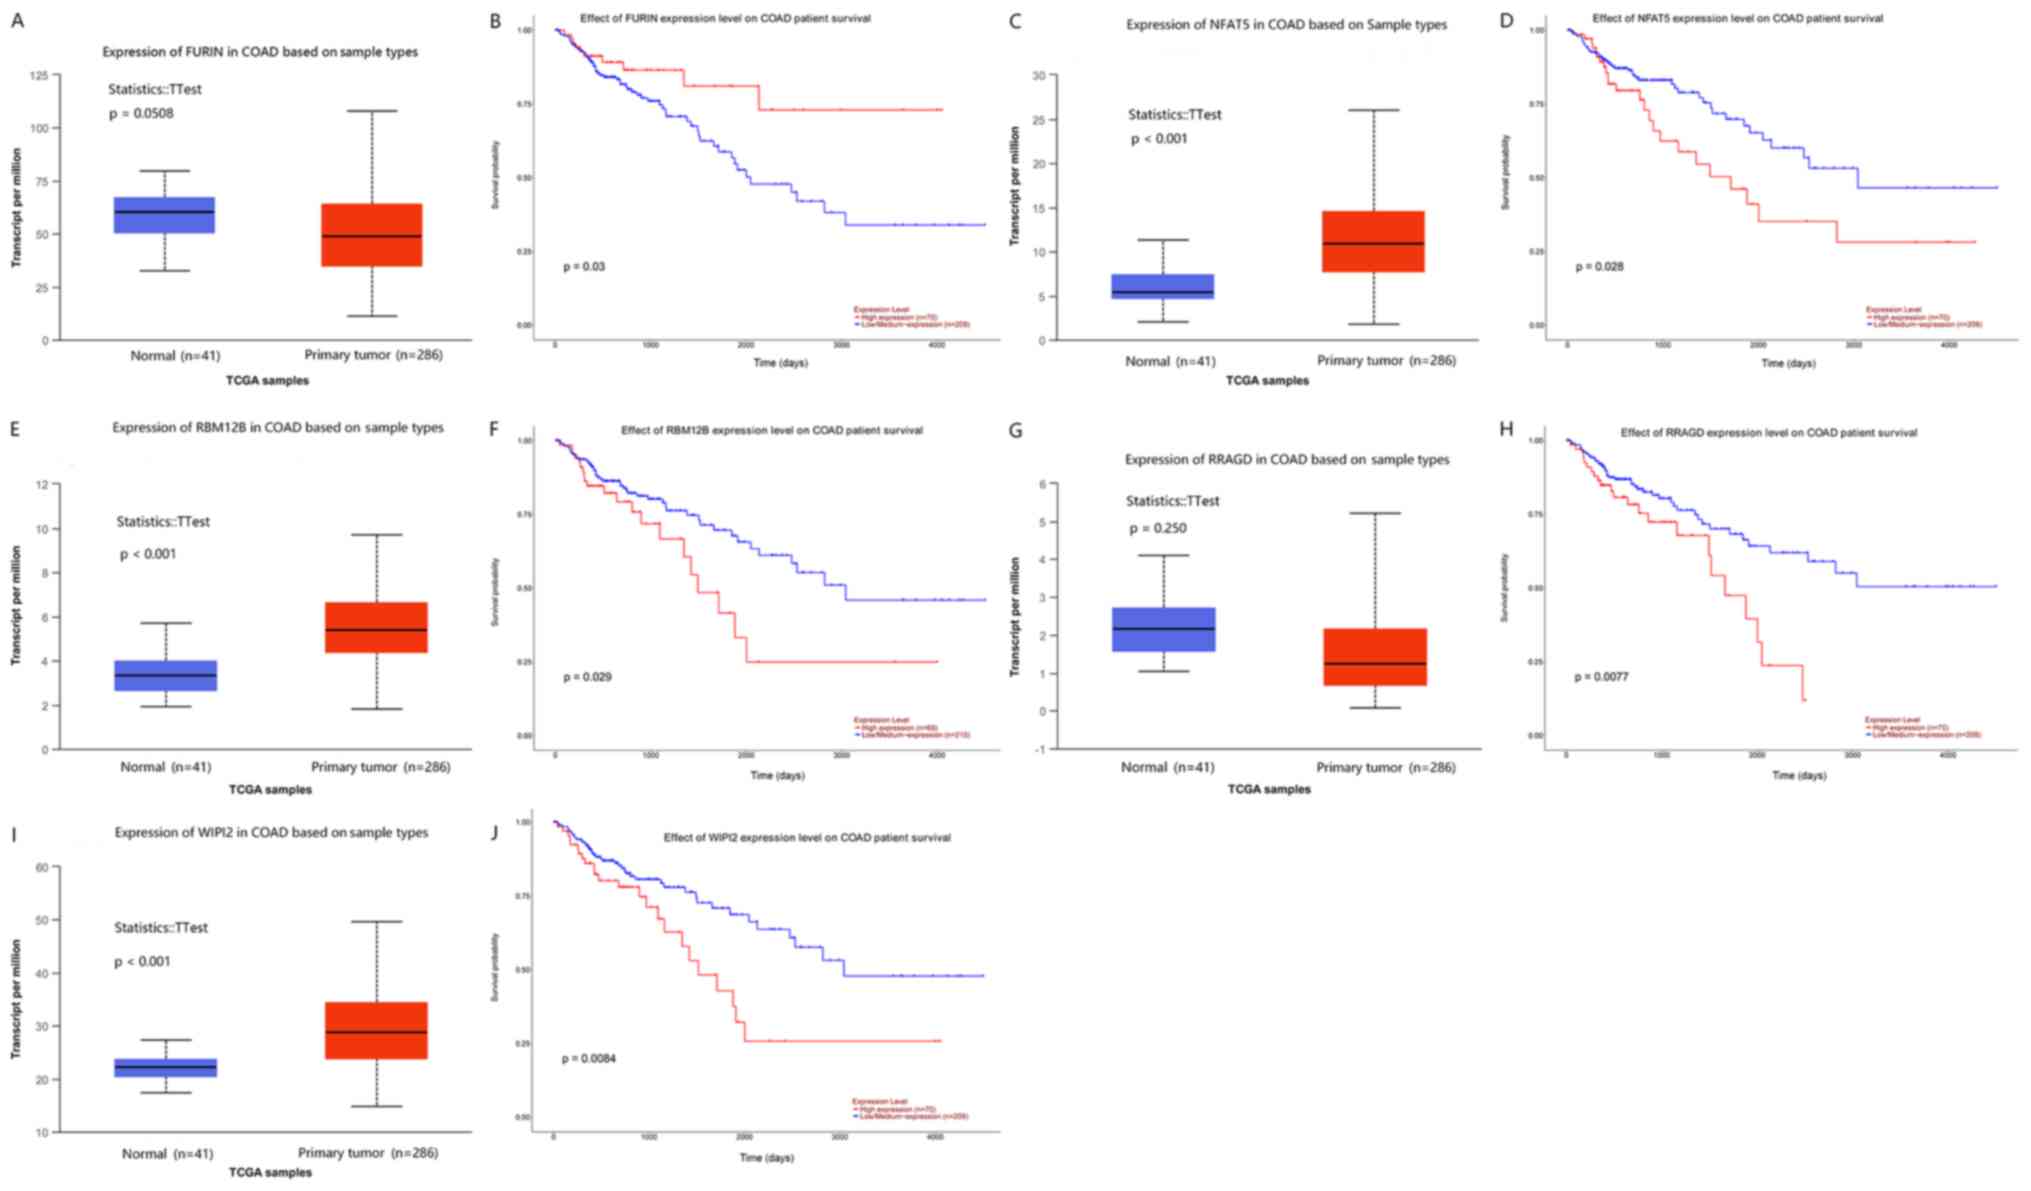
In addition, 5 out of 144 hub genes (FURIN, NFAT,
RBM12B, RRAGD and WIPI2) were closely associated with
overall survival of colon cancer. The upregulation of all of these
genes, apart from FURIN, was associated with poor overall survival
in patients with colon cancer (Fig.
5).
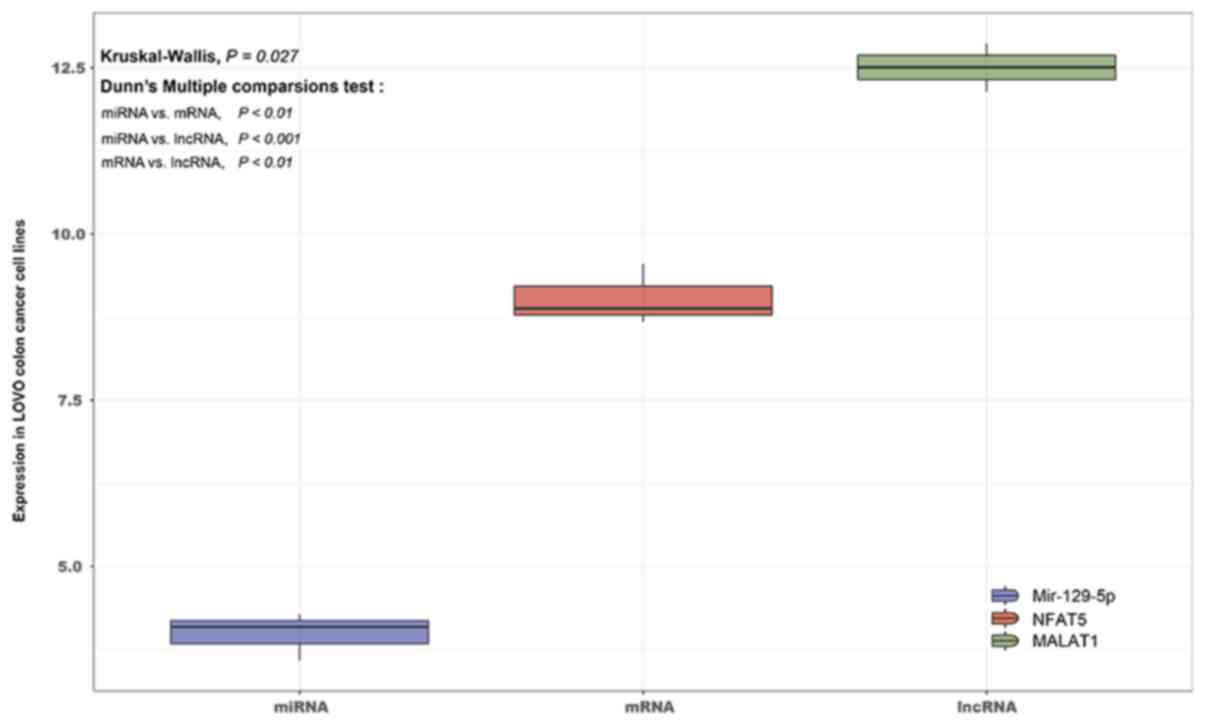
MALAT1 is significantly upregulated,
and this is correlated with downregulation of miR-129-5p and
upregulation of NFAT5, in LoVo colon cancer cell lines
Using data from the GSE26334 dataset, the full
transcriptome sequence of LoVo colon cancer lines was sequenced.
The differential expression among mRNAs, lncRNAs and miRNAs in LoVo
colon cancer lines was then compared using the Kruskal-Wallis test
and visualized by R and GGPLOT2 3.10. The results indicated that
the expression levels of lncRNA MALAT1 and mRNA NFAT5
in LoVo colon cancer lines were significantly upregulated, while
miR-129-5p was significantly downregulated, with a significant
difference between them (P=0.027). This result further confirmed
the prediction that the MALAT1/miR-129-5p/NFAT5 axis was
significantly associated with colon cancer (Table II; Fig. 6).
| Table II.Extracted lncRNA-miRNA-mRNA
interaction pairs that require verification. |
Table II.
Extracted lncRNA-miRNA-mRNA
interaction pairs that require verification.
| lncRNA | mRNA | miRNA | R | P-value |
|---|
| MALAT1 | NFAT5 | hsa-miR-142 | 0.41 |
7.6×10⁻¹³ |
| MALAT1 | NFAT5 | hsa-miR-384 | 0.41 |
7.6×10⁻¹³ |
| MALAT1 | NFAT5 | hsa-miR-519d | 0.41 |
7.6×10⁻¹³ |
| MALAT1 | NFAT5 | hsa-miR-150 | 0.41 |
7.6×10⁻¹³ |
| MALAT1 | NFAT5 | hsa-miR-494 | 0.41 |
7.6×10⁻¹³ |
| MALAT1 | NFAT5 | hsa-miR-32 | 0.41 |
7.6×10⁻¹³ |
| MALAT1 | NFAT5 | hsa-miR-205 | 0.41 |
7.6×10⁻¹³ |
| MALAT1 | NFAT5 | hsa-miR-149 | 0.41 |
7.6×10⁻¹³ |
| MALAT1 | NFAT5 | hsa-miR-124 | 0.41 |
7.6×10⁻¹³ |
| MALAT1 | NFAT5 |
hsa-miR-129 | 0.41 |
7.6×10⁻¹³ |
| MALAT1 | RBM12B | hsa-miR-519d | 0.32 |
6.6×10⁻⁸ |
| MALAT1 | RBM12B | hsa-miR-200b | 0.32 |
6.6×10⁻⁸ |
| MALAT1 | RBM12B | hsa-miR-429 | 0.32 |
6.6×10⁻⁸ |
| MEG3 | NFAT5 | hsa-miR-215 | 0.26 |
2×10⁻⁶ |
| MEG3 | NFAT5 | hsa-miR-361 | 0.26 |
2×10⁻⁶ |
| MEG3 | NFAT5 | hsa-miR-122 | 0.26 |
2×10⁻⁶ |
| MEG3 | NFAT5 | hsa-miR-129 | 0.26 |
2×10⁻⁶ |
| MALAT1 | ABCA1 | hsa-miR-142 | 0.15 | 0.015 |
| MEG3 | RRAGD | hsa-miR-129 | 0.14 | 0.011 |
| MALAT1 | WIPI2 | hsa-miR-383 | 0.13 | 0.026 |
| MALAT1 | WIPI2 | hsa-miR-503 | 0.13 | 0.026 |
| MALAT1 | WIPI2 | hsa-miR-1271 | 0.13 | 0.026 |
| MALAT1 | WIPI2 | hsa-miR-124 | 0.13 | 0.026 |
| MALAT1 | RRAGD | hsa-miR-519d | 0.043 | 0.48 |
| MALAT1 | RRAGD | hsa-miR-144 | 0.043 | 0.48 |
| MALAT1 | RRAGD | hsa-miR-124 | 0.043 | 0.48 |
| MALAT1 | RRAGD | hsa-miR-129 | 0.043 | 0.48 |
| MALAT1 | FURIN | hsa-miR-519d | 0.042 | 0.49 |
| MALAT1 | FURIN | hsa-miR-124 | 0.042 | 0.49 |
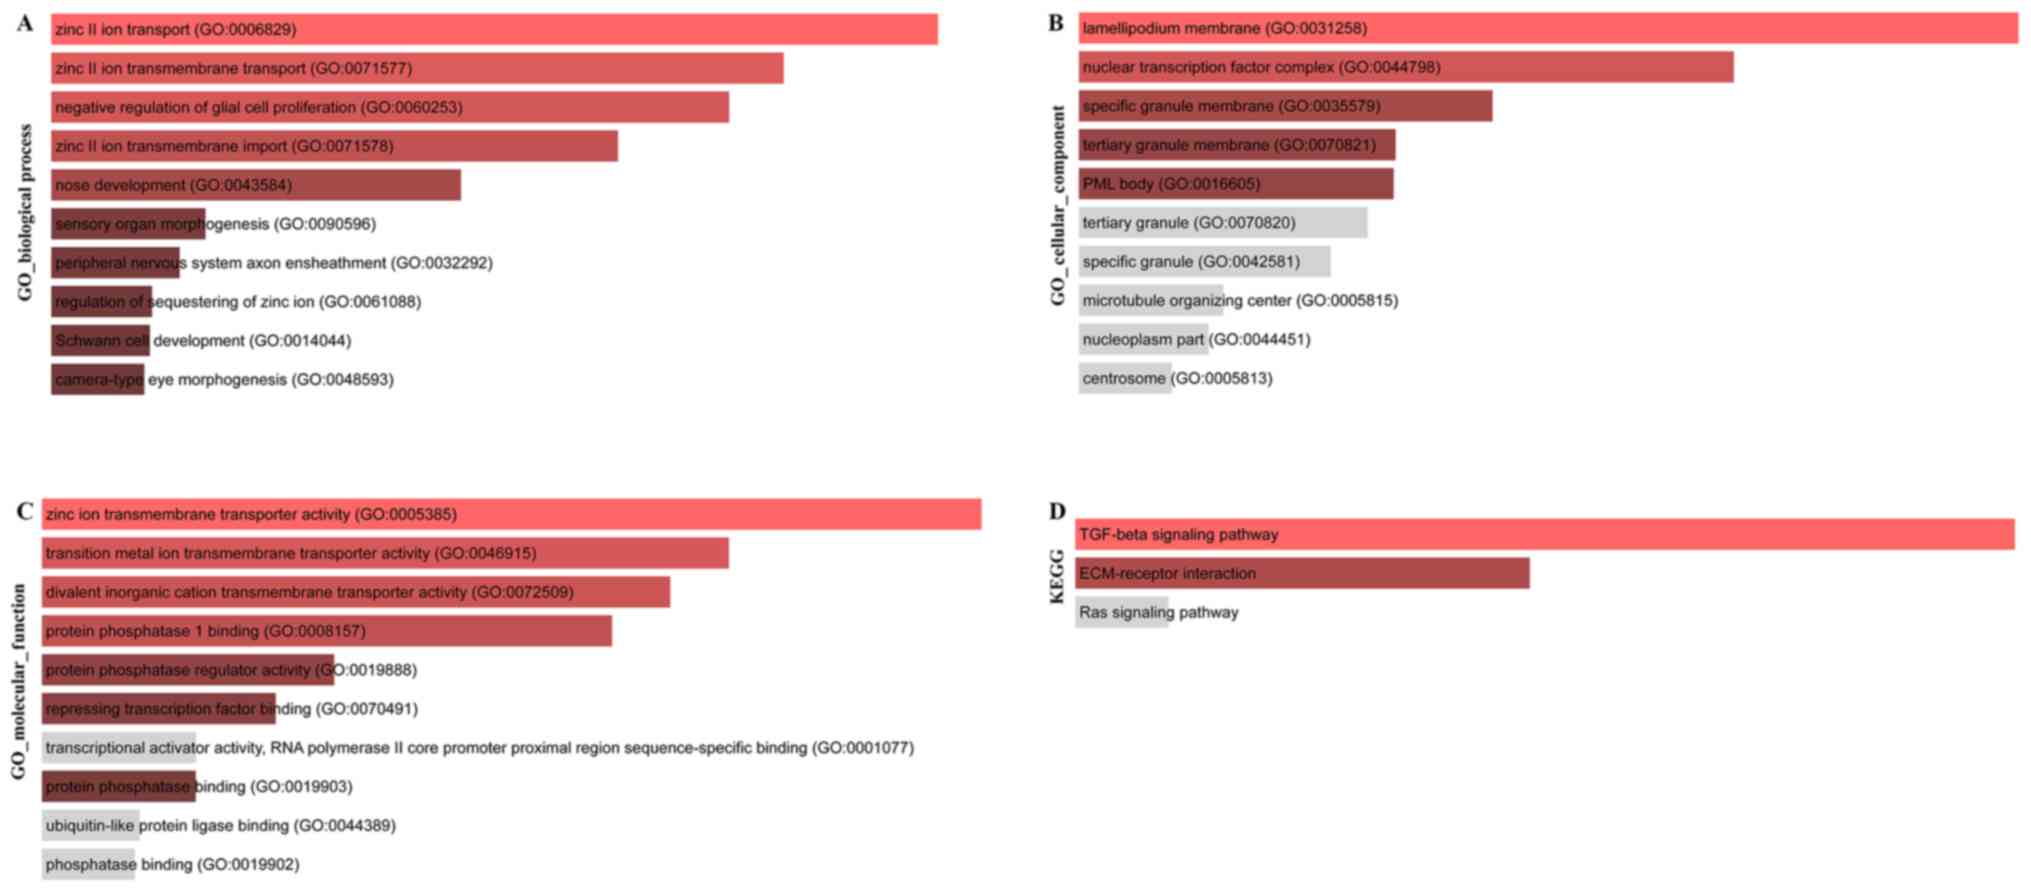
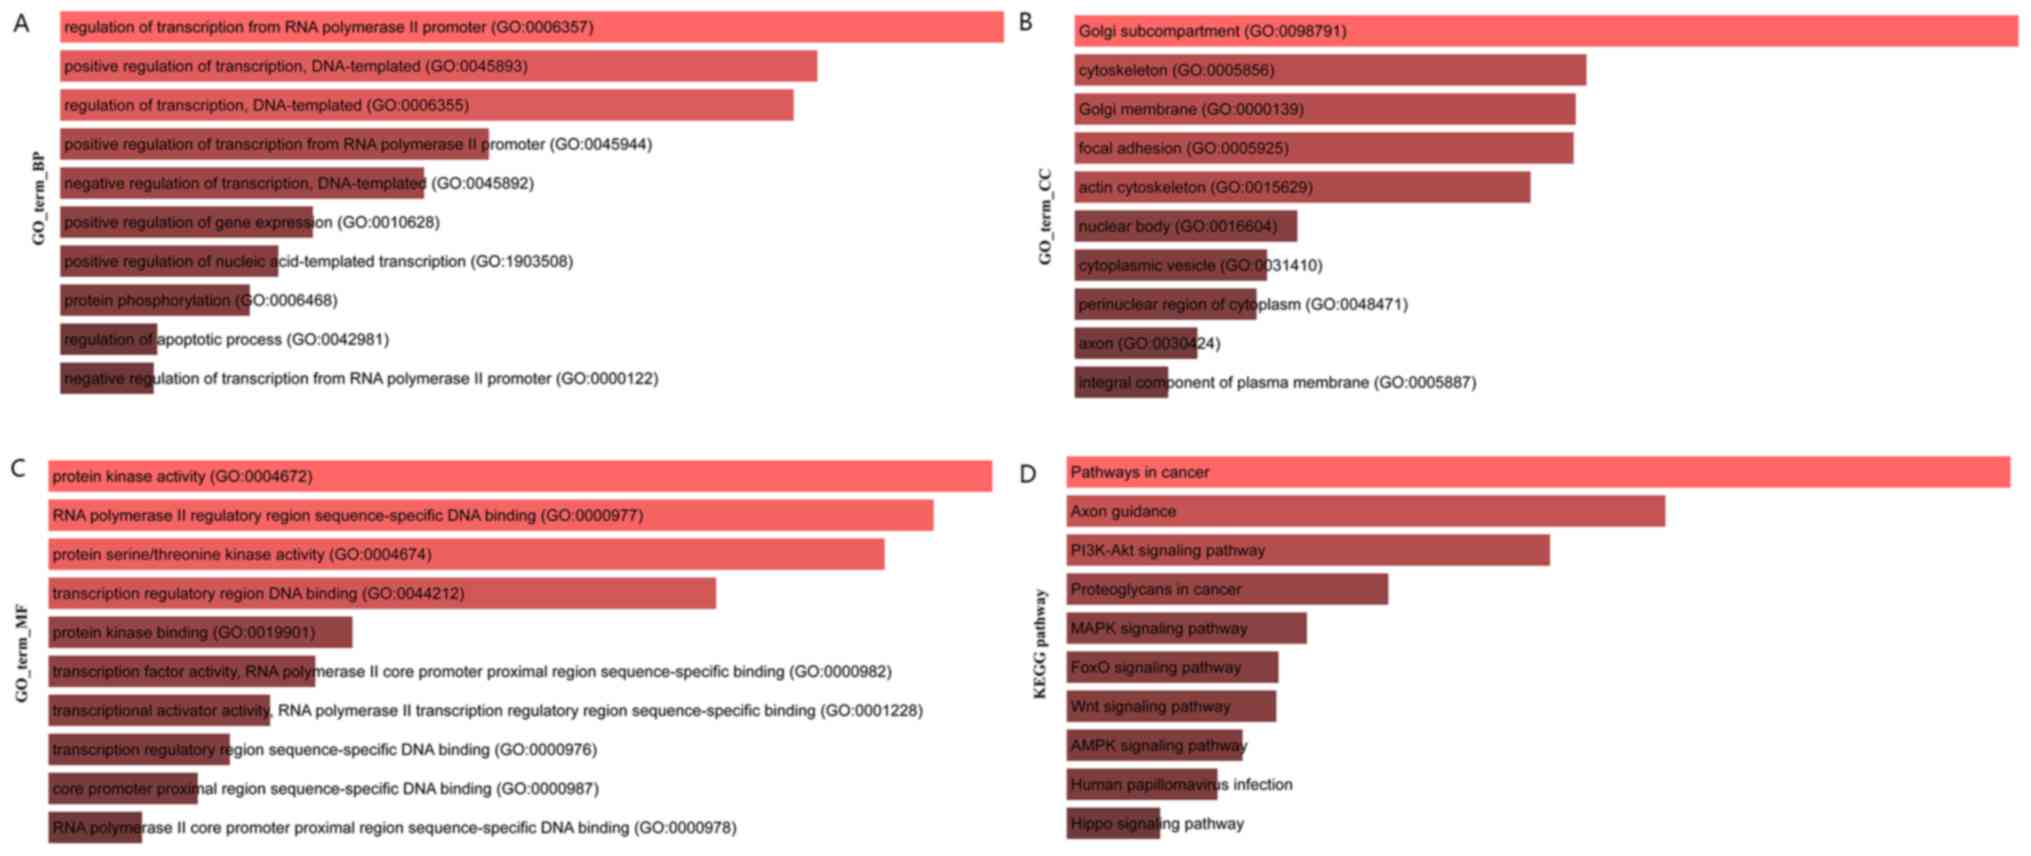
Target set of core regulators and
functional enrichment analysis of core genes
The target genes (target set) of the core regulatory
factor (top 10 miRNAs, top10 lncRNAs) were screened, and a total of
11,814 target sets were obtained, and the function and pathway
enrichment of the target set were analyzed. The results of Gene
Ontology (GO) biological process (BP) enrichment analysis are shown
in Fig. 7A, the results of GO cell
components (CC) are shown in Fig.
7B, the enrichment analysis results of GO molecular function
(MF) enrichment analysis are shown in Fig. 7C and the results of Kyoto
Encyclopedia of Genes and Genomes (KEGG) pathway enrichment
analysis are presented in Fig.
7D.
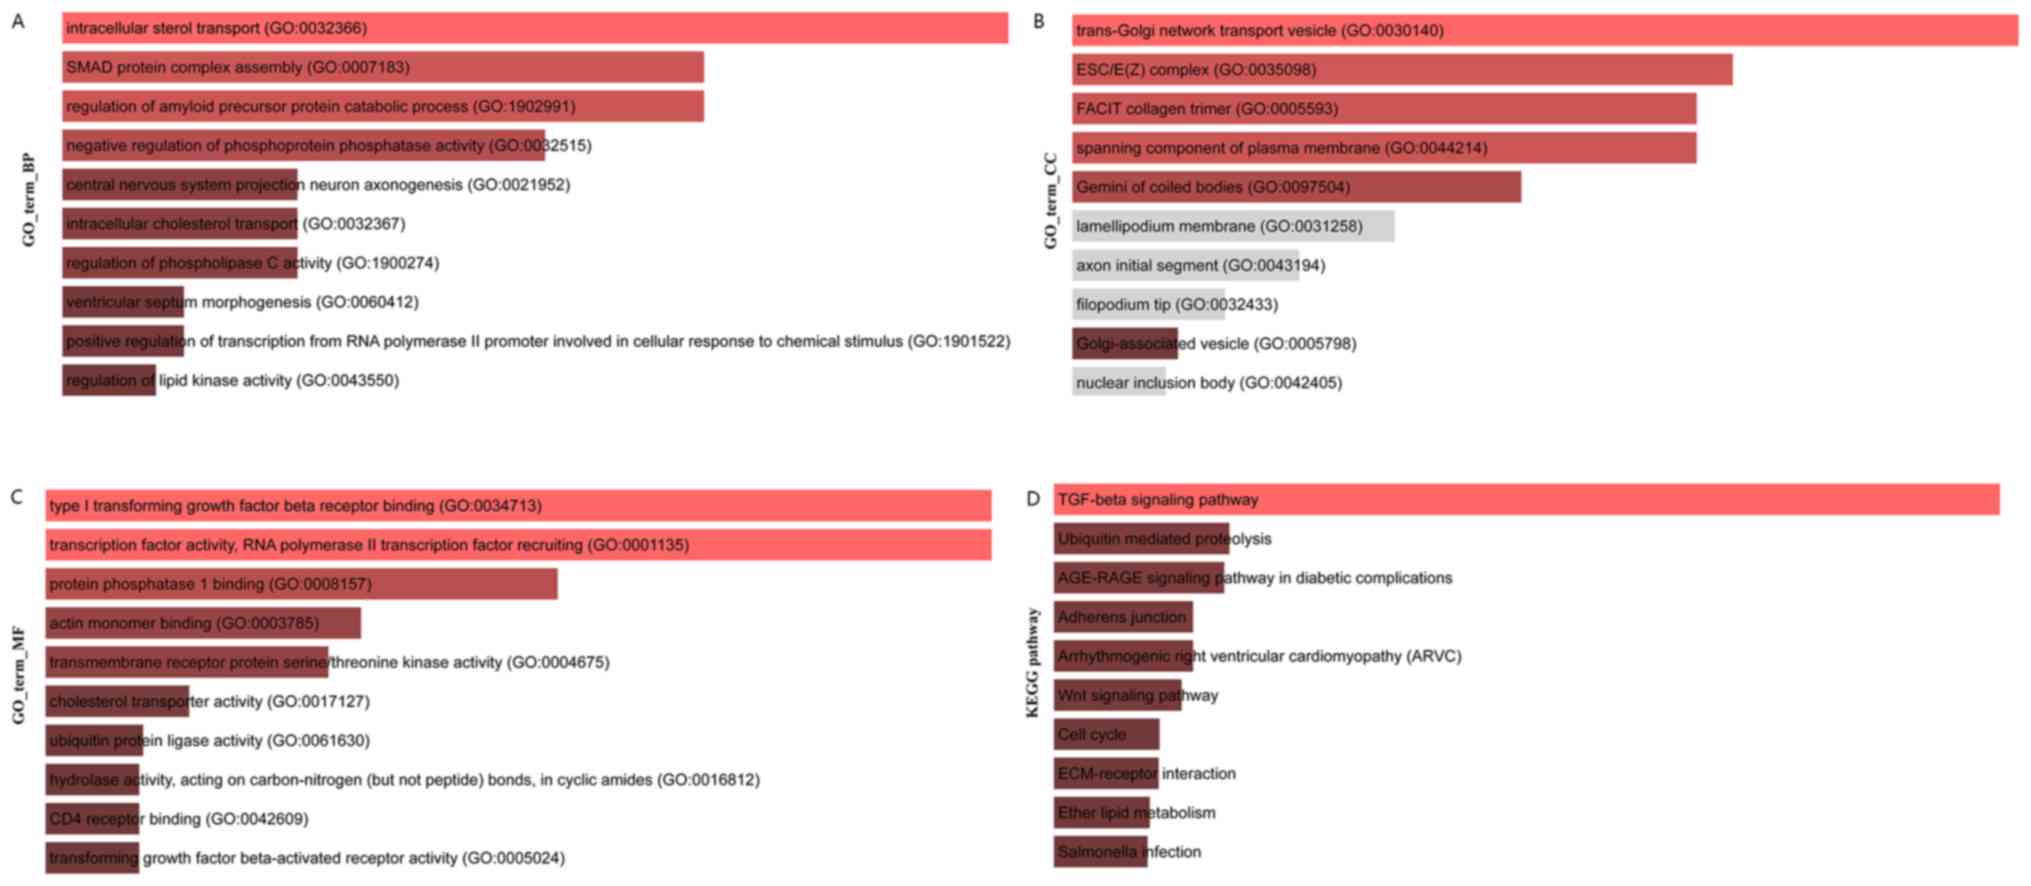
Then, enrichR was used to analyze the function and
pathway of 144 core genes in colon cancer. The results of GO
biological process (BP) enrichment analysis are shown in Fig. 8A, the results of GO cell components
(CC) enrichment analysis are shown in Fig. 8B, the results of GO molecular
function (MF) enrichment analysis are shown in Fig. 8C and the results of KEGG pathway
enrichment analysis are shown in Fig.
8D.
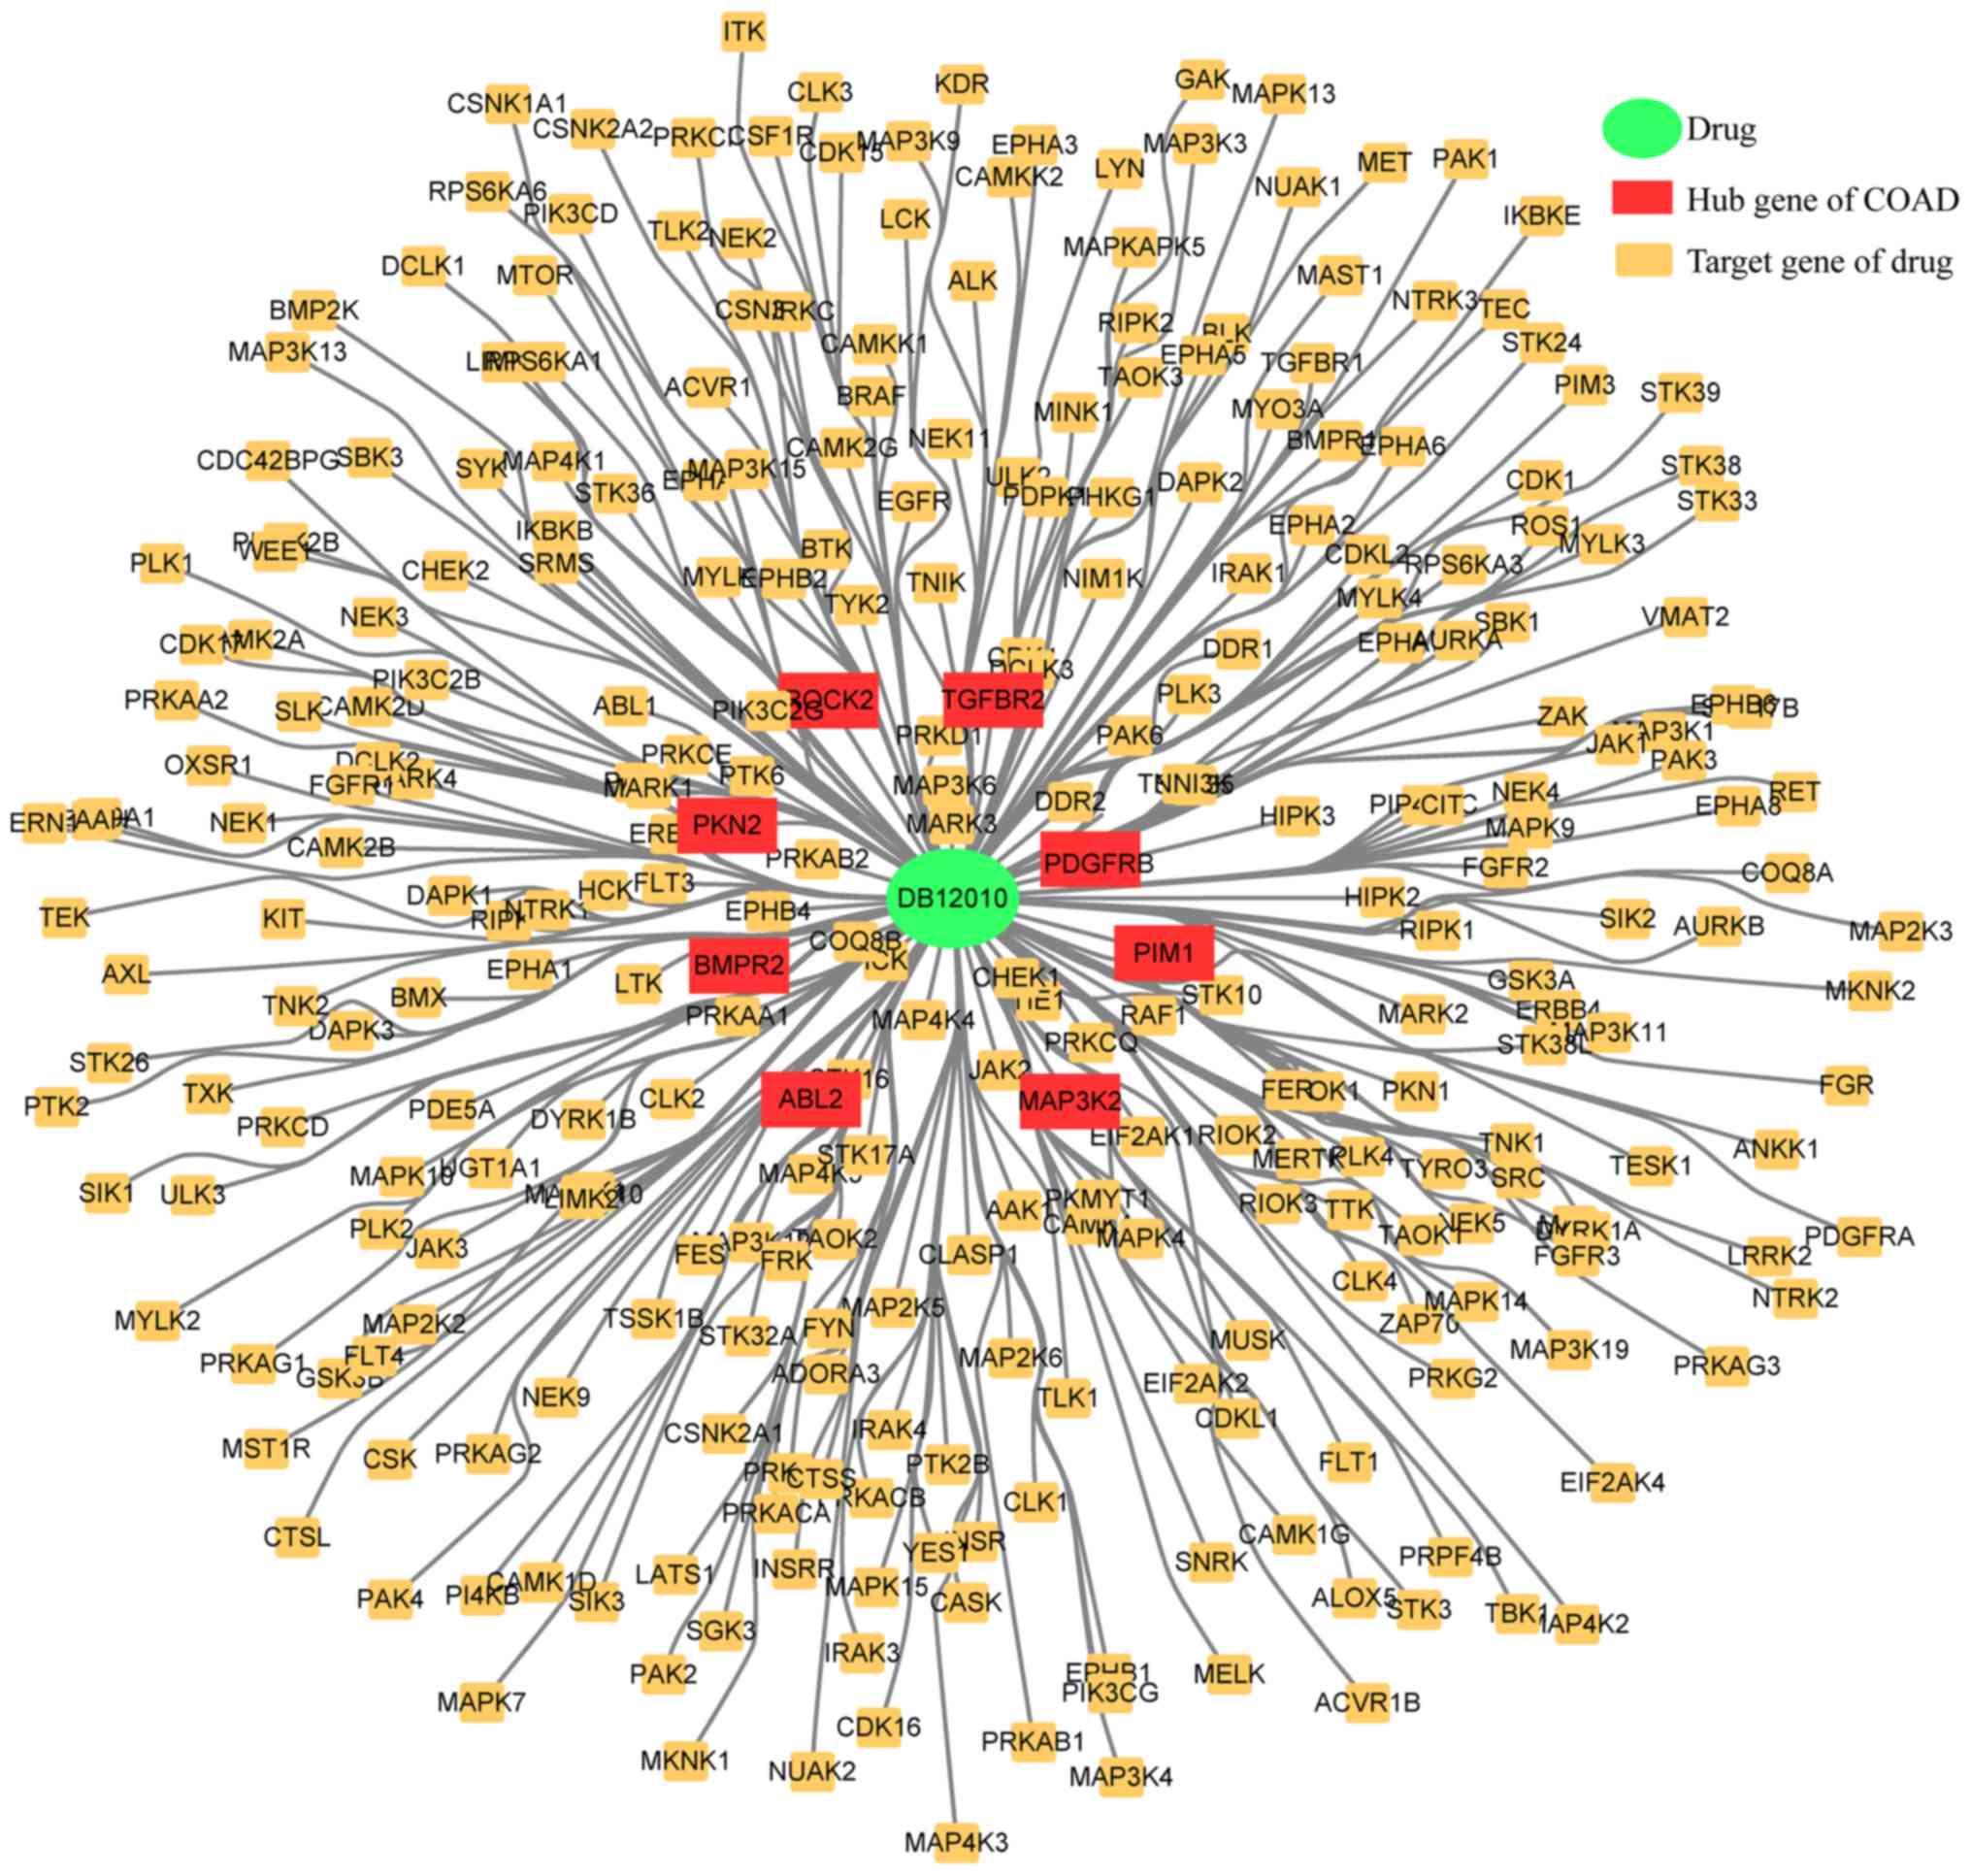
Drug prediction of colon cancer
Drug-target relationship data was downloaded from
Drugbank, which was used as the interaction background. As a
result, 144 colon cancer core genes were selected as the gene set
and the drugs that interact significantly with the core genes of
colon cancer were calculated using the hypergeometric test. If the
hypergeometric test P-value was <0.05 and the number of
interactions with the core genes of colon cancer was >2, the
drugs were predicted to be associated with colon cancer. After data
preprocessing, a total of 9,484 drug-target gene pairs were
selected as the background of interaction. Finally, one drug
(DB12010) met the threshold values, and was revealed to be
fostamatinib; the results are given in Table III and Fig. 9.
| Table III.Association between hub genes and
targeted drugs in colon cancer (top 10). |
Table III.
Association between hub genes and
targeted drugs in colon cancer (top 10).
| Drug | P-value | Connection |
|---|
| DB12010 |
0.00672750878641727 | 8 |
| DB11638 |
0.0393484004831608 | 1 |
| DB01593 |
0.000357387058865982 | 0 |
| DB00142 |
0.010354570549436 | 0 |
| DB00114 |
0.0173304785268529 | 0 |
| DB00898 |
0.033077964206484 | 0 |
| DB00334 |
0.0376561578707151 | 0 |
| DB00543 |
0.042873010623447 | 0 |
Discussion
Since the hypothesis of long-chain non-coding RNAs
(lncRNAs) as a competing endogenous (ce)RNA network was firstly
reported in 2011, it has become a focus of tumor research (7). At present, the network theory of
lncRNA-miRNA-mRNA has been gradually confirmed and serves an
important role in tumor research. lncRNAs are a class of non-coding
products with a length of >200 nucleotides, and account for 68%
of all non-coding RNA molecules (24). As an important subgroup of
non-coding RNAs, lncRNAs have been confirmed to influence a wide
variety of physiological functions and pathological process, such
as diabetes, cardiovascular disease, tumors and other diseases
(25–31). They serve an important role in
regulating gene expression. Since the identification of the ceRNA
network, a new method of molecular regulation has been considered.
lncRNAs attenuate the biological function of miRNAs by sponging
miRNAs with the same microRNA response element (MRE). As a
result of the inhibitory effect, lncRNAs are capable of regulating
the tumorigenesis and progression of colon cancer.
In the present study, 6,933 lncRNA-miRNA-mRNA
interaction pairs were identified in colon cancer, which included
17 hub lncRNAs, 87 hub miRNAs and 144 hub colon cancer core genes.
The ceRNA construction of the present study differs from previous
methods of ceRNA construction based on differential expression of
lncRNAs, miRNAs and mRNAs. However, the present study used multiple
databases to screen trusted miRNA-mRNA interaction pairs and
lncRNA-miRNA interaction pairs. The significance of lncRNA- and
mRNA-shared miRNAs was calculated by using hypergeometric test for
each pair of lncRNA and mRNA by using R packages, and the
lncRNA-miRNA-mRNA network was successfully constructed. It was
revealed that the colon cancer-associated genes identified by
random walk analysis were predominantly enriched in GO terms such
as ‘zinc ion transport’, ‘nuclear transcription factor complex’,
‘zinc ion transmembrane transporter activity’ and ‘protein
phosphate regulator activity’, amongst others. Previous studies
have indicated that zinc transporters serve a vital role in
carcinogenesis and tumorigenesis (32–34).
Similarly, protein phosphate regulator activity is associated with
numerous cancer types, such as breast cancer, prostate cancer,
non-small cell lung cancer and colon cancer (35–37).
Several cancer-associated pathways including transforming growth
factor β (TGF-β) signaling, extracellular matrix (ECM) receptor
interaction, Ras signaling, PI3K/Akt signaling pathways, and other
biological pathways have been identified to be enriched following
KEGG analysis. For example, CD51 was revealed to bind TGF-β
receptors and further upregulate TGF-β/mothers against
decapentaplegic homolog signaling in colorectal stem cells
(38). In addition, the TGF-β
signaling pathway, a regulator of TWIST1, enhanced stem cell
properties in human colorectal cancer (39). The ECM-receptor interaction
signaling pathway was found to influence the progression of breast
cancer (40). In addition, it was
reported that Twist-related protein 2 upregulated the expression of
ITGA6 and CD44 which may promote cell proliferation, migration and
invasiveness in human kidney cancer via the ECM-receptor
interaction pathway (41).
Dysregulation of Wnt/β-catenin and Hedgehog/Gli signaling was found
to serve a key role in colon cancer progression (42). In addition, the PI3K/Akt pathway
was demonstrated to participate in the activation and regulation of
cell proliferation, survival, migration and angiogenesis in
numerous human cancer types, including colon cancer (43). The aforementioned results confirmed
that the core genes identified by random walk algorithm are
primarily enriched in cancer-associated pathways.
The colon cancer core genes are a subset of the
target genes of colon cancer regulators, which were found to be all
enriched in GO terms such as ‘transcriptional regulation of RNA
polymerase II promoter’, ‘ubiquitin protein ligase activity’ and
‘nucleosome’, ‘transport vesicles across Golgi network’, and
enriched in biological pathways such as ‘TGF-β signaling pathway’,
‘ubiquitin-mediated proteolysis’ and ‘Wnt signaling pathway’. It
may be useful to discover the function of these core genes.
lncRNAs directly serve as oncogenes or tumor
suppressors via post-transcriptional regulation in the cytoplasm,
and serve critical roles in several hallmarks of cancer, such as
uncontrollable proliferation, evasion and metastasis (44–46).
In the present study, the results indicated that
metastasis-associated lung adenocarcinoma transcript
(MALAT1) and maternally expressed gene 3 (MEG3) were
two important lncRNAs influencing colon cancer, and that a high
expression of MALAT1 was associated with poor overall
survival of patients with colon adenocarcinoma. MALAT1, an
8.5 kb lncRNA, located at 11q13, was characterized in a study of
early-stage non-small cell lung cancer (30). Previous studies have demonstrated
that MALAT1 may represent a good diagnostic marker in
nasopharyngeal carcinoma, breast and bladder cancer (47). Furthermore, MALAT1 has been
demonstrated to sponge miR-106b-5p to promote the invasion
and metastasis of colorectal cancer via SLAIN2 (48). However, upregulation of MEG3
may decrease the proliferation and metastasis of gastric cancer
cells (49). Additionally,
MEG3 was found to be significantly downregulated in acute
myeloid leukemia and suppressed leukemogenesis in a p53-independent
manner (50). The present study
indicated that high expression of MEG3 in colon cancers was
associated with poor overall survival via bioinformatic analysis.
So far, to the best of the authors' knowledge, there has been no
research on the mechanism underpinning the role of MEG3 in
the tumorigenesis of colon cancer from previous experimental
studies. Therefore, future studies are required to further verify
its function in colon cancer.
Previous studies have indicated that tissue- and
cell-type specific expression of miRNAs may exhibit either
tumor-suppressive or oncogenic effects in a context-dependent
manner (51,52). Dysregulation of miRNA function is
associated with an increasing number of human disease types,
particularly cancer (53).
According to the MCODE algorithm, 4 gene modules (MCODE score ≥3)
were constructed, including hub miRNAs, including hsa-miR-34a,
hsa-miR-449a, hsa-miR-34c, hsa-miR-449b, hsa-miR-33a, hsa-miR-542,
hsa-miR-449b, hsa-miR-145 and hsa-miR-212. For example, low
miR-449a expression was found to predict a poorer prognosis via
regulation of the expression of the target gene HDAC1 in colorectal
cancer (54). miR-34a/b/c were
found to suppress intestinal tumorigenesis resulting from loss of
Apc which downregulates the expression of a large number of
protumorigenic factors (55). In
addition, miR-145 may serve as a tumor suppressor that
downregulates hypoxia-inducible factor 1 and vascular endothelial
growth factor expression via targeting of p70S6K1, which results in
the inhibition of tumor growth and angiogenesis (56).
In the present study, Kaplan-Meier analysis
indicated that hub genes, including FURIN, NFAT5, RBM12B,
RRAGD and WIPI2, were closely associated with the
overall survival of patients with colon cancer. In a variety of
cancer types and human cancer cell lines, high expression of
FURIN was found to be positively associated with the high
invasiveness of tumors, and it has been proposed as a marker of
advanced or malignant tumors (57). In addition, high expression of
FURIN has been revealed to predict decreased survival in
several human cancer types (58).
NFAT5 is activated at multiple levels, and the activation is
required for the induction of S100A4 in colon cancer cells
(59). In addition, NFAT5
is upregulated in invasive human ductal breast carcinomas and has
been demonstrated to participate in promoting carcinoma
invasiveness using cell lines derived from human breast and colon
carcinomas (60). A previous study
reported that RBM12B was associated with both breast cancer
incidence and outcome (61).
However, there are few reports on the function of RBM12B in
colon cancer. The present study indicated that high expression of
RBM12B was associated with poor overall survival in patients
with colon cancer. Thus, the role of RBM12B in the colon
cancer requires further elucidation via more experimentation.
RRAGD participates in a variety of molecular processes,
improves the formation of breast cancer cell line cell-in-cell
structure and may influence the late maturation of external cell
vacuoles via regulation of mammalian target of rapamycin complex
(62). WIPI2 is a mammalian
effector of phosphatidylinositol 3-phosphate and is ubiquitously
expressed in a variety of cell lines. WIPI2 is recruited to
early autophagosomal structures along with autophagy related 16
like 1 and ULK1 (63). Autophagy
influences cellular metabolism, the proteome and organelle numbers
and quality. Dysfunctional autophagy contributes to multiple
diseases, including cancer (64).
Currently, there is no report describing the effect of WIPI2
on colon cancer via autophagy, which requires further
investigation. The aforementioned research reveals that the
ceRNA-associated hub genes identified in the present study serve an
important role in the tumorigenesis and progression of colon
cancer.
Among these lncRNAs and mRNAs closely associated
with colon cancer survival, it was revealed that the lncRNA
MALAT1/miR-129-5p/NFAT5 axis may serve a vital role in the
progression of colon cancer. Another study demonstrated that the
MALAT/mi-R203/DCP1A axis is involved with the development
and contributes to the malignancy of colorectal cancers (65). This study may indicate that
MALAT1 may exert a regulating role by targeting small RNAs.
However, the present study only used the GSE26334 dataset, and
further in vitro and in vivo validation experiments
are needed.
In the present study, a targeted drug for colon
cancer was predicted using the 144 core genes in the colon cancer
ceRNA network for the first time, to the best of the authors'
knowledge, which may represent a novel therapeutic target for the
treatment of colon cancer. Furthermore, the drug was revealed to be
a spleen tyrosine kinase inhibitor, and effective inhibition of
B-cell receptor signal transduction in vivo results in a
decrease in the proliferation and survival of malignant B cells and
a significant prolongation of the survival time of treated animals
(66). In addition, this drug
appears to represent a promising therapeutic for immunological
diseases (67). However, the use
of the drug for the clinical treatment of colon cancer would still
require further bioinformatic analysis and randomized controlled
trials.
Supplementary Material
Supporting Data
Acknowledgements
The authors would like to thank GAP BioTech studio
for providing bioinformatic analysis in the present study.
Funding
This study was supported by the Chongming Committee
of Science and Technology (grant no. CKY2018-11).
Availability of data and materials
The datasets generated and/or analyzed during the
current study are available in TCGA repository (https://portal.gdc.cancer.gov/) and the GEO
repository, https://www.ncbi.nlm.nih.gov/geo/query/acc.cgi?acc=GSE26334.
Authors' contributions
DH and BZ contributed to the data analysis and wrote
the main manuscript. DH analyzed the relevant data and prepared
Figs. 1–5, WS analyzed the relevant data and
prepared Fig. 6 and Table II, and BZ analyzed the relevant
data and prepared Figs. 7–9. MY created Tables I and III and analyzed the data in the two
Tables. WS contributed to the process of revising the manuscript.
WS and LZ designed the experiments, reviewed drafts of the paper
and approved the final draft. All authors read and approved the
final manuscript.
Ethics approval and consent to
participate
Not applicable.
Patient consent for publication
Not applicable.
Competing interests
The authors declare that they have no competing
interests.
References
|
1
|
Wong KE, Ngai SC, Chan KG, Lee LH, Goh BH
and Chuah LH: Curcumin nanoformulations for colorectal cancer: A
review. Front Pharmacol. 10:1522019. View Article : Google Scholar : PubMed/NCBI
|
|
2
|
Edwards BK, Ward E, Kohler BA, Eheman C,
Zauber AG, Anderson RN, Jemal A, Schymura MJ, Lansdorp-Vogelaar I,
Seeff LC, et al: Annual report to the nation on the status of
cancer, 1975–2006, featuring colorectal cancer trends and impact of
interventions (risk factors, screening, and treatment) to reduce
future rates. Cancer. 116:544–573. 2010. View Article : Google Scholar : PubMed/NCBI
|
|
3
|
Hao Y, Wang Y, Qi M, He X, Zhu Y and Hong
J: Risk factors for recurrent colorectal polyps. Gut Liver.
2019.(Epub ahead of print). View
Article : Google Scholar
|
|
4
|
Pohl C, Hombach A and Kruis W: Chronic
inflammatory bowel disease and cancer. Hepatogastroenterology.
47:57–70. 2000.PubMed/NCBI
|
|
5
|
Mehta A and Patel BM: Therapeutic
opportunities in colon cancer: Focus on phosphodiesterase
inhibitors. Life Sci. 230:150–161. 2019. View Article : Google Scholar : PubMed/NCBI
|
|
6
|
Yu C and Zhang Y: Development and
validation of a prognostic nomogram for early onset colon cancer.
Biosci Rep. 36:BSR201817812019. View Article : Google Scholar
|
|
7
|
Salmena L, Poliseno L, Tay Y, Kats L and
Pandolfi PP: A ceRNA hypothesis: The rosetta stone of a hidden RNA
language? Cell. 146:353–358. 2011. View Article : Google Scholar : PubMed/NCBI
|
|
8
|
Zhong Y, Du Y, Yang X, Mo Y, Fan C, Xiong
F, Ren D, Ye X, Li C, Wang Y, et al: Circular RNAs function as
ceRNAs to regulate and control human cancer progression. Mol
Cancer. 17:792018. View Article : Google Scholar : PubMed/NCBI
|
|
9
|
Wang Z, Xu P, Chen B, Zhang Z, Zhang C,
Zhan Q, Huang S, Xia ZA and Peng W: Identifying
circRNA-associated-ceRNA networks in the hippocampus of
Aβ1-42-induced Alzheimer's disease-like rats using microarray
analysis. Aging (Albany NY). 10:775–788. 2018. View Article : Google Scholar : PubMed/NCBI
|
|
10
|
Xing Q, Huang Y, Wu Y, Ma L and Cai B:
Integrated analysis of differentially expressed profiles and
construction of a competing endogenous long non-coding RNA network
in renal cell carcinoma. PeerJ. 6:e51242018. View Article : Google Scholar : PubMed/NCBI
|
|
11
|
Wang P, Li X, Gao Y, Guo Q, Ning S, Zhang
Y, Shang S, Wang J, Wang Y, Zhi H, et al: LnCeVar: A comprehensive
database of genomic variations that disturb ceRNA network
regulation. Nucleic Acids Res. 48:D111–D117. 2020.PubMed/NCBI
|
|
12
|
Yao Y, Zhang T, Qi L, Zhou C, Wei J, Feng
F, Liu R and Sun C: Integrated analysis of co-expression and ceRNA
network identifies five lncRNAs as prognostic markers for breast
cancer. J Cell Mol Med. 23:8410–8419. 2019. View Article : Google Scholar : PubMed/NCBI
|
|
13
|
Wu Y, Deng Y, Guo Q, Zhu J, Cao L, Guo X,
Xu F, Weng W, Ju X and Wu X: Long non-coding RNA SNHG6 promotes
cell proliferation and migration through sponging miR-4465 in
ovarian clear cell carcinoma. J Cell Mol Med. 23:5025–5036. 2019.
View Article : Google Scholar : PubMed/NCBI
|
|
14
|
Liu W and Wang X: Prediction of functional
microRNA targets by integrative modeling of microRNA binding and
target expression data. Genome Biol. 20:182019. View Article : Google Scholar : PubMed/NCBI
|
|
15
|
Jeggari A, Marks DS and Larsson E:
miRcode: A map of putative microRNA target sites in the long
non-coding transcriptome. Bioinformatics. 28:2062–2063. 2012.
View Article : Google Scholar : PubMed/NCBI
|
|
16
|
Paraskevopoulou MD, Vlachos IS, Karagkouni
D, Georgakilas G, Kanellos I, Vergoulis T, Zagganas K, Tsanakas P,
Floros E, Dalamagas T and Hatzigeorgiou AG: DIANA-LncBase v2:
Indexing microRNA targets on non-coding transcripts. Nucleic Acids
Res. 44:D231–D238. 2016. View Article : Google Scholar : PubMed/NCBI
|
|
17
|
Shannon P, Markiel A, Ozier O, Baliga NS,
Wang JT, Ramage D, Amin N, Schwikowski B and Ideker T: Cytoscape: A
software environment for integrated models of biomolecular
interaction networks. Genome Res. 13:2498–2504. 2003. View Article : Google Scholar : PubMed/NCBI
|
|
18
|
Chen EY, Tan CM, Kou Y, Duan Q, Wang Z,
Meirelles GV, Clark NR and Ma'ayan A: Enrichr: Interactive and
collaborative HTML5 gene list enrichment analysis tool. BMC
Bioinformatics. 14:1282013. View Article : Google Scholar : PubMed/NCBI
|
|
19
|
Chandrashekar DS, Bashel B, Balasubramanya
SAH, Creighton CJ, Ponce-Rodriguez I, Chakravarthi BVSK and
Varambally S: UALCAN: A portal for facilitating tumor subgroup gene
expression and survival analyses. Neoplasia. 19:649–658. 2017.
View Article : Google Scholar : PubMed/NCBI
|
|
20
|
Tang Z, Li C, Kang B, Gao G, Li C and
Zhang Z: GEPIA: A web server for cancer and normal gene expression
profiling and interactive analyses. Nucleic Acids Res. 45:W98–W102.
2017. View Article : Google Scholar : PubMed/NCBI
|
|
21
|
Wu Q, Meng WY, Jie Y and Zhao H: lncRNA
MALAT1 induces colon cancer development by regulating
miR-129-5p/HMGB1 axis. J Cell Physiol. 233:6750–6757. 2018.
View Article : Google Scholar : PubMed/NCBI
|
|
22
|
King CE, Cuatrecasas M, Castells A,
Sepulveda AR, Lee JS and Rustgi AK: LIN28B promotes colon cancer
progression and metastasis. Cancer Res. 71:4260–4268. 2011.
View Article : Google Scholar : PubMed/NCBI
|
|
23
|
Wishart DS, Feunang YD, Guo AC, Lo EJ,
Marcu A, Grant JR, Sajed T, Johnson D, Li C, Sayeeda Z, et al:
DrugBank 5.0: A major update to the DrugBank database for 2018.
Nucleic Acids Res. 46:D1074–D1082. 2018. View Article : Google Scholar : PubMed/NCBI
|
|
24
|
Iyer MK, Niknafs YS, Malik R, Singhal U,
Sahu A, Hosono Y, Barrette TR, Prensner JR, Evans JR, Zhao S, et
al: The landscape of long noncoding RNAs in the human
transcriptome. Nat Genet. 47:199–208. 2015. View Article : Google Scholar : PubMed/NCBI
|
|
25
|
Feng SD, Yang JH, Yao CH, Yang SS, Zhu ZM,
Wu D, Ling HY and Zhang L: Potential regulatory mechanisms of
lncRNA in diabetes and its complications. Biochem Cell Biol.
95:361–367. 2017. View Article : Google Scholar : PubMed/NCBI
|
|
26
|
Greco S, Gaetano C and Martelli F: Long
noncoding competing endogenous RNA networks in age-associated
cardiovascular diseases. Int J Mol Sci. 20:E30792019. View Article : Google Scholar : PubMed/NCBI
|
|
27
|
Peng WX, Koirala P and Mo YY:
LncRNA-mediated regulation of cell signaling in cancer. Oncogene.
36:5661–5667. 2017. View Article : Google Scholar : PubMed/NCBI
|
|
28
|
Ke S, Yang Z, Yang F, Wang X, Tan J and
Liao B: Long noncoding RNA NEAT1 aggravates Aβ-induced neuronal
damage by targeting miR-107 in Alzheimer's disease. Yonsei Med J.
60:640–650. 2019. View Article : Google Scholar : PubMed/NCBI
|
|
29
|
Kulkarni S, Lied A, Kulkarni V, Rucevic M,
Martin MP, Walker-Sperling V, Anderson SK, Ewy R, Singh S, Nguyen
H, et al: CCR5AS lncRNA variation differentially regulates CCR5,
influencing HIV disease outcome. Nat Immunol. 20:824–834. 2019.
View Article : Google Scholar : PubMed/NCBI
|
|
30
|
Li N, Liu Y and Cai J: lncRNA MIR155HG
regulates M1/M2 macrophage polarization in chronic obstructive
pulmonary disease. Biomed Pharmacother. 117:1090152019. View Article : Google Scholar : PubMed/NCBI
|
|
31
|
Yang F, Li XF, Cheng LN and Li XL: Long
non-coding RNA CRNDE promoted cell apoptosis by suppressing miR-495
in inflammatory bowel disease. Exp Cell Res. 382:1114842019.
View Article : Google Scholar : PubMed/NCBI
|
|
32
|
Pan Z, Choi S, Ouadid-Ahidouch H, Yang JM,
Beattie JH and Korichneva I: Zinc transporters and dysregulated
channels in cancers. Front Biosci (Landmark Ed). 22:623–643. 2017.
View Article : Google Scholar : PubMed/NCBI
|
|
33
|
Gartmann L, Wex T, Grungreiff K, Reinhold
D, Kalinski T, Malfertheiner P and Schütte K: Expression of zinc
transporters ZIP4, ZIP14 and ZnT9 in hepatic carcinogenesis-An
immunohistochemical study. J Trace Elem Med Biol. 49:35–42. 2018.
View Article : Google Scholar : PubMed/NCBI
|
|
34
|
Kolenko V, Teper E, Kutikov A and Uzzo R:
Zinc and zinc transporters in prostate carcinogenesis. Nat Rev
Urol. 10:219–226. 2013. View Article : Google Scholar : PubMed/NCBI
|
|
35
|
Tran MH, Seo E, Min S, Nguyen QT, Choi J,
Lee UJ, Hong SS, Kang H, Mansukhani A, Jou I and Lee SY:
NEDD4-induced degradative ubiquitination of phosphatidylinositol
4-phosphate 5-kinase α and its implication in breast cancer cell
proliferation. J Cell Mol Med. 22:4117–4129. 2018. View Article : Google Scholar : PubMed/NCBI
|
|
36
|
Rodgers SJ, Ferguson DT, Mitchell CA and
Ooms LM: Regulation of PI3K effector signalling in cancer by the
phosphoinositide phosphatases. Biosci Rep. 37:BSR201604322017.
View Article : Google Scholar : PubMed/NCBI
|
|
37
|
Yang J, Yang C, Zhang S, Mei Z, Shi M, Sun
S, Shi L, Wang Z, Wang Y, Li Z and Xie C: ABC294640, a sphingosine
kinase 2 inhibitor, enhances the antitumor effects of TRAIL in
non-small cell lung cancer. Cancer Biol Ther. 16:1194–1204. 2015.
View Article : Google Scholar : PubMed/NCBI
|
|
38
|
Wang J, Zhang B, Wu H, Cai J, Sui X, Wang
Y, Li H, Qiu Y, Wang T, Chen Z, et al: CD51 correlates with the
TGF-beta pathway and is a functional marker for colorectal cancer
stem cells. Oncogene. 36:1351–1363. 2017. View Article : Google Scholar : PubMed/NCBI
|
|
39
|
Nakano M, Kikushige Y, Miyawaki K,
Kunisaki Y, Mizuno S, Takenaka K, Tamura S, Okumura Y, Ito M,
Ariyama H, et al: Dedifferentiation process driven by TGF-beta
signaling enhances stem cell properties in human colorectal cancer.
Oncogene. 38:780–793. 2019. View Article : Google Scholar : PubMed/NCBI
|
|
40
|
Bao Y, Wang L, Shi L, Yun F, Liu X, Chen
Y, Chen C, Ren Y and Jia Y: Transcriptome profiling revealed
multiple genes and ECM-receptor interaction pathways that may be
associated with breast cancer. Cell Mol Biol Lett. 24:382019.
View Article : Google Scholar : PubMed/NCBI
|
|
41
|
Zhang HJ, Tao J, Sheng L, Hu X, Rong RM,
Xu M and Zhu TY: RETRACTED: Twist2 promotes kidney cancer cell
proliferation and invasion via regulating ITGA6 and CD44 expression
in the ECM-Receptor-Interaction pathway. Biomed Pharmacother.
81:453–459. 2016. View Article : Google Scholar : PubMed/NCBI
|
|
42
|
Song L, Li ZY, Liu WP and Zhao MR:
Crosstalk between Wnt/β-catenin and Hedgehog/Gli signaling pathways
in colon cancer and implications for therapy. Cancer Biol Ther.
16:1–7. 2015. View Article : Google Scholar : PubMed/NCBI
|
|
43
|
Seguella L, Capuano R, Pesce M, Annunziata
G, Pesce M, de Conno B, Sarnelli G, Aurino L and Esposito G: S100B
protein stimulates proliferation and angiogenic mediators release
through RAGE/pAkt/mTOR pathway in human colon adenocarcinoma Caco-2
cells. Int J Mol Sci. 20:E32402019. View Article : Google Scholar : PubMed/NCBI
|
|
44
|
Hanahan D and Weinberg RA: The hallmarks
of cancer. Cell. 100:57–70. 2000. View Article : Google Scholar : PubMed/NCBI
|
|
45
|
Hanahan D and Weinberg RA: Hallmarks of
cancer: The next generation. Cell. 144:646–674. 2011. View Article : Google Scholar : PubMed/NCBI
|
|
46
|
Arun G, Diermeier SD and Spector DL:
Therapeutic targeting of long non-coding RNAs in cancer. Trends Mol
Med. 24:257–277. 2018. View Article : Google Scholar : PubMed/NCBI
|
|
47
|
Ji P, Diederichs S, Wang W, Böing S,
Metzger R, Schneider PM, Tidow N, Brandt B, Buerger H, Bulk E, et
al: MALAT-1, a novel noncoding RNA, and thymosin beta4 predict
metastasis and survival in early-stage non-small cell lung cancer.
Oncogene. 22:8031–8041. 2003. View Article : Google Scholar : PubMed/NCBI
|
|
48
|
Zhuang M, Zhao S, Jiang Z, Wang S, Sun P,
Quan J, Yan D and Wang X: MALAT1 sponges miR-106b-5p to promote the
invasion and metastasis of colorectal cancer via SLAIN2 enhanced
microtubules mobility. EBioMedicine. 41:286–298. 2019. View Article : Google Scholar : PubMed/NCBI
|
|
49
|
Wei GH and Wang X: lncRNA MEG3 inhibit
proliferation and metastasis of gastric cancer via p53 signaling
pathway. Eur Rev Med Pharmacol Sci. 21:3850–3856. 2017.PubMed/NCBI
|
|
50
|
Lyu Y, Lou J, Yang Y, Feng J, Hao Y, Huang
S, Yin L, Xu J, Huang D, Ma B, et al: Dysfunction of the WT1-MEG3
signaling promotes AML leukemogenesis via p53-dependent and
-independent pathways. Leukemia. 31:2543–2551. 2017. View Article : Google Scholar : PubMed/NCBI
|
|
51
|
Bracken CP, Scott HS and Goodall GJ: A
network-biology perspective of microRNA function and dysfunction in
cancer. Nat Rev Genet. 17:719–732. 2016. View Article : Google Scholar : PubMed/NCBI
|
|
52
|
Chan JJ and Tay Y: Noncoding RNA: RNA
regulatory networks in cancer. Int J Mol Sci. 19:E13102018.
View Article : Google Scholar : PubMed/NCBI
|
|
53
|
Gebert LFR and MacRae IJ: Regulation of
microRNA function in animals. Nat Rev Mol Cell Biol. 20:21–37.
2019. View Article : Google Scholar : PubMed/NCBI
|
|
54
|
Ishikawa D, Takasu C, Kashihara H, Nishi
M, Tokunaga T, Higashijima J, Yoshikawa K, Yasutomo K and Shimada
M: The significance of microRNA-449a and its potential target HDAC1
in patients with colorectal cancer. Anticancer Res. 39:2855–2860.
2019. View Article : Google Scholar : PubMed/NCBI
|
|
55
|
Jiang L and Hermeking H: miR-34a and
miR-34b/c suppress intestinal tumorigenesis. Cancer Res.
77:2746–2758. 2017. View Article : Google Scholar : PubMed/NCBI
|
|
56
|
Xu Q, Liu LZ, Qian X, Chen Q, Jiang Y, Li
D, Lai L and Jiang BH: miR-145 directly targets p70S6K1 in cancer
cells to inhibit tumor growth and angiogenesis. Nucleic Acids Res.
40:761–774. 2012. View Article : Google Scholar : PubMed/NCBI
|
|
57
|
Coppola JM, Bhojani MS, Ross BD and
Rehemtulla A: A small-molecule furin inhibitor inhibits cancer cell
motility and invasiveness. Neoplasia. 10:363–370. 2008. View Article : Google Scholar : PubMed/NCBI
|
|
58
|
Scamuffa N, Sfaxi F, Ma J, Lalou C, Seidah
N, Calvo F and Khatib AM: Prodomain of the proprotein convertase
subtilisin/kexin Furin (ppFurin) protects from tumor progression
and metastasis. Carcinogenesis. 35:528–536. 2014. View Article : Google Scholar : PubMed/NCBI
|
|
59
|
Chen M, Sastry SK and O'Connor KL: Src
kinase pathway is involved in NFAT5-mediated S100A4 induction by
hyperosmotic stress in colon cancer cells. Am J Physiol Cell
Physiol. 300:C1155–C1163. 2011. View Article : Google Scholar : PubMed/NCBI
|
|
60
|
Jauliac S, Lopez-Rodriguez C, Shaw LM,
Brown LF, Rao A and Toker A: The role of NFAT transcription factors
in integrin-mediated carcinoma invasion. Nat Cell Biol. 4:540–544.
2002. View
Article : Google Scholar : PubMed/NCBI
|
|
61
|
Plasterer C, Tsaih SW, Lemke A, Schilling
R, Dwinell M, Rau A, Auer P, Rui H and Flister MJ: Identification
of a rat mammary tumor risk locus that is syntenic with the
commonly amplified 8q12.1 and 8q22.1 regions in human breast cancer
patients. G3 (Bethesda). 9:1739–1743. 2019. View Article : Google Scholar : PubMed/NCBI
|
|
62
|
Zhang ZR, Zheng Y, Ruan BZ, et al:
Expression and subcellular localization of RRAGD-EGFP fusion
protein in MDA-MB-436 cells. Letters in Biotechnology. 28:639–642.
2017.(In Chinese).
|
|
63
|
Polson HE, de Lartigue J, Rigden DJ,
Reedijk M, Urbé S, Clague MJ and Tooze SA: Mammalian Atg18 (WIPI2)
localizes to omegasome-anchored phagophores and positively
regulates LC3 lipidation. Autophagy. 6:506–522. 2010. View Article : Google Scholar : PubMed/NCBI
|
|
64
|
Amaravadi R, Kimmelman AC and White E:
Recent insights into the function of autophagy in cancer. Genes
Dev. 30:1913–1930. 2016. View Article : Google Scholar : PubMed/NCBI
|
|
65
|
Wu C, Zhu X, Tao K, Liu W, Ruan T, Wan W,
Zhang C and Zhang W: MALAT1 promotes the colorectal cancer
malignancy by increasing DCP1A expression and miR203
downregulation. Mol Carcinog. 57:1421–1431. 2018. View Article : Google Scholar : PubMed/NCBI
|
|
66
|
Suljagic M, Longo PG, Bennardo S, Perlas
E, Leone G, Laurenti L and Efremov DG: The Syk inhibitor
fostamatinib disodium (R788) inhibits tumor growth in the Eµ-TCL1
transgenic mouse model of CLL by blocking antigen-dependent B-cell
receptor signaling. Blood. 116:4894–4905. 2010. View Article : Google Scholar : PubMed/NCBI
|
|
67
|
Bajpai M: Fostamatinib, a Syk inhibitor
prodrug for the treatment of inflammatory diseases. IDrugs.
12:174–185. 2009.PubMed/NCBI
|