Introduction
Retinoblastoma is a retinal embryo malignancy that
occurs in childhood and is triggered by mutations in the
retinoblastoma gene (RB1) in cells of the developing retina
(1,2). Retinoblastoma accounts for 3% of all
cancer types in children, and is the most common intraocular
malignancy in children (3).
Moreover, children with a family history of retinoblastoma have a
significantly increased risk of developing retinoblastoma (4). When diagnosed at an early stage and
treated with standard regimens of systemic chemotherapy and topical
consolidation therapy it is possible to successfully treat
retinoblastoma, with most patients maintaining normal vision in at
least one eye (5). However,
retinoblastoma can cause blindness or death if not treated at an
early stage (6). In addition, the
use of standard chemotherapy regimens may result in notable
toxicities and the development of secondary malignancies, such as
soft tissue sarcomas, brain tumors and osteosarcoma (7–9).
Therefore, there is an urgent need to understand the molecular
characteristics of RB1 expression in order to improve the quality
of life of patients with retinoblastoma (4,10).
It has been confirmed that clinical risk assessment
in retinoblastoma requires combining clinical traits. For example,
tumor staging, pathological grade and tumor laterality show
associations with the patient's age at diagnosis, overall survival
and second malignancy in retinoblastoma (11). High-risk histopathologic features
(HRPFs) are closely related to poor prognosis, including tumor
invasion of the optic nerve, choroid or anterior chamber,
suggesting the need for postenucleation adjuvant chemotherapy
(12). Therefore, it is necessary
to identify gene coexpression modules associated with these
clinical traits.
Network-based analysis has been used to characterize
clinically significant genes and constitutes a means of presenting
a variety of biological data, such as protein-protein interactions,
gene regulation, cellular pathways and signal transduction. The
core elements of biological networks may be identified by measuring
nodes based on their network features. In addition, weighted gene
coexpression network analysis (WGCNA) has been widely applied to
develop gene coexpression modules of various diseases. For example,
Zhou et al (13)
successfully applied coexpression analysis to identify gene
coexpression modules associated with the prognosis of pancreatic
carcinoma. However, there are few studies on the gene coexpression
modules associated with the clinical traits of retinoblastoma using
WGCNA.
In this study in order to comprehensively analyze
the molecular characteristics of RB1 expression, the aim was to
identify coexpression modules associated with the clinical traits
of retinoblastoma based on WGCNA and pathways involving the genes
in these modules, as well as identifying hub genes related to
clinical traits by combining the findings with protein-protein
interaction (PPI) network. This study will contribute to an
improved understanding of the development of retinoblastoma.
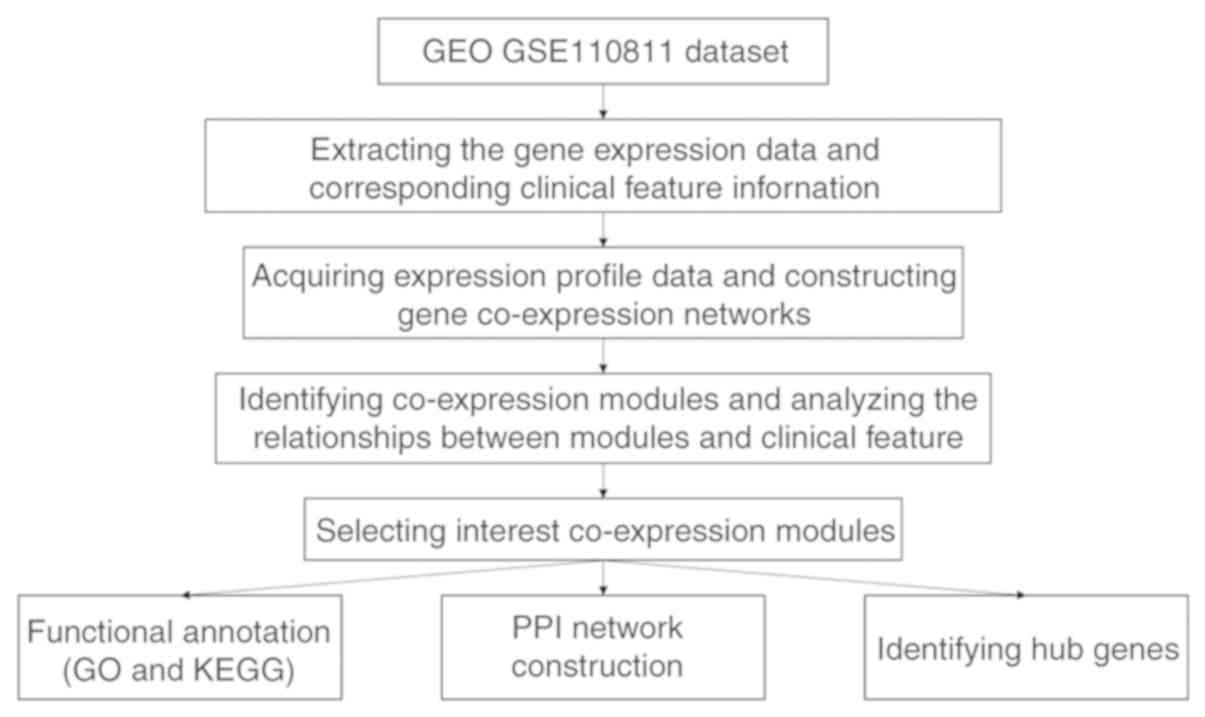
Materials and methods
Raw data and pretreatment
The GSE110811 dataset was downloaded from Gene
Expression Omnibus (https://www.ncbi.nlm.nih.gov/geo/). The dataset
contains the gene expression profiles of 28 retinoblastoma samples
based on the GPL16686 platform (Human Gene 2.0 ST array;
Affymetrix; Thermo Fisher Scientific, Inc.) (12). Annotation information of microarray
data was used to match probes with corresponding gene information.
Probes matching with more than one gene were excluded, and average
expression values were calculated for genes matching with more than
one probe. Corresponding clinical information was also obtained.
The workflow chart is shown in Fig.
1.
Construction of the gene coexpression
network by WGCNA
A gene coexpression network was built with the WGCNA
algorithm (14). Before
constructing the network, the number of genes with different
expression threshold was calculated, and the appropriate soft
threshold value was then determined. Cluster analysis of 28 samples
was performed at the appropriate threshold value using the
flashclust package in R. The function pickSoftThreshold was applied
to the calculate scale-free topology model fitting index
(R2) and mean connectivity values corresponding to
different soft threshold values (β; ranging from 1–20). The
connectivity suggests the degree of correlation to which a gene is
related to other genes in the network. The appropriate power value
was estimated when R2 was 0.85. Furthermore, the gene
expression matrix was transformed into an adjacency matrix and a
topological overlap matrix (TOM). The corresponding dissimilarity
of TOM (1-TOM) was calculated. The topological overlap is a measure
of gene biological similarity based on pairwise gene coexpression
correlation. A cluster dendrogram was constructed based on 1-TOM,
and the DynamicTreeCut package (http://www.genetics.ucla.edu/labs/horvath/CoexpressionNetwork/BranchCutting/)
was used to assign branches and generate modules. The heatmap
package was employed to visualize the TOM among 400 randomly
selected genes. For module construction, the default for
maxBlockSize was 5,000, and deepSplit was set to 2. After
calculating module eigengenes (MEs) using the function
moduleEigengenes, modules with similar expression patterns were
merged by the function mergeCloseModules. During this process, MEs
are the major components of the first principal component in a
module with the same expression profile, which can reflect the
entire features of module genes.
Module-trait relationship
construction
Correlation between MEs and clinical traits was
analyzed by Pearson correlation analysis. R>0.8 was considered
to indicate a strong correlation. For each expression profile, gene
significance (GS) was calculated as the absolute value of the
correlation between the expression profile and each clinical trait.
Module membership (MM) was defined as the correlation between the
expression profile and each ME (15). Thus, genes with a high significance
for clinical traits and MM were identified by two parameters.
Functional and pathway enrichment
analyses
To explore the biological processes and pathways in
which the genes indicated in the module participate, functional
enrichment analysis was performed via the clusterProfiler package
in R language, including Gene Ontology (GO) and Kyoto Encyclopedia
of Genes and Genomes (KEGG) enrichment analyses (16). GO terms include ‘biological
process’, ‘molecular function’ and ‘cellular component’. P<0.05
after correction was set as the cutoff criterion.
PPI network and core subnetwork
construction
PPI network analysis is a powerful tool for
understanding the biological responses occurring in retinoblastoma.
In the PPI network, a protein is defined as a node, and the
interaction between two nodes is defined as an edge. The size of a
node represents a degree: The larger the node, the larger the
degree (17). The thickness of an
edge indicates a correlation: The thicker the edge, the higher the
correlation. Genes in the indicated modules were entered into the
STRING online database (http://string-db.org/), and the cutoff value was set
to 0.17. Related pairs of genes were retrieved and visualized with
Cytoscape (version 3.4.0) (18).
As an open platform with numerous plugins, the function of
Cytoscape is to expand visualization options and network analysis
power. Cytoscape cytoHubba plugin was used to select the top ten
hub nodes according to maximal clique centrality (MCC) (19), and the Cytoscape MCODE plugin was
applied to identify core subnetworks with highly interconnected
nodes (20).
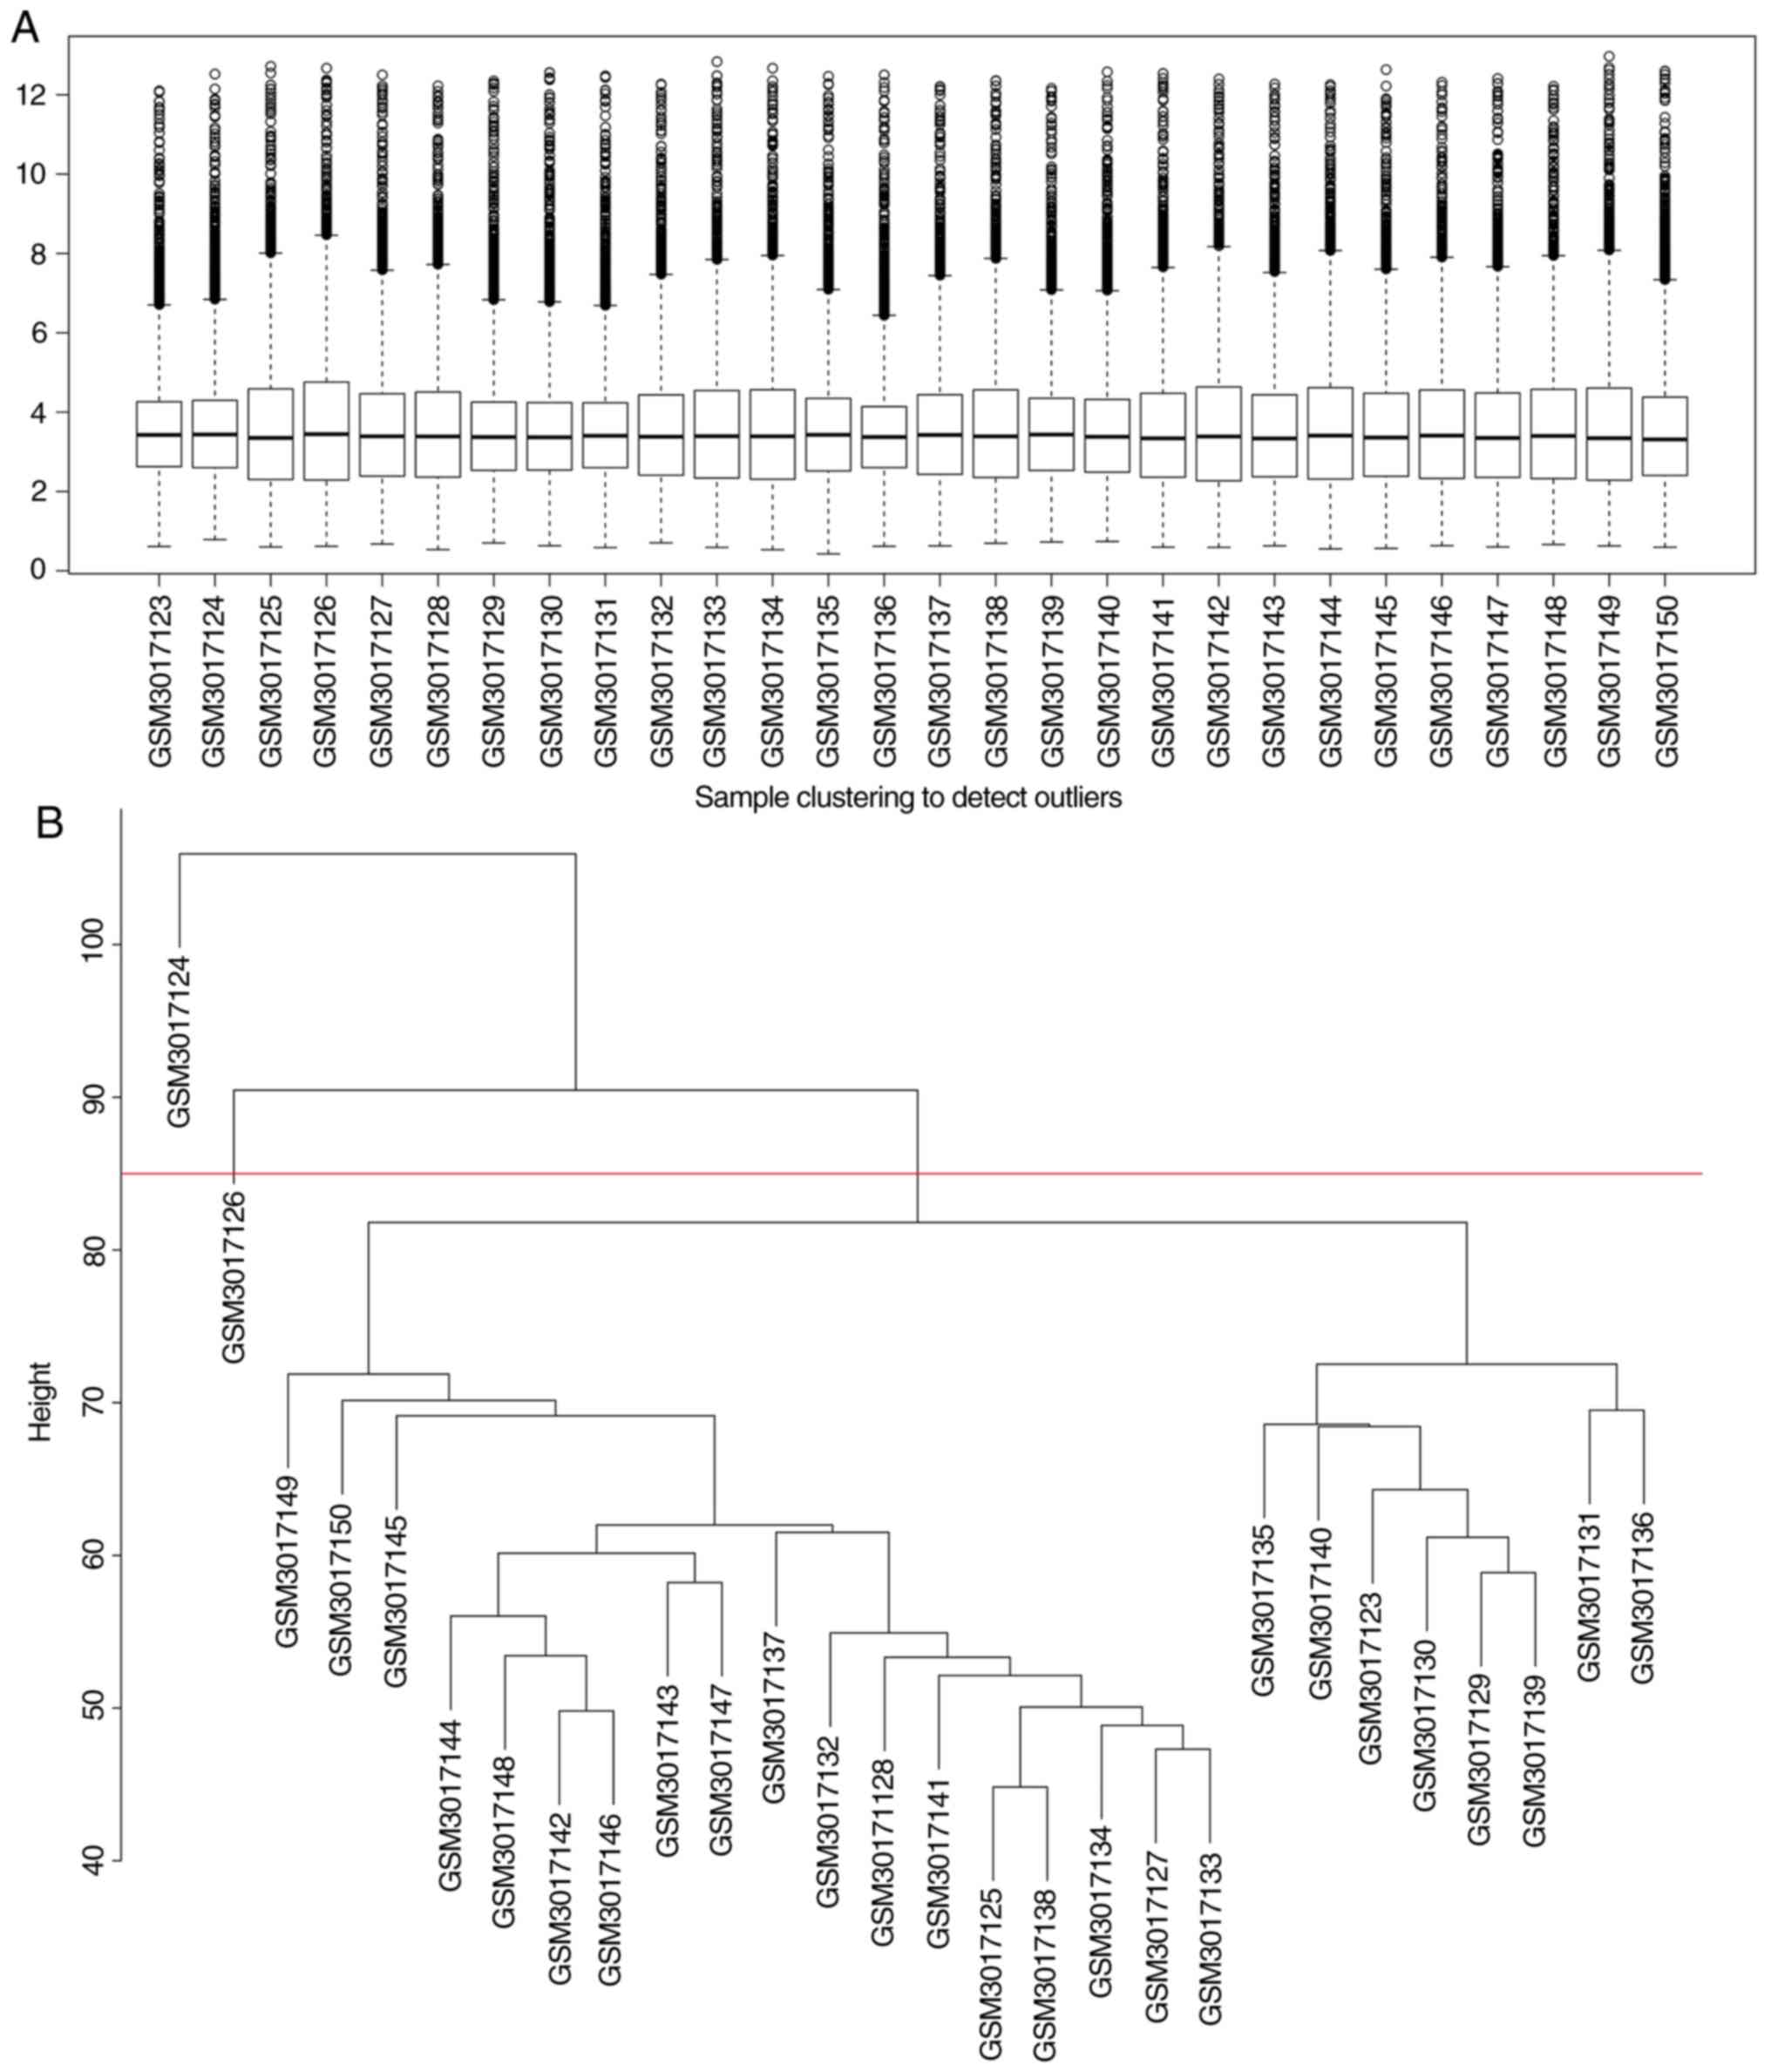
Results
Gene expression data
The box plot shows the expression value of each gene
in 28 retinoblastoma samples (Fig.
2A). The average expression value of all mRNAs in each sample
was nearly consistent, suggesting that the GSE110811 dataset was
well normalized. As shown in Fig.
2B, two outlier samples (GSM3017126 and GSM3017124) were
removed.
Coexpression module construction
When the soft threshold power value β was equal to
eight, the connectivity between genes conformed to a scale-free
network distribution (Fig. 3A-D).
Different coexpression modules of retinoblastoma were identified by
hierarchical clustering and dynamic branch cutting, which are shown
as different colors in Fig. 3E.
After merging similar modules, eight coexpression modules were
generated. The number of genes in the eight-coexpression modules is
listed in Table I. The gray module
represents the set of genes that were not assigned to any module.
Eigengenes were used as representative gene expression profiles,
quantifying module similarity through eigengene correlation
(Fig. 3F).
 | Table I.Number of genes in the
eight-coexpression modules. |
Table I.
Number of genes in the
eight-coexpression modules.
| Module colors | Frequency |
|---|
| Black | 44 |
| Blue | 836 |
| Brown | 146 |
| Green | 91 |
| Grey | 697 |
| Red | 49 |
| Turquoise | 3,039 |
| Yellow | 98 |
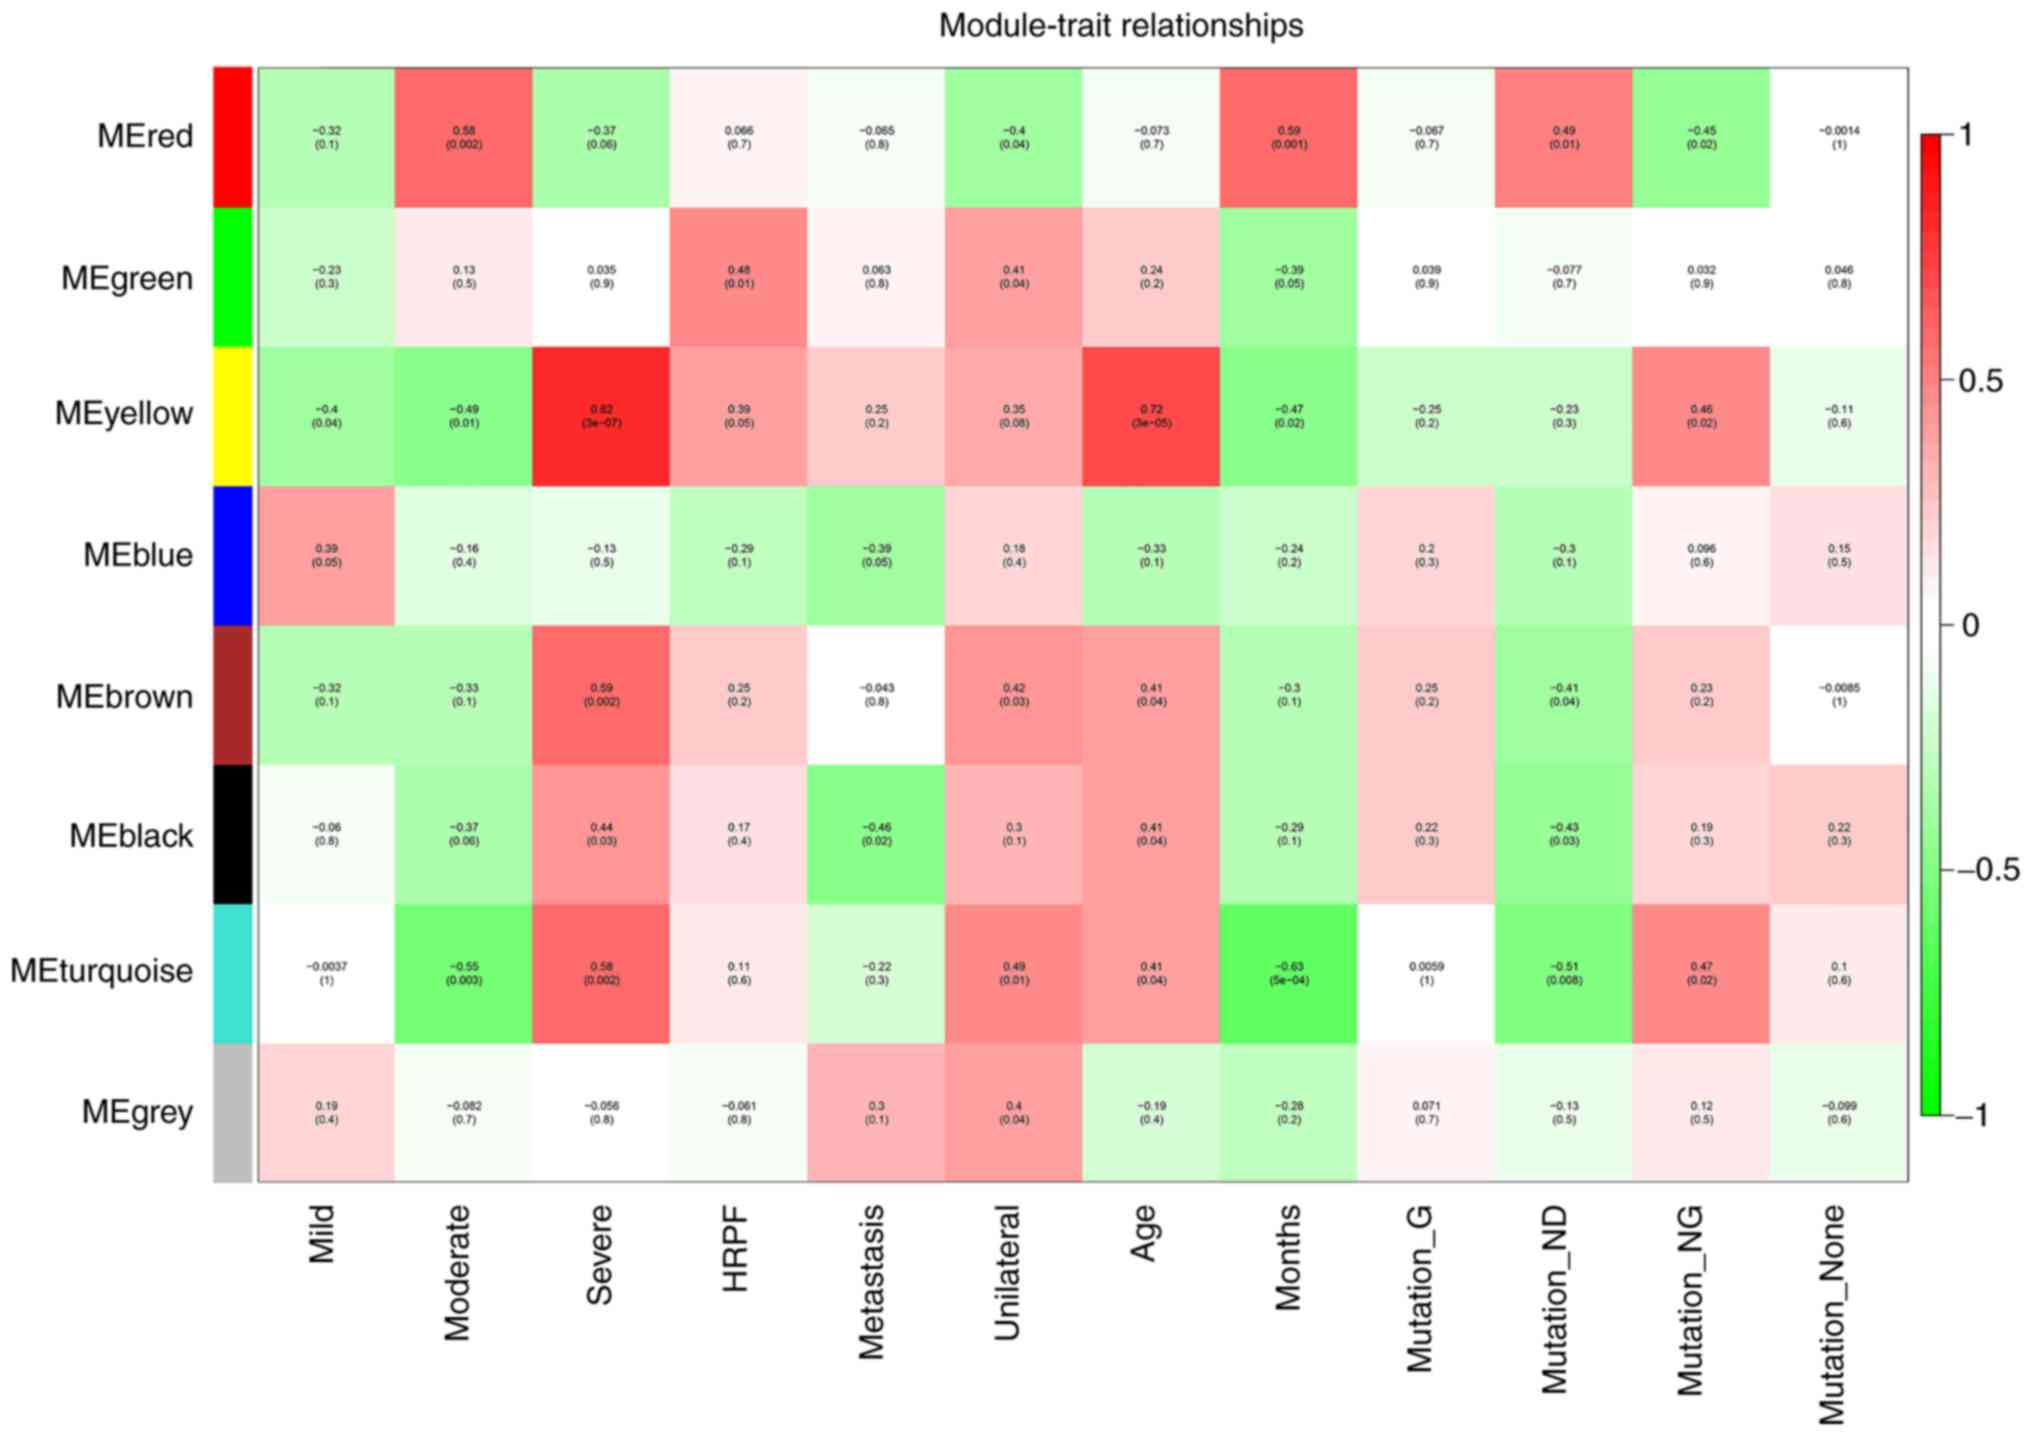
Module-trait relationship
construction
To explore meaningful modules associated with
clinical traits, correlations between MEs and the following
clinical traits were analyzed: Age; HRPF; metastasis; mild;
moderate; severe; unilateral; survival time (months); mutation
germline (mutation G); mutation not known or test not done
(mutation ND); mutation none; and mutation nongermline (mutation
NG; Fig. 4). Among them, HRPF has
been confirmed to be associated with a poor prognosis in
retinoblastoma. Moreover, anaplastic grades (mild, moderate and
severe) are able to predict risk stratification for retinoblastoma.
As shown in Fig. 4, different
colors represent different correlation coefficients; furthermore,
the green suggests negative correlation and the red stands for
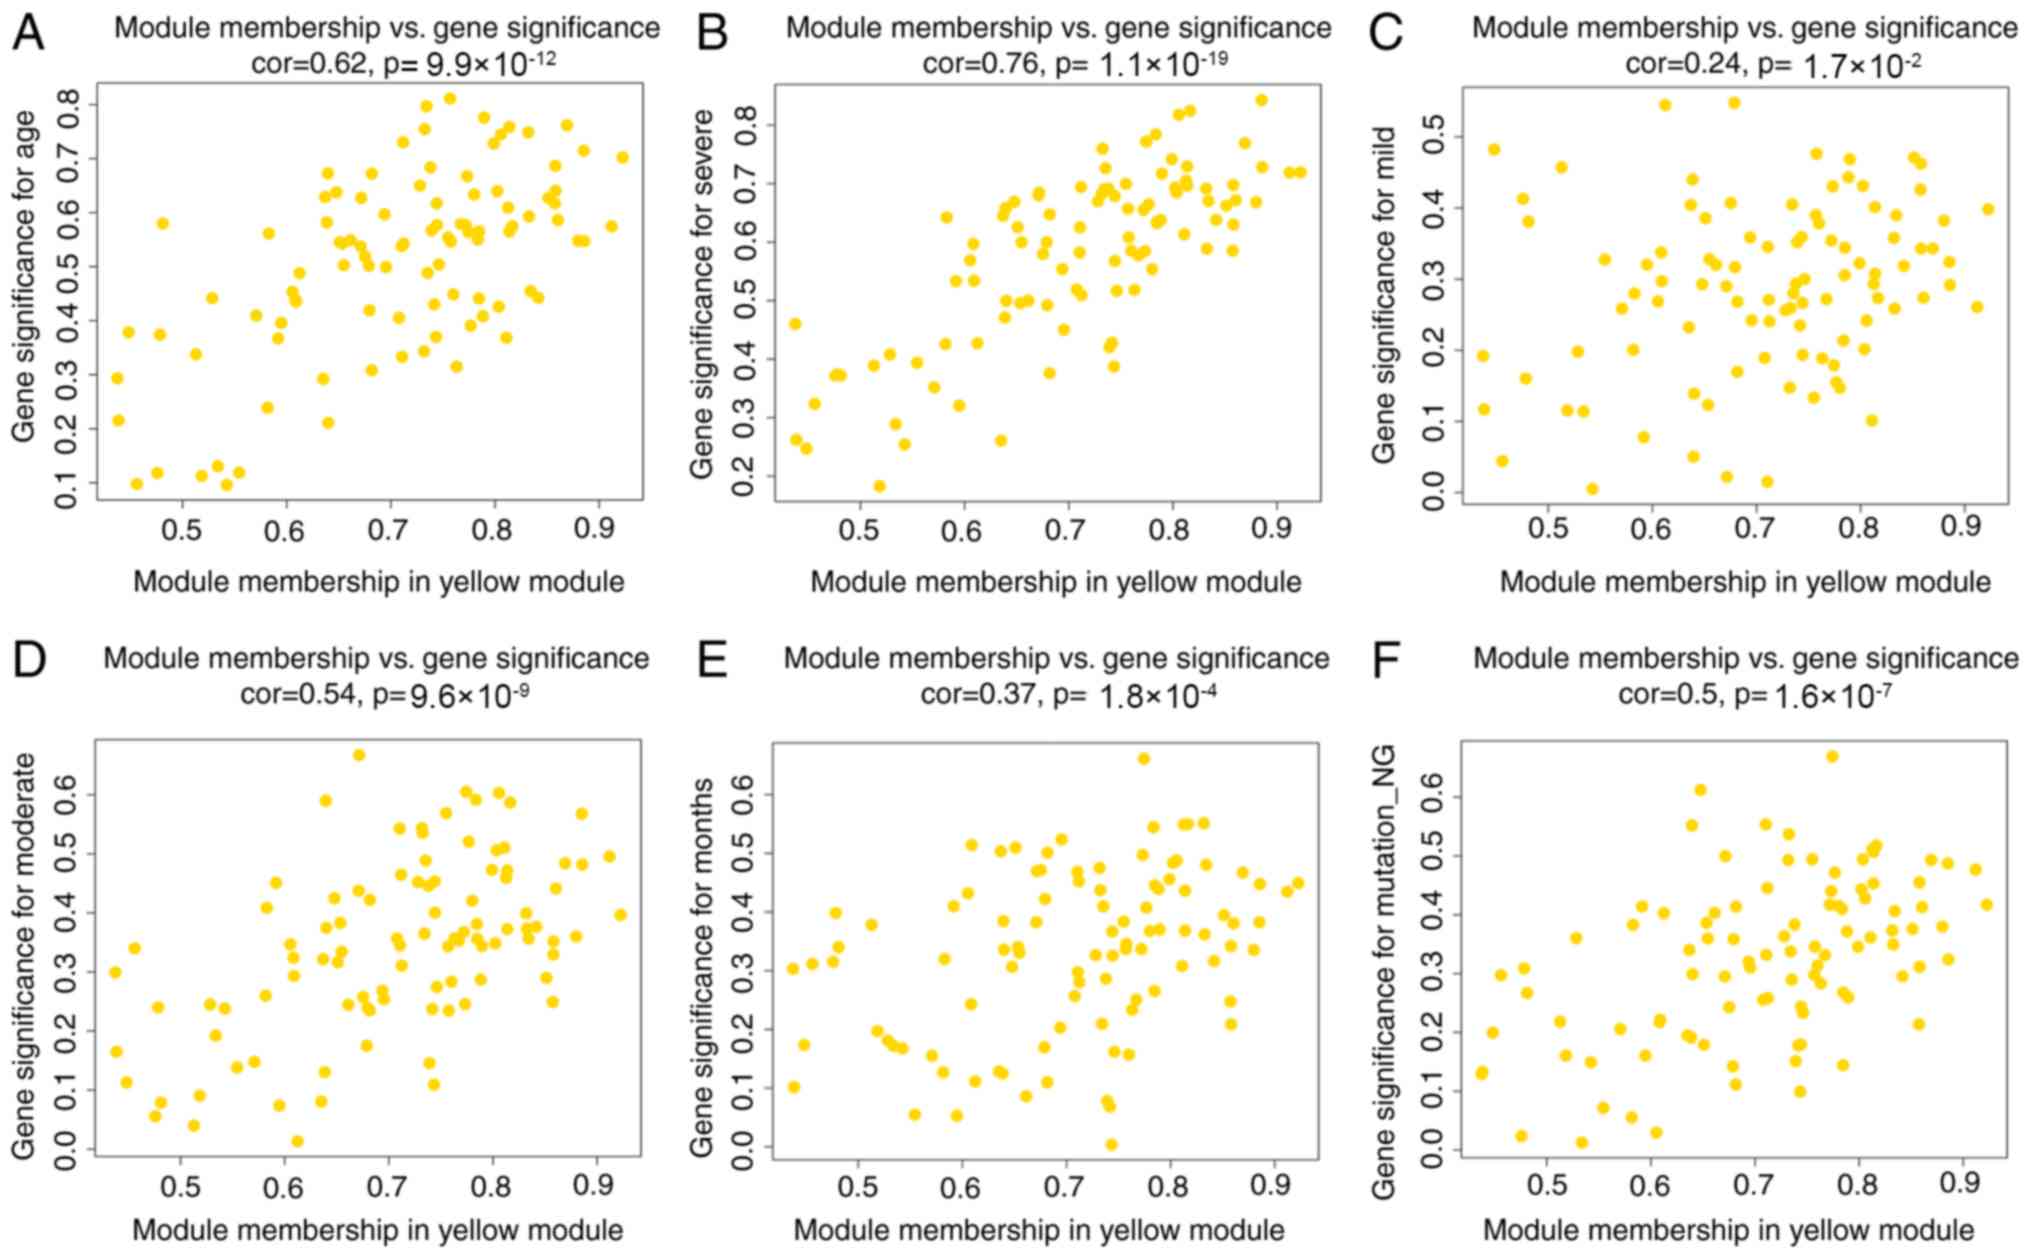
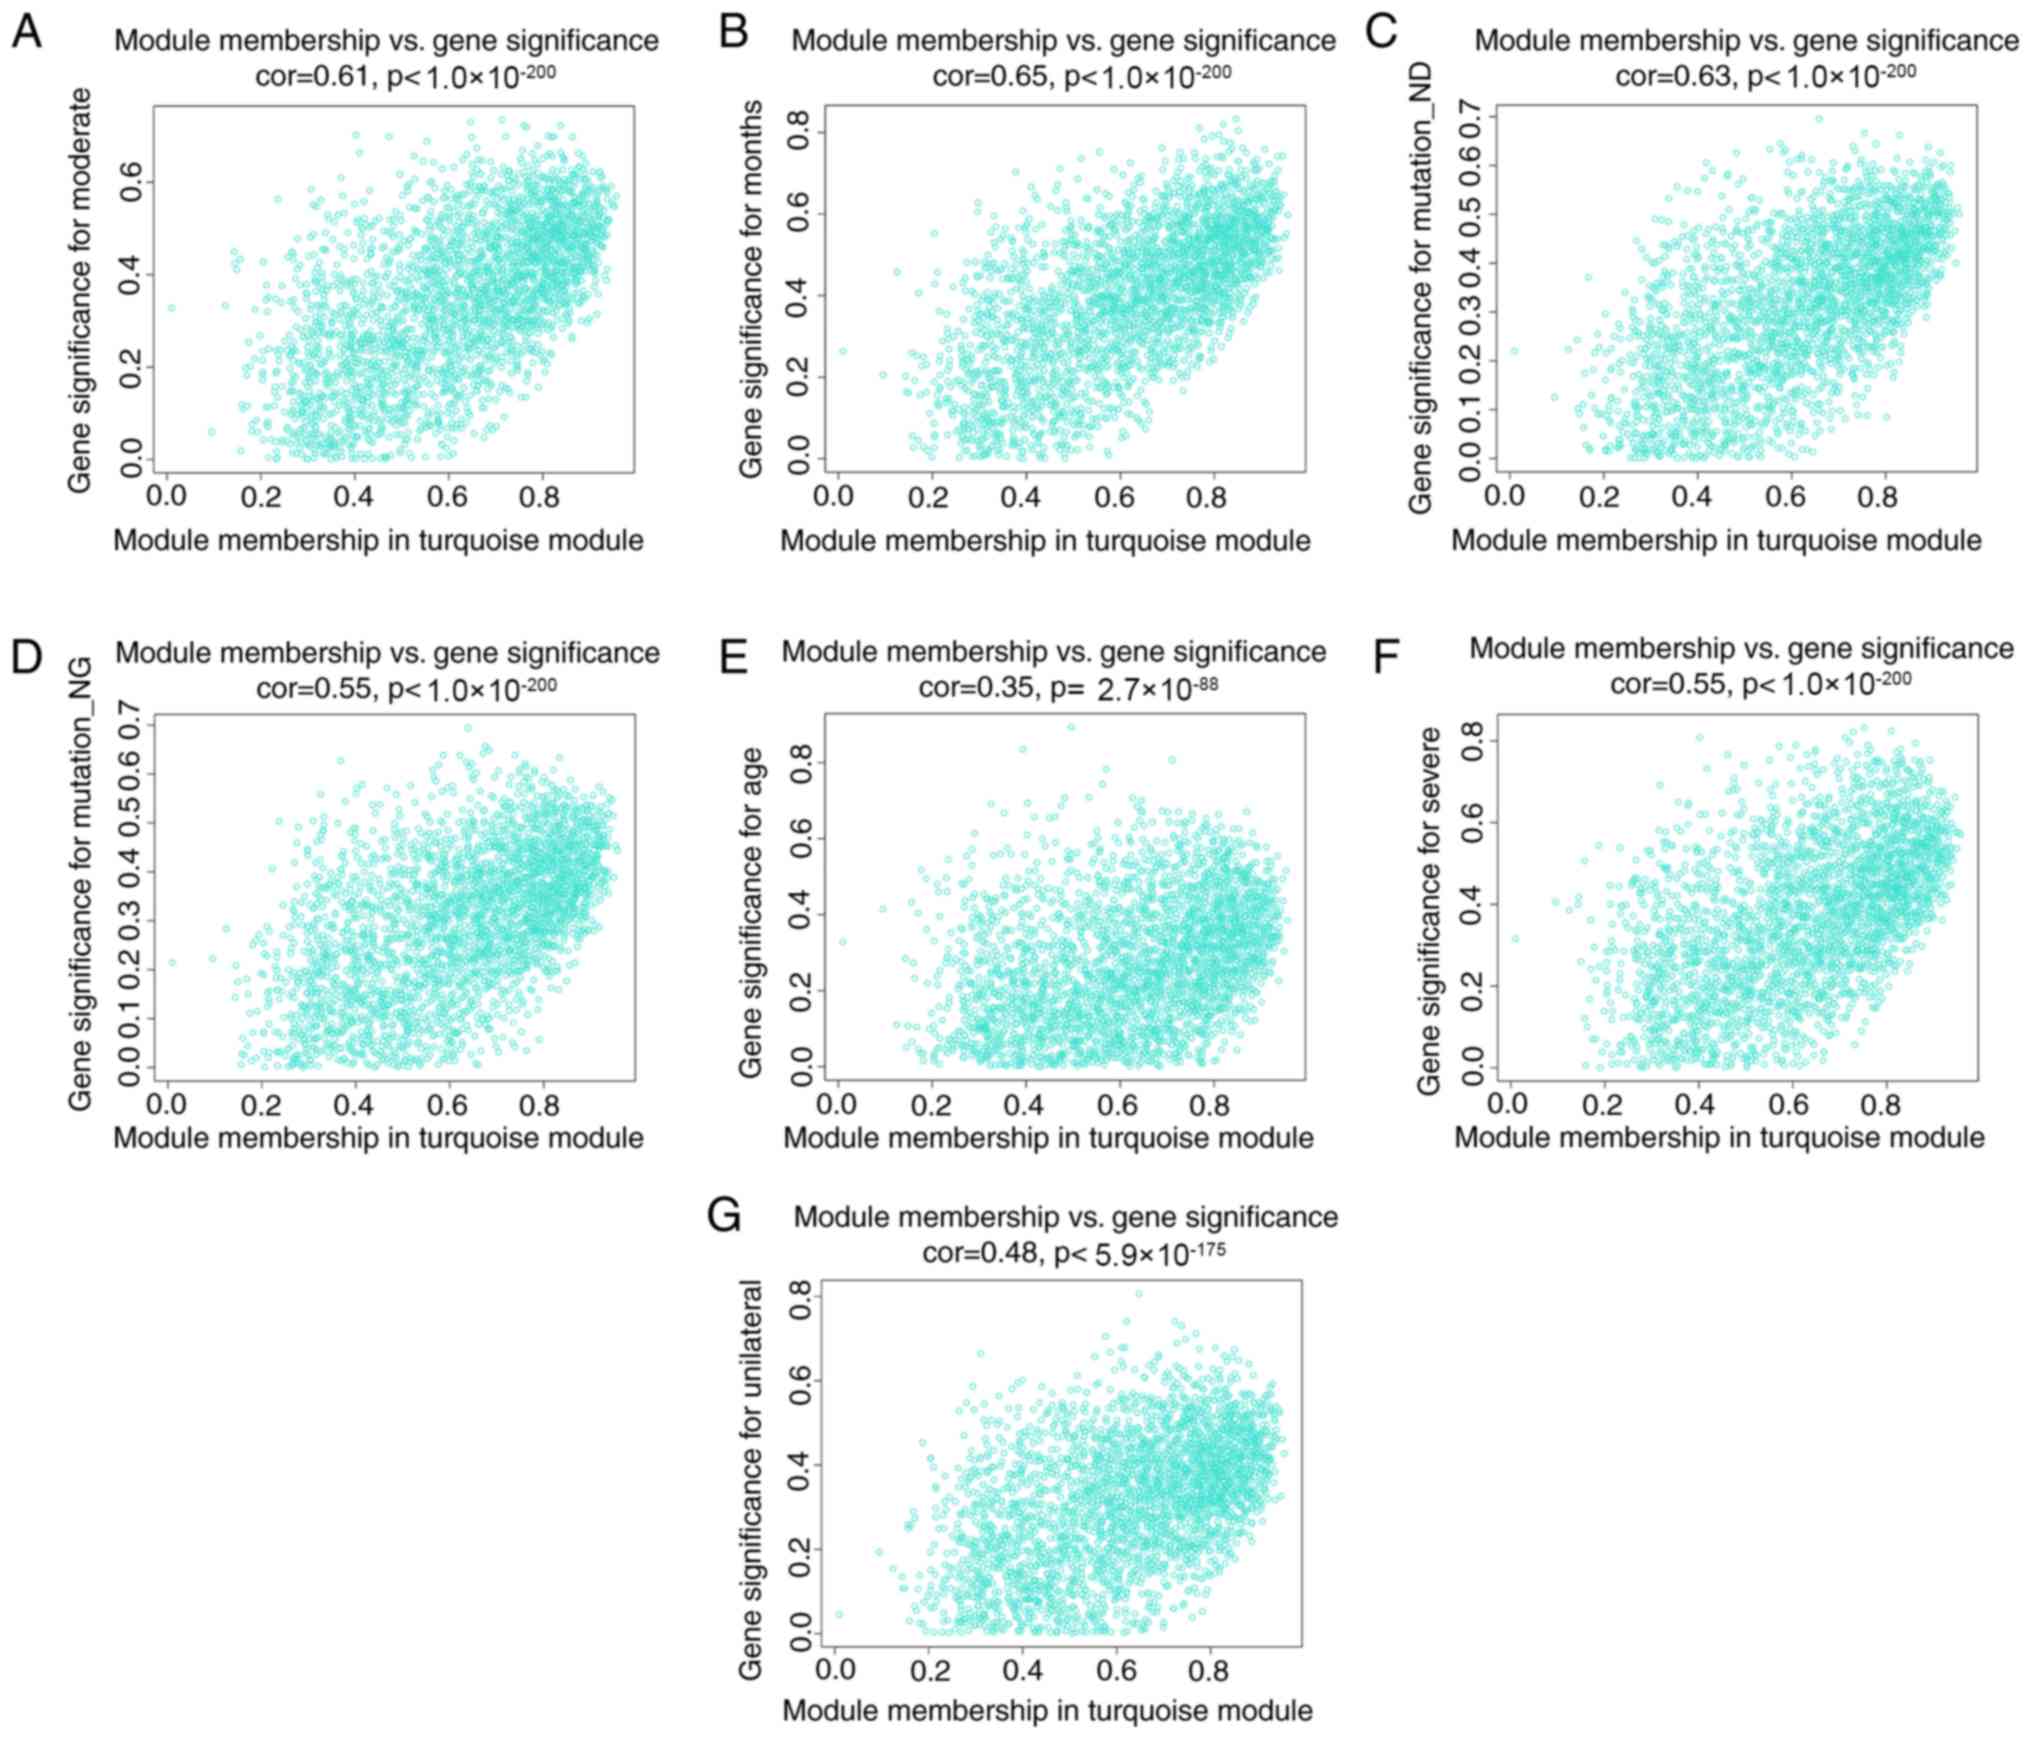
positive correlation. It was found that the yellow module had the
highest association with severe anaplasia and age (r=0.82 and
P=3e-07; r=0.72 and P=3e-05) and that the turquoise module had the
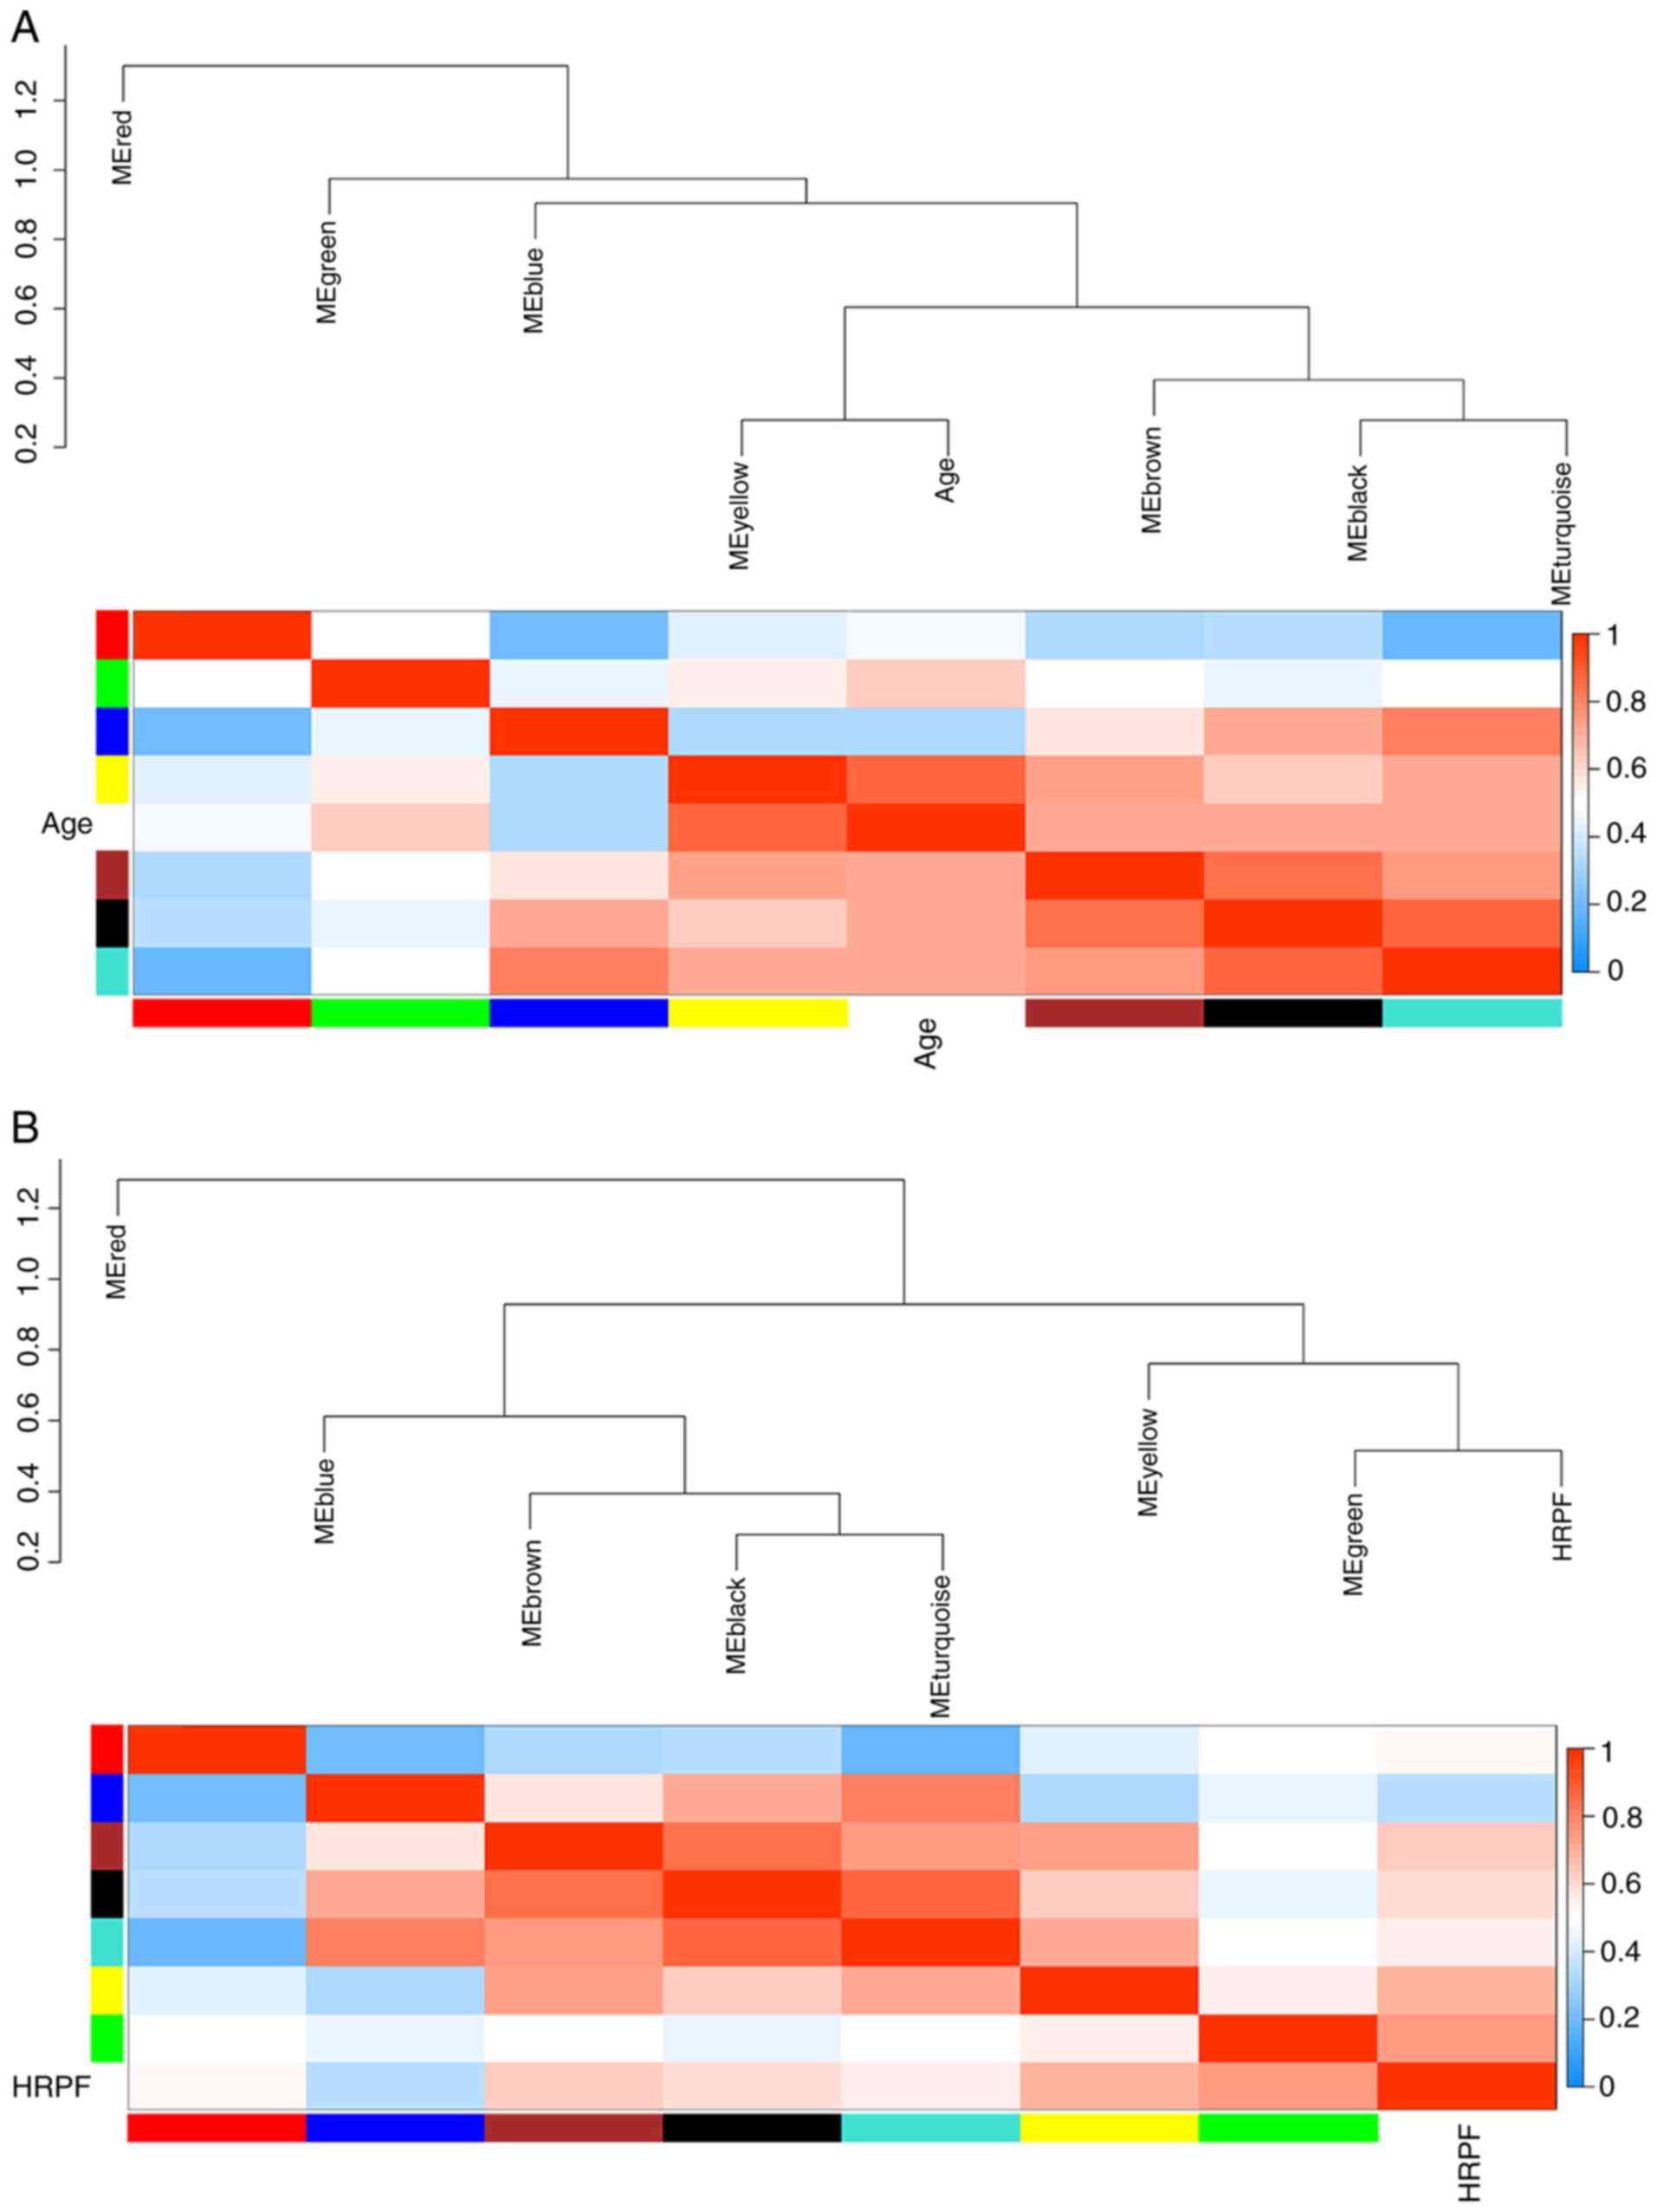
highest association with months (r=−0.63 and P=5e-04). The
eigengene dendrogram and heatmap showed that the MEyellow module
was highly related to severe anaplasia and age, and the MEturquoise
module was highly related to months (Fig. 5A-J). Therefore, the two modules
were selected as meaningful modules associated with clinical
traits. The scatterplots of GS vs. MM in the MEyellow and
MEturquoise modules are shown in Figs.
6A-F and 7A-G, respectively.
The above results revealed that the yellow and turquoise modules
were significantly associated with clinical traits.
Functional enrichment analysis of
genes in the yellow and turquoise modules
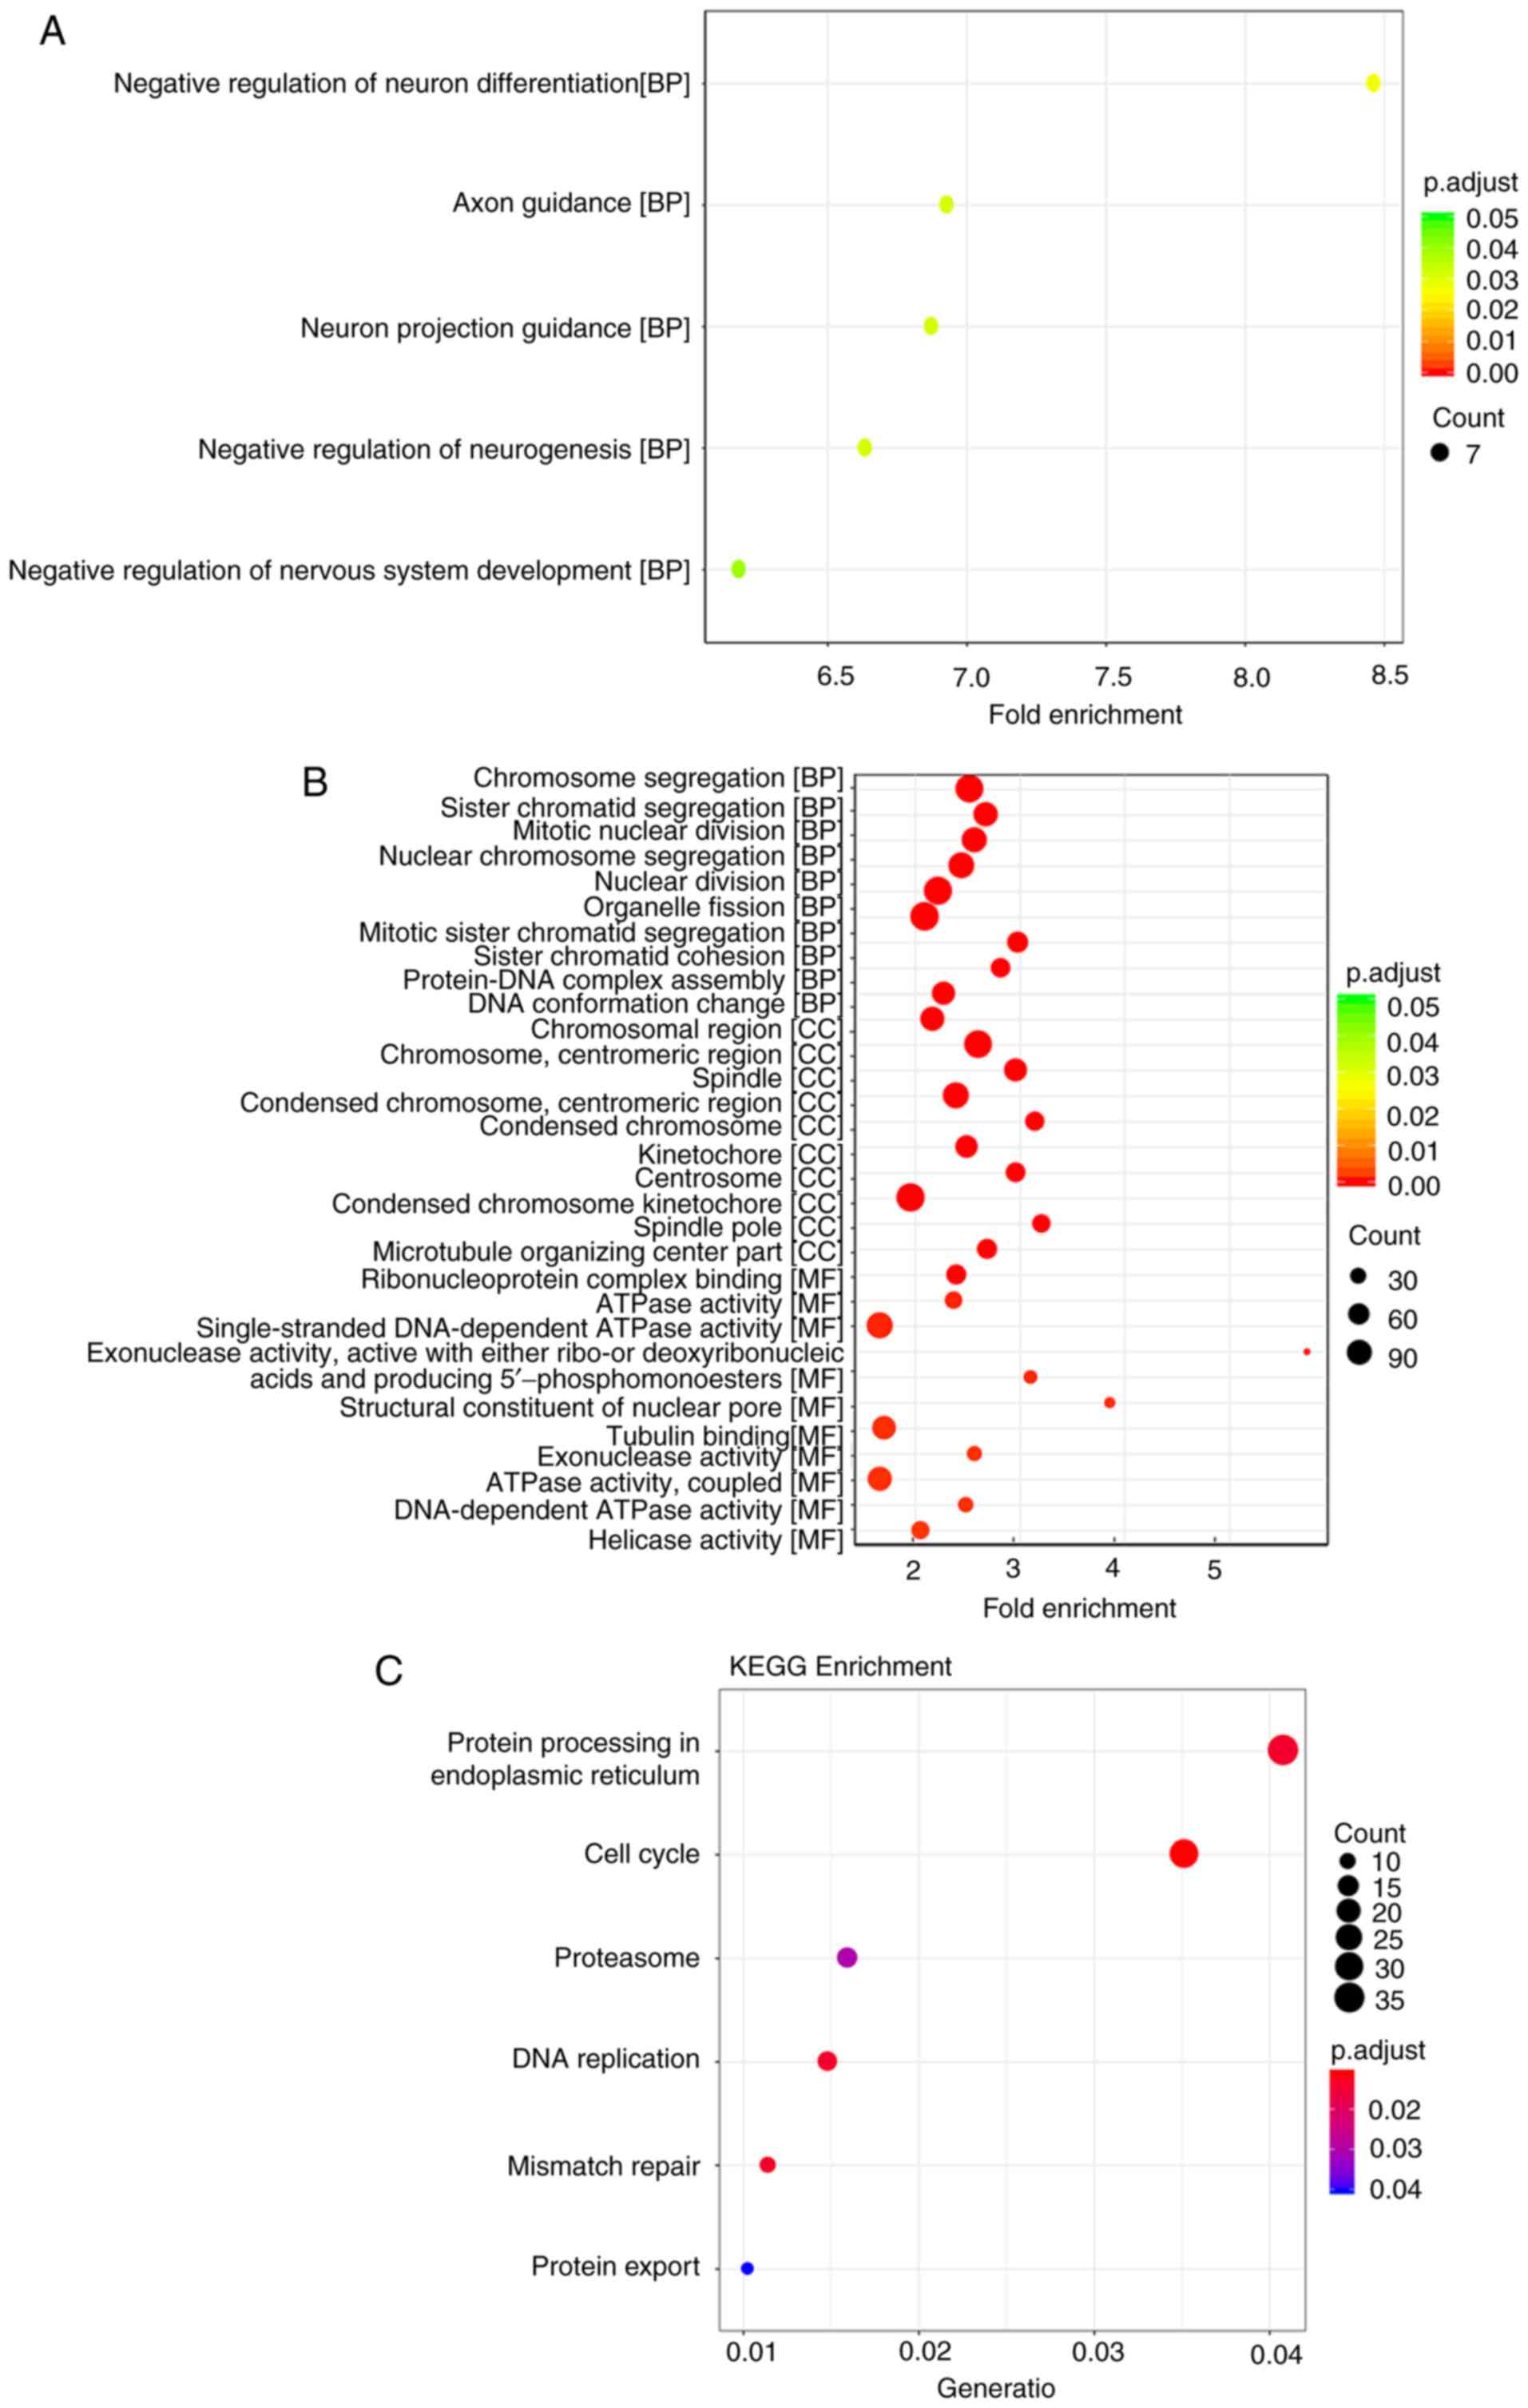
KEGG and GO enrichment analyses were performed for
the genes in the yellow and turquoise modules, and a significant
difference in the biological processes enriched by the genes in the
two-coexpression modules was observed. For GO analysis, genes in
the yellow module are mainly enriched in negative regulation of
neuron differentiation, axon guidance, neuron projection guidance,
negative regulation of neurogenesis and negative regulation of
nervous system development (Fig.
8A). However, no KEGG pathways enriched with genes in the
yellow module were found. For GO analysis, genes in the turquoise
module are mainly enriched in chromosome segregation, organelle
fission, chromosomal region, centrosome, tubulin binding, ATPase
activity and coupling (Fig. 8B).
In KEGG enrichment analysis, genes in the turquoise module are
enriched in protein processing in the endoplasmic reticulum, cell
cycle, proteasome, DNA replication, mismatch repair and protein
export (Fig. 8C).
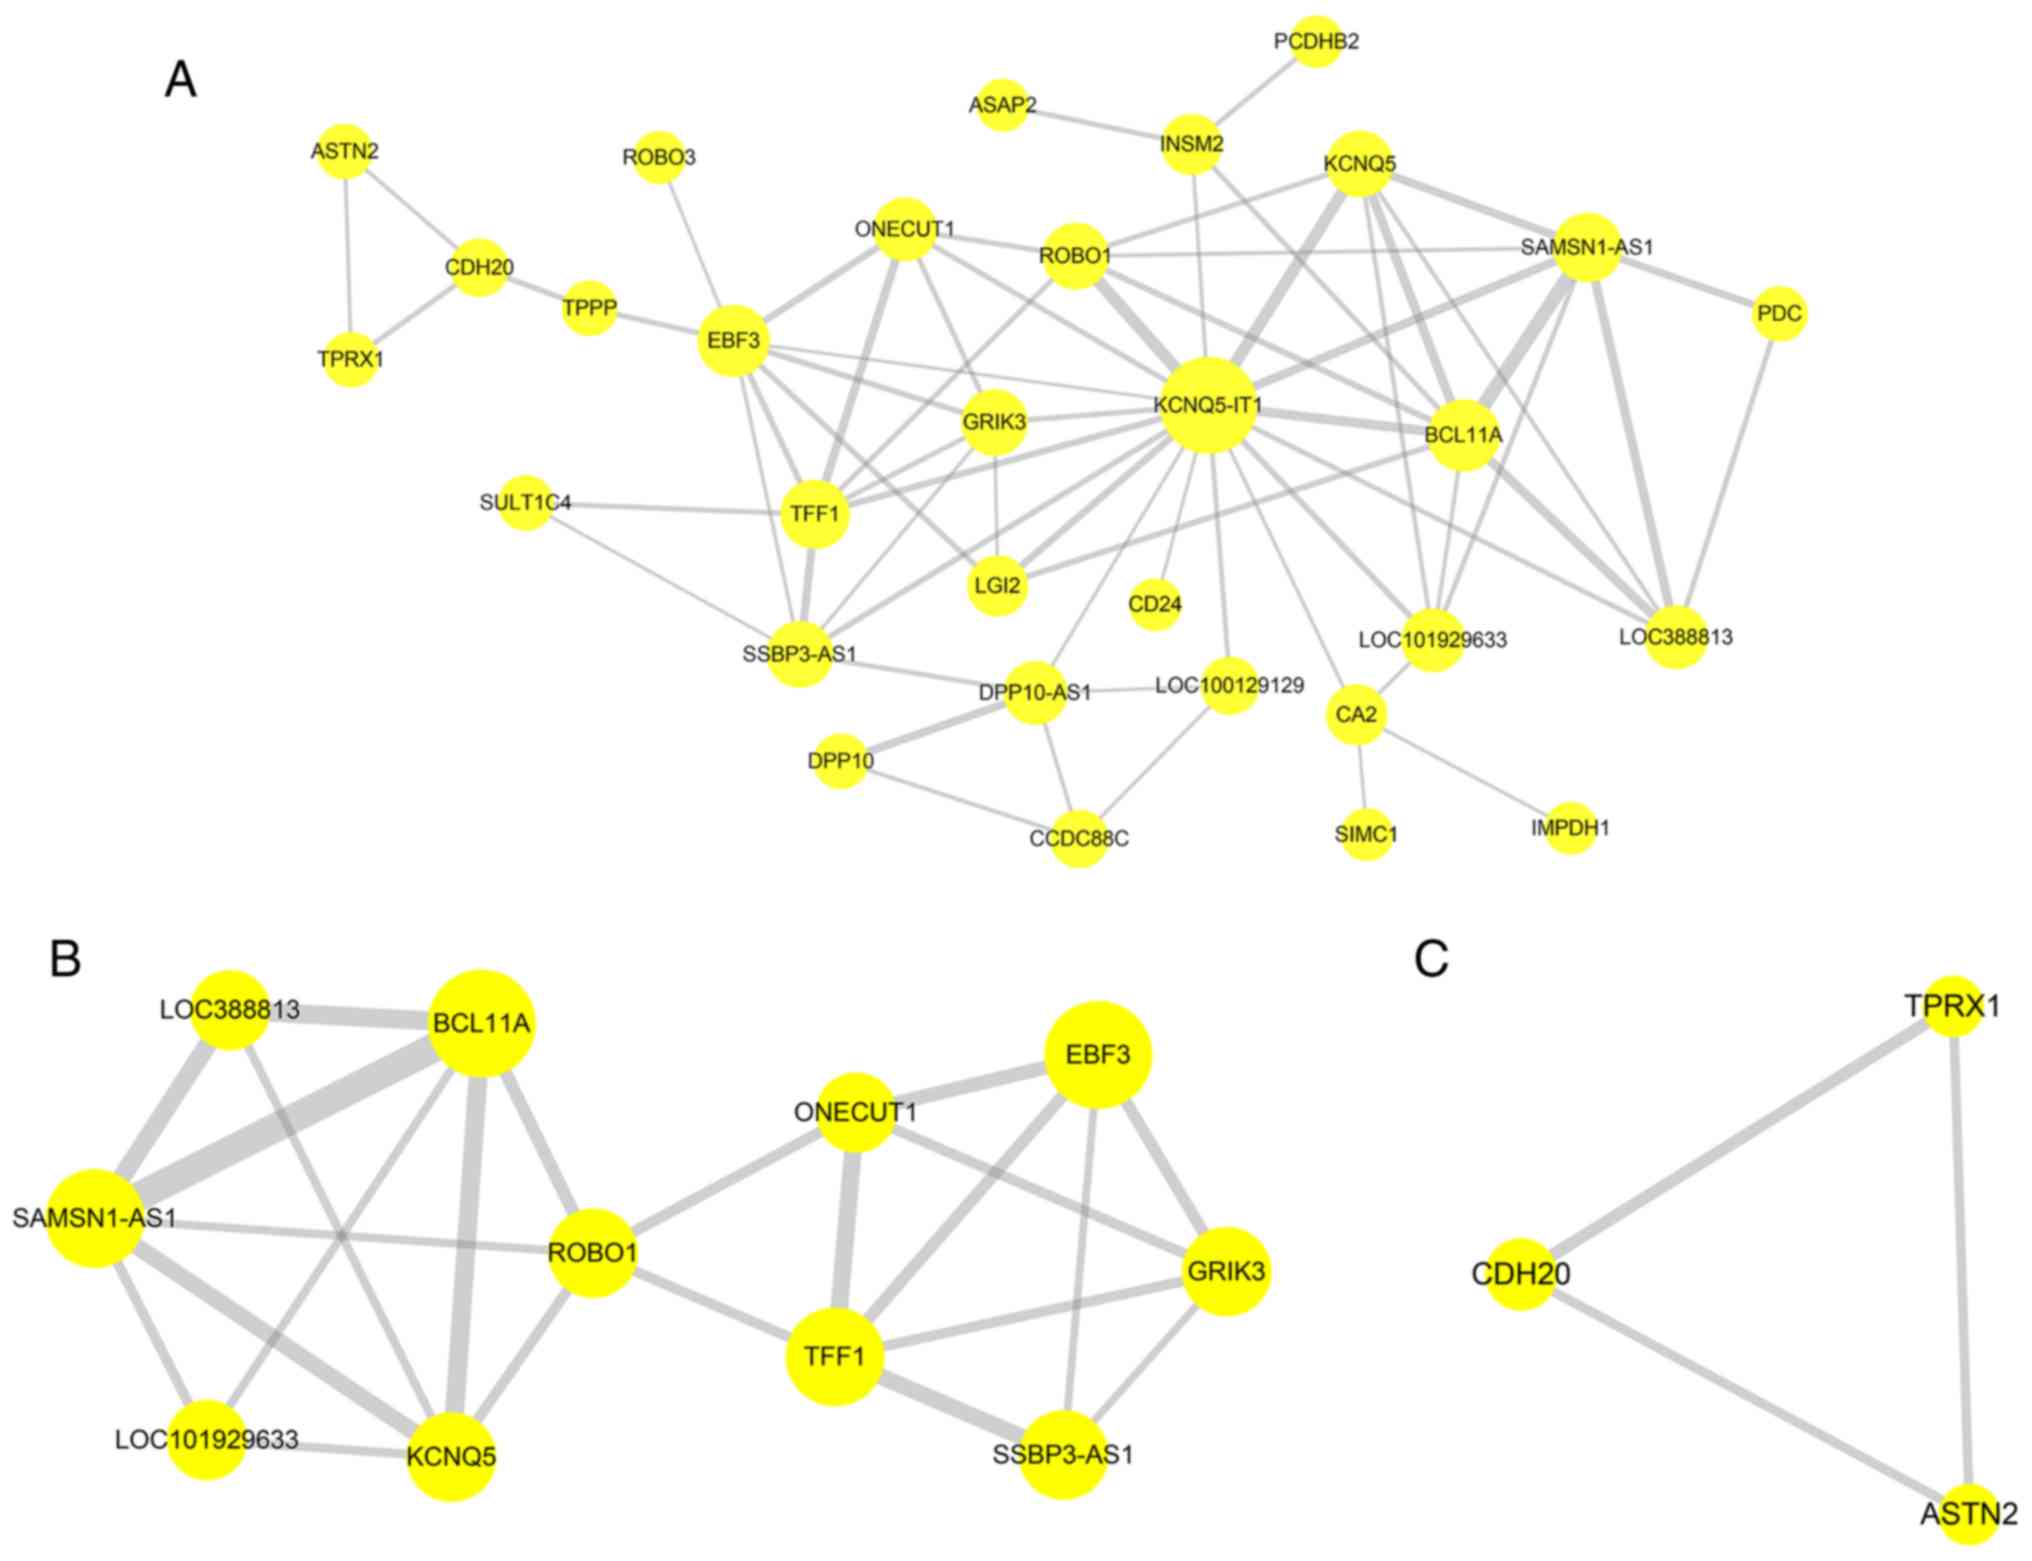
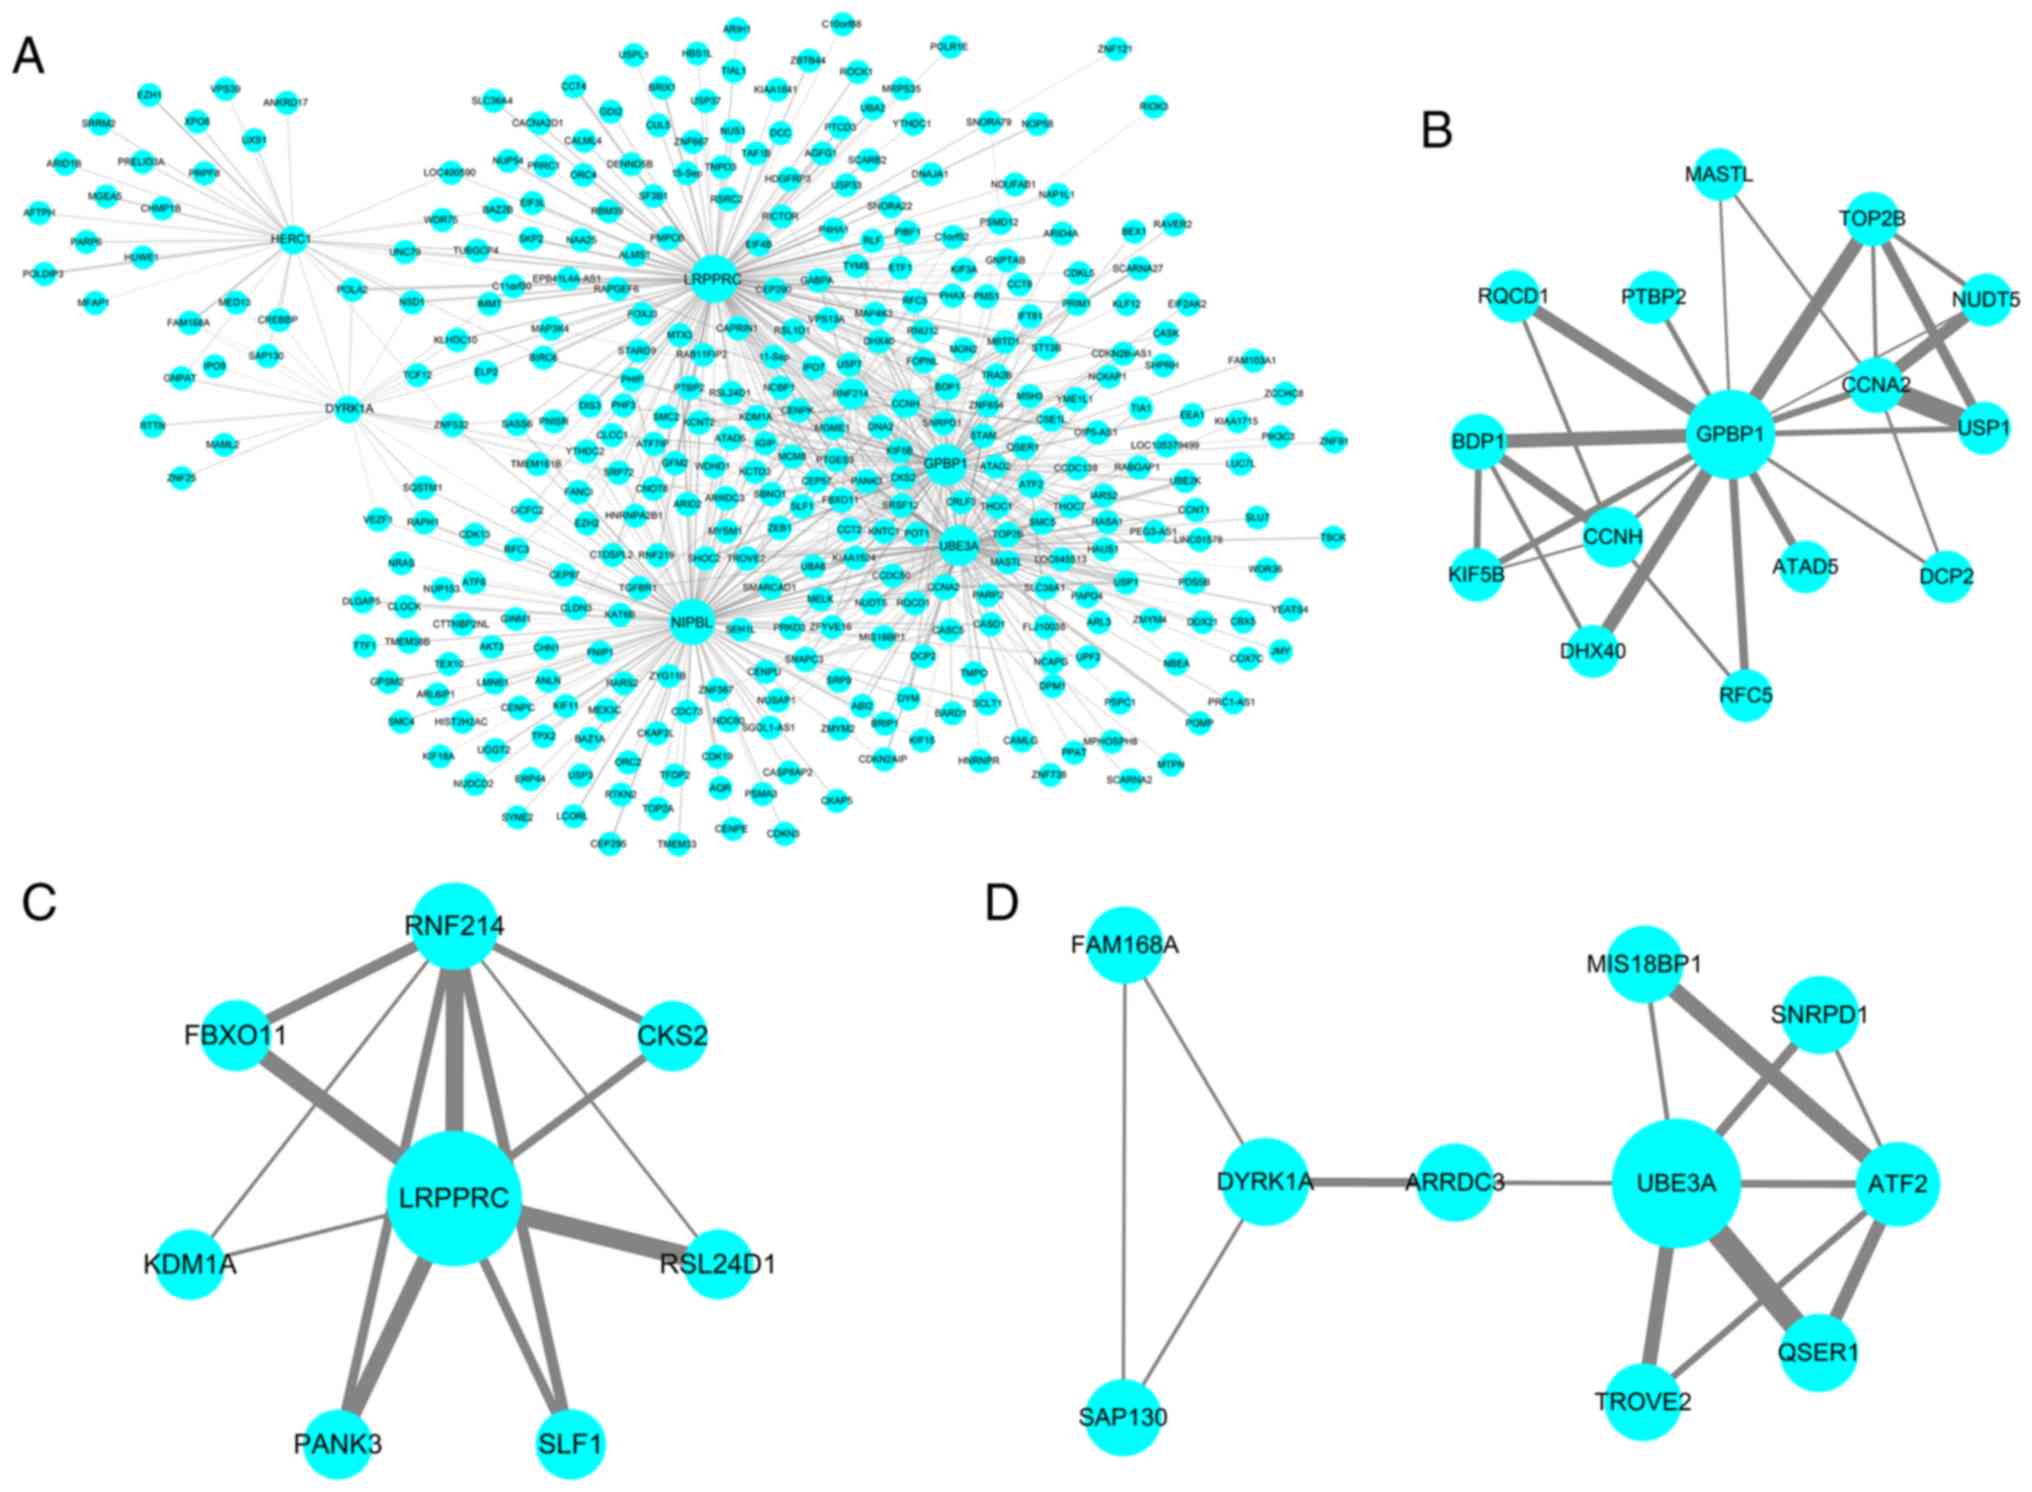
PPI network construction
Genes in the yellow modules were used to construct
the PPI network (Fig. 9A);
subnetworks were then constructed to explore more specific and
detailed information in the PPI network, as identified using the
Cytoscape MCODE plugin. Two subnetworks (scores=4.6 and 3) were
obtained for the yellow module (Fig.
9B and C). Genes in the turquoise modules were used to
construct the PPI network (Fig.
10A). In total, three subnetworks (scores=4, 3.714 and 3.111)
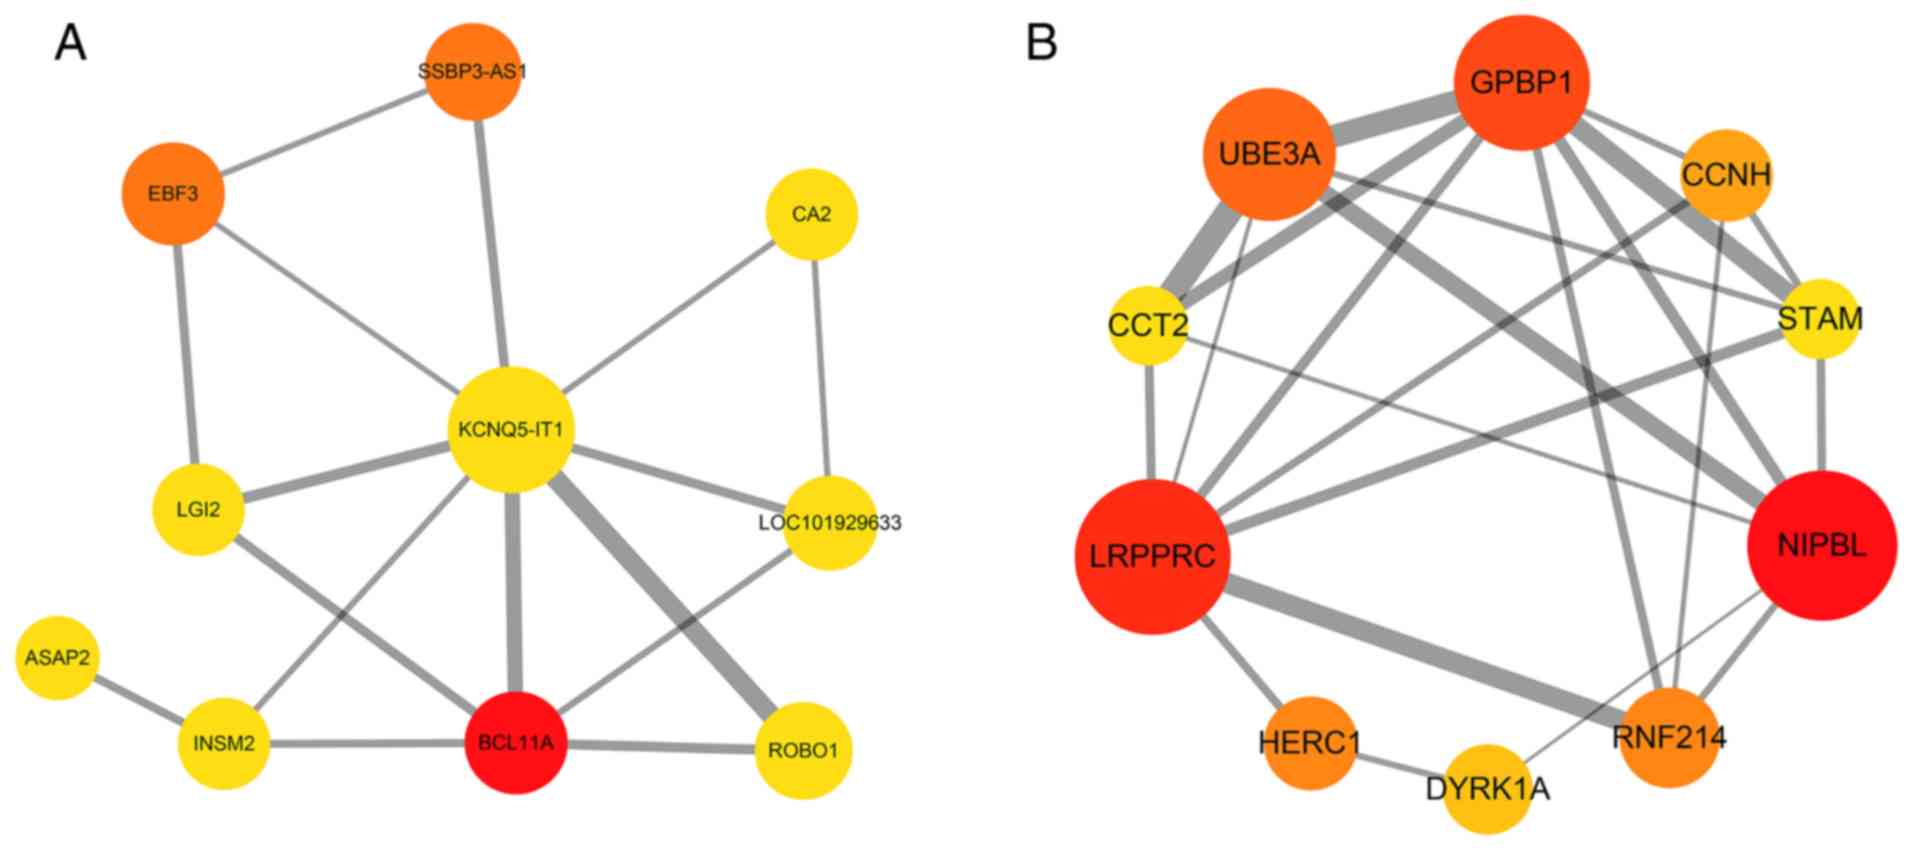
were obtained for the turquoise module (Fig. 10B-D). The Cytoscape CytoHubba
plugin was employed to find the top ten hub genes with a high
degree of connectivity between the nodes, according to the MCC. The
top 10 hub genes identified from the PPI network of genes in the
yellow and turquoise modules are shown in Fig. 11A and B, respectively, and the top
ten hub genes in the yellow and turquoise modules are listed in
Tables II and III, respectively.
| Table II.Top 10 hub genes identified from the
PPI network of genes in the yellow module. |
Table II.
Top 10 hub genes identified from the
PPI network of genes in the yellow module.
| Rank | Gene name | Score |
|---|
| 1 | BCL11A | 3 |
| 2 | SSBP3-AS1 | 2 |
| 2 | EBF3 | 2 |
| 4 | KCNQ5-IT1 | 1 |
| 4 | LOC101929633 | 1 |
| 4 | CA2 | 1 |
| 4 | ASAP2 | 1 |
| 4 | ROBO1 | 1 |
| 4 | INSM2 | 1 |
| 4 | LGI2 | 1 |
| Table III.Top 10 hub genes identified from the
PPI network of genes in the turquoise module. |
Table III.
Top 10 hub genes identified from the
PPI network of genes in the turquoise module.
| Rank | Gene name | Score |
|---|
| 1 | NIPBL | 35 |
| 2 | LRPPRC | 31 |
| 3 | GPBP1 | 24 |
| 4 | UBE3A | 21 |
| 5 | HERC1 | 8 |
| 5 | RNF214 | 8 |
| 7 | CCNH | 7 |
| 8 | DYRK1A | 4 |
| 9 | STAM | 3 |
| 9 | CCT2 | 3 |
Discussion
The present study systematically analyzed gene
expression for retinoblastoma using WGCNA and PPI networks. These
findings identified gene coexpression modules and hub genes
associated with clinical traits of retinoblastoma, providing novel
insight into retinoblastoma progression.
In the present study, 8 coexpression modules were
identified based on WGCNA. Among them, the yellow module exhibited
the highest association with histopathologic grading and age.
Histopathologic grading included mild, moderate and severe.
Histopathologic grading was determined based on tumor size, growth
pattern, level of differentiation, degree of apoptosis, grade of
anaplasia, tumor seeding, extent of tissue invasion and the
presence of retinocytoma. High parental age is associated with
increased risk of sporadic hereditary retinoblastoma (21). Therefore, early detection is
important in curing the disease using surgical treatment (22). It has been recorded that a delay of
more than 6 months from the first clinical sign to diagnosis is
associated with 70% mortality in developing countries (23). The turquoise module had the highest
association with survival time (months), indicating that the module
could become a potential prognostic factor. Therefore, the two
modules were considered important in retinoblastoma. GO analysis
revealed that the genes in the yellow module were mainly enriched
in the negative regulation of neuron differentiation, axon
guidance, neuron projection guidance, neurogenesis and development
of the nervous system. Increasing evidence suggests that neuronal
differentiation of neuroblastoma cell lines is induced by a number
of factors, such as p73, Tropomyosin receptor kinase A and
Ubiquitin C-Terminal Hydrolase L1 (24–26).
According to GO enrichment analysis, the genes in the turquoise
module are mainly enriched in chromosome segregation, organelle
fission, chromosomal region, centrosome, tubulin binding, and
ATPase activity and coupling. In KEGG enrichment analysis, it was
shown that genes in the turquoise module were enriched in protein
processing in the endoplasmic reticulum, cell cycle, proteasome,
DNA replication, mismatch repair and protein export. Hub genes in
the turquoise module were involved in these pathways. For example,
among these pathways, hub gene CCNH was enriched in the cell cycle
pathway. Overall, the genes in the two modules may play important
roles in the development of retinoblastoma.
In this study, the top ten hub genes with a high
degree of connectivity according to MCC in the yellow and turquoise
modules were identified. The degree of a particular protein is
related to the necessity of the gene, and proteins with higher
numbers are more likely to be essential (27). As biological networks are
heterogeneous, it is necessary to capture essential proteins using
a variety of methods. The top 10 hub genes in the yellow module
included: BAF chromatin remodeling complex subunit BCL11A (BCL11A);
SSBP3 antisense RNA 1 (SSBP3-AS1); EBF transcription factor 3,
KCNQ5 intronic transcript 1 (KCNQ5-IT1); uncharacterized
LOC101929633 (LOC101929633); carbonic anhydrase 2 (CA2); ArfGAP
with SH3 domain, ankyrin repeat and PH domain 2; roundabout
guidance receptor 1 (ROBO1); INSM transcriptional repressor 2; and
leucine rich repeat LGI family member 2 (LGI2). Those in the
turquoise module included: NIPBL cohesion loading factor (NIPBL);
leucine rich pentatricopeptide repeat containing (LRPPRC); GC-rich
promoter binding protein 1; ubiquitin protein ligase E3A; HECT and
RLD domain containing E3 ubiquitin protein ligase family member 1;
ring finger protein 214; cyclin H (CCNH); dual specificity tyrosine
phosphorylation regulated kinase 1Al (DYRK1A); signal transducing
adaptor molecule; and chaperonin containing TCP1 subunit 2 (CCT2).
However, the function of these genes in retinoblastoma remains
unclear. A previous study found that BCL11A plays a critical role
in several diseases as an oncogene (28). Consistent with the present study,
it has been confirmed that in epigenetic complexes, the
transcription factor BCL11A competes with histone H3 for binding to
Retinoblastoma-binding proteins 4 and 7 (29). Therefore, BCL11A has a widespread
role in the development of retinoblastoma (30). It has been reported that ROBO1 is
localized to the cell membrane; in primary and metastatic prostate
cancer its expression is lower (31). However, the role of ROBO1 in
retinoblastoma has not yet been studied. The present results showed
that ROBO1 in the yellow module may be associated with
retinoblastoma, but this requires further validation. LGI2 is
secreted by neurons and acts on members of the
metalloproteinase-deficient ADAM neuronal receptor family, with
roles in synaptic remodeling (32). Similarly, GO analysis in the
present study indicated enrichment of the genes in the yellow
module in synaptic guidance. Among the genes in the turquoise
module, NIPBL plays a critical and regulatory role in cohesion
loading on chromatin, as well as having roles in gene expression
and transcriptional signaling (33,34).
Zinc finger protein 609 may participate in the regulation of
cortical neuron migration (35).
Upregulated LRPPRC may promote tumourigenesis in various tumors,
such as lung adenocarcinoma, esophageal squamous cell carcinoma,
stomach, colon, mammary and endometrial adenocarcinoma, as well as
lymphoma (36,37). Regardless, the present study is the
first to report that LRPPRC may affect the development of
retinoblastoma. Furthermore, CCNH, DYRK1A and CCT2 are involved in
the regulation of the cell cycle, which is consistent with the
present functional enrichment analysis results (38–42).
Due to the unclear molecular mechanisms of retinoblastoma, the
ability to treat the disease remains limited (43–45).
Moreover, patients with hereditary retinoblastoma have an increased
risk of subsequent malignant neoplasms after radiotherapy or
chemotherapy (46,47). The present study revealed that
these hub genes may be involved in the molecular mechanisms
underlying the development and progression of retinoblastoma,
though further validation is required.
Currently, WGCNA is widely used to analyze
large-scale data sets and find modules for highly related genes. To
our knowledge, the present study is the first to analyze the
correlation between coexpression modules and clinical traits of
retinoblastoma via WGCNA. In a previous study using WGCNA analysis
four hub genes were identified as prognostic markers in another eye
tumor, uveal melanoma (15) and
another study identified four hub genes associated with the
progression of uveal melanoma (48). However, identical genes associated
with the two eye tumors, uveal melanoma and retinoblastoma, have
not been found. The genes identified using WGCNA in uveal melanoma
have been not used in a clinical setting; however, functional
enrichment studies have not revealed the role of these genes. Since
WGCNA has been widely used to construct coexpression modules, it is
a useful method to study retinoblastoma.
However, the present study has several limitations
that should be noted. First, this study was based on analysis of
data extracted from a limited sample size; therefore, the genes
identified cannot be generalized to the majority of patients with
retinoblastoma. Second, the biological mechanisms of the hub genes,
such as SSBP3-AS1, KCNQ5-IT1, LOC101929633 and CA2, are still
unknown. Third, this study was limited by the absence of
experimental evidence, so large-scale studies are needed for
validation.
In the present study, two meaningful gene
coexpression modules for retinoblastoma were identified based on
WGCNA. Among the genes of the two-coexpression modules, hub genes
were identified by PPI networks and subnetworks, and based on
previous studies, these genes may play a critical role in
retinoblastoma. Therefore, this research is helpful in
understanding the molecular mechanisms of retinoblastoma.
In this study, 8 coexpression modules were
constructed via WGCNA. The yellow module and turquoise module had
highly significant associations with clinical traits. In addition,
the genes in the two modules participate in multiple pathways in
retinoblastoma. Ten hub genes in the two-coexpression modules were
identified according to the PPI network. This study identified
meaningful gene coexpression modules and hub genes associated with
a number of clinical traits of retinoblastoma that may contribute
to the development of the disease.
Acknowledgements
Not applicable.
Funding
This study was funded by the Beijing Municipal
Science and Technology Commission (grant no. Z151100004015179).
Availability of data and material
The datasets analyzed during the current study are
available from the corresponding author on reasonable request.
Authors' contributions
YM and GM conceived and designed the study strategy
and reviewed the manuscript. GM, YM, YY and QN conducted the data
analysis and prepared the tables and figures. YM and QN finished
the draft of the manuscript and managed the data. GM and YY
collected the references and managed the data. All authors read and
approved the final manuscript.
Ethics approval and consent to
participate
Not applicable.
Patient consent for publication
Not applicable.
Competing interests
The authors declare that they have no competing
interests.
Glossary
Abbreviations
Abbreviations:
|
WGCNA
|
weighted gene coexpression network
analysis
|
|
PPI
|
protein-protein interaction
|
|
HRPFs
|
high-risk histopathologic features
|
|
TOM
|
topological overlap matrix
|
|
ME
|
module eigengene
|
|
GS
|
gene significance
|
|
MM
|
module membership
|
|
GO
|
Gene Ontology
|
|
KEGG
|
Kyoto Encyclopedia of Genes and
Genomes
|
|
MCC
|
maximal clique centrality
|
References
|
1
|
Kamihara J, Bourdeaut F, Foulkes WD,
Molenaar JJ, Mosse YP, Nakagawara A, Parareda A, Scollon SR,
Schneider KW, Skalet AH, et al: Retinoblastoma and neuroblastoma
predisposition and surveillance. Clin Cancer Res. 23:e98–e106.
2017. View Article : Google Scholar : PubMed/NCBI
|
|
2
|
Shang Y: LncRNA THOR acts as a
retinoblastoma promoter through enhancing the combination of c-myc
mRNA and IGF2BP1 protein. Biomed Pharmacother. 106:1243–1249. 2018.
View Article : Google Scholar : PubMed/NCBI
|
|
3
|
Rao R and Honavar SG: Retinoblastoma.
Indian J Pediatr. 84:937–944. 2017. View Article : Google Scholar : PubMed/NCBI
|
|
4
|
Skalet AH, Gombos DS, Gallie BL, Kim JW,
Shields CL, Marr BP, Plon SE and Chévez-Barrios P: Screening
children at risk for retinoblastoma: Consensus report from the
American association of ophthalmic oncologists and pathologists.
Ophthalmology. 125:453–458. 2018. View Article : Google Scholar : PubMed/NCBI
|
|
5
|
Broaddus E, Topham A and Singh AD:
Survival with retinoblastoma in the USA: 1975–2004. Br J
Ophthalmol. 93:24–27. 2009. View Article : Google Scholar : PubMed/NCBI
|
|
6
|
Stathopoulos C, Say EAT and Shields CL:
Prenatal ultrasonographic detection and prenatal (prior to birth)
management of hereditary retinoblastoma. Graefes Arch Clin Exp
Ophthalmol. 256:861–862. 2018. View Article : Google Scholar : PubMed/NCBI
|
|
7
|
Bright CJ, Hawkins MM, Winter DL, Alessi
D, Allodji RS, Bagnasco F, Bárdi E, Bautz A, Byrne J, Feijen EAM,
et al: Risk of soft-tissue sarcoma among 69 460 five-year survivors
of childhood cancer in Europe. J Natl Cancer Inst. 110:649–660.
2018. View Article : Google Scholar : PubMed/NCBI
|
|
8
|
Fidler MM, Reulen RC, Winter DL, Allodji
RS, Bagnasco F, Bardi E, Bautz A, Bright CJ, Byrne J, Feijen EAM,
et al: Risk of subsequent bone cancers among 69 460 five-year
survivors of childhood and adolescent cancer in Europe. J Natl
Cancer Inst. 110:22018. View Article : Google Scholar
|
|
9
|
Qaddoumi I, Bass JK, Wu J, Billups CA,
Wozniak AW, Merchant TE, Haik BG, Wilson MW and Rodriguez-Galindo
C: Carboplatin-associated ototoxicity in children with
retinoblastoma. J Clin Oncol. 30:1034–1041. 2012. View Article : Google Scholar : PubMed/NCBI
|
|
10
|
Sachdeva UM and O'Brien JM: Understanding
pRb: Toward the necessary development of targeted treatments for
retinoblastoma. J Clin Invest. 122:425–434. 2012. View Article : Google Scholar : PubMed/NCBI
|
|
11
|
Andreoli MT, Chau FY, Shapiro MJ and
Leiderman YI: Epidemiological trends in 1452 cases of
retinoblastoma from the surveillance, epidemiology, and end results
(SEER) registry. Can J Ophthalmol. 52:592–598. 2017. View Article : Google Scholar : PubMed/NCBI
|
|
12
|
Hudson LE, Mendoza P, Hudson WH, Ziesel A,
Hubbard GB III, Wells J, Dwivedi B, Kowalski J, Seby S, Patel V, et
al: Distinct gene expression profiles define anaplastic grade in
retinoblastoma. Am J Pathol. 188:2328–2338. 2018. View Article : Google Scholar : PubMed/NCBI
|
|
13
|
Zhou Z, Cheng Y, Jiang Y, Liu S, Zhang M,
Liu J and Zhao Q: Ten hub genes associated with progression and
prognosis of pancreatic carcinoma identified by co-expression
analysis. Int J Biol Sci. 14:124–136. 2018. View Article : Google Scholar : PubMed/NCBI
|
|
14
|
Langfelder P and Horvath S: WGCNA: An R
package for weighted correlation network analysis. BMC
Bioinformatics. 9:5592008. View Article : Google Scholar : PubMed/NCBI
|
|
15
|
Wan Q, Tang J, Han Y and Wang D:
Co-Expression modules construction by WGCNA and identify potential
prognostic markers of uveal melanoma. Exp Eye Res. 166:13–20. 2018.
View Article : Google Scholar : PubMed/NCBI
|
|
16
|
Yu G, Wang LG, Han Y and He QY:
ClusterProfiler: An R package for comparing biological themes among
gene clusters. OMICS. 16:284–287. 2012. View Article : Google Scholar : PubMed/NCBI
|
|
17
|
Kohl M, Wiese S and Warscheid B:
Cytoscape: Software for visualization and analysis of biological
networks. Methods Mol Biol. 696:291–303. 2011. View Article : Google Scholar : PubMed/NCBI
|
|
18
|
Shannon P, Markiel A, Ozier O, Baliga NS,
Wang JT, Ramage D, Amin N, Schwikowski B and Ideker T: Cytoscape: A
software environment for integrated models of biomolecular
interaction networks. Genome Res. 13:2498–2504. 2003. View Article : Google Scholar : PubMed/NCBI
|
|
19
|
Chin CH, Chen SH, Wu HH, Ho CW, Ko MT and
Lin CY: CytoHubba: Identifying hub objects and sub-networks from
complex interactome. BMC Syst Biol. 8 (Suppl 4):S112014. View Article : Google Scholar : PubMed/NCBI
|
|
20
|
Bader GD and Hogue CW: An automated method
for finding molecular complexes in large protein interaction
networks. BMC Bioinformatics. 4:22003. View Article : Google Scholar : PubMed/NCBI
|
|
21
|
Moll AC, Imhof SM, Kuik DJ, Bouter LM, Den
Otter W, Bezemer PD, Koten JW and Tan KE: High parental age is
associated with sporadic hereditary retinoblastoma: The dutch
retinoblastoma register 1862–1994. Hum Genet. 98:109–112. 1996.
View Article : Google Scholar : PubMed/NCBI
|
|
22
|
de Jong MC, Kors WA, de Graaf P,
Castelijns JA, Kivelä T and Moll AC: Trilateral retinoblastoma: A
systematic review and meta-analysis. Lancet Oncol. 15:1157–1167.
2014. View Article : Google Scholar : PubMed/NCBI
|
|
23
|
Dimaras H, Kimani K, Dimba EA, Gronsdahl
P, White A, Chan HS and Gallie BL: Retinoblastoma. Lancet.
379:1436–1446. 2012. View Article : Google Scholar : PubMed/NCBI
|
|
24
|
De Laurenzi V, Raschellá G, Barcaroli D,
Annicchiarico-Petruzzelli M, Ranalli M, Catani MV, Tanno B,
Costanzo A, Levrero M and Melino G: Induction of neuronal
differentiation by p73 in a neuroblastoma cell line. J Biol Chem.
275:15226–15231. 2000. View Article : Google Scholar : PubMed/NCBI
|
|
25
|
Fell SM, Li S, Wallis K, Kock A, Surova O,
Rraklli V, Höfig CS, Li W, Mittag J, Henriksson MA, et al:
Neuroblast differentiation during development and in neuroblastoma
requires KIF1Bβ-mediated transport of TRKA. Genes Dev.
31:1036–1053. 2017. View Article : Google Scholar : PubMed/NCBI
|
|
26
|
Gu Y, Lv F, Xue M, Chen K, Cheng C, Ding
X, Jin M, Xu G, Zhang Y, Wu Z, et al: The deubiquitinating enzyme
UCHL1 is a favorable prognostic marker in neuroblastoma as it
promotes neuronal differentiation. J Exp Clin Cancer Res.
37:2582018. View Article : Google Scholar : PubMed/NCBI
|
|
27
|
Jeong H, Mason SP, Barabási AL and Oltvai
ZN: Lethality and centrality in protein networks. Nature.
411:41–42. 2001. View
Article : Google Scholar : PubMed/NCBI
|
|
28
|
Lazarus KA, Hadi F, Zambon E, Bach K,
Santolla MF, Watson JK, Correia LL, Das M, Ugur R, Pensa S, et al:
BCL11A interacts with SOX2 to control the expression of epigenetic
regulators in lung squamous carcinoma. Nat Commun. 9:33272018.
View Article : Google Scholar : PubMed/NCBI
|
|
29
|
Moody RR, Lo MC, Meagher JL, Lin CC,
Stevers NO, Tinsley SL, Jung I, Matvekas A, Stuckey JA and Sun D:
Probing the interaction between the histone
methyltransferase/deacetylase subunit RBBP4/7 and the transcription
factor BCL11A in epigenetic complexes. J Biol Chem. 293:2125–2136.
2018. View Article : Google Scholar : PubMed/NCBI
|
|
30
|
Sleven H, Welsh SJ, Yu J, Churchill MEA,
Wright CF, Henderson A, Horvath R, Rankin J, Vogt J, Magee A, et
al: De novo mutations in EBF3 cause a neurodevelopmental syndrome.
Am J Hum Genet. 100:138–150. 2017. View Article : Google Scholar : PubMed/NCBI
|
|
31
|
Parray A, Siddique HR, Kuriger JK, Mishra
SK, Rhim JS, Nelson HH, Aburatani H, Konety BR, Koochekpour S and
Saleem M: ROBO1, a tumor suppressor and critical molecular barrier
for localized tumor cells to acquire invasive phenotype: Study in
African-American and Caucasian prostate cancer models. Int J
Cancer. 135:2493–2506. 2014. View Article : Google Scholar : PubMed/NCBI
|
|
32
|
Seppala EH, Jokinen TS, Fukata M, Fukata
Y, Webster MT, Karlsson EK, Kilpinen SK, Steffen F, Dietschi E,
Leeb T, et al: LGI2 truncation causes a remitting focal epilepsy in
dogs. PLoS Genet. 7:e10021942011. View Article : Google Scholar : PubMed/NCBI
|
|
33
|
Zuin J, Casa V, Pozojevic J, Kolovos P,
van den Hout MCGN, van Ijcken WFJ, Parenti I, Braunholz D, Baron Y,
Watrin E, et al: Regulation of the cohesin-loading factor NIPBL:
Role of the lncRNA NIPBL-AS1 and identification of a distal
enhancer element. PLoS Genet. 13:e10071372017. View Article : Google Scholar : PubMed/NCBI
|
|
34
|
Gao D, Zhu B, Cao X, Zhang M and Wang X:
Roles of NIPBL in maintenance of genome stability. Semin Cell Dev
Biol. 90:181–186. 2019. View Article : Google Scholar : PubMed/NCBI
|
|
35
|
van den Berg DLC, Azzarelli R, Oishi K,
Martynoga B, Urbán N, Dekkers DHW, Demmers JA and Guillemot F:
Nipbl interacts with Zfp609 and the integrator complex to regulate
cortical neuron migration. Neuron. 93:348–361. 2017. View Article : Google Scholar : PubMed/NCBI
|
|
36
|
Siira SJ, Spahr H, Shearwood AJ,
Ruzzenente B, Larsson NG, Rackham O and Filipovska A:
LRPPRC-mediated folding of the mitochondrial transcriptome. Nat
Commun. 8:15322017. View Article : Google Scholar : PubMed/NCBI
|
|
37
|
Tian T, Ikeda J, Wang Y, Mamat S, Luo W,
Aozasa K and Morii E: Role of leucine-rich pentatricopeptide repeat
motif-containing protein (LRPPRC) for anti-apoptosis and
tumourigenesis in cancers. Eur J Cancer. 48:2462–2473. 2012.
View Article : Google Scholar : PubMed/NCBI
|
|
38
|
Murali A, Nalinakumari KR, Thomas S and
Kannan S: Association of single nucleotide polymorphisms in cell
cycle regulatory genes with oral cancer susceptibility. Br J Oral
Maxillofac Surg. 52:652–658. 2014. View Article : Google Scholar : PubMed/NCBI
|
|
39
|
Rajaraman P, Wang SS, Rothman N, Brown MM,
Black PM, Fine HA, Loeffler JS, Selker RG, Shapiro WR, Chanock SJ
and Inskip PD: Polymorphisms in apoptosis and cell cycle control
genes and risk of brain tumors in adults. Cancer Epidemiol
Biomarkers Prev. 16:1655–1661. 2007. View Article : Google Scholar : PubMed/NCBI
|
|
40
|
Litovchick L, Florens LA, Swanson SK,
Washburn MP and DeCaprio JA: DYRK1A protein kinase promotes
quiescence and senescence through DREAM complex assembly. Genes
Dev. 25:801–813. 2011. View Article : Google Scholar : PubMed/NCBI
|
|
41
|
Earl RK, Turner TN, Mefford HC, Hudac CM,
Gerdts J, Eichler EE and Bernier RA: Clinical phenotype of
ASD-associated DYRK1A haploinsufficiency. Mol Autism. 8:542017.
View Article : Google Scholar : PubMed/NCBI
|
|
42
|
Minegishi Y, Nakaya N and Tomarev SI:
Mutation in the zebrafish cct2 gene leads to abnormalities of cell
cycle and cell death in the retina: A model of CCT2-related leber
congenital amaurosis. Invest Ophthalmol Vis Sci. 59:995–1004. 2018.
View Article : Google Scholar : PubMed/NCBI
|
|
43
|
Errico A: Cancer therapy:
Retinoblastoma-chemotherapy increases the risk of secondary cancer.
Nat Rev Clin Oncol. 11:6232014. View Article : Google Scholar : PubMed/NCBI
|
|
44
|
Wong JR, Morton LM, Tucker MA, Abramson
DH, Seddon JM, Sampson JN and Kleinerman RA: Risk of subsequent
malignant neoplasms in long-term hereditary retinoblastoma
survivors after chemotherapy and radiotherapy. J Clin Oncol.
32:3284–3290. 2014. View Article : Google Scholar : PubMed/NCBI
|
|
45
|
Temming P, Arendt M, Viehmann A, Eisele L,
Le Guin CH, Schündeln MM, Biewald E, Mausert J, Wieland R, Bornfeld
N, et al: How eye-preserving therapy affects long-term overall
survival in heritable retinoblastoma survivors. J Clin Oncol.
34:3183–3188. 2016. View Article : Google Scholar : PubMed/NCBI
|
|
46
|
Habib LA, Francis JH, Fabius AW, Gobin PY,
Dunkel IJ and Abramson DH: Second primary malignancies in
retinoblastoma patients treated with intra-arterial chemotherapy:
The first 10 years. Br J Ophthalmol. 102:272–275. 2018. View Article : Google Scholar : PubMed/NCBI
|
|
47
|
Temming P, Arendt M, Viehmann A, Eisele L,
Le Guin CH, Schundeln MM, Biewald E, Astrahantseff K, Wieland R,
Bornfeld N, et al: Incidence of second cancers after radiotherapy
and systemic chemotherapy in heritable retinoblastoma survivors: A
report from the German reference center. Pediatr Blood Cancer.
64:71–80. 2017. View Article : Google Scholar : PubMed/NCBI
|
|
48
|
Shi K, Bing ZT, Cao GQ, Guo L, Cao YN,
Jiang HO and Zhang MX: Identify the signature genes for diagnose of
uveal melanoma by weight gene co-expression network analysis. Int J
Ophthalmol. 8:269–274. 2015.PubMed/NCBI
|