Introduction
Primary biliary cholangitis (PBC) and Primary
sclerosing cholangitis (PSC) are typical cholestatic disorders,
which are characterized by the retention of bile acid (BA)
(1). The prevalence of PBC in
northern Europe and Asian countries has been estimated to be 7–402
and 400–500 cases per million, respectively (2,3). In
Västra Götaland, which is a regional healthcare unit in Sweden, the
reported prevalence of PSC was 162 cases per million subjects in
2005 (4). It has also been
reported that >50% of patients with PSC may not survive without
liver transplantation in the late stages of the disease (5,6).
Therefore, cholestasis is one of the most difficult diseases to be
handled in hepatology research.
The α-naphthylisothiocyanate (ANIT) cholestatic
model is the most widely used model for investigating cholestatic
liver diseases (7,8); for instance, following the
administration of one dose of ANIT into mice, significant hepatic
injury was observed (9). The STAT3
and NF-κB signaling pathways have been discovered to serve an
important role in this type of cholestatic liver injury (9). In a previous study, upon the
treatment of mice with a high dose of ANIT (300 mg/kg), rapid
(15–24 h) cholestasis developed alongside severe cholangiocyte
destruction, which was extended to the periportal hepatocytes
(10). In addition, in mouse
cholestasis induced by one dose of ANIT, c-Jun and
c-Fos transcription was significantly upregulated and
phosphorylated (p)-STAT3 activation was also observed (11). In male Sprague-Dawley rats treated
with a single dose of ANIT for 24 h, the AMP-activated protein
kinase/Farnesoid X receptor (FXR) signaling pathway served a
critical role in the disruption of BA homeostasis (12). Therefore, the inflammatory pathways
involved in cholestatic liver disease remain as the main research
topic for investigation.
Lithocholic acid (LCA)-induced cholestasis is a
cholestatic model that has been previously used in multiple studies
(13,14). For example, C57BL/6 mice were
intraperitoneally injected with 250 mg/kg LCA twice daily for 4
days and the pathological changes of the liver tissues were
observed, including severe hepatic necrosis and diffuse
vacuolization (13). In C57BL/6
mice treated with a 1% LCA diet (g/g) for 4 days, the upregulation
of the levels of the inflammatory factors interleukin (Il)1β,
Il6 and Il10 were observed (15). In addition, in male mice treated
with 125 mg/kg LCA (b.i.d) for 7 days, NF-κB activation was
increased, which was accompanied by an elevation in the expression
levels of the inflammatory cytokines tumor necrosis factor
(Tnf)α and Il6 (16). Finally, in C57BL/6 mice, an
intraperitoneal injection of 125 mg/kg LCA twice daily for 4 days
promoted an increase in NF-κB gene expression, as well as in
Tnfα and Il1β levels (17). However, to the best of our
knowledge, the comparison of the toxicity and the mechanisms of
action between the LCA and ANIT models has not been previously
reported.
In the present study, ICR mice were treated with
ANIT or LCA to induce cholestatic liver injury. The etiological
differences of cholestasis between the two cholestatic models were
revealed using metabolomics and traditional approaches. Notably, it
was discovered that the JNK/STAT3 signaling pathway mediated the
cholestatic liver injury in both models.
Materials and methods
Chemicals, reagents and assay
kits
ANIT and LCA were purchased from Sigma-Aldrich
(Merck KGaA). The BA components, taurocholic acid (TCA),
tauro-α-muricholic acid (T-αMCA), tauro-β-muricholic acid (T-βMCA),
tauro-ω-muricholic acid (T-ωMCA), taurochenodeoxycholic acid
(TCDCA), tauroursodeoxycholic acid (TUDCA) and taurodeoxycholic
acid (TDCA), were also purchased from Sigma-Aldrich (Merck KGaA).
Assay kits for the liver injury markers alanine aminotransferase
(ALT; cat. no. 181017101), aspartate aminotransferase (AST; cat.
no. 181012101), alkaline phosphatase (ALP; cat. no. 1060–717) and
total BA (TBA; cat. no. 1025–717) were purchased from Ruiyuan
Biotechnology (http://www.reebio.com/about.html). TRIzol®
reagent and cDNA Synthesis kit were both purchased from Thermo
Fisher Scientific, Inc. LightCycle 480 SYBR Green I Master mix was
purchased from Roche Diagnostics (Shanghai) Co., Ltd. The
antibodies against total (t)-JNK (1:1,000; cat. no. 9252) and p-JNK
(1:1,000; cat. no. 9912) were purchased from Cell Signaling
Technology, Inc. Finally, the primary antibodies against p-p65
(1:5,000; cat. no. ab86299), t-p65 (1:5,000; cat. no. ab32536),
t-STAT3 (1:5,000; cat. no. ab109085), p-STAT3 (1:5,000; cat. no.
ab76315) and GAPDH (1:5,000; cat. no. ab181602) were obtained from
Abcam. Secondary antibodies [IgG H&L (horseradish peroxidase)]
used were obtained from Abcam (1:2,000; cat. no. ab205718).
Animals and treatment
The animal studies were performed following the
approval of the protocol by the Institutional Animal Care and Use
Committee (approval no. IACUC 201707-138) at Ningbo University
(Zhejiang, China). In total, 15 male ICR mice (age, 5–7 weeks;
weight, 20±5 g) were purchased from Slac Laboratory Animal
(Shanghai, China) Co., Ltd. Prior to the experiments, the mice were
housed at the Medical School of Ningbo University Animal Services
Unit at 23±1°C, with a relative humidity of 60–70%, a light/dark
cycle of 12 h and with free access to water and standard mouse
chow. The mice were kept in standard cages (n=5) with aspen
bedding. The ICR mice were assigned to the following three groups:
Control group, LCA group and ANIT group. The LCA group was orally
treated with 150 mg/kg LCA in corn oil two times a day. The animals
were sacrificed 12 h following the 5th treatment. The ANIT group
was treated with 75 mg/kg ANIT in corn oil once by oral gavage and
the animals were sacrificed after 48 h. The blood samples (50 µl)
were collected in the two models by tail bleeding at 0, 12, 24 and
36 h following the 1st dose to monitor the progress of
toxicity.
When the treatment finished, euthanasia was
performed using CO2 (20% volume displacement rate/min)
at a flow rate of 2 l/min. Ventilation was maintained for 1–2 min
until no breathing was observed in the mice, and corneal reflexes
and body stiffness were also checked to confirm mortality. Cervical
dislocation was used as the secondary means of euthanasia for those
mice that survived. Serum and liver samples were collected in a
same manner as described previously (18). A section of freshly isolated liver
tissues (1/5 of the liver tissues) was excised and immediately
fixed in 10% neutral buffered formalin at room temperature for at
least 24 h after a brief wash with PBS. The remaining liver tissues
for reverse transcription-quantitative PCR (RT-qPCR; 2/5 of the
liver tissues) and western blotting (2/5 of the liver tissues) were
flash-frozen in liquid nitrogen and stored at −80°C.
Biochemical analysis
The blood samples were centrifuged at 800 × g at 4°C
for 10 min to obtain the serum. The serum ALT, AST, ALP and TBA
levels were analyzed using the kits at 0, 24, 36 and 48 h,
according to the manufacturer's protocol, and a Multiskan GO
microplate reader (Thermo Fisher Scientific, Inc.).
Histopathological assessment
The liver fixed tissues were dehydrated in an
ascending series of alcohol (70, 80, 90 and 100%) and washed with
xylene. The tissues were embedded in paraffin at 60°C and cooled to
−20°C, prior to being cut into 4-µm sections. The sections were
stained with hematoxylin for 3 min and eosin for 2 min at room
temperature. The stained liver sections were visualized under an
Olympus BX51 light microscope (Olympus Corporation) at ×40 and ×400
magnification and ten serial sections per preparation were analyzed
blindly by a pathologist.
Serum metabolome analysis
The analysis of the serum metabolome was performed
as described previously (18).
After being processed by Marker Lynx 4.1 (Waters Corporation), a
data matrix of peak areas organized by retention time and m/z was
generated and then exported into SIMCA-P 13.0.3 (Umetrics;
Sartorius AG; http://umetrics.com/products/simca) for pareto
transformation. Then, unsupervised principal component analysis was
used to produce score plot. Orthogonal projection to latent
structures discriminant analysis was exploited to produce the
loading S-plot of LCA-treated and ANIT-treated mice vs. the control
mice where the BAs contributing to the pattern recognition were
exhibited. Accurate molecular weights of known BA components were
used to match the contributing items, which were determined to be
TCA, T-α/β/ωMCA, TCDCA, TUDCA and TDCA by subsequent comparison of
the MS/MS spectra with those of the authentic compounds. The
relative abundance of these BAs in the serum were normalized by
comparing their peak areas with those of internal standard. Their
abundance in serum was expressed as fold changes of LCA-treated and
ANIT-treated mice vs. the control groups. In the score (S)-plot,
the five components were identified as TCA, T-α/β/ωMCA, TCDCA,
TUDCA and TDCA by comparison with authentic standards. T-αMCA,
T-βMCA and T-ωMCA could not be separated at baseline during
chromatographic analysis and were consequently combined and named
as T-α/β/ωMCA.
RT-qPCR
The liver tissues (20 mg) were homogenized using
TRIzol® reagent following the manufacturer's protocol.
Then pure chloroform was added for 5 min to extract total RNA at
room temperature. Centrifugation was performed at 3,200 × g for 20
min at 4°C and precipitated with 75% ethanol. Total RNA was
quantified using the Multiskan GO microplate reader. Total RNA was
reverse transcribed into cDNA using a RT system (20 µl) including
the following: 4 µl 5X reaction buffer, 1 µg total RNA, 1 µl Oligo
dT18, 1 µl random primer, 2 µl dNTPs (10 mM) mix, 1 µl reverse
transcriptase, 1 µl RNase inhibitor and 2 µl RNase-free water. The
RT temperature protocol was as follows: Annealing at 25°C for 5
min, extension at 42°C for 1 h, inactivation at 70°C for 5 min and
chilling at 4°C for holding. qPCR was subsequently performed using
a 5 µl qPCR system in a 384-well plate, which included 1 µl total
cDNA, 2.5 µl SYBR-Green I Master Mix, 0.2 µl forward and reverse
primer, and 2 µl RNase-free water. The following primer pairs used
for the qPCR are listed in Table
SI. The following thermocycling conditions were used for the
qPCR: 95°C for 10 sec, 55°C for 10 sec and 72°C for 15 sec.
Expression levels were quantified using the 2−∆∆Cq
method (19) and normalized to 18S
ribosomal RNA. The expression levels in the control group were set
to 1, and the data of the LCA group and ANIT group were normalized
and expressed as relative expression.
Western blotting
Livers of three mice in each group were used in
protein analysis. Total protein was extracted from freshly cut
liver tissues using RIPA lysis buffer (Beijing Solarbio Science
& Technology Co., Ltd.; 1:10; g/v), supplemented with 1%
phenylmethylsulfonyl fluoride, using a MagNA Lyser instrument
(Roche Applied Science). Tissue debris was removed by
centrifugation at 10,000 × g at 4°C for 5 min. Total protein was
quantified using a bicinchoninic acid assay kit (Beyotime Institute
of Biotechnology) and adjusted to 5 mg/ml. 2X loading buffer
(Beijing Solarbio Science & Technology Co., Ltd.) was added to
the samples (volume-volume, 1:1), which were boiled for 5 min at
100°C. Then, 25 µg protein was separated via SDS-PAGE (10%
separating gel; 5% spacer gel). The separated proteins were
transferred onto PVDF membranes and blocked for 4 h with 5%
fat-free milk in TBS-0.1% Tween-20 at room temperature. The
membranes were incubated overnight at 4°C with the following
primary antibodies: Anti-t-JNK (1:1,000), anti-p-JNK (1:1,000),
anti-p-p65 (1:5,000), anti-t-p65 (1:5,000), anti-t-STAT3 (1:5,000),
anti-p-STAT3 (1:5,000) and anti-GAPDH (1:5,000). Following the
primary antibody incubation, the membranes were incubated with
secondary antibodies (1:2,000) for 1.5 h at room temperature.
Protein bands were visualized by addition of ECL reagents
(Advansta, Inc.) and recorded using a Tanon 4200SF chemiluminescent
imaging system (Beijing Solarbio Science & Technology Co.,
Ltd.). Protein expression levels were semi-quantified using ImageJ
1.8.0 software (National Institutes of Health).
Statistical analysis
Statistical analysis was performed using SPSS
version 23 software (IBM Corp.) and all data are expressed as the
mean ± SD. SIMCA-P 13.0.3 (Umetrics; Sartorius AG) was used for
multivariate data analysis (20).
Experiments were repeated three times. Statistical differences were
determined using a one-way ANOVA followed by Tukey's post hoc test
for multiple comparisons. P<0.05 was considered to indicate a
statistically significant difference.
Results
Levels of the liver injury biomarkers
differ between the two cholestatic models
ALT and AST levels are frequently used as an
indication of liver injury (21).
The results revealed that ALT and AST levels were significantly
increased in both the ANIT and LCA groups compared with the control
group in a time-dependent manner (Fig.
1A and B). Furthermore, ALT levels were significantly increased
in the LCA group compared with those in the ANIT group at 36 and 48
h (Fig. 1A). AST levels were
significantly lower in the LCA group compared with the ANIT group
at 24 h (Fig. 1B). However, the
levels of AST were significantly higher in the LCA group compared
with the ANIT group at 36 and 48 h (Fig. 1B).
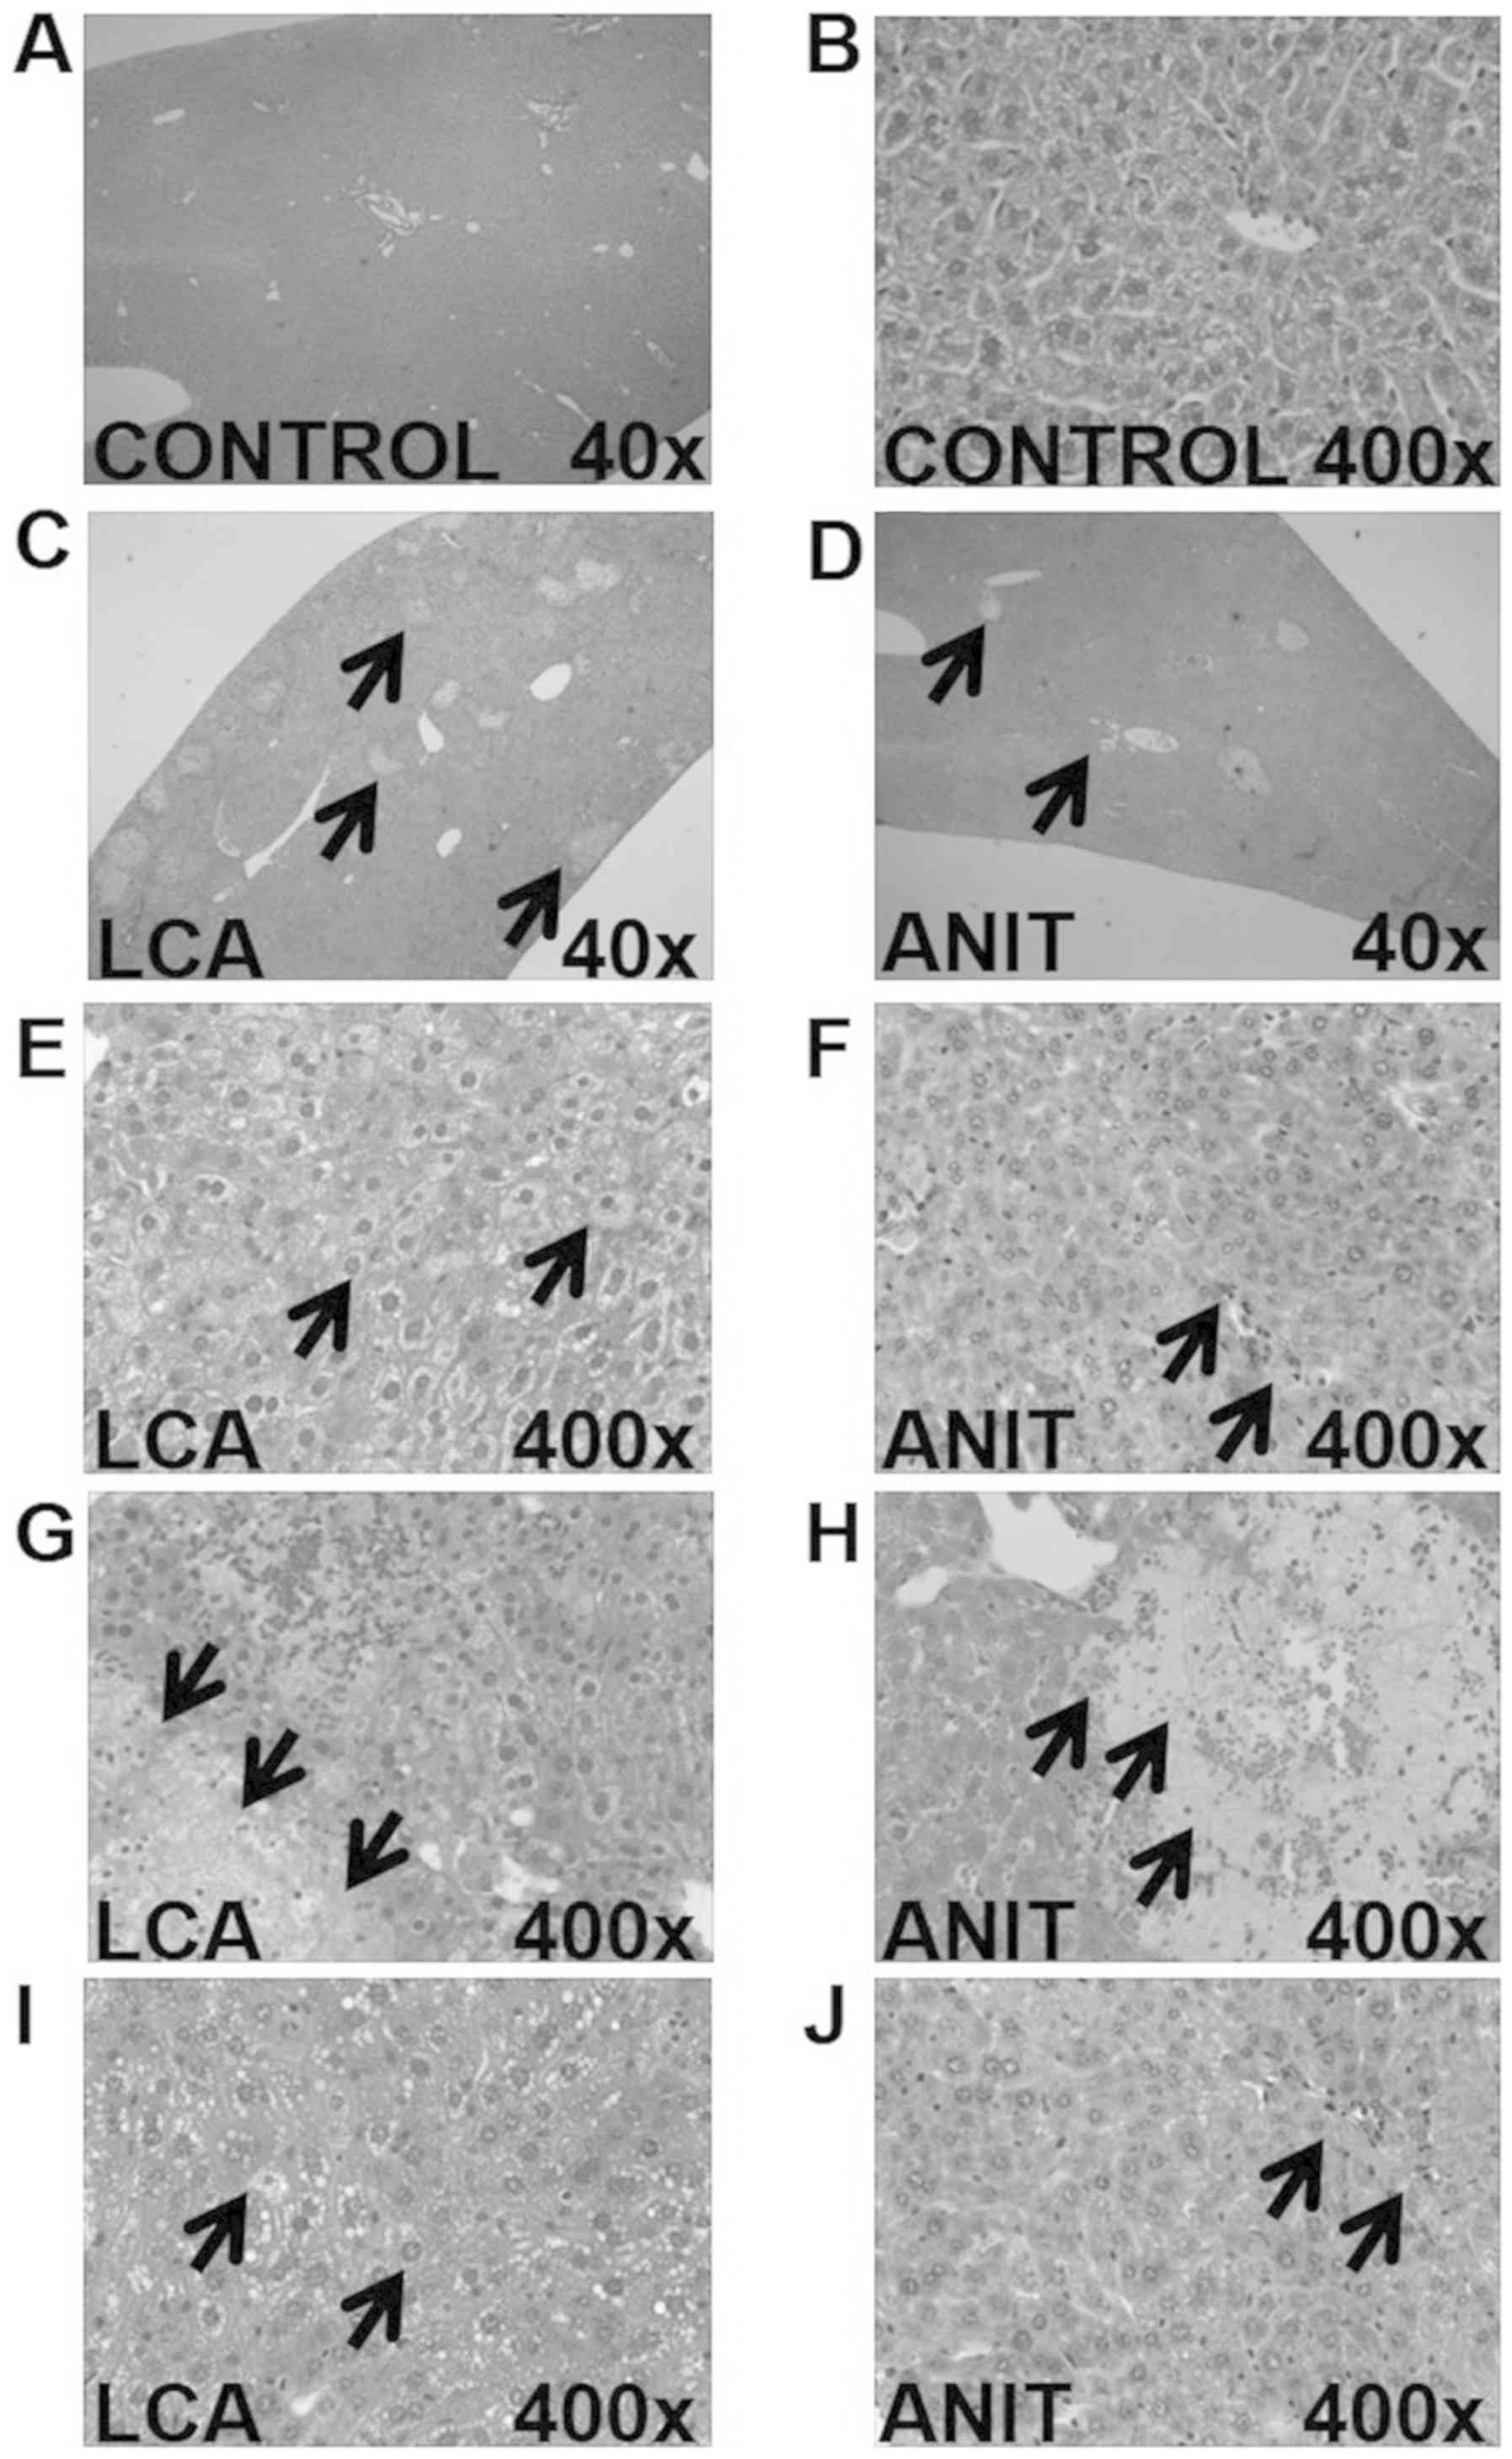
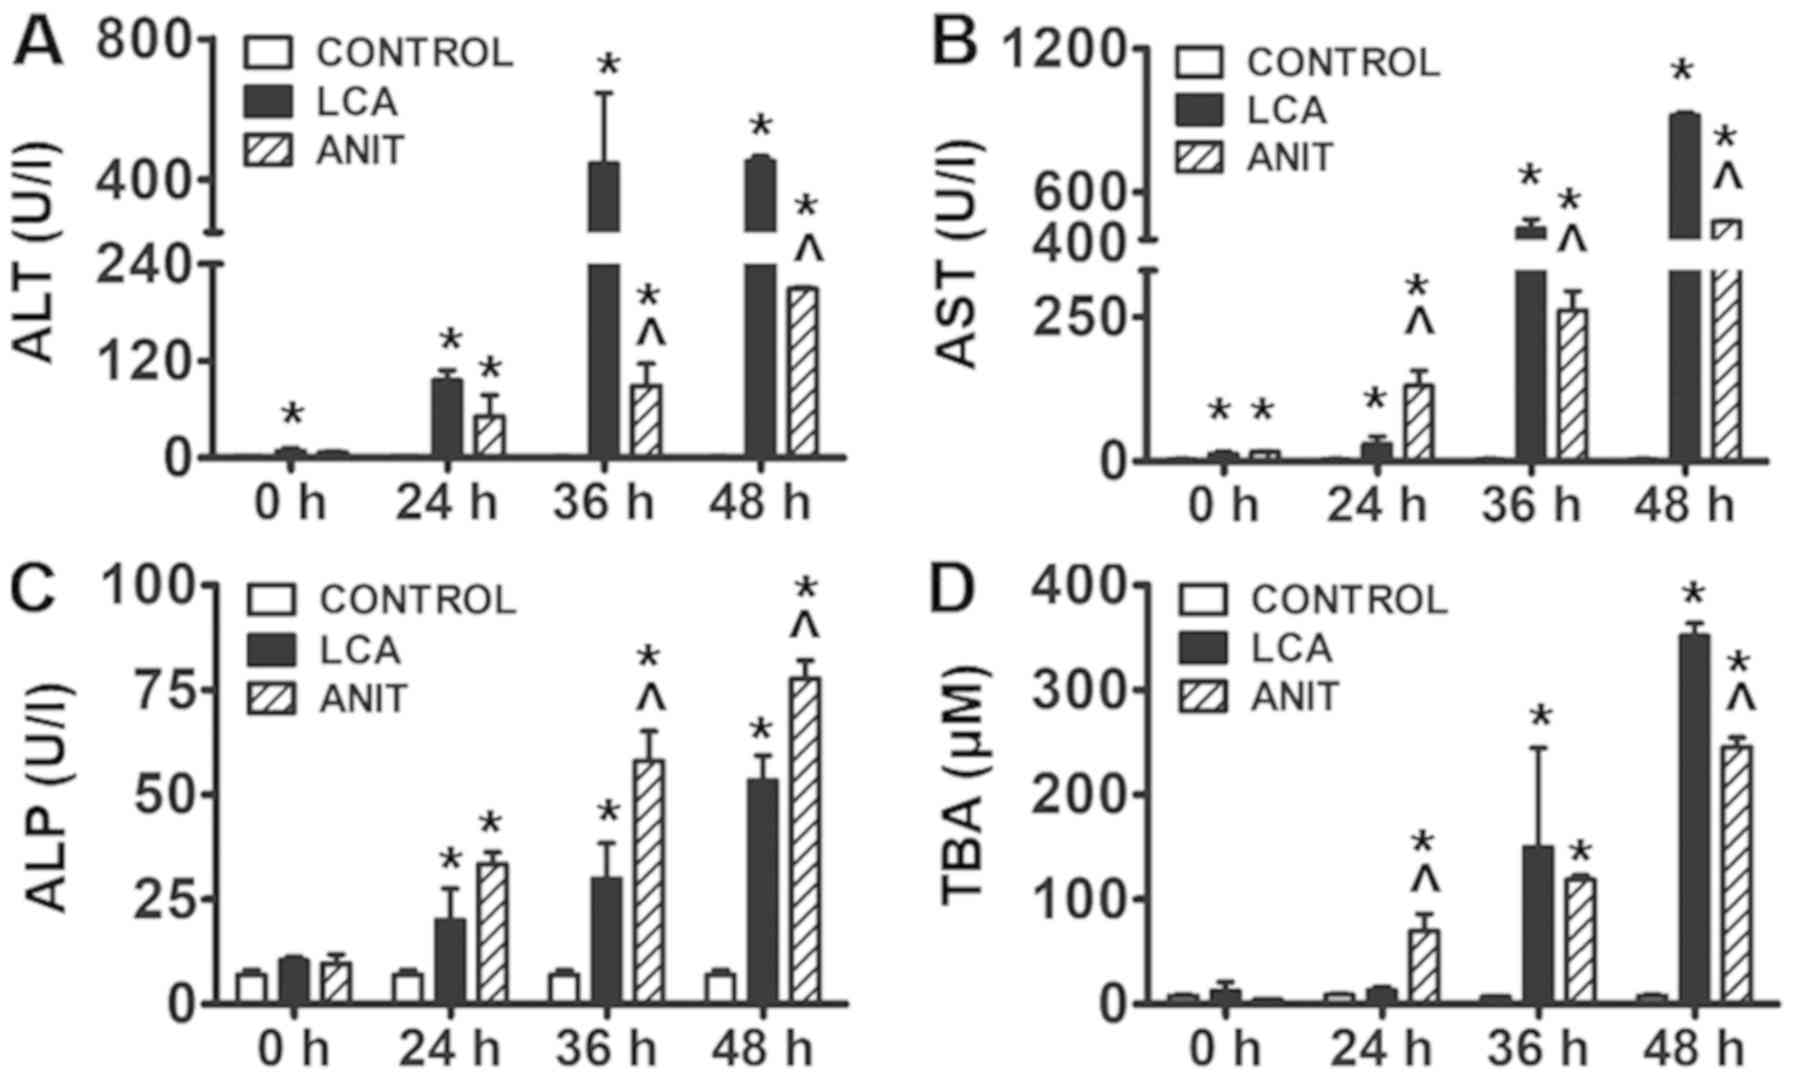 | Figure 1.Biochemical markers indicating the
hepatotoxicity following ANIT and LCA treatment. (A) ALT level in
the control, LCA and ANIT groups. (B) AST level in the control, LCA
and ANIT groups. (C) ALP level in the control, LCA and ANIT groups.
(D) TBA level in the control, LCA and ANIT groups. The data were
expressed as the mean ± SD. *P<0.05 vs. control group;
^P<0.05 vs. LCA group. ANIT,
α-naphthylisothiocyanate; LCA, lithocholic acid; ALT, alanine
aminotransferase; AST, aspartate aminotransferase; ALP, alkaline
phosphatase; TBA, total bile acid. |
The levels of ALP and TBA were significantly
increased in the ANIT and LCA groups compared with the control
group from 24–48 h (Fig. 1C and
D). Moreover, ALP levels in the ANIT group were significantly
higher compared with the LCA group at 36 and 48 h (Fig. 1C). The levels of TBA were also
significantly increased in the LCA group compared with those in the
ANIT group at 48 h (Fig. 1D).
The histopathological data revealed that the control
group exhibited a normal microstructure and histology (Fig. 2A and B). The LCA group exhibited
more necrotic areas compared with the ANIT group (Fig. 2C and D). The LCA group was
demonstrated to have edematous hepatocytes around the necrotic
lesions, with the presence of several vacuoles, infiltrating
neutrophils and a mild dilation of the bile ducts (Fig. 2E, G and I). However, the ANIT group
exhibited signs of severely dilated bile ducts (Fig. 2F), mild edema, necrotic lesions,
the infiltration of neutrophils (Fig.
2H) and severe hepatic sinus congestion (Fig. 2J).
Serum metabolome is affected by the BA
components
In the principal component analysis, samples from
mice that were treated with LCA and ANIT were classified into
independent groups from those in the control group. Their movement
direction indicated the different modifications of the serum
metabolome in the two models (Fig.
3A).
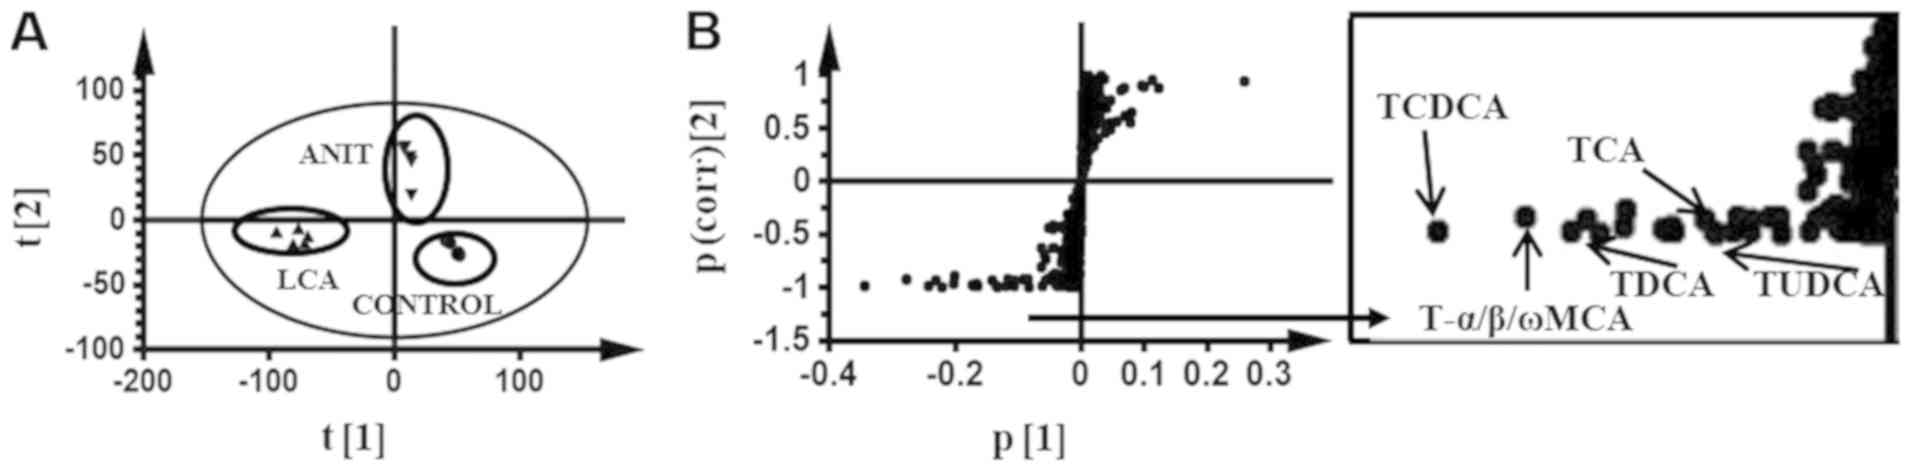 | Figure 3.Multivariate data analysis of the
serum metabolome in mice dosed ANIT and LCA. (A) S-plot of serum
metabolites in ANIT and LCA treated mice vs. the control group by
principle component analysis. (B) S-plot of OPLS-DA recognized
serum metabolome in ANIT-treated mice vs. LCA-treated mice, in
which the contribution of the identified BA components was
indicated. Each point in the panel A represented an individual
mouse serum sample and the points in panel B represented
contributing metabolites. The t[1] and t[2] represent principal
components 1 and 2, respectively. The p(corr)[1] represents the
interclass difference and p[1] represents the relative abundance of
the ions. ANIT, α-naphthylisothiocyanate; LCA, lithocholic acid;
S-plot, score plot; OPLS-DA, orthogonal projection to latent
structures discriminant analysis; BA, bile acid; T-α/β/ωMCA,
tauro-α/β/ω-muricholic acid; TCDCA, taurochenodeoxycholic acid;
TUDCA, tauroursodeoxycholic acid; TDCA, taurodeoxycholic acid; TCA,
taurocholic acid. |
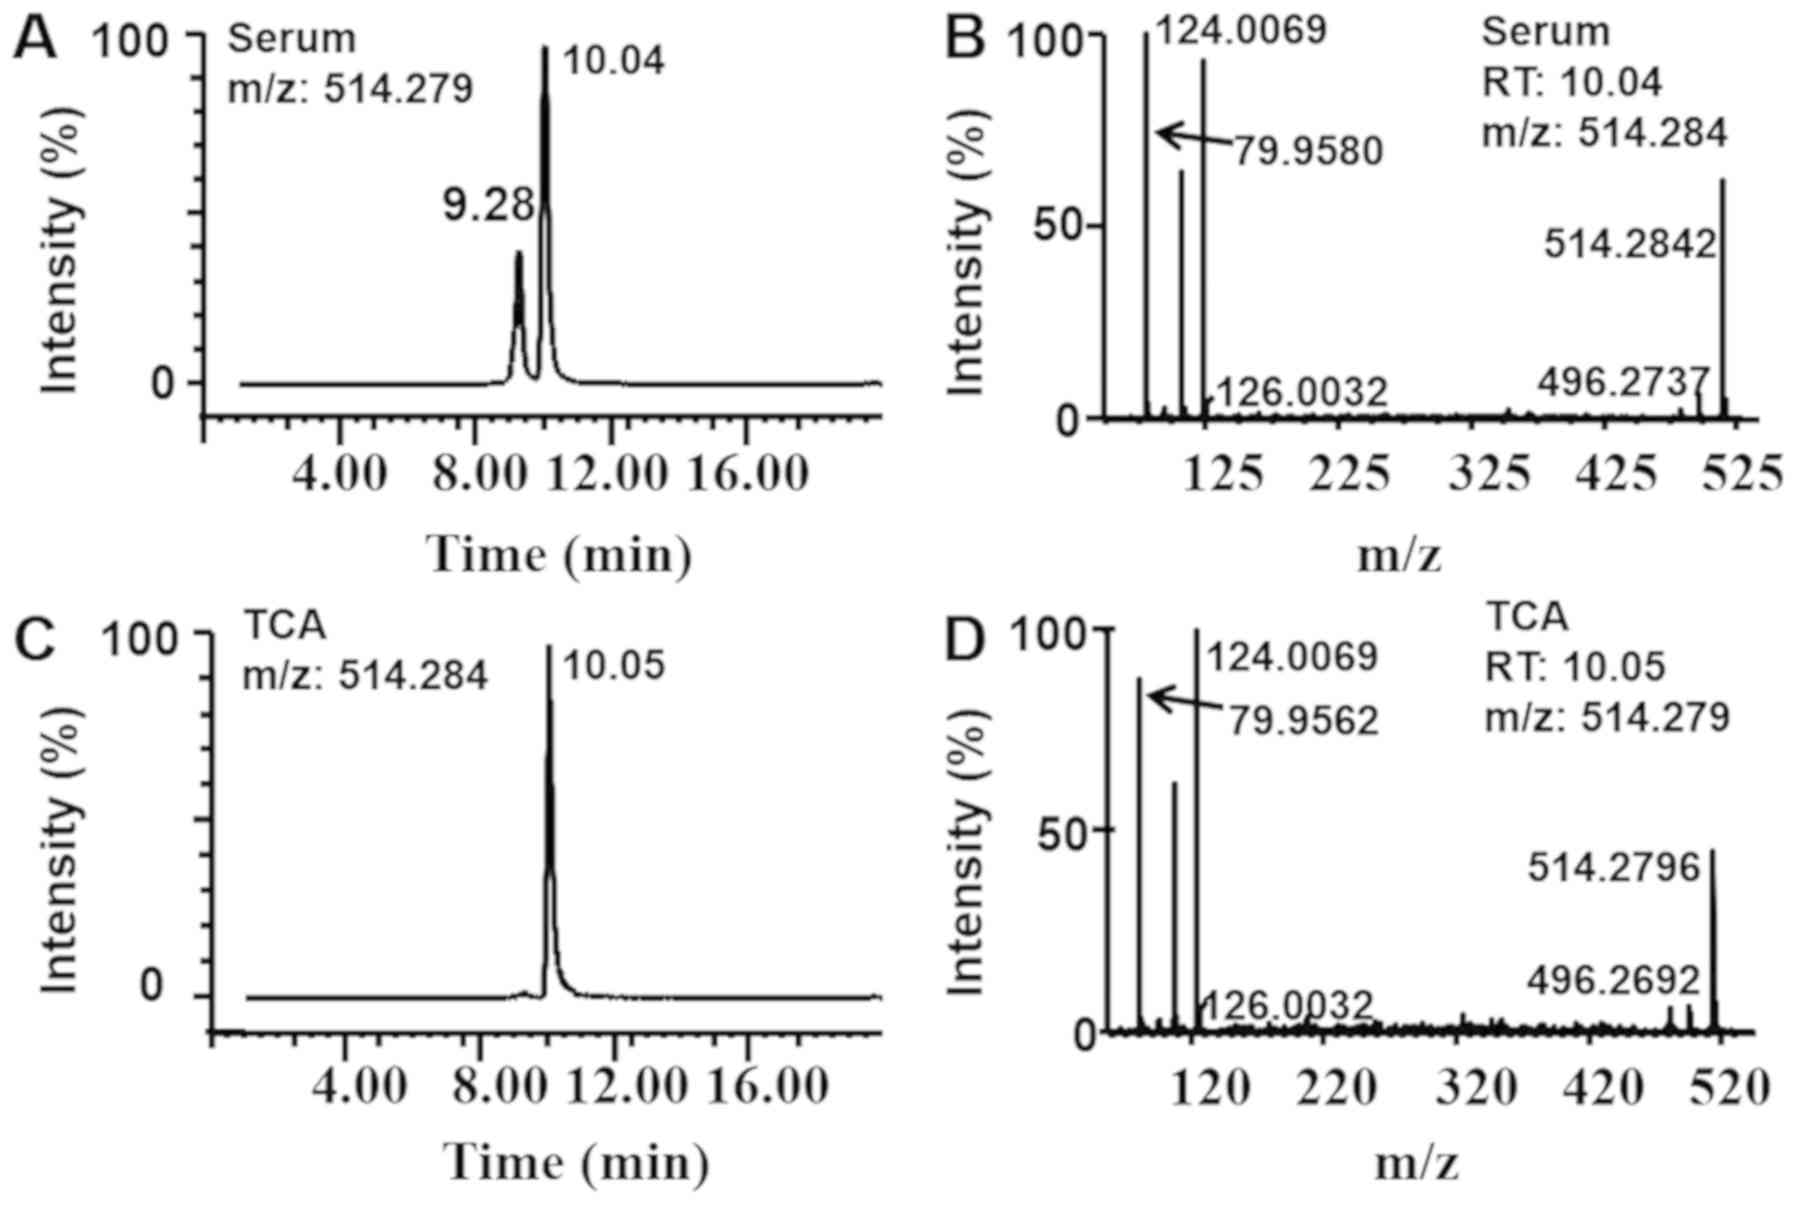
In the S-plot, a comparison of the contributing
components in the two models was performed and the five following
components were identified in comparison with commercial pure
substances: TCA, T-α/β/ωMCA, TCDCA, TUDCA and TDCA (Fig. 3B). The diagrams associated with the
identification of TCA are presented in Fig. 4 and those associated with the
identification of the other components (T-α/β/ωMCA, TCDCA, TUDCA
and TDCA) are presented in Figs.
S1-4. The levels of these components (TCA, T-α/β/ωMCA, TCDCA,
TUDCA and TDCA) were significantly increased by 41-, 70-, 938-,
202- and 490-fold, respectively, in the LCA group compared with the
control group (Fig. 5). However,
their increases were estimated to be only 30-, 11-, 32, 4- and
7-fold, respectively, in the ANIT group (Fig. 5). All the other components, except
TCA, demonstrated significant differences between the two
groups.
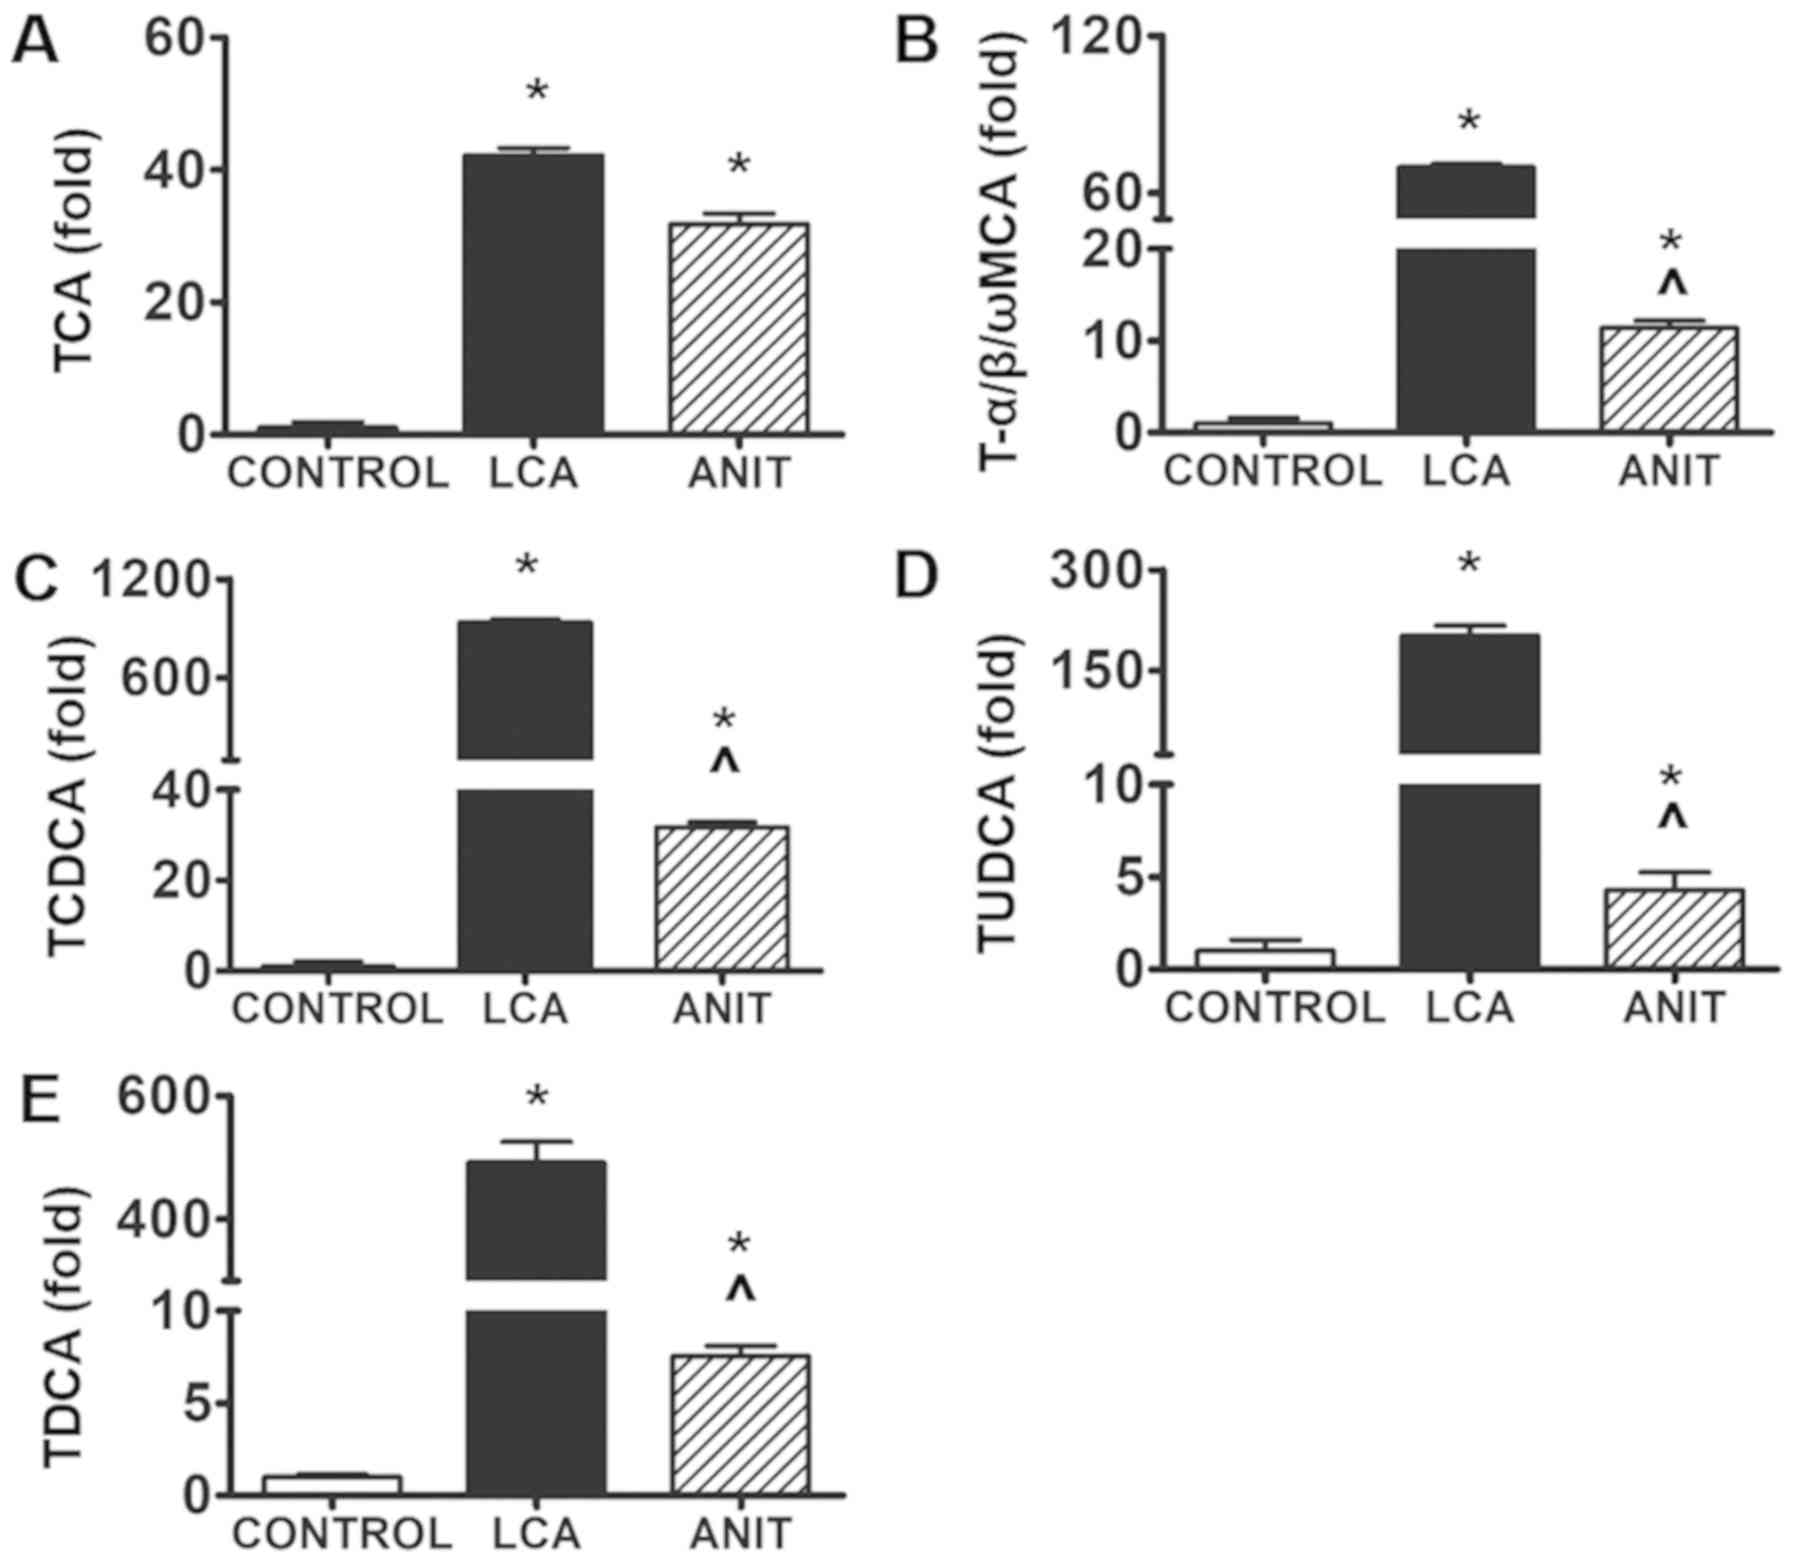 | Figure 5.Relative abundance of BA components
identified in ANIT and LCA mice. The relative abundance of (A) The
relative abundance of TCA in the control, LCA and ANIT groups. (B)
The relative abundance of T-α/β/ωMCA in the control, LCA and ANIT
groups. (C) The relative abundance of TCDCA in the control, LCA and
ANIT groups. (D) The relative abundance of TUDCA in the control,
LCA and ANIT groups. (E) The relative abundance of TDCA in the
control, LCA and ANIT groups. The data were expressed as the mean ±
SD. *P<0.05 vs. control group; ^P<0.05 vs. LCA
group. BA, bile acid; ANIT, α-naphthylisothiocyanate; LCA,
lithocholic acid; TCA, taurocholic acid; T-α/β/ωMCA,
tauro-α/β/ω-muricholic acid; TCDCA, taurochenodeoxycholic acid;
TUDCA, tauroursodeoxycholic acid; TDCA, taurodeoxycholic acid. |
BA metabolism is altered in the two
cholestatic models
The expression levels of the BA synthesis genes were
decreased in the two cholestatic groups. The transcription of
cholesterol 7α-hydroxylase (Cyp7a1) and sterol
12α-hydroxylase (Cyp8b1) was significantly decreased in the
ANIT group compared with the control and LCA groups; Cyp7a1
and Cyp8b1 expression levels were decreased by 98 and 94%,
respectively, compared with the control group (Fig. 6A and B). In the LCA group,
Cyp7a1 expression levels were significantly decreased by 65%
compared with the control group; however, Cyp8b1 expression
levels were not significantly altered (Fig. 6A and B). This effect was possibly
associated with the different adaptations caused by the BA
component. In addition, organic anion transporting polypeptide
(Oatp)1 mRNA expression levels were significantly
decreased by 54% (Fig. 6C),
whereas Oatp2 mRNA expression levels were not significantly
altered in the ANIT group compared with the control group (Fig. 6D). Notably, in the LCA group,
Oatp1 mRNA expression levels were significantly decreased by
71% (Fig. 6C) and Oatp2
mRNA expression levels were significantly decreased by 81% compared
with the control group (Fig.
6D).
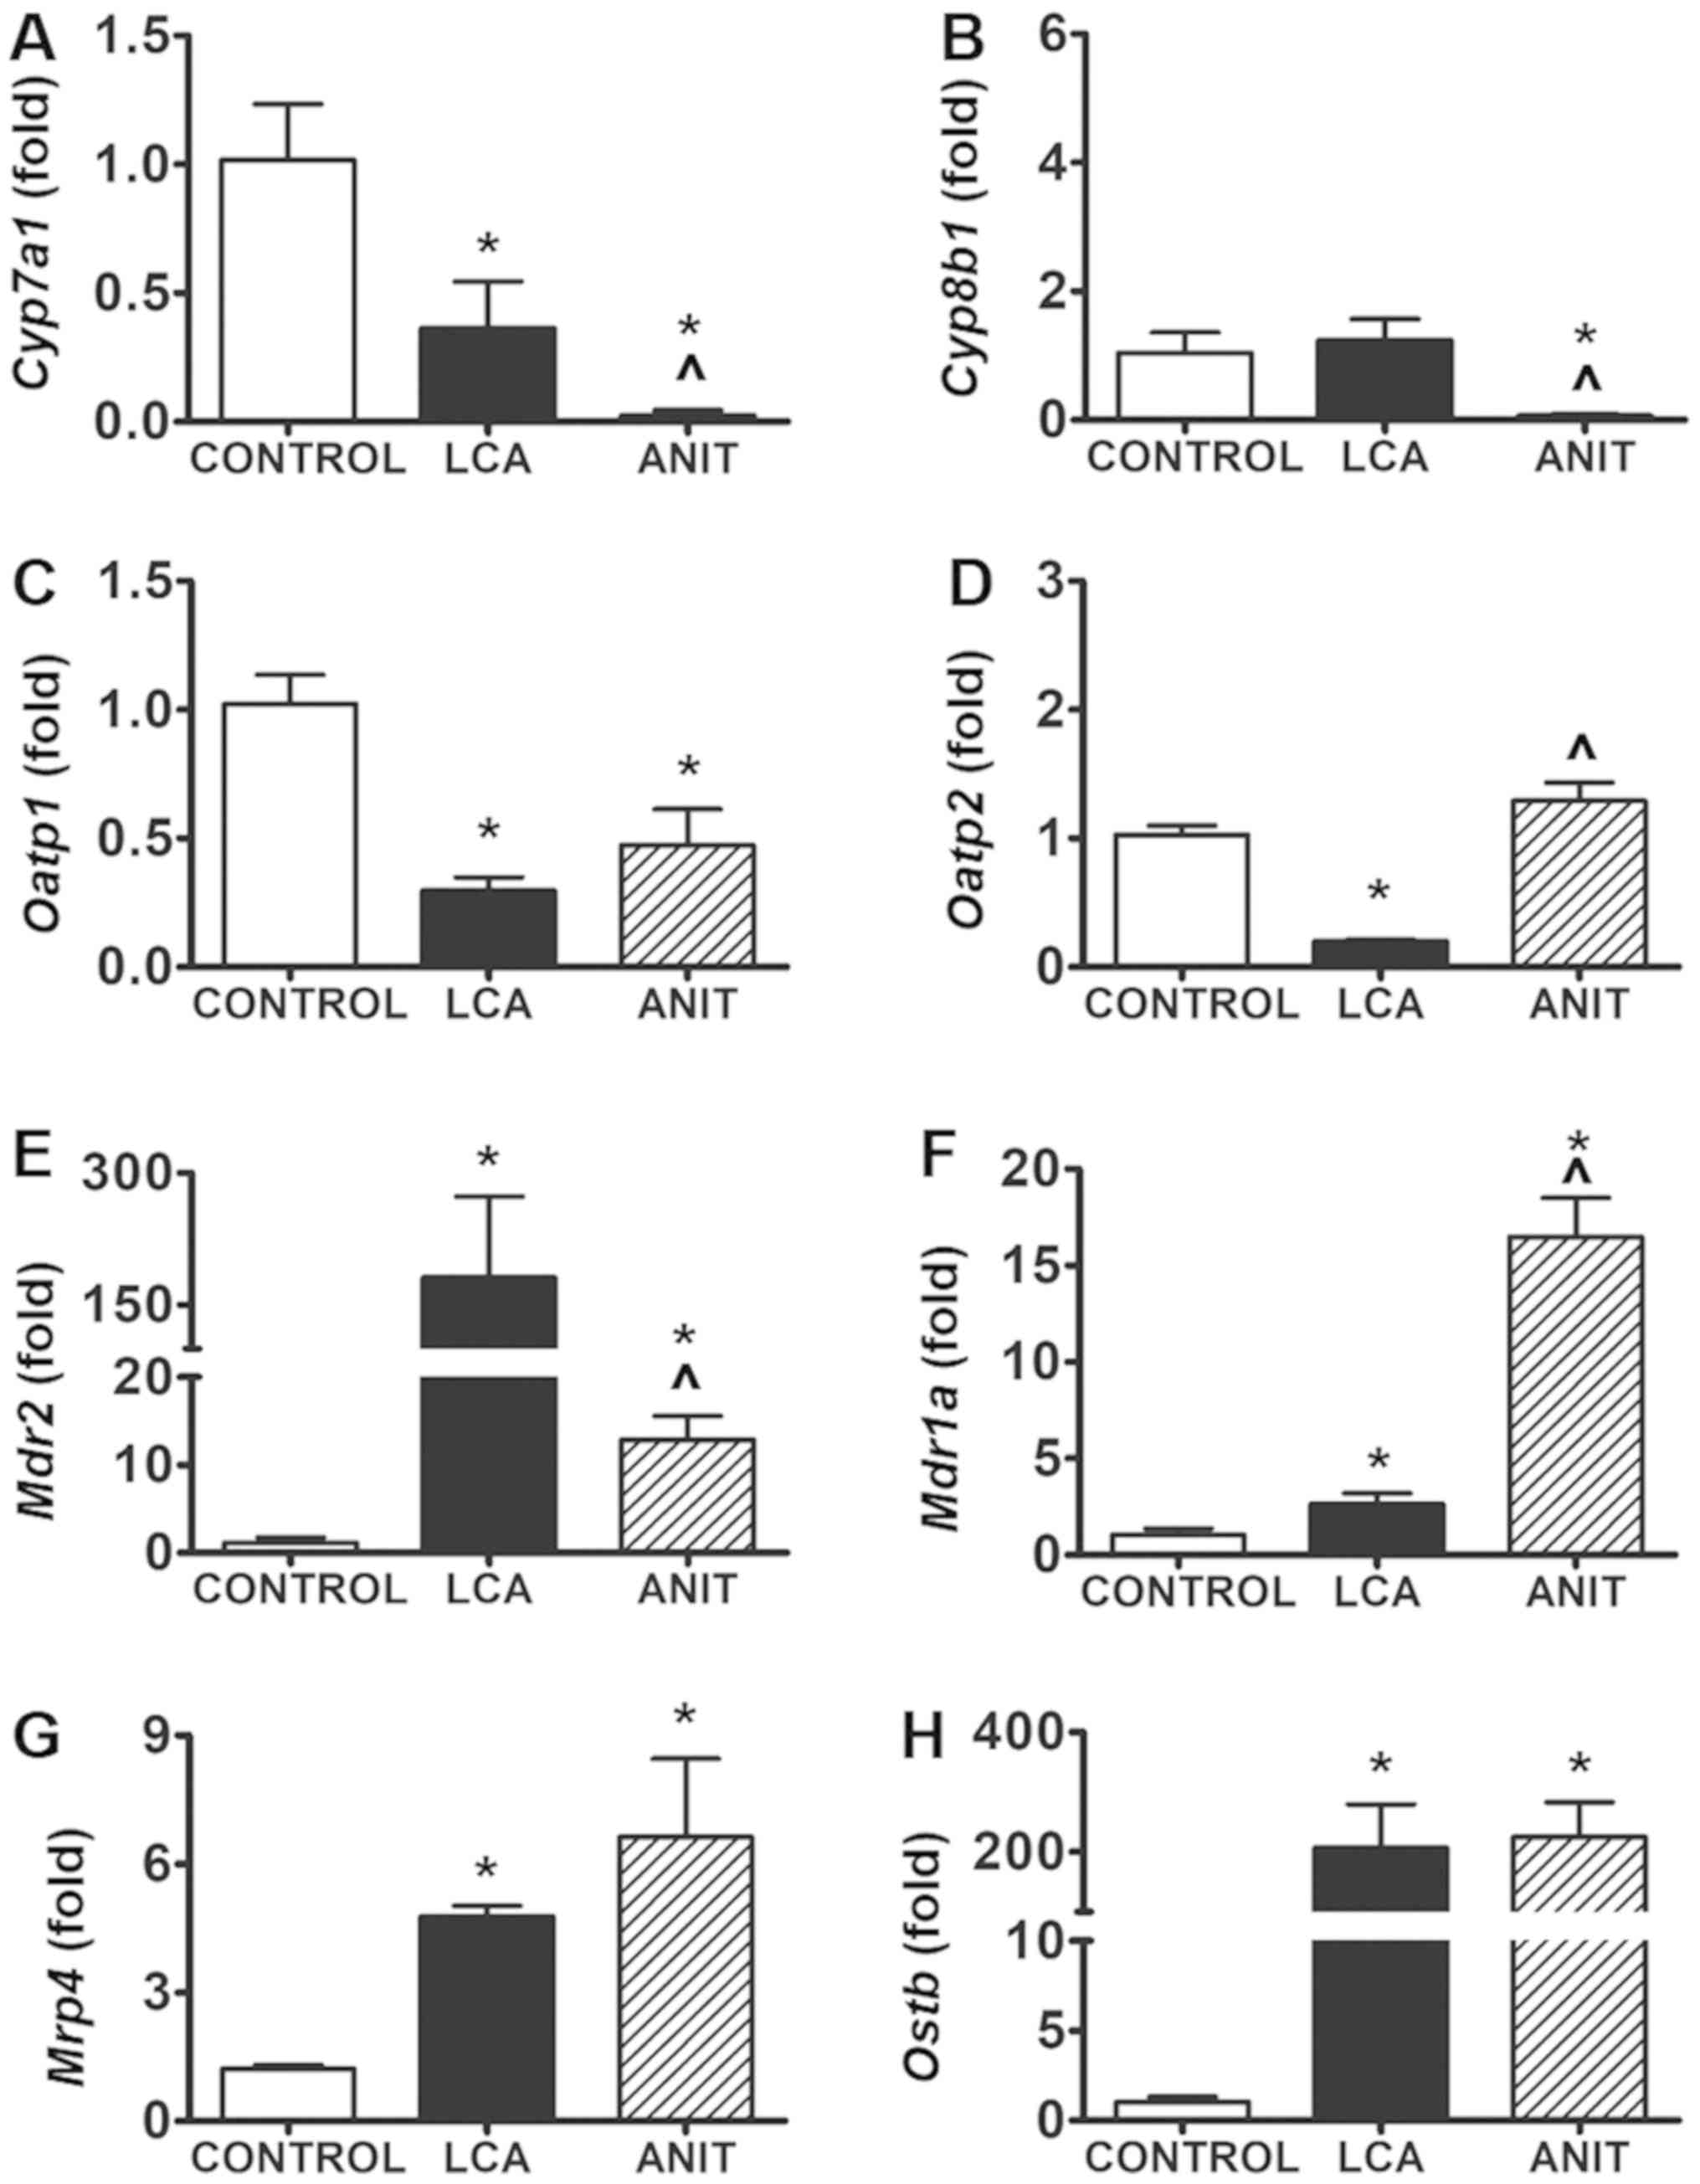 | Figure 6.Expression levels of genes involved
in bile acid synthesis, uptake and export. (A) Cyp7a1 mRNA
expression in the control, LCA and ANIT groups. (B) Cyp8b1 mRNA
expression in the control, LCA and ANIT groups. (C) Oatp1 mRNA
expression in the control, LCA and ANIT groups. (D) Oatp2 mRNA
expression in the control, LCA and ANIT groups. (E) Mdr2 mRNA
expression in the control, LCA and ANIT groups. (F) Mdr1a mRNA
expression in the control, LCA and ANIT groups. (G) Mrp4 mRNA
expression in the control, LCA and ANIT groups. (H) Ostb mRNA
expression in the control, LCA and ANIT groups. The mRNA expression
levels were analyzed using reverse transcription-quantitative PCR
and normalized to 18S ribosomal RNA. Data from the liver samples
was collected following ANIT and LCA treatment. mRNA expression
levels in the vehicle-treated control mice were set as 1 and the
results were expressed as the mean ± SD. N=5. *P<0.05 vs.
control group; ^P<0.05 vs. LCA group. ANIT,
α-naphthylisothiocyanate; LCA, lithocholic acid; Cyp7a1,
cholesterol 7α-hydroxylase; Cyp8b1, sterol 12α-hydroxylase; Oatp1,
organic anion transporting polypeptide 1; Oatp2, organic anion
transporting polypeptide 2; Mdr2, multidrug resistance protein 2;
Mdr1a, multidrug resistance protein 1a; Mrp4, multidrug
resistance-related protein 4; Ostb, organic solute
transporter-β. |
The expression levels of the BA transporter genes
were also increased in the two groups. Briefly, multidrug
resistance protein (Mdr)2 mRNA expression levels were
significantly increased by 10-fold in the ANIT group compared with
the control group (Fig. 6E).
Moreover, a 158-fold increase was noted in the LCA group compared
with the control group (Fig. 6E).
In addition, Mdr1a mRNA expression levels were significantly
increased by 15-fold in the ANIT group, while they were
significantly increased by 1.6-fold in the LCA group compared with
the control group (Fig. 6F).
Finally, multidrug resistance-related protein (Mrp) 4
mRNA expression level and organic solute transporter-β
(Ostb) mRNA expression levels were both significantly
increased in the LCA and ANIT groups compared with the control
group; however, no significant difference was identified in the
mRNA expression levels between the two cholestatic groups (Fig. 6G and H).
Induction of inflammation in the two
models is mediated by the JNK/STAT3 signaling pathway
The mRNA expression levels of the proinflammatory
factors Il10, c-Fos, Il6, suppressor of cytokine signaling 3
(Socs3), fibrinogen α chain (Fga) and fibrinogen β chain
(Fgb) were significantly increased in the LCA and ANIT
groups compared with the control group (Fig. 7A-F), suggesting a downstream
inflammatory response in the LCA and ANIT groups. Moreover, the
mRNA expression levels of Il10, c-Fos, Il6, Socs3, Fga and
Fgb were significantly increased in the LCA group compared
with the ANIT group (Fig. 7A-F).
Although, c-Jun mRNA levels were significantly increased in
the two cholestatic groups compared with the control, no
significant difference was observed between these two groups
(Fig. 7G). However, the mRNA
expression levels of Tnfα were not significantly different between
the two cholestatic groups and the control group (Fig. 7H).
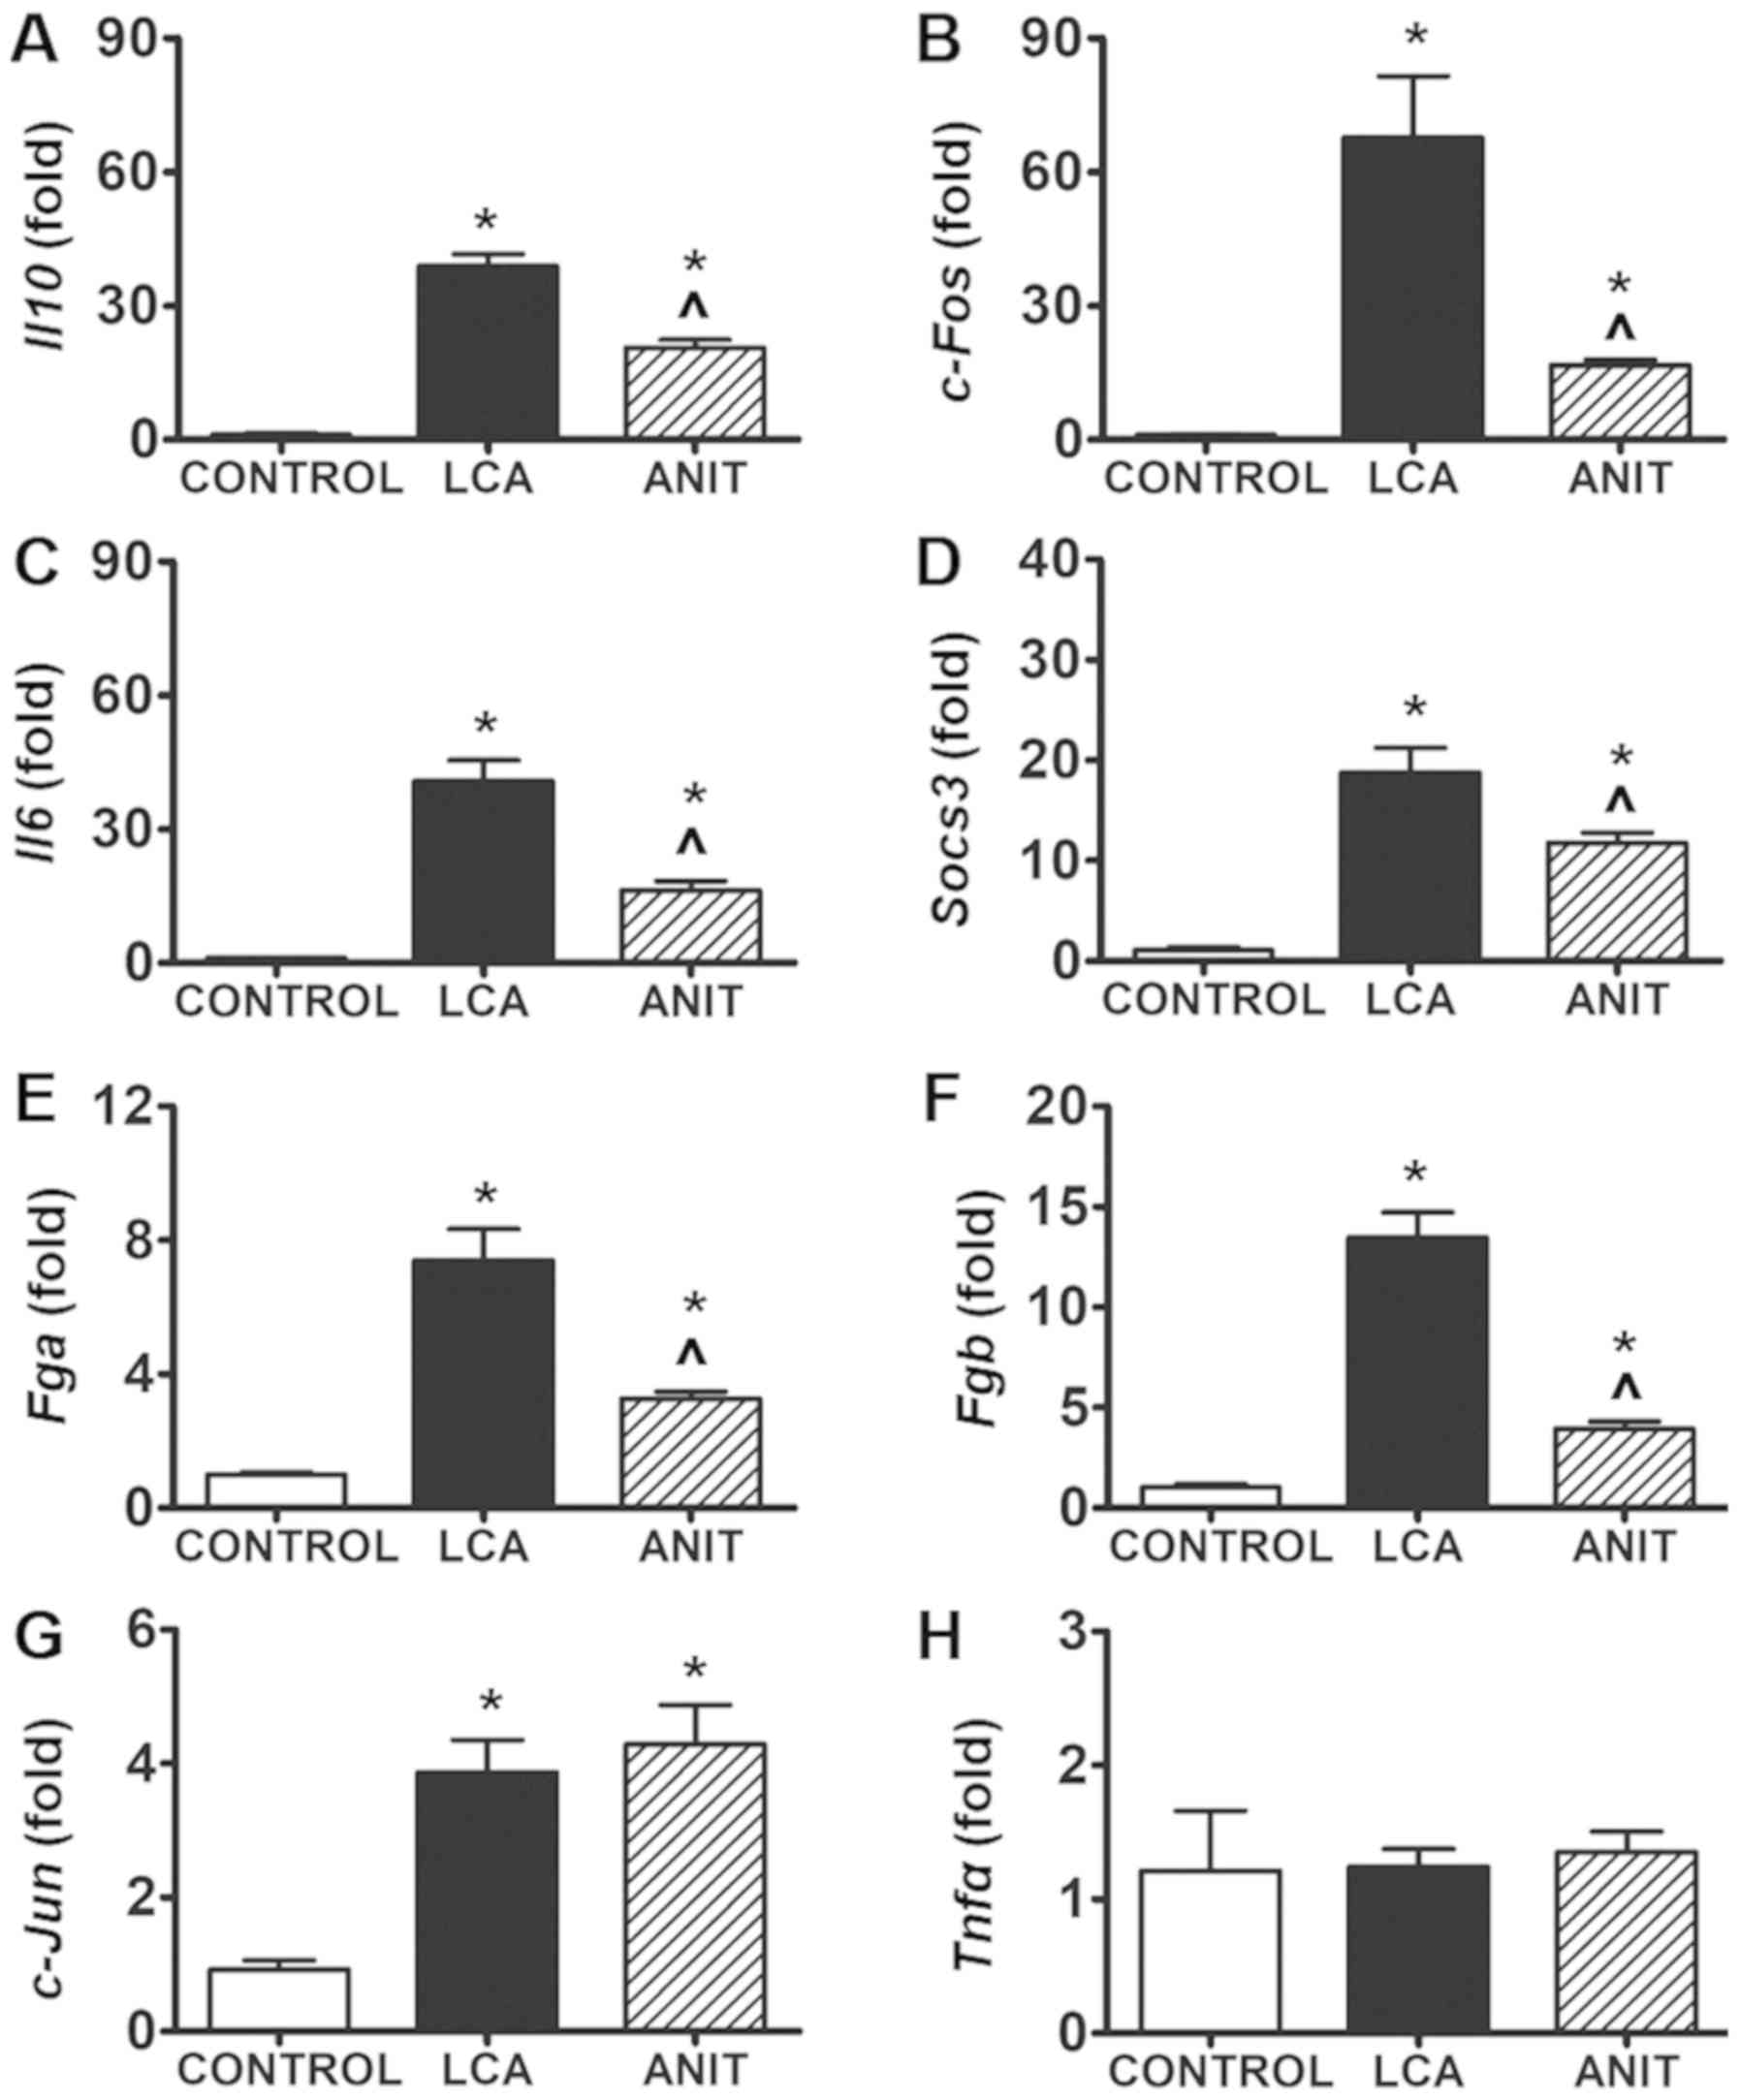 | Figure 7.Differentially regulated genes
involved in inflammation. mRNA expression levels of (A) Il10 mRNA
expression in the control, LCA and ANIT groups. (B) c-Fos mRNA
expression in the control, LCA and ANIT groups. (C) Il6 mRNA
expression in the control, LCA and ANIT groups. (D) Socs3 mRNA
expression in the control, LCA and ANIT groups. (E) Fga mRNA
expression in the control, LCA and ANIT groups. (F) Fgb mRNA
expression in the control, LCA and ANIT groups. (G) c-Jun mRNA
expression in the control, LCA and ANIT groups. (H) Tnfα mRNA
expression in the control, LCA and ANIT groups. The mRNA levels
were analyzed using reverse transcription-quantitative PCR and
normalized to 18S ribosomal RNA. The mRNA expression levels in the
vehicle-treated control mice were set as 1 and the results were
expressed as the mean ± SD. N=5. *P<0.05 vs. control group;
^P<0.05 vs. LCA group. ANIT,
α-naphthylisothiocyanate; LCA, lithocholic acid; Il10, interleukin
10; Il6, interleukin 6; Socs3, suppressor of cytokine signaling 3;
Fga, fibrinogen α chain; Fgb, fibrinogen β chain; Tnfα, tumor
necrosis factor α. |
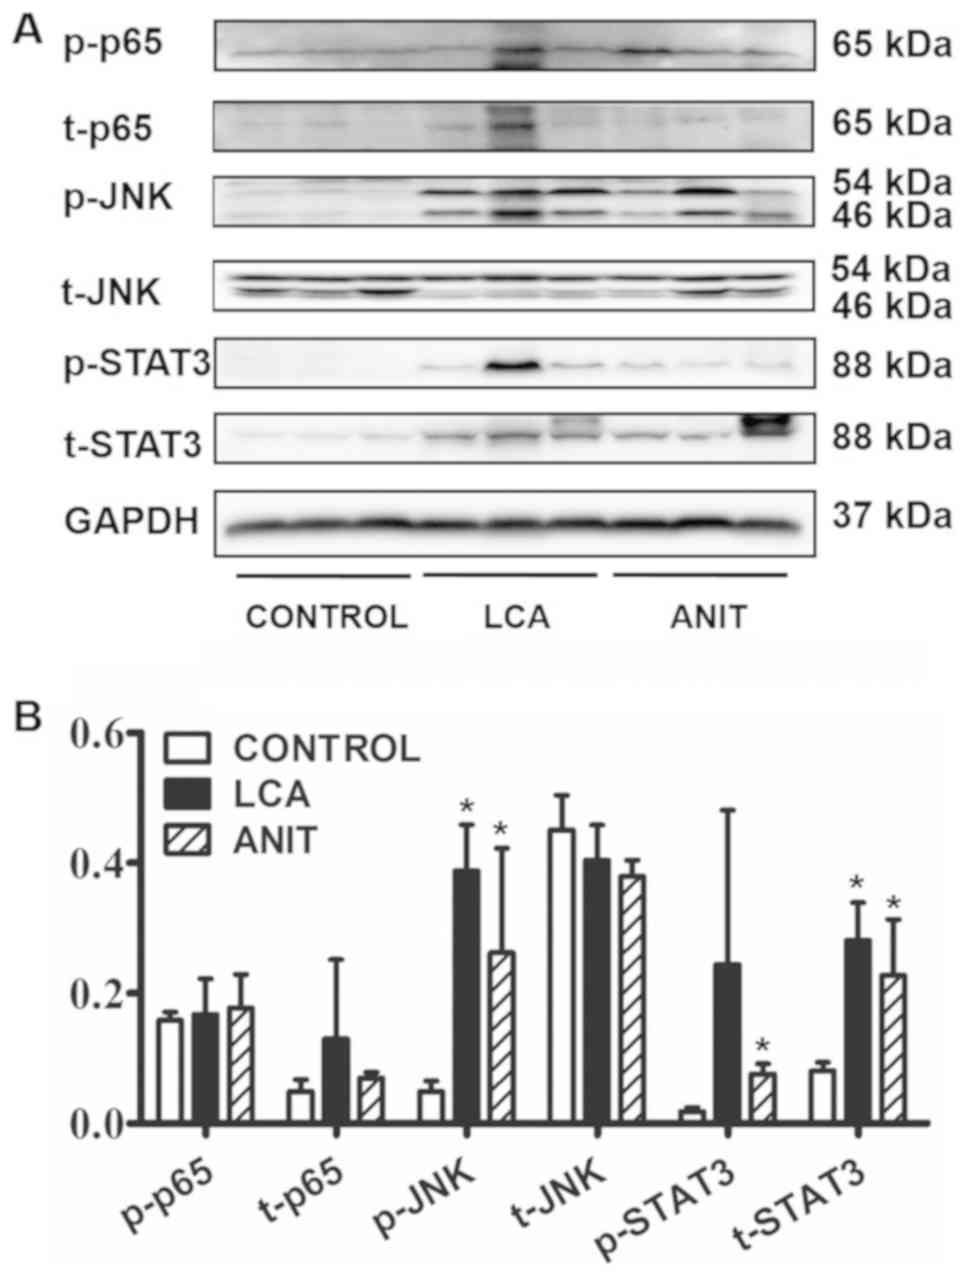
In western blotting, there was slight difference
between the ratio of p-p65/t-p65 in control, LCA and ANIT groups
(3.2, 1.5 and 2.5; Fig. 8). These
patterns were consistent with the differences identified in the
expression levels of Tnfα mRNA. Therefore, it was speculated
that the NF-κB pathway may not serve a critical role in cholestatic
inflammation. However, there was significant difference in the
ratio of p-JNK/t-JNK in control, LCA and ANIT groups (0.1, 1.0 and
0.7), which was significantly increased in the LCA and ANIT groups
compared with the control group. In addition, there was a
significant difference in the ratio of p-STAT3/t-STAT3 in control,
LCA and ANIT groups (0.2, 0.9 and 0.3), which was significantly
increased in the LCA and ANIT groups compared with the control
group (Fig. 8). Considering that
STAT3 is the transcription factor downstream of JNK (22), the activation of the JNK/STAT3
signaling axis was suggested to be a main contributing factor for
the liver injury of the two models.
Discussion
During ANIT-induced cholestasis, a higher biliary
concentration level of ANIT was discovered to be toxic to
cholangiocytes (23).
Subsequently, the blocked excretion of BA was discovered to
increase the BA load in the hepatocytes and induce hepatotoxicity
(24). The accumulation of LCA has
been implicated as a major factor contributing to cholestasis due
to its inherent cytotoxicity (25). In the present study, the ANIT group
was treated with a single dose of ANIT (75 mg/kg), which was at the
same level as typically used in mice (9,11),
whereas the LCA group included mice that were orally administered
five times with LCA (150 mg/kg; b.i.d), which was considered a low
level dose compared with the published dose range (13,15,16).
This dose level was validated in this study and could stably
produce cholestatic liver injury without lethal action. Moreover,
the levels of the liver injury biomarkers ALT and AST were higher
in the LCA group, while the levels of the cholestatic biomarker ALP
were higher in the ANIT group. The pathological analysis revealed
that the LCA group exhibited edematous hepatocytes around the
necrotic lesions with the presence of several vacuoles in the
hepatic tissues. In contrast, the ANIT group exhibited severely
dilated bile ducts and severe hepatic sinus congestion. The
toxicity features were consistent with the perspective that ANIT
acted on the biliary epithelial cells, whilst the injury induced by
LCA was considered to be hepatocellular (26,27).
LCA is absorbed in the colon, transported to the
liver and subsequently metabolized in the hepatocytes (25). The metabolites of LCA include the
major metabolite murideoxycholic acid, isolithocholic acid and
3-keto-5-cholanic acid, whereas 6-ketolithocholic acid and
ursodeoxycholic acid are considered minor metabolites (25). The enzymes involved in phase I
metabolism include cytochrome P450 (CYP)2C, CYP3A, CYP2A and
certain non-cytochrome P450 enzymes (25). In the present study, the measured
BA components were all higher in the LCA group compared with the
ANIT group. However, these components were not the aforementioned
metabolites of LCA. In addition, the metabolites of LCA have been
reported to be protective for liver function (28,29).
Therefore, it was hypothesized that the metabolites of LCA may be
the main contributors to the toxicity observed, although
insufficient evidence is presented. However, it is also possible
that the metabolites of LCA compete against the metabolism and
transport of the other BA components, which would subsequently lead
to cholestasis and liver injury (25). Based on this evidence, it was
hypothesized that the induced liver injury in the LCA group was
associated with the accumulation of toxic BA due to LCA
administration, rather than due to the direct action of the LCA
metabolites.
With regards to the metabolism of BAs, it has been
previously reported that the expression levels of Cyp7α1 and
Cyp8b1 were reduced following the administration of the ANIT
model, which was mediated by FXR (30). In the present study, TBA levels
were significantly increased in the ANIT group within the first 24
h. In contrast to these findings, TBA levels were significantly
increased between 36–48 h in the LCA group. Therefore, a more
potent adaptation of BA metabolism was identified in the ANIT group
compared with that in the LCA group. As expected, the expression
levels of Cyp7a1 and Cyp8b1 mRNA in the ANIT group
were lower compared with the LCA group. The expression levels of
inflammatory factors (Il10, c-Fos, Il6, Socs3, Fga and Fgb)
were also increased to a higher extent in the LCA group, further
suggesting the weaker adaptation to BA metabolism. TUDCA is an
antagonist of the nuclear factor FXR, whereas TCA is an agonist of
the same receptor, which mediates the adaptation to BA metabolism
(31). In the present study, the
modification of TUDCA (202-fold vs. 3-fold) was considerably higher
compared with the TCA (41-fold vs. 30-fold) in the LCA group
compared with the ANIT group. The biochemical responses,
pathological responses, toxic BA levels and the adaptation mode
exhibited a significant association with each other following LCA
and ANIT treatment.
Several known inflammatory pathways are associated
with cholestatic liver injury. In a previous study, endoplasmic
reticulum stress-related JNK activation was discovered to be
associated with LCA-induced hepatocyte apoptosis (32). In an ANIT-induced cholestatic
model, the JNK pathway was also associated with cholestatic liver
injury, whereby the inhibition of JNK prevented the
cholestasis-induced liver injury but not cholestasis itself,
suggesting the critical role of the JNK signaling pathway in this
condition (11). In ANIT-treated
mice, cholestatic liver injury was inhibited by chlorogenic acid,
which was involved in the inhibition of NF-κB and STAT3
phosphorylation (9). In addition,
the treatment of mice with LCA (125 mg/kg) twice daily for 7 days
resulted in the activation of the NF-κB signaling pathway (16). In the present study, the five doses
of LCA were administered with an interval of 12 h, which was
associated with increasing toxicity over time. The ANIT group was
treated with a single dose of ANIT as determined by a previous
study (9). In addition, the NF-κB
protein components exhibited a minor activation in the two
cholestatic groups, which was associated with the expression of the
proinflammatory factor Tnfα. In contrast, the expression
level of the p-JNK protein was significantly increased in both the
LCA and ANIT groups and the expression of the p-STAT3 protein was
significantly increased in the ANIT group; their activation was
similar between the two groups and consistent with the expression
of their target genes (JNK: c-Fos and c-Jun; STAT3:
Socs3, Fga and Fgb). The differences identified in
the expression levels of the cytokines represented the intensity of
toxicity of the models and not the toxicity mechanism behind the
two models. Based on the aforementioned evidence, the extent of
inflammation in the two models was hypothesized to be mediated by
the JNK/STAT3 signaling pathway.
Neutrophils serve a significant role in ANIT-induced
liver injury and neutrophil infiltration is considered the critical
step in inducing hepatocyte necrosis in cholestatic liver injury
(33). The ANIT concentration
gradient between the bile and plasma was reported to recruit the
neutrophils to the periportal regions and release lysosomal
proteases to damage the liver cells (33). In addition, in a LCA-induced model,
intercellular adhesion molecule-1 (ICAM-1) was found to be involved
in the extravasation of neutrophils from the sinusoids to the
hepatocytes (34). The inhibition
of ICAM-1 was also discovered to be highly effective in preventing
neutrophil-induced liver injury (34). The chemokines C-C motif chemokine
ligand 2, C-X-C chemokine ligand 2, high mobility group protein B1,
osteopontin, Il17, Il33, Il1β and Tnfα have been
identified to be involved in the chemotaxis of neutrophils
(15,35–39).
Certain proteins of the inflammatory pathway, such as ERK, p38,
JNK, NF-κB and STAT3 are also reportedly involved in the production
of chemokines (9,11,40,41).
However, to the best of our knowledge, the type of chemokine and
the exact inflammatory pathways that are the most critical in the
inflammatory process have not been fully identified. Moreover, the
group of cells that produces these chemokines has not been
completely discovered. Thus, these research questions remain to be
answered.
In conclusion, the ANIT-induced cholestasis promoted
a preferential disruption of the biliary system and triggered a
stronger adaptation to BA metabolism, whereas the LCA-induced
cholestasis mainly induced hepatocyte toxicity; therefore, the
treatments were cholestatic and hepatocellular in nature,
respectively, due to their different etiological mechanisms.
However, the progression of chemotaxis and the development of
inflammation exhibited certain similarities between these two
models. The data also suggested that the JNK/STAT3 pathway was
significantly activated in the two cholestatic models despite their
different toxicity phenotypes, suggesting the same potential
treatment target of the two different types of cholestatic liver
injuries.
Supplementary Material
Supporting Data
Acknowledgements
Not applicable.
Funding
The present study was supported by the Ningbo
Natural Science Foundation (grant nos. 2018A610253 and
2018A610384), Zhejiang Public Welfare Technology Research Program
(grant nos. LGD19H070001 and LY20H030001) and the K.C. WongMagna
Fund in Ningbo University.
Availability of data and materials
The datasets used and/or analyzed during the current
study are available from the corresponding author on reasonable
request.
Authors' contributions
AL and JY designed the study and revised the
manuscript; GX and MD performed the experiments, analyzed the data
and wrote the manuscript; and XZ and HL contributed to the
experimental work. All authors read and approved the final
manuscript.
Ethics approval and consent to
participate
The animal studies were performed following the
approval of the protocol by the Institutional Animal Care and Use
Committee (approval no. IACUC 201707-138) at Ningbo University
(Zhejiang, China).
Patient consent for publication
Not applicable.
Competing interests
The authors declare that they have no competing
interests.
References
|
1
|
Hirschfield GM, Heathcote EJ and Gershwin
ME: Pathogenesis of cholestatic liver disease and therapeutic
approaches. Gastroenterology. 139:1481–1496. 2010. View Article : Google Scholar : PubMed/NCBI
|
|
2
|
Poupon R: Primary biliary cirrhosis: A
2010 update. J Hepatol. 52:745–758. 2010. View Article : Google Scholar : PubMed/NCBI
|
|
3
|
Liu H, Liu Y, Wang L, Xu D, Lin B, Zhong
R, Gong S, Podda M and Invernizzi P: Prevalence of primary biliary
cirrhosis in adults referring hospital for annual health check-up
in Southern China. BMC Gastroenterol. 10:1002010. View Article : Google Scholar : PubMed/NCBI
|
|
4
|
Lindkvist B, Benito de Valle M, Gullberg B
and Bjornsson E: Incidence and prevalence of primary sclerosing
cholangitis in a defined adult population in Sweden. Hepatology.
52:571–577. 2010. View Article : Google Scholar : PubMed/NCBI
|
|
5
|
Claessen MM, Vleggaar FP, Tytgat KM,
Siersema PD and van Buuren HR: High lifetime risk of cancer in
primary sclerosing cholangitis. J Hepatol. 50:158–164. 2009.
View Article : Google Scholar : PubMed/NCBI
|
|
6
|
Tischendorf JJ, Hecker H, Kruger M, Manns
MP and Meier PN: Characterization, outcome, and prognosis in 273
patients with primary sclerosing cholangitis: A single center
study. Am J Gastroenterol. 102:107–114. 2007. View Article : Google Scholar : PubMed/NCBI
|
|
7
|
Zhang A, Jia Y, Xu Q, Wang C, Liu Q, Meng
Q, Peng J, Sun H, Sun P, Huo X and Liu K: Dioscin protects against
ANIT-induced cholestasis via regulating Oatps, Mrp2 and Bsep
expression in rats. Toxicol Appl Pharmacol. 305:127–135. 2016.
View Article : Google Scholar : PubMed/NCBI
|
|
8
|
Zhou HQ, Liu W, Wang J, Huang YQ, Li PY,
Zhu Y, Wang JB, Ma X, Li RS, Wei SZ, et al: Paeoniflorin attenuates
ANIT-induced cholestasis by inhibiting apoptosis in vivo via
mitochondria-dependent pathway. Biomed Pharmacother. 89:696–704.
2017. View Article : Google Scholar : PubMed/NCBI
|
|
9
|
Tan Z, Liu A, Luo M, Yin X, Song D, Dai M,
Li P, Chu Z, Zou Z, Ma M, et al: Geniposide inhibits
alpha-naphthylisothiocyanate-induced intrahepatic cholestasis: The
downregulation of STAT3 and NF[formula: See text]B signaling plays
an important role. Am J Chin Med. 44:721–736. 2016. View Article : Google Scholar : PubMed/NCBI
|
|
10
|
Connolly AK, Price SC, Connelly JC and
Hinton RH: Early changes in bile duct lining cells and hepatocytes
in rats treated with alpha-naphthylisothiocyanate. Toxicol Appl
Pharmacol. 93:208–219. 1988. View Article : Google Scholar : PubMed/NCBI
|
|
11
|
Dai M, Yang J, Xie M, Lin J, Luo M, Hua H,
Xu G, Lin H, Song D, Cheng Y, et al: Inhibition of JNK signalling
mediates PPARalpha-dependent protection against intrahepatic
cholestasis by fenofibrate. Br J Pharmacol. 174:3000–3017. 2017.
View Article : Google Scholar : PubMed/NCBI
|
|
12
|
Li X, Liu R, Yu L, Yuan Z, Sun R, Yang H,
Zhang L and Jiang Z: Alpha-naphthylisothiocyanate impairs bile acid
homeostasis through AMPK-FXR pathways in rat primary hepatocytes.
Toxicology. 370:106–115. 2016. View Article : Google Scholar : PubMed/NCBI
|
|
13
|
Zeng H, Li D, Qin X, Chen P, Tan H, Zeng
X, Li X, Fan X, Jiang Y, Zhou Y, et al: Hepatoprotective effects of
schisandra sphenanthera extract against lithocholic acid-induced
cholestasis in male mice are associated with activation of the
pregnane X receptor pathway and promotion of liver regeneration.
Drug Metab Dispos. 44:337–342. 2016. View Article : Google Scholar : PubMed/NCBI
|
|
14
|
Zhang X, Ma Z, Liang Q, Tang X, Hu D, Liu
C, Tan H, Xiao C, Zhang B, Wang Y, et al: Tanshinone IIA exerts
protective effects in a LCA-induced cholestatic liver model
associated with participation of pregnane X receptor. J
Ethnopharmacol. 164:357–367. 2015. View Article : Google Scholar : PubMed/NCBI
|
|
15
|
Woolbright BL, Li F, Xie Y, Farhood A,
Fickert P, Trauner M and Jaeschke H: Lithocholic acid feeding
results in direct hepato-toxicity independent of neutrophil
function in mice. Toxicol Lett. 228:56–66. 2014. View Article : Google Scholar : PubMed/NCBI
|
|
16
|
El-Agamy DS, Almaramhy HH, Ahmed N, Bojan
B, Alrohily WD and Elkablawy MA: Anti-inflammatory effects of
vardenafil against cholestatic liver damage in mice: A mechanistic
study. Cell Physiol Biochem. 47:523–534. 2018. View Article : Google Scholar : PubMed/NCBI
|
|
17
|
Kong Y, Gao X, Wang C, Ning C, Liu K, Liu
Z, Sun H, Ma X, Sun P and Meng Q: Protective effects of yangonin
from an edible botanical Kava against lithocholic acid-induced
cholestasis and hepatotoxicity. Eur J Pharmacol. 824:64–71. 2018.
View Article : Google Scholar : PubMed/NCBI
|
|
18
|
Dai M, Hua H, Lin H, Xu G, Hu X, Li F,
Gonzalez FJ, Liu A and Yang J: Targeted metabolomics reveals a
protective role for basal PPARα in cholestasis induced by
α-naphthylisothiocyanate. J Proteome Res. 17:1500–1508. 2018.
View Article : Google Scholar : PubMed/NCBI
|
|
19
|
Livak KJ and Schmittgen TD: Analysis of
relative gene expression data using real-time quantitative PCR and
the 2(-Delta Delta C(T)) method. Methods. 25:402–408. 2001.
View Article : Google Scholar : PubMed/NCBI
|
|
20
|
Melanie S, Benedikt K, Pfaffl MW and
Irmgard R: The potential of circulating extracellular small RNAs
(smexRNA) in veterinary diagnostics-Identifying biomarker
signatures by multivariate data analysis. Biomol Detect Quantif.
5:15–22. 2015. View Article : Google Scholar : PubMed/NCBI
|
|
21
|
Waner T and Nyska A: The toxicological
significance of decreased activities of blood alanine and aspartate
aminotransferase. Vet Res Commun. 15:73–78. 1991. View Article : Google Scholar : PubMed/NCBI
|
|
22
|
Ning T, Guo J, Zhang K, Li K, Zhang J,
Yang Z and Ge Z: Nanosecond pulsed electric fields enhanced
chondrogenic potential of mesenchymal stem cells via JNK/CREB-STAT3
signaling pathway. Stem Cell Res Ther. 10:452019. View Article : Google Scholar : PubMed/NCBI
|
|
23
|
Golbar HM, Izawa T, Yano R, Ichikawa C,
Sawamoto O, Kuwamura M, Lamarre J and Yamate J: Immunohistochemical
characterization of macrophages and myofibroblasts in
α-Naphthylisothiocyanate (ANIT)-induced bile duct injury and
subsequent fibrogenesis in rats. Toxicol Pathol. 39:795–808. 2011.
View Article : Google Scholar : PubMed/NCBI
|
|
24
|
Lleo A, Maroni L, Glaser S, Alpini G and
Marzioni M: Role of cholangiocytes in primary biliary cirrhosis.
Semin Liver Dis. 34:273–284. 2014. View Article : Google Scholar : PubMed/NCBI
|
|
25
|
Deo AK and Bandiera SM: Biotransformation
of lithocholic acid by rat hepatic microsomes: Metabolite analysis
by liquid chromatography/mass spectrometry. Drug Metab Dispos.
36:442–451. 2008. View Article : Google Scholar : PubMed/NCBI
|
|
26
|
Aithal GP, Watkins PB, Andrade RJ, Larrey
D, Molokhia M, Takikawa H, Hunt CM, Wilke RA, Avigan M, Kaplowitz
N, et al: Case definition and phenotype standardization in
drug-induced liver injury. Clin Pharmacol Ther. 89:806–815. 2011.
View Article : Google Scholar : PubMed/NCBI
|
|
27
|
Meng Q, Chen XL, Wang CY, Liu Q, Sun HJ,
Sun PY, Huo XK, Liu ZH, Yao JH and Liu KX: Alisol B 23-acetate
protects against ANIT-induced hepatotoxity and cholestasis, due to
FXR-mediated regulation of transporters and enzymes involved in
bile acid homeostasis. Toxicol Appl Pharmacol. 283:178–186. 2015.
View Article : Google Scholar : PubMed/NCBI
|
|
28
|
Miyata M, Watase H, Hori W, Shimada M,
Nagata K, Gonzalez FJ and Yamazoe Y: Role for enhanced faecal
excretion of bile acid in hydroxysteroid sulfotransferase-mediated
protection against lithocholic acid-induced liver toxicity.
Xenobiotica. 36:631–644. 2006. View Article : Google Scholar : PubMed/NCBI
|
|
29
|
Bodin K, Lindbom U and Diczfalusy U: Novel
pathways of bile acid metabolism involving CYP3A4. Biochim Biophys
Acta. 1687:84–93. 2005. View Article : Google Scholar : PubMed/NCBI
|
|
30
|
Lu TT, Makishima M, Repa JJ, Schoonjans K,
Kerr TA, Auwerx J and Mangelsdorf DJ: Molecular basis for feedback
regulation of bile acid synthesis by nuclear receptors. Mol Cell.
6:507–515. 2000. View Article : Google Scholar : PubMed/NCBI
|
|
31
|
Sun L, Xie C, Wang G, Wu Y, Wu Q, Wang X,
Liu J, Deng Y, Xia J, Chen B, et al: Gut microbiota and intestinal
FXR mediate the clinical benefits of metformin. Nat Med.
24:1919–1929. 2018. View Article : Google Scholar : PubMed/NCBI
|
|
32
|
Yu SJ, Bae S, Kang JS, Yoon JH, Cho EJ,
Lee JH, Kim YJ, Lee WJ, Kim CY and Lee HS: Hepatoprotective effect
of vitamin C on lithocholic acid-induced cholestatic liver injury
in Gulo(−/-) mice. Eur J Pharmacol. 762:247–255. 2015. View Article : Google Scholar : PubMed/NCBI
|
|
33
|
Roth RA and Dahm LJ: Neutrophil- and
glutathione-mediated hepatotoxicity of
alpha-naphthylisothiocyanate. Drug Metab Rev. 29:153–165. 1997.
View Article : Google Scholar : PubMed/NCBI
|
|
34
|
Essani NA, Fisher MA, Farhood A, Manning
AM, Smith CW and Jaeschke H: Cytokine-induced upregulation of
hepatic intercellular adhesion molecule-1 messenger RNA expression
and its role in the pathophysiology of murine endotoxin shock and
acute liver failure. Hepatology. 21:1632–1639. 1995. View Article : Google Scholar : PubMed/NCBI
|
|
35
|
Woolbright BL and Jaeschke H: Therapeutic
targets for cholestatic liver injury. Exp Opin Ther Targets.
20:463–475. 2016. View Article : Google Scholar
|
|
36
|
Woolbright BL and Jaeschke H: Inflammation
and cell death during cholestasis: The evolving role of bile acids.
Gene Expr. 19:215–228. 2019. View Article : Google Scholar : PubMed/NCBI
|
|
37
|
Lou G, Ma X, Fu X, Meng Z, Zhang W, Wang
YD, Van Ness C, Yu D, Xu R and Huang W: GPBAR1/TGR5 mediates bile
acid-induced cytokine expression in murine Kupffer cells. PLoS One.
9:e935672014. View Article : Google Scholar : PubMed/NCBI
|
|
38
|
Cai SY, Ouyang X, Chen Y, Soroka CJ, Wang
J, Mennone A, Wang Y, Mehal WZ, Jain D and Boyer JL: Bile acids
initiate cholestatic liver injury by triggering a
hepatocyte-specific inflammatory response. JCI Insight.
2:e907802017. View Article : Google Scholar : PubMed/NCBI
|
|
39
|
Woolbright BL, Dorko K, Antoine DJ, Clarke
JI, Gholami P, Li F, Kumer SC, Schmitt TM, Forster J, Fan F, et al:
Bile acid-induced necrosis in primary human hepatocytes and in
patients with obstructive cholestasis. Toxicol Appl Pharmacol.
283:168–177. 2015. View Article : Google Scholar : PubMed/NCBI
|
|
40
|
Li C, Yan Y, Shi Q, Kong Y, Gao L, Bao H
and Li Y: Recuperating lung decoction attenuates inflammation and
oxidation in cigarette smoke-induced COPD in rats via activation of
ERK and Nrf2 pathways. Cell Biochem Funct. 35:278–286. 2017.
View Article : Google Scholar : PubMed/NCBI
|
|
41
|
Zhang W, Dai H, Lin F, Zhao C, Wang X,
Zhang S, Ge W, Pei S and Pan L: Ly-6C(high) inflammatory-monocyte
recruitment is regulated by p38 MAPK/MCP-1 activation and promotes
ventilator-induced lung injury. Int Immunopharmacol. 78:1060152020.
View Article : Google Scholar : PubMed/NCBI
|