Introduction
Acute myocardial infarction (MI) is myocardial
necrosis caused by acute and persistent ischemia/hypoxia of the
coronary artery (1). As a
life-threatening disease, MI can be complicated by arrhythmia,
shock or heart failure (2).
Although classical clinical diagnostic methods, such as
characteristic electrocardiogram evolution and dynamic changes of
serum biomarkers, have improved the outcome to a certain extent, MI
remains a significant problem in terms of morbidity, mortality and
healthcare costs globally (3).
Therefore, effective identification of risk genes associated with
the development of this disease is essential for patients with
MI.
Genetic variants play important roles during the
progression of MI (4). In certain
areas, such as Japan, identification of polymorphisms of candidate
genes can be beneficial to reveal the genetic risk of MI (5). The genes encoding proteins that
affect hemostasis, such as coagulation factor XIII, play an
essential role in the pathogenesis of MI and are ideal candidate
genes for assessing the risk of acute MI (6). Bis et al (7) indicated that the variation in
inflammation-related genes, including those encoding interleukin
(IL)-1β, IL-6 and C-reactive protein, are involved in the
progression of nonfatal incident MI or the risk of ischemic
stroke.
Mathematical modeling is an important tool for the
investigation of MI epidemics (8).
Support vector machine (SVM) is a supervised learning model used
for classification and regression analysis (9). SVM has been successfully employed for
the detection of acute MI using serial electrocardiograms (10). An SVM radial-based model provided
improved classification performance compared with the linear SVM
model, and the use of SVM models could improve disease
classification performance (11).
Despite these advances in the study of MI pathogenesis and research
tools, the genes associated with a risk of MI remain unclear and an
early diagnosis model based on SVM is yet to be developed. Thus, an
investigation of abnormal genes and their related biological
functions might be beneficial to reveal MI risk-associated genes
and enable diagnostic model construction.
A previous study has explored the genetic
predisposition to acute MI (12).
Although genes associated with genetic risk of acute MI were
revealed, the detailed molecular mechanisms of candidate genes and
associated models for the clinical diagnosis of MI are still
unclear. In the present study, an investigation of differentially
expressed genes (DEGs), function and pathway enrichment analyses,
protein-protein interaction (PPI) network analysis and clustering
analysis were performed using previously reported data (12). Furthermore, an SVM prediction model
was constructed and validated using other gene expression profiles.
These findings may help to identify MI risk-associated genes, and
develop an early diagnostic model based on these genes using
SVM.
Materials and methods
Data resource
GSE34198 gene expression profile data (12) were downloaded from the Gene
Expression Omnibus (GEO) database based on the GPL6102-11574
platform. The dataset was obtained from peripheral blood samples of
97 participants, including 49 samples from patients with acute MI
(MI group) and 48 samples from healthy individuals (control
group).
Data preprocessing and investigation
of DEGs
The downloaded original data were processed using
the RMA package (version 0.1.0; http://www.rdocumentation.org/packages/affy/versions/1.50.0/topics/rma)
in R software (13). To
investigate the DEGs among different groups, the Z-score method was
used for the standardization of data (13). Then, the Limma package (version
3.38.3) (14) in R was used to
reveal DEGs between the control and MI groups. P<0.05 and |log
fold change (FC)|>1 were considered to be the standards for the
screening of DEGs.
PPI network construction
Based on Human Protein Reference Database protein
interaction data (15), the DEGs
were mapped to a human protein interaction network, and the
interaction relationship was edged to construct an MI-specific PPI
network. The degree (number of connections for the target protein)
was used to evaluate the important target genes (16). The PPI network was constructed
based on Cytoscape (version 3.4.0) software (17). To complement the incomplete gene
interaction network, the network was extended by introducing
non-DEGs that interacted with at least 20 DEGs.
Feature gene investigation
Disease-related genes often participate in the same
disease pathway or biological processes together with their various
adjacent proteins. Since the proteins involved in disease pathways
and their adjacent proteins are related in terms of expression, the
genes that were associated with MI were identified using the
neighborhood score (NS score) network algorithm (18). This algorithm calculates the FC
value of the central node and its surrounding neighbor nodes to
calculate the degree of node changes in the disease state and its
impact on other genes around it, so as to identify disease-related
genes. According to the probability density distribution of the
score, the nodes with the highest absolute scores were selected as
the candidate feature genes.
Unsupervised hierarchical clustering
analysis
To verify that the candidate feature genes could
effectively distinguish the control group from the MI group, an
unsupervised hierarchical clustering analysis was performed on all
samples based on candidate feature genes. Pearson correlation
coefficients were used to calculate a similarity matrix, and
average linkage was used to calculate the value of linkage. The
clustering results were visualized using a heatmap.
Enrichment analysis of DEGs
Using DAVID software (version 6.8) (19), Gene Ontology-biological function
(GO-BP) annotation (20) and Kyoto
Encyclopedia of Genes and Genomes pathway enrichment analysis
(21) were performed on DEGs.
P<0.05 and a count >5 were chosen as the cut-off criteria for
the present enrichment analysis. The enrichment process was
realized using a corrected Fisher's exact test algorithm (22).
Feature selection of candidate feature
genes
To optimize and screen out representative genes that
could be used as clinical diagnostic markers for model
construction, all candidate feature genes were enrolled for current
feature selection. The recursive feature elimination (RFE)
algorithm (23) in machine
learning was used to evaluate the effectiveness of classifying and
identifying patients with different risks through iterative random
feature combination.
SVM model investigation
The confusion matrix is a standard format for
precision evaluation. The precision index reflects the accuracy of
image classification from different aspects. A confusion matrix
algorithm (24) in SVM was used to
construct the confusion matrix. SVM is a blend of linear modeling
and instance-based learning (25).
An SVM selects a small number of critical boundary samples, called
support vectors, from each category and builds a linear
discriminate function that separates them as widely as possible
(26). Five-fold cross-validation
on a receiver operating characteristic (ROC) curve was used to
evaluate the effectiveness of the model. To observe the
distribution of samples under different characteristics
intuitively, the result was visualized via two-dimensional and
three-dimensional (3D) images.
Validation of independent data
The GSE61144 dataset (27) [seven pre-percutaneous coronary
intervention (PCI) samples, seven post-PCI samples and 10 control
samples; GPL6106 Sentrix Human-6 v2 Expression BeadChip platform]
obtained from the GEO database was used as the validation data in
the current study. In the independent data validation process, the
normal healthy control group (10 control samples) and the MI
disease group (seven pre-PCI samples and seven post-PCI samples)
were used as two subgroups to verify the efficacy of the model in
predicting patients with MI. The classification model was used to
classify and identify 24 samples in the verification data.
Results
Identification of DEGs and PPI network
investigation
A total of 1,207 DEGs, which included 724
downregulated and 483 upregulated genes, were obtained among the
groups with thresholds of P<0.05 and |logFC|>1.
Based on these DEGs, a PPI network was further
constructed (data not shown). There were 1,083 nodes and 46,363
edges in this network. Among the 1,083 nodes, there were 328
upregulated genes, 217 downregulated genes and 538 extended genes
directly interacting with at least 20 DEGs.
Candidate gene exploration and
unsupervised hierarchical clustering analysis
The probability density distribution of all DEGs was
evaluated by calculating the NS score. An NS score of 0.8 indicated
that the corresponding nodal degree and FC of genes had a high
expression value. Thus, with a score of 0.8, a total of 87 DEGs,
including EHBP1 (NS score=0.96), EX0C6B (NS score=0.96), GRB10 (NS
score=0.92), A-kinase anchoring protein 12 (AKAP12; NS score=0.91)
and SOX4 (NS score=0.91) were selected as candidate genes.
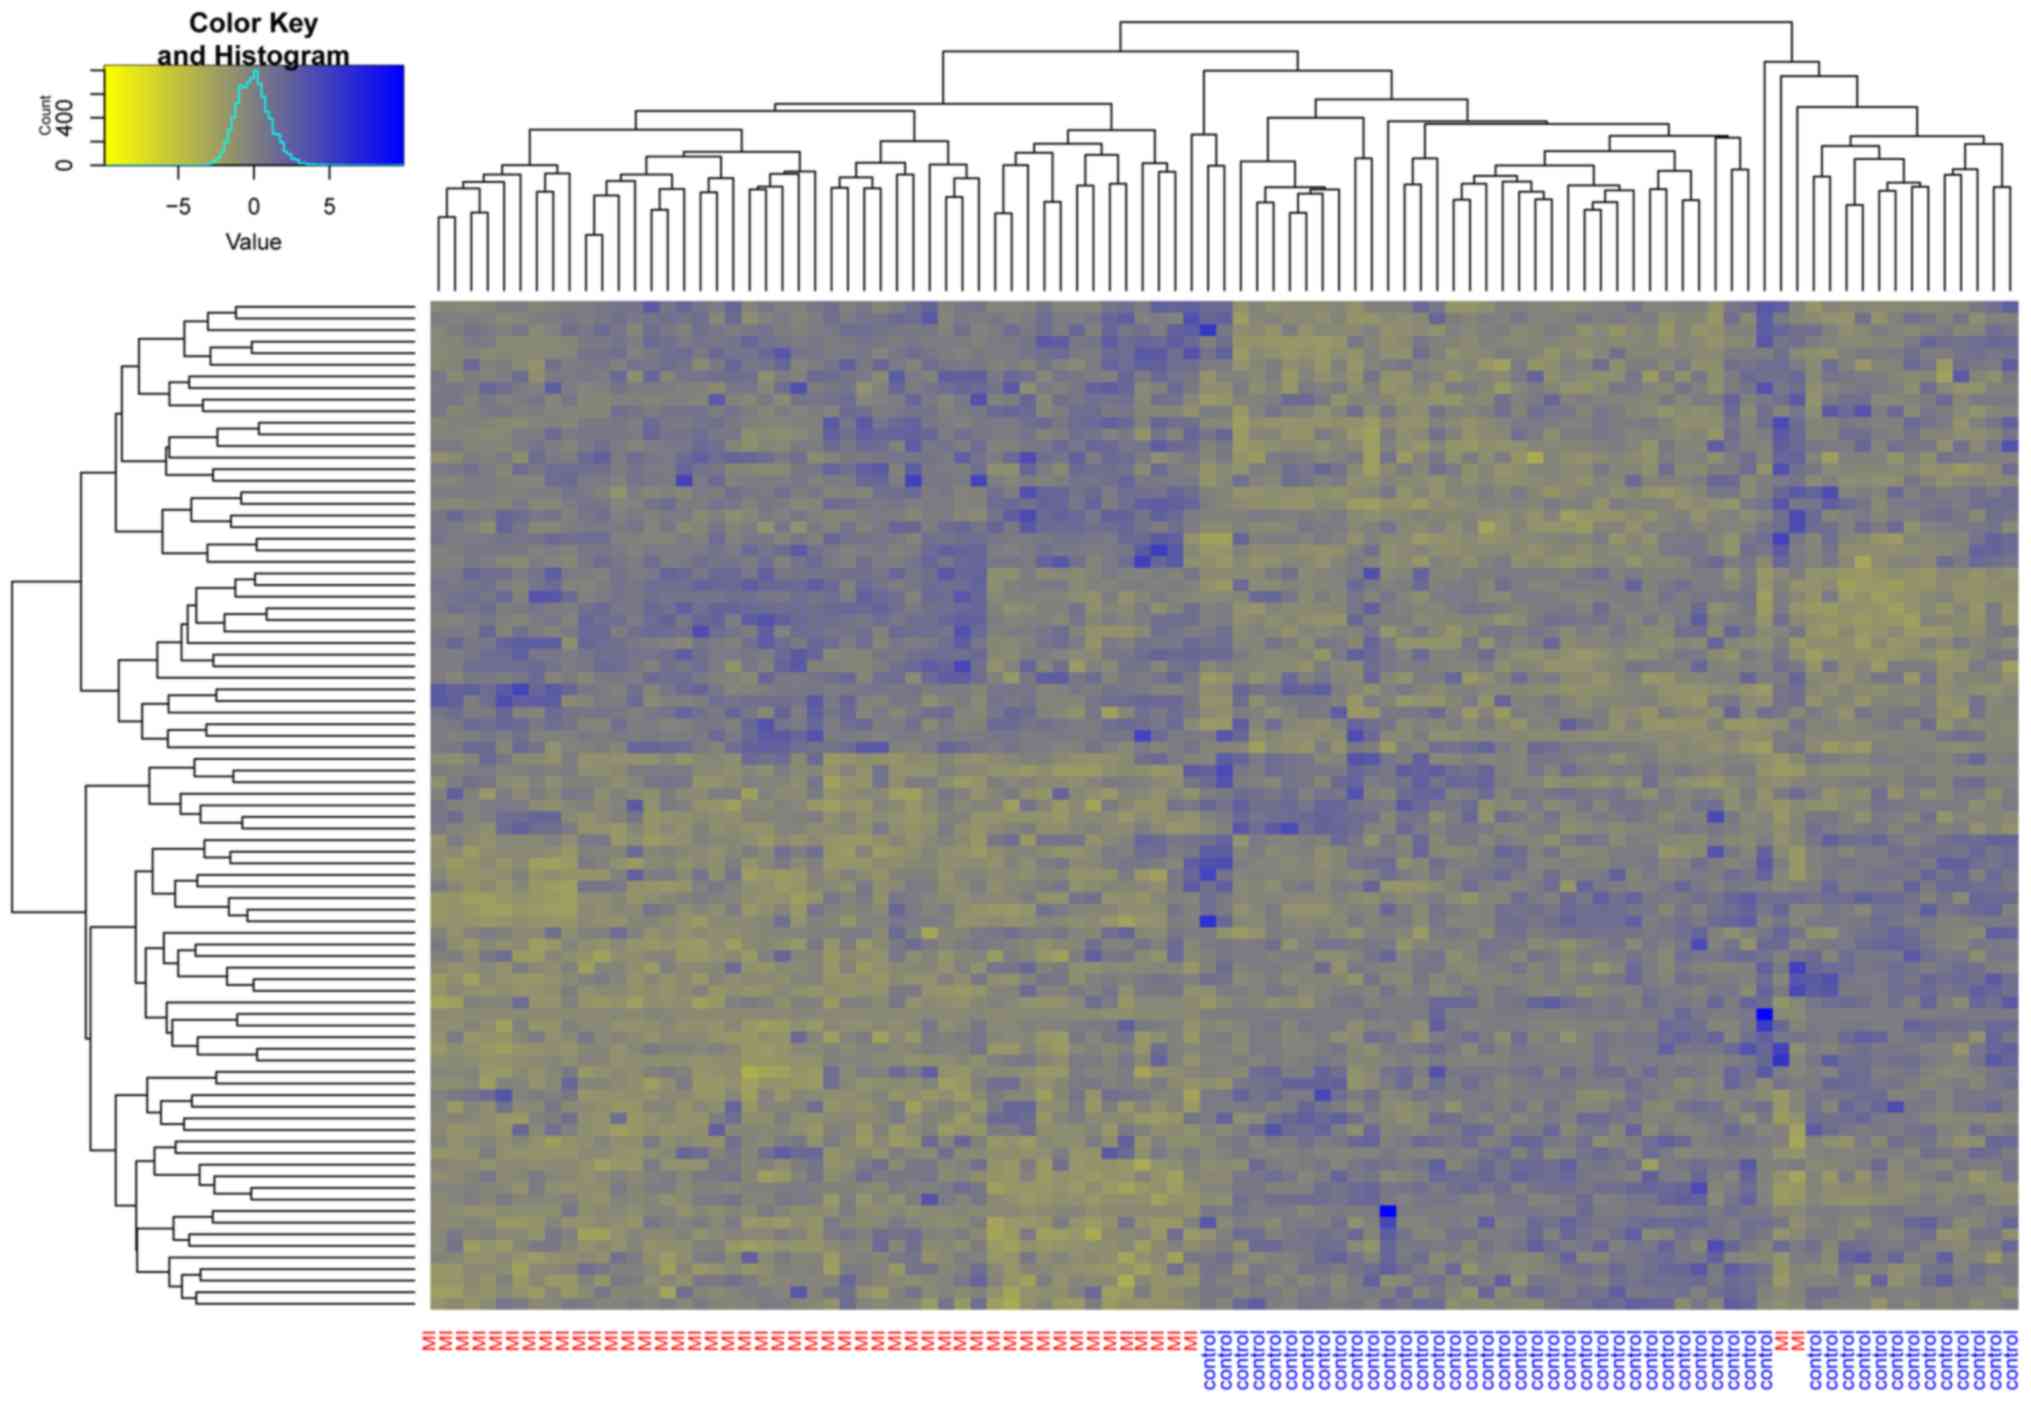
Unsupervised hierarchical clustering was performed for these 87
DEGs (Fig. 1). Almost all the MI
samples were clustered in the left cluster, while most of the
normal samples were clustered in the right cluster. This indicated
that the candidate genes identified by the neighborhood score
algorithm could be used to distinguish MI samples from non-MI
samples.
Enrichment analysis
The functional enrichment of candidate genes was
performed using Fisher's exact test (Table I). The result showed that these
genes were mainly enriched in functions such as ‘G-protein coupled
receptor signaling’ [olfactory receptor (OR)5I1, OR1A1, ENPP2,
CD3E, LHCGR, NPBWR2, HTR4, AKAP12, OR1D2, OR1G1, OR51M1, OR8B8,
OR7C1, OR51B5, OR8D2 and GLP1R] and pathways including ‘focal
adhesion’ (EGFR, KRAS, PAK3, JUN, TGFA, MAPK8 and CAMK2A).
 | Table I.Function and pathway enrichment of
DEGs. |
Table I.
Function and pathway enrichment of
DEGs.
| A, GO-BP
analysis |
|---|
|
|---|
| Term | Count | P-value |
|---|
| ErbB signaling
pathway | 7 |
4.903×10⁻⁵ |
| Focal adhesion | 8 |
9.329×10⁻⁴ |
| Pancreatic
cancer | 5 |
1.500×10⁻³ |
| Renal cell
carcinoma | 5 |
1.500×10⁻³ |
| Neurotrophin
signaling pathway | 6 |
2.000×10⁻³ |
| Olfactory
transduction | 10 |
3.000×10⁻³ |
| cAMP signaling
pathway | 7 |
3.900×10⁻³ |
| GnRH signaling
pathway | 5 |
5.100×10⁻³ |
| Oxytocin signaling
pathway | 6 |
5.700×10⁻³ |
| Choline metabolism
in cancer | 5 |
7.300×10⁻³ |
| Proteoglycans in
cancer | 6 |
1.830×10⁻² |
| Neuroactive
ligand-receptor interaction | 7 |
1.890×10⁻² |
| Insulin signaling
pathway | 5 |
2.120×10⁻² |
| Hepatitis B | 5 |
2.490×10⁻² |
| Ras signaling
pathway | 6 |
2.920×10⁻² |
|
| B, KEGG
analysis |
|
| Term | Count | P-value |
|
| ErbB signaling
pathway | 7 |
4.903×10⁻⁵ |
| Focal adhesion | 8 |
9.329×10⁻⁴ |
| Pancreatic
cancer | 5 |
1.500×10⁻³ |
| Renal cell
carcinoma | 5 |
1.500×10⁻³ |
| Neurotrophin
signaling pathway | 6 |
2.100×10⁻³ |
| Olfactory
transduction | 10 |
3.000×10⁻³ |
| cAMP signaling
pathway | 7 |
3.900×10⁻³ |
| GnRH signaling
pathway | 5 |
5.100×10⁻³ |
| Oxytocin signaling
pathway | 6 |
5.700×10⁻³ |
| Choline metabolism
in cancer | 5 |
7.300×10⁻³ |
| Proteoglycans in
cancer | 6 |
1.830×10⁻² |
| Neuroactive
ligand-receptor interaction | 7 |
1.890×10⁻² |
| Insulin signaling
pathway | 5 |
2.120×10⁻² |
| Hepatitis B | 5 |
2.490×10⁻² |
| Ras signaling
pathway | 6 |
2.920×10⁻² |
Feature selection and subnetwork
analysis for candidate genes
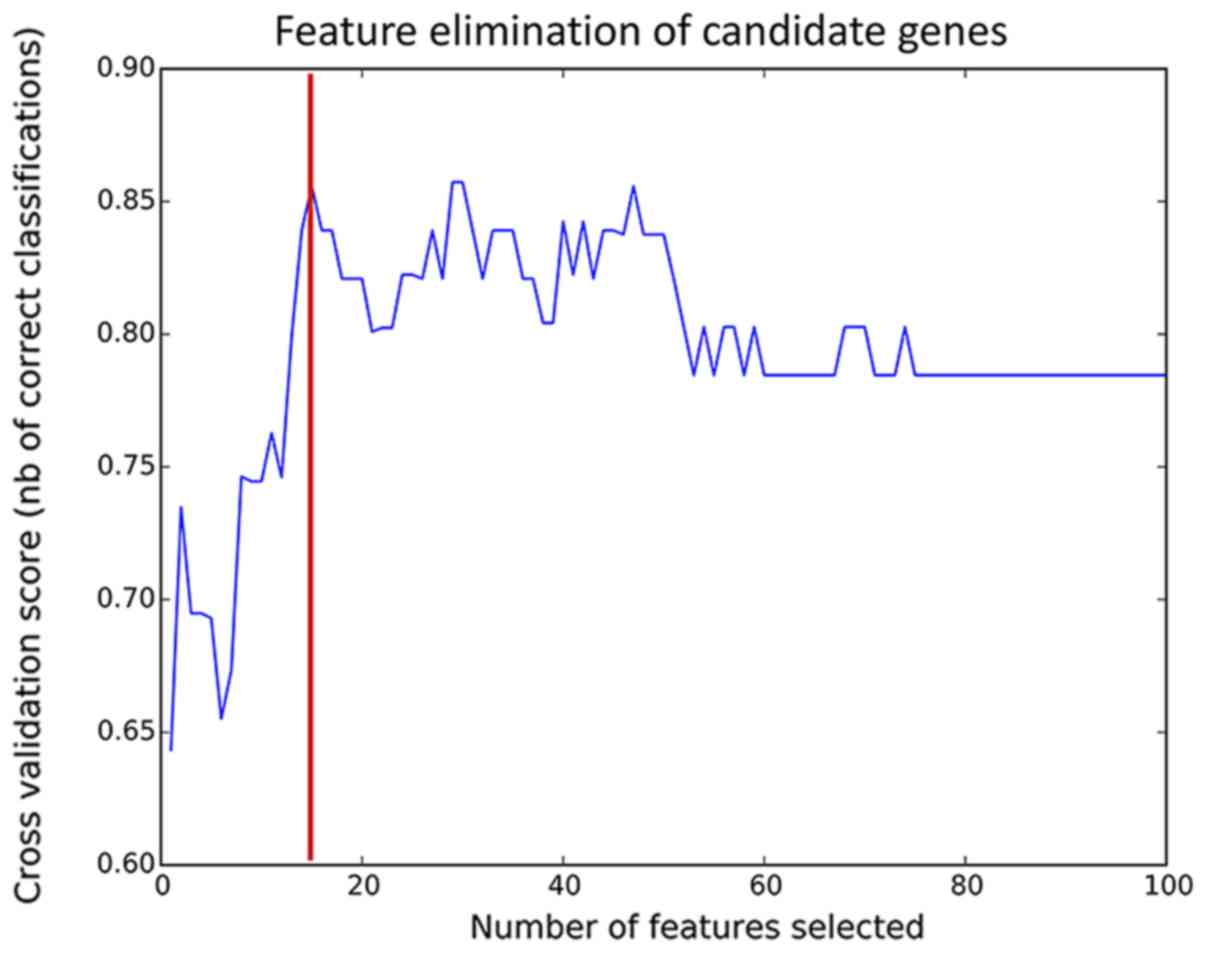
To improve the prediction accuracy, feature
selection was performed using the RFE algorithm (Fig. 2). The model had the highest
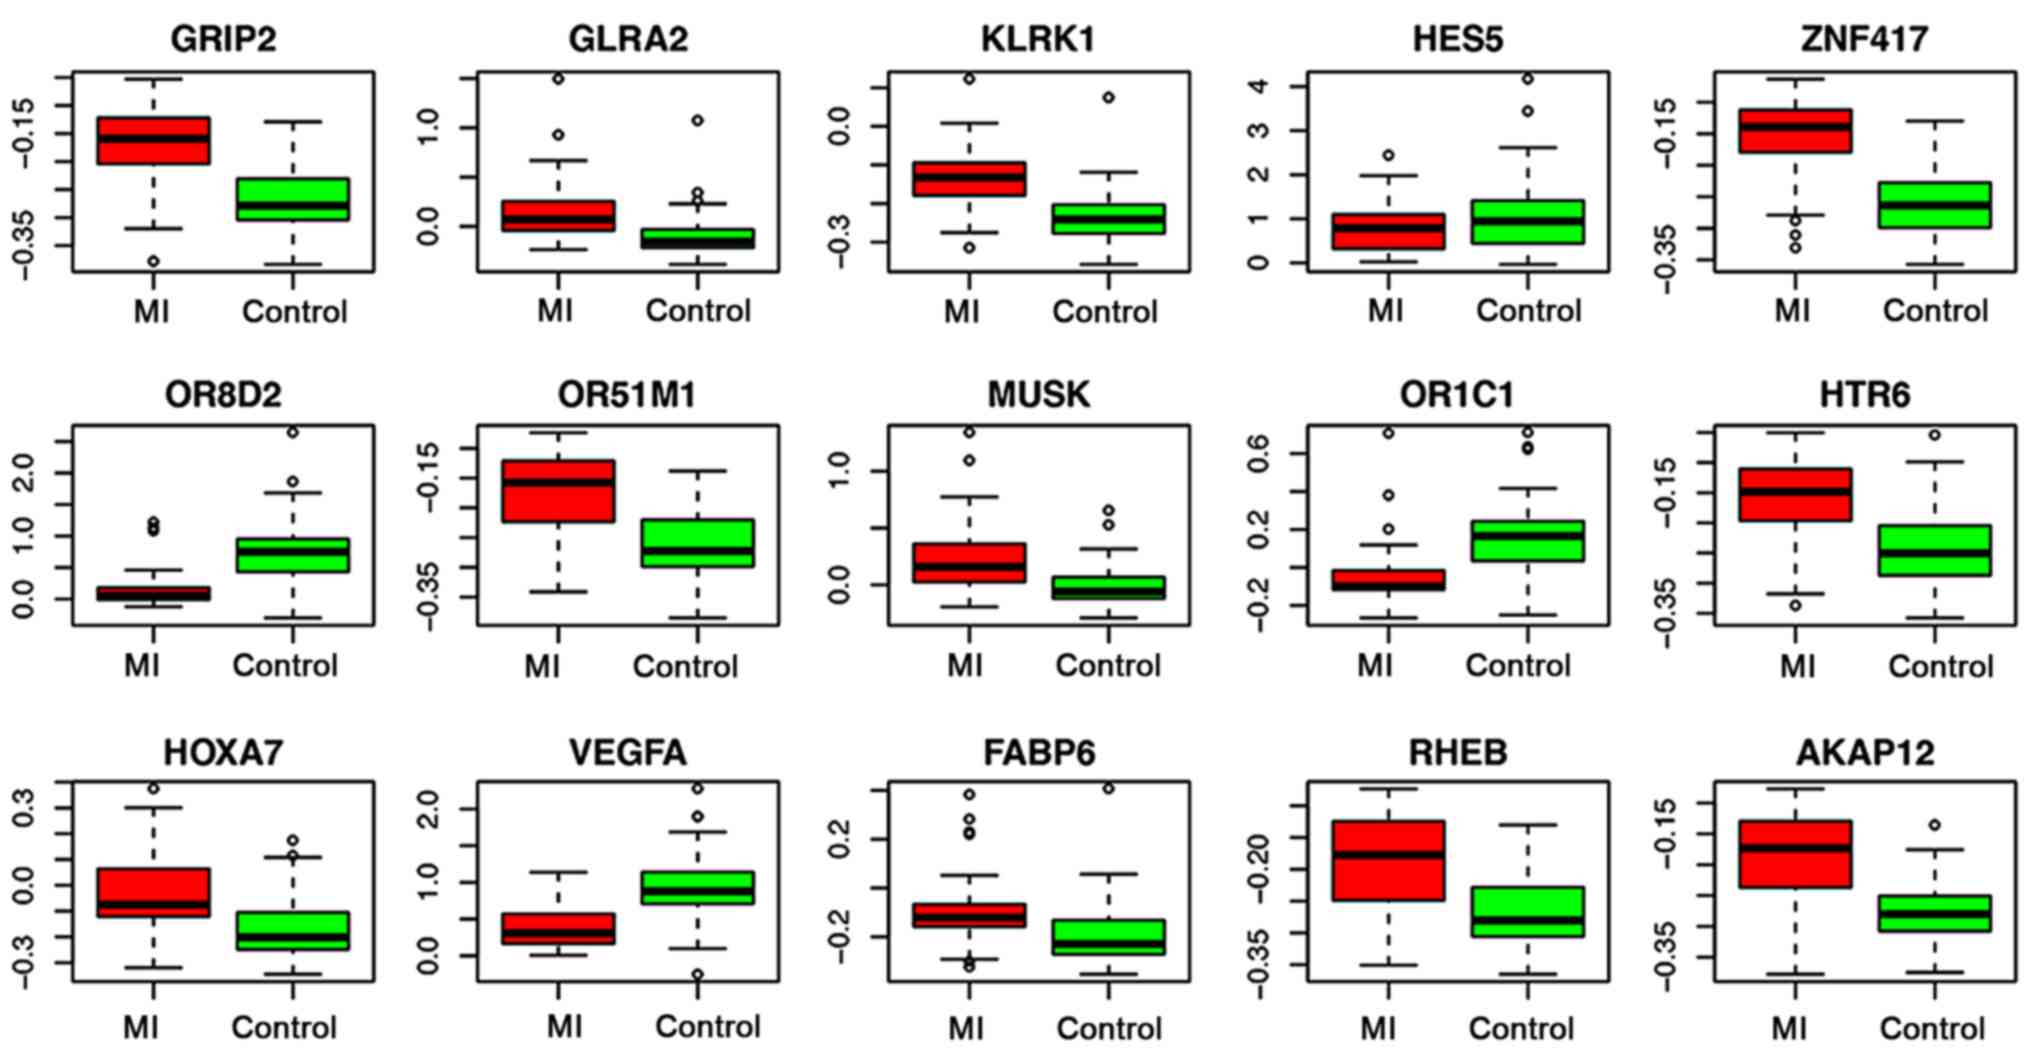
prediction accuracy when 15 features were combined (85%). The gene
expression distribution of 15 genes, HES5, ZNF417, GLRA2, OR8D2,
HOXA7, FABP6, MUSK, HTR6, GRIP2, OR51M1, OR1C1, KLRK1, vascular
endothelial growth factor A (VEGFA), AKAP12 and RHEB, are shown in
Fig. 3. Most of the genes were
upregulated in patients with MI, although the expression levels of
the OR8D2, OR1C1, HES5 and VEGFA genes were lower in the MI group
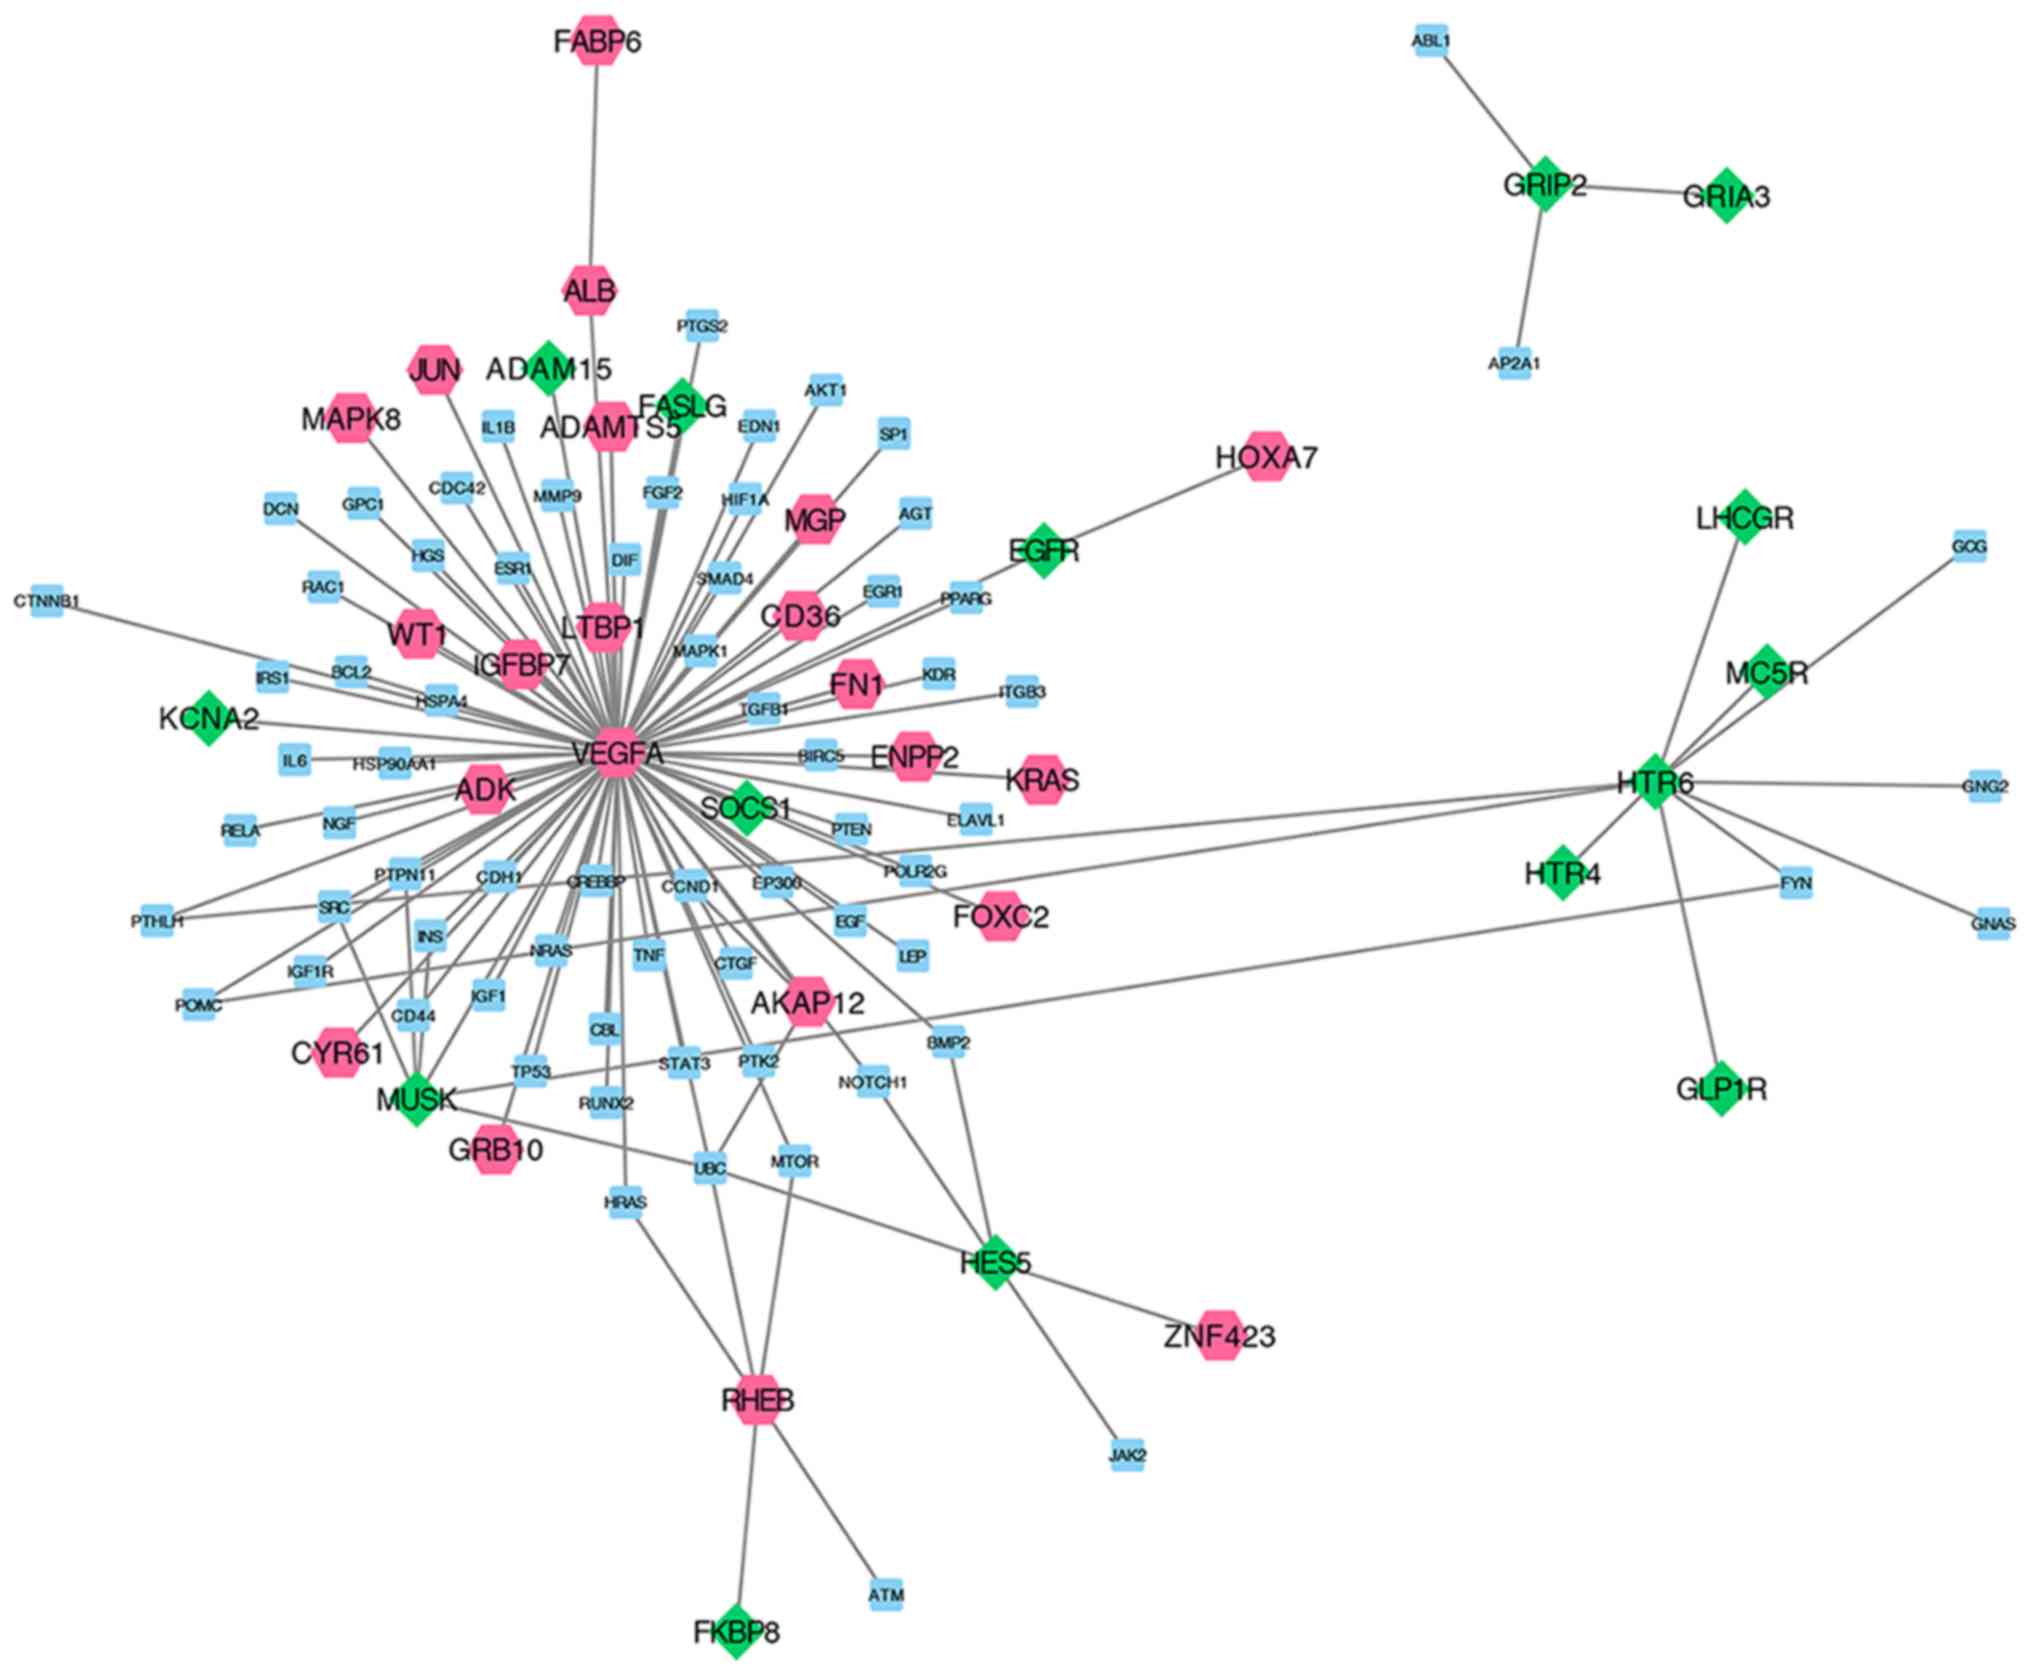
than those in the control group. These 15 feature genes and
non-DEGs that interact with candidate genes were extracted from the
PPI network to construct the subnetwork (Fig. 4). There were 107 nodes and 117
edges in the current subnetwork.
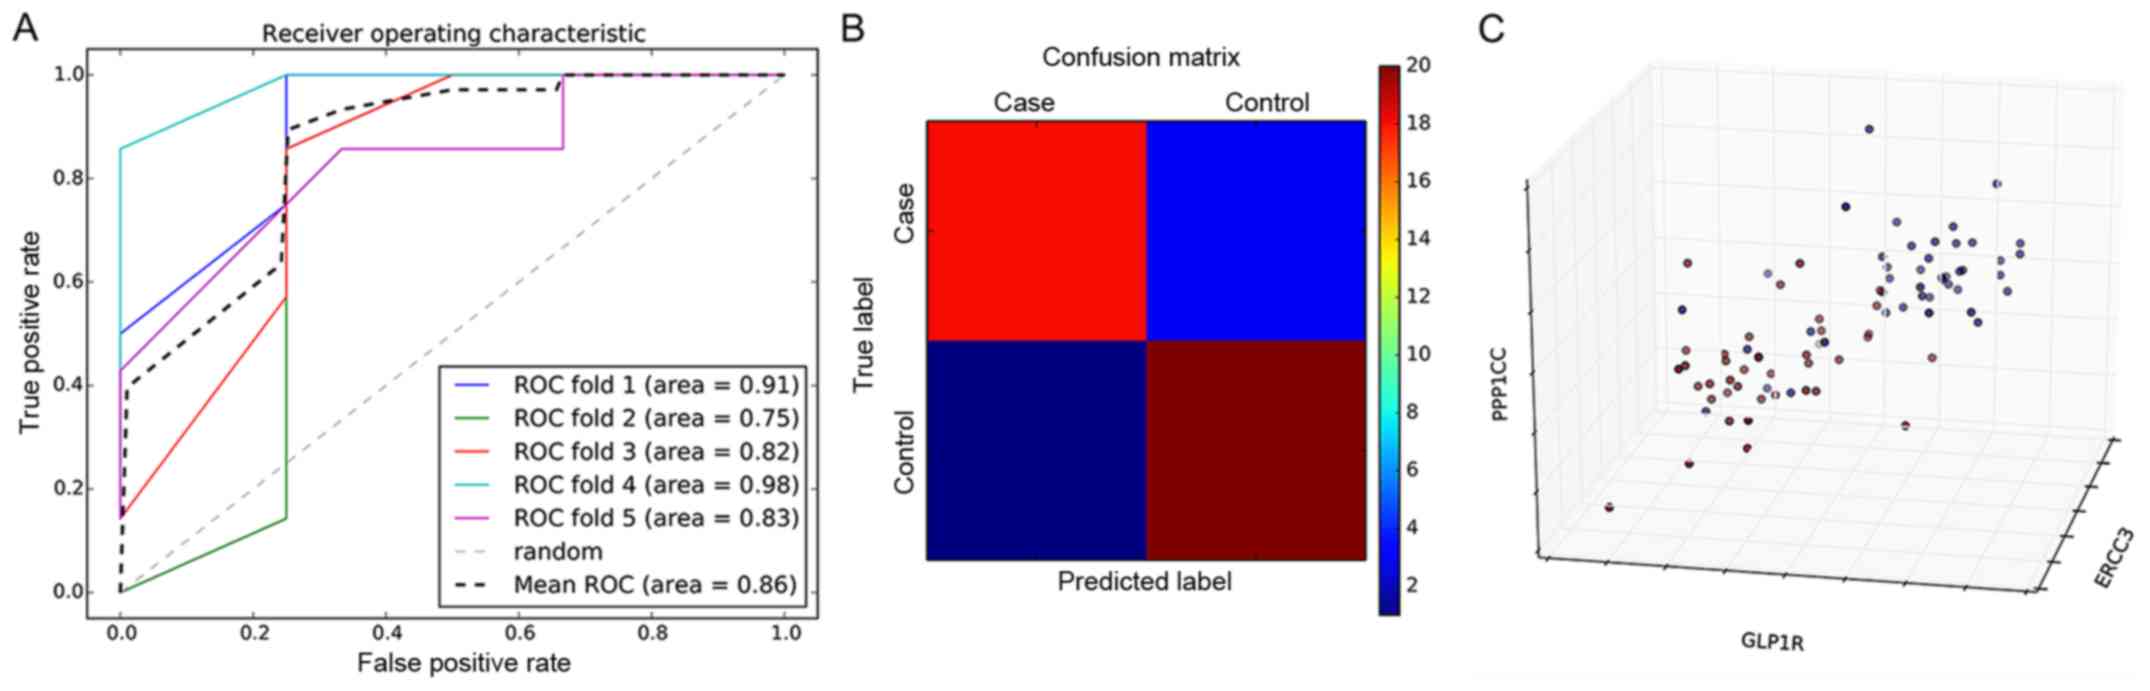
Classification model constructed using
candidate genes
A total of 15 genes obtained from the feature
selection in this study were used as salient features to construct
a classification model based on the SVM classifier (Fig. 5A). The five-fold cross-validation
fit the average area under the curve (AUC) value of 0.86, which
further indicated that the average prediction accuracy of the model
was 86%. To compare the accuracy of the SVM classification model in
predicting patients that are high-risk for MI compared with healthy
controls in greater detail, a confusion matrix was used for
visualization (Fig. 5B). The
prediction accuracies of the confusion matrix were 88 and 90% for
the MI group and control group, respectively. The 3D distribution
analysis of prominent features in the MI group and control group is
shown in Fig. 5C. Significant
differences were evident in the distribution between the two groups
of samples. PPP1CC, GLP1R and ERCC3 were the first three genes of
significance and were selected as the coordinate axis.
Consequently, this indicated that the SVM model constructed in the
present study by the MI specific biomarkers could be used to
predict those at high risk of MI.
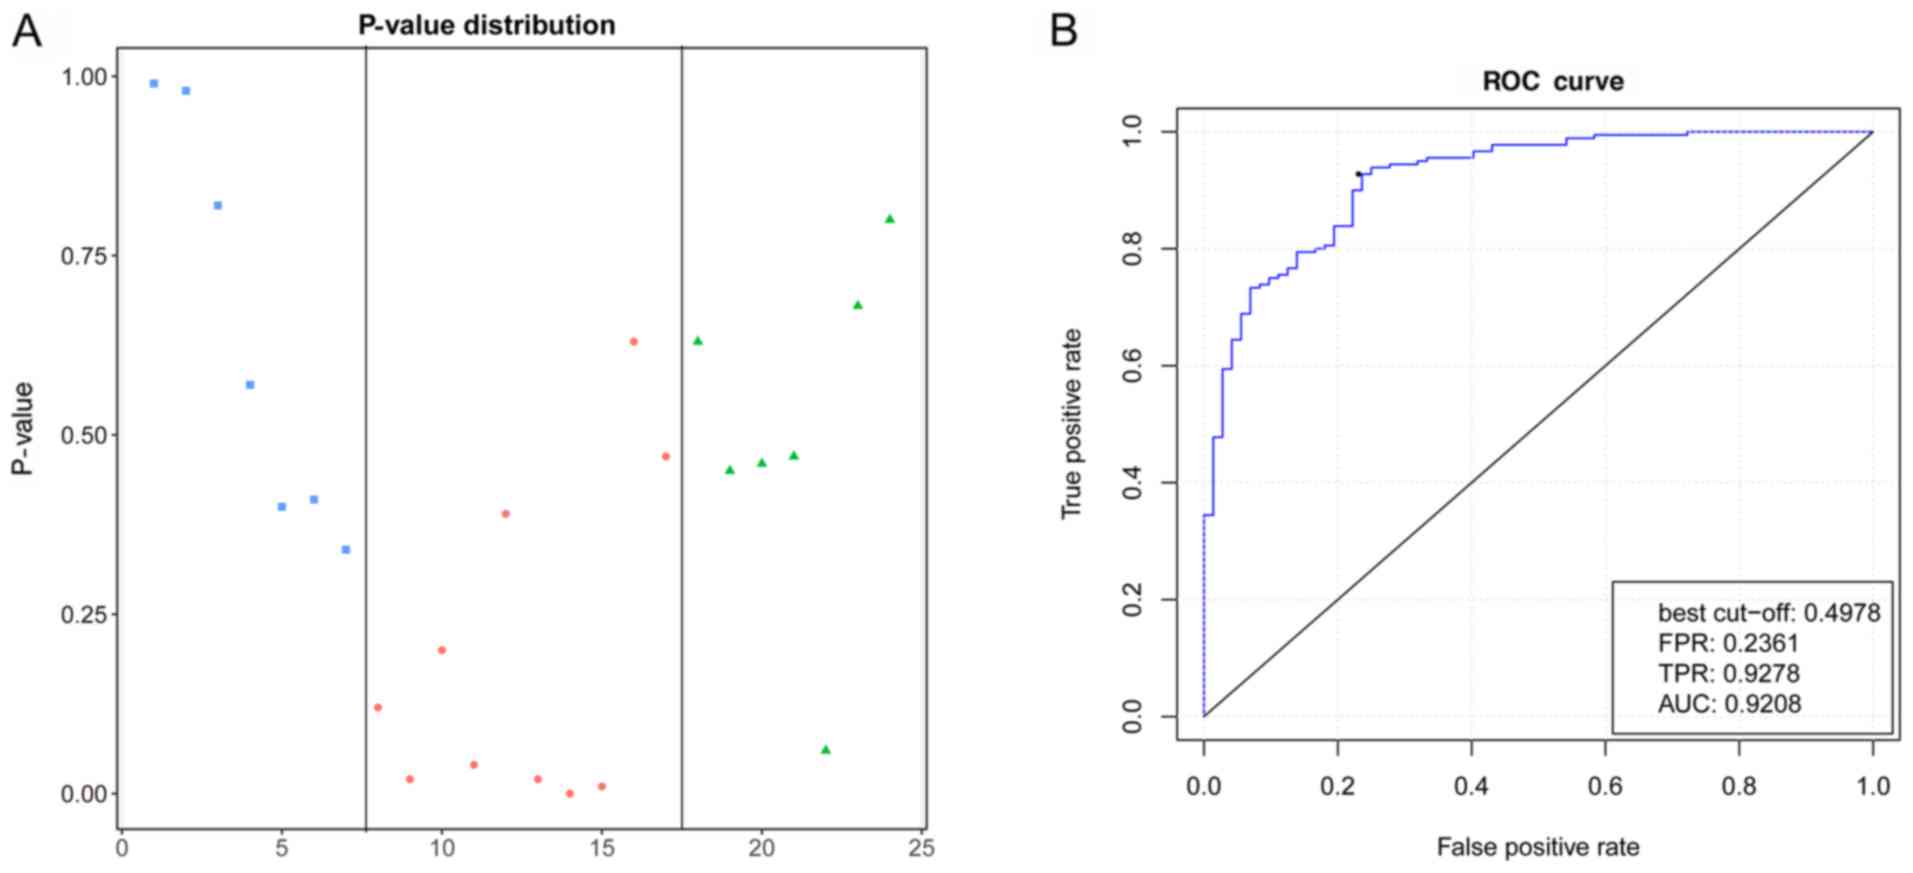
Data validation
The validation of independent data was performed
using the GSE61144 dataset obtained from the GEO database. The
P-value distribution indicated that the P-values of pre-(average
0.64) and post-PCI (average 0.51) were higher compared with the
control samples (average 0.19), which indicated that the model
could distinguish patients with MI from normal individuals.
Meanwhile, the average P-value of pre-PCI was higher compared with
post-PCI samples indicated that PCI treatment could alleviate the
progression of MI (Fig. 6A).
Moreover, the validation samples were divided into a control group
and patients with MI group. The ROC curve analysis of validation
data showed that the accuracy of the AUC value calculated using the
predicted results of the model was 0.92, which proved that this
accurately predicted MI (Fig.
6B).
Discussion
MI is a disease with high mortality and mobility
worldwide (28). A family history
of MI is an important risk factor for MI, and so far, numerous
studies have sought to identify genetic factors associated with MI
(6,29,30).
In the present study, in order to identify the MI-associated risk
genes, a total of 1,207 DEGs were explored between two groups from
the GSE34198 dataset, followed by a PPI network construction (1,083
genes and 46,363 edges). A total of 87 candidate genes were
identified by evaluating these genes using NS score. The 87 genes
were mainly enriched in functions such as ‘G-protein coupled
receptor signaling’ and pathways including ‘focal adhesion’.
Furthermore, an RFE algorithm was used to screen out 15 genes with
the highest prediction accuracy, which were further used to
construct a prediction model based on SVM. Finally, a microarray
dataset GSE61144 was used to verify that the accuracy of the model
was 0.92.
AKAP12 is a member of the AKAP family, and serves an
essential role in the morphogenesis of muscles (31). Members of the AKAP family
participate in various biological functions associated with the
heart, such as heart potassium channel phosphorylation (32) and cardiac muscle contraction
(33). AKAP12 also enhances
β2-adrenoceptor sensitivity in tracheal smooth muscle (34). In an animal model, a previous study
revealed that AKAP12 regulated by heat shock protein A12B
participates in ventricular dysfunction during the progression of
MI (35). The biological function
of AKAP12 is commonly realized by its participation in the
G-protein coupled receptor pathway (36). G-protein coupled genes (such as
P2RY2) have been shown to play an important role in the progression
of atherosclerosis, which can lead to the development of MI
(37). The variation of
endothelial G-protein coupled receptor pathways in arteries
contributes to compensated left ventricular hypertrophy (38). OR8D2 belongs to a subfamily of
olfactory receptor genes (39).
Aisenberg et al (40)
showed that the OR family of genes participates in the biological
function of airway smooth muscle and belongs to the superfamily of
G-protein coupled receptors. A close relationship between the OR
family and G-protein coupled receptors has previously been
described (41). In the current
study, genes including AKAP12 and OR8D2 were revealed as DEGs
between patients with MI and healthy individuals, and thus were
selected as candidate genes for MI prediction. Importantly, GO-BP
function enrichment analysis showed that AKAP12 and OR8D2 were both
associated with ‘G-protein coupled receptor signaling’. Thus, it
was hypothesized that AKAP12 and OR8D2 might participate in the
progression of MI via ‘G-protein coupled receptor signaling’.
The VEGF gene encodes a potent and selective
angiogenic agent that is required for mesangial cell migration and
survival (42). Endogenous VEGFA
is responsible for mitogenic effects of macrophage chemoattractant
protein-1 on vascular smooth muscle cells (43). The upregulation of VEGFA is
associated with the progression of MI (44). Gene transfer of
VEGF-A165 after MI affects angiogenic and cardiac
functions (45). Drugs such as
Danshen, improve damaged cardiac angiogenesis and cardiac function
induced by MI by modulating the VEGFA-related signaling pathway
(46). Another previous drug
experiment using an animal model indicated that puerarin
accelerates cardiac angiogenesis and improves cardiac function of
MI by upregulating VEGFA (47).
SVM is a machine learning method developed on the basis of
statistical learning theory. SVA uses the training error as the
constraint condition of the optimization problem, and the minimum
of the confidence range value as the optimization goal. SVM is the
realization of a structural risk minimization principle (48). Furthermore, SVM was reported to
contribute to the detection of an acute MI from a serial
electrocardiogram (10).
Autoregressive coefficients were demonstrated as being useful to
characterize the feature of atrial fibrillation, and this feature
could be classified using different statistical classifiers such as
kernel SVM (49). Based on SVM,
the automated risk identification of MI was realized based on
certain features, which included the relative frequency band
coefficient (50). In the present
study, VEGFA was explored as a DEG and was revealed as a candidate
gene for MI prediction. Importantly, the early diagnosis model of
SVM constructed using 15 candidate genes, including VEGFA, could be
used to predict patients at a high risk for MI.
Thus, it is proposed that the early diagnosis model
of SVM can not only predict early MI, but also indicate the
probability of risk according to the severity of MI. Genes
including VEGFA might be novel candidate risk genes for MI
prediction. Furthermore, AKAP12 and OR8D2 may participate in the
progression of MI via G-protein coupled receptor signaling.
The present study has several limitations. More
factors that may affect the accuracy of the prediction model need
to be screened to determine the diagnostic efficacy of these
biomarkers. It is also necessary to confirm whether the patient has
received relevant treatment, such as nitroglycerin injection,
before taking blood samples and whether the patient has other
cardiovascular diseases. In addition, these results require
validation in a larger cohort of patients with MI. In the future, a
prospective study is required to validate the diagnostic potential
of these biomarkers. Combining biomarkers with other diagnostic
methods is also a worthwhile venture.
Acknowledgements
Not applicable.
Funding
No funding was received.
Availability of data and materials
The datasets used and/or analyzed during the current
study are available from the corresponding author on reasonable
request.
Authors' contributions
Conception and design of the research: HZF.
Acquisition of data: DLH and QL. Analysis and interpretation of
data: HF and ST. Statistical analysis: HF. Drafting the manuscript:
HF. Revision of manuscript for important intellectual content: ST.
All authors read and approved the final manuscript.
Ethics approval and consent to
participate
Not applicable.
Patient consent for publication
Not applicable.
Competing interests
The authors declare that they have no competing
interests.
References
|
1
|
de Cordova PB, Johansen ML, Riman KA and
Rogowski J: Public reporting of cardiac outcomes for patients with
acute myocardial infarction: A systematic review of the evidence. J
Cardiovasc Nurs. 34:115–123. 2019. View Article : Google Scholar : PubMed/NCBI
|
|
2
|
Halim MHA, Yusoff YS and Yusuf MM: A
review on myocardial infarction and stroke risk factors in selected
countries in Asia. Adv Sci Lett. 23:4429–4433. 2017. View Article : Google Scholar
|
|
3
|
Johansson S, Rosengren A, Young K and
Jennings E: Mortality and morbidity trends after the first year in
survivors of acute myocardial infarction: A systematic review. BMC
Cardiovasc Disord. 17:532017. View Article : Google Scholar : PubMed/NCBI
|
|
4
|
Yamada Y, Izawa H, Ichihara S, Takatsu F,
Ishihara H, Hirayama H, Sone T, Tanaka M and Yokota M: Prediction
of the risk of myocardial infarction from polymorphisms in
candidate genes. N Engl J Med. 347:1916–1923. 2002. View Article : Google Scholar : PubMed/NCBI
|
|
5
|
Yamada Y, Kato K, Oguri M, Fujimaki T,
Yokoi K, Matsuo H, Watanabe S, Metoki N, Yoshida H, Satoh K, et al:
Genetic risk for myocardial infarction determined by polymorphisms
of candidate genes in a Japanese population. J Med Genet.
45:216–221. 2008. View Article : Google Scholar : PubMed/NCBI
|
|
6
|
Kakko S, Elo T, Tapanainen JM, Huikuri HV
and Savolainen MJ: Polymorphisms of genes affecting thrombosis and
risk of myocardial infarction. Eur J Clin Invest. 32:643–648. 2002.
View Article : Google Scholar : PubMed/NCBI
|
|
7
|
Bis JC, Heckbert SR, Smith NL, Reiner AP,
Rice K, Lumley T, Hindorff LA, Marciante KD, Enquobahrie DA, Monks
SA and Psaty BM: Variation in inflammation-related genes and risk
of incident nonfatal myocardial infarction or ischemic stroke.
Atherosclerosis. 198:166–173. 2008. View Article : Google Scholar : PubMed/NCBI
|
|
8
|
Aparicio JP and Castillo-Chavez C:
Mathematical modelling of tuberculosis epidemics. Math Biosci Eng.
6:209–237. 2009. View Article : Google Scholar : PubMed/NCBI
|
|
9
|
Chang CY, Chen SJ and Tsai MF: Application
of support-vector-machine-based method for feature selection and
classification of thyroid nodules in ultrasound images. Pattern
Recognition. 43:3494–3506. 2010. View Article : Google Scholar
|
|
10
|
Dhawan A, Wenzel B, George S, Gussak I,
Bojovic B and Panescu D: Detection of acute myocardial infarction
from serial ECG using multilayer support vector machine. Conf Proc
IEEE Eng Med Biol Soc. 2012:2704–2707. 2012.PubMed/NCBI
|
|
11
|
Güldoğan E, Yağmur J, Yoloğlu S, Asyalı MH
and Çolak C: Myocardial infarction classification with support
vector machine models. J Turgut Ozal Med Cent. 22:221–224. 2015.
View Article : Google Scholar
|
|
12
|
Valenta Z, Mazura I, Kolár M, Grünfeldová
H, Feglarová P, Peleška J, Tomecková M, Kalina J, Slovák D and
Zvárová J: Determinants of excess genetic risk of acute myocardial
infarction-a matched case-control study. Eur J Biomed Inf.
8:102012.
|
|
13
|
Team RC: ‘R: A language and environment
for statistical computing.’. 201:2013.
|
|
14
|
Cheadle C, Vawter MP, Freed WJ and Becker
KG: Analysis of microarray data using Z score transformation. J Mol
Diagn. 5:73–81. 2003. View Article : Google Scholar : PubMed/NCBI
|
|
15
|
Keshava Prasad TS, Goel R, Kandasamy K,
Keerthikumar S, Kumar S, Mathivanan S, Telikicherla D, Raju R,
Shafreen B, Venugopal A, et al: Human protein reference
database-2009 update. Nucleic Acids Res. 37:D767–D772. 2009.
View Article : Google Scholar : PubMed/NCBI
|
|
16
|
Lei X, Wu S, Ge L and Zhang A: Clustering
and overlapping modules detection in PPI network based on IBFO.
Proteomics. 13:278–290. 2013. View Article : Google Scholar : PubMed/NCBI
|
|
17
|
Shannon P, Markiel A, Ozier O, Baliga NS,
Wang JT, Ramage D, Amin N, Schwikowski B and Ideker T: Cytoscape: A
software environment for integrated models of biomolecular
interaction networks. Genome Res. 13:2498–2504. 2003. View Article : Google Scholar : PubMed/NCBI
|
|
18
|
Duncan DT, Aldstadt J, Whalen J, Melly SJ
and Gortmaker SL: Validation of walk score for estimating
neighborhood walkability: An analysis of four US metropolitan
areas. Int J Environ Res Public Health. 8:4160–4179. 2011.
View Article : Google Scholar : PubMed/NCBI
|
|
19
|
Huang da W, Sherman BT and Lempicki RA:
Systematic and integrative analysis of large gene lists using DAVID
bioinformatics resources. Nat Protoc. 4:44–57. 2008. View Article : Google Scholar
|
|
20
|
Ashburner M, Ball CA, Blake JA, Botstein
D, Butler H, Cherry JM, Davis AP, Dolinski K, Dwight SS, Eppig JT,
et al: Gene Ontology: Tool for the unification of biology. The gene
ontology consortium. Nat Genet. 25:25–29. 2000. View Article : Google Scholar : PubMed/NCBI
|
|
21
|
Kanehisa M and Goto S: KEGG: Kyoto
encyclopedia of genes and genomes. Nucleic Acids Res. 28:27–30.
2000. View Article : Google Scholar : PubMed/NCBI
|
|
22
|
Salim D: Fisher exact test. Evid Base
Obstet Gynecol. 4:3–4. 2002. View Article : Google Scholar
|
|
23
|
De Martino F, Valente G, Staeren N,
Ashburner J, Goebel R and Formisano E: Combining multivariate voxel
selection and support vector machines for mapping and
classification of fMRI spatial patterns. Neuroimage. 43:44–58.
2008. View Article : Google Scholar : PubMed/NCBI
|
|
24
|
Visa S, Ramsay B, Ralescu A and van der
Knaap E: Confusion matrix-based feature selection. Proceedings of
the 22nd Midwest Artificial Intelligence and Cognitive Science
Conference (Cincinnati, OH). 120–127. 2011.
|
|
25
|
Wang Q and Liu X: Screening of feature
genes in distinguishing different types of breast cancer using
support vector machine. Onco Targets Ther. 8:2311–2317.
2015.PubMed/NCBI
|
|
26
|
Lu X and Chen D: Cancer classification
through filtering progressive transductive support vector machine
based on gene expression data. AIP Conf Proc. 1864:0201012017.
View Article : Google Scholar
|
|
27
|
Park HJ, Noh JH, Eun JW, Koh YS, Seo SM,
Park WS, Lee JY, Chang K, Seung KB, Kim PJ and Nam SW: Assessment
and diagnostic relevance of novel serum biomarkers for early
decision of ST-elevation myocardial infarction. Oncotarget.
6:12970–12983. 2015. View Article : Google Scholar : PubMed/NCBI
|
|
28
|
Sørensen MV, Pedersen S, Møgelvang R,
Skov-Jensen J and Flyvbjerg A: Plasma high-mobility group box 1
levels predict mortality after ST-segment elevation myocardial
infarction. JACC Cardiovasc Interv. 4:281–286. 2011. View Article : Google Scholar : PubMed/NCBI
|
|
29
|
Helgadottir A, Manolescu A, Thorleifsson
G, Gretarsdottir S, Jonsdottir H, Thorsteinsdottir U, Samani NJ,
Gudmundsson G, Grant SF, Thorgeirsson G, et al: The gene encoding
5-lipoxygenase activating protein confers risk of myocardial
infarction and stroke. Nat Genet. 36:233–239. 2004. View Article : Google Scholar : PubMed/NCBI
|
|
30
|
Do R, Stitziel NO, Won HH, Jørgensen AB,
Duga S, Merlini PA, Kiezun A, Farrall M, Goel A, Zuk O, et al:
Multiple rare alleles at LDLR and APOA5 confer risk for early-onset
myocardial infarction. Nature. 518:102–106. 2015. View Article : Google Scholar : PubMed/NCBI
|
|
31
|
Kim HH, Kim JG, Jeong J, Han SY and Kim
KW: Akap12 is essential for the morphogenesis of muscles involved
in zebrafish locomotion. Differentiation. 88:106–116. 2014.
View Article : Google Scholar : PubMed/NCBI
|
|
32
|
Kurokawa J, Motoike HK, Rao J and Kass RS:
Regulatory actions of the A-kinase anchoring protein Yotiao on a
heart potassium channel downstream of PKA phosphorylation. Proc
Natl Acad Sci USA. 101:16374–16378. 2004. View Article : Google Scholar : PubMed/NCBI
|
|
33
|
Ruehr ML, Russell MA and Bond M: A-kinase
anchoring protein targeting of protein kinase A in the heart. J Mol
Cell Cardiol. 37:653–665. 2004. View Article : Google Scholar : PubMed/NCBI
|
|
34
|
Schmidt M, Poppinga WJ, Elzinga C, Meurs H
and Maarsingh H: Scaffolding protein A-kinase anchoring protein 12
enhances β2-adrenoceptor sensitivity in tracheal smooth muscle. Am
J Respir Crit Care Med. 193:A24682016.
|
|
35
|
Selvaraju V, Suresh SC, Thirunavukkarasu
M, Mannu J, Foye JLC, Mathur PP, Palesty JA, Sanchez JA, McFadden
DW and Maulik N: Regulation of A-kinase-anchoring protein 12 by
heat shock protein A12B to prevent ventricular dysfunction
following acute myocardial infarction in diabetic rats. J
Cardiovasc Transl Res. 10:209–220. 2017. View Article : Google Scholar : PubMed/NCBI
|
|
36
|
Tao J and Malbon CC: G-protein-coupled
receptor-associated A-kinase anchoring proteins AKAP5 and AKAP12:
Differential signaling to MAPK and GPCR recycling. J Mol Signal.
3:192008. View Article : Google Scholar : PubMed/NCBI
|
|
37
|
Wang ZX, Nakayama T, Sato N, Izumi Y,
Kasamaki Y, Ohta M, Soma M, Aoi N, Matsumoto K, Ozawa Y, et al:
Association of the purinergic receptor P2Y, G-protein coupled, 2
(P2RY2) gene with myocardial infarction in Japanese men. Circ J.
73:2322–2329. 2009. View Article : Google Scholar : PubMed/NCBI
|
|
38
|
Aubin MC, Gendron ME, Lebel V, Thorin E,
Tardif JC, Carrier M and Perrault LP: Alterations in the
endothelial G-protein coupled receptor pathway in epicardial
arteries and subendocardial arterioles in compensated left
ventricular hypertrophy. Basic Res Cardiol. 102:144–153. 2007.
View Article : Google Scholar : PubMed/NCBI
|
|
39
|
Zhang X and Firestein S: The olfactory
receptor gene superfamily of the mouse. Nat Neurosci. 5:124–133.
2002. View Article : Google Scholar : PubMed/NCBI
|
|
40
|
Aisenberg WH, Huang J, Zhu W, Rajkumar P,
Cruz R, Santhanam L, Natarajan N, Yong HM, De Santiago B, Oh JJ, et
al: Defining an olfactory receptor function in airway smooth muscle
cells. Sci Rep. 6:382312016. View Article : Google Scholar : PubMed/NCBI
|
|
41
|
Parmentier M, Libert F, Schurmans S,
Schiffmann S, Lefort A, Eggerickx D, Ledent C, Mollereau C, Gérard
C, Perret J, et al: Expression of members of the putative olfactory
receptor gene family in mammalian germ cells. Nature. 355:453–455.
1992. View
Article : Google Scholar : PubMed/NCBI
|
|
42
|
Eremina V, Cui S, Gerber H, Ferrara N,
Haigh J, Nagy A, Ema M, Rossant J, Jothy S, Miner JH and Quaggin
SE: Vascular endothelial growth factor a signaling in the
podocyte-endothelial compartment is required for mesangial cell
migration and survival. J Am Soc Nephrol. 17:724–735. 2006.
View Article : Google Scholar : PubMed/NCBI
|
|
43
|
Parenti A, Bellik L, Brogelli L, Filippi S
and Ledda F: Endogenous VEGF-A is responsible for mitogenic effects
of MCP-1 on vascular smooth muscle cells. Am J Physiol Heart Circ
Physiol. 286:H1978–H1984. 2004. View Article : Google Scholar : PubMed/NCBI
|
|
44
|
Kranz A, Rau C, Kochs M and Waltenberger
J: Elevation of vascular endothelial growth factor-A serum levels
following acute myocardial infarction. Evidence for its origin and
functional significance. J Mol Cell Cardiol. 32:65–72. 2000.
View Article : Google Scholar : PubMed/NCBI
|
|
45
|
Hao X, Månsson-Broberg A, Blomberg P,
Dellgren G, Siddiqui AJ, Grinnemo KH, Wärdell E and Sylvén C:
Angiogenic and cardiac functional effects of dual gene transfer of
VEGF-A165 and PDGF-BB after myocardial infarction. Biochem Biophys
Res Commun. 322:292–296. 2004. View Article : Google Scholar : PubMed/NCBI
|
|
46
|
Ai F, Chen M, Li W, Yang Y, Xu G, Gui F,
Liu Z, Bai X and Chen Z: Danshen improves damaged cardiac
angiogenesis and cardiac function induced by myocardial infarction
by modulating HIF1α/VEGFA signaling pathway. Int J Clin Exp Med.
8:18311–18318. 2015.PubMed/NCBI
|
|
47
|
Ai F, Chen M, Yu B, Yang Y, Xu G, Gui F,
Liu Z, Bai X and Chen Z: Puerarin accelerate scardiac angiogenesis
and improves cardiac function of myocardial infarction by
upregulating VEGFA, Ang-1 and Ang-2 in rats. Int J Clin Exp Med.
8:20821–20828. 2015.PubMed/NCBI
|
|
48
|
Qian CH, Qiang HQ and Gong SR: An image
classification algorithm based on SVM. Appl Mech Mater 738–739.
542–545. 2015. View Article : Google Scholar
|
|
49
|
Padmavathi K and Krishna KSR: Myocardial
infarction detection using magnitude squared coherence and support
vector machine. International Conference on Medical Imaging. IEEE.
382–385. 2014.
|
|
50
|
Bakul G and Tiwary US: Automated risk
identification of myocardial infarction using relative frequency
band coefficient (RFBC) features from ECG. Open Biomed Eng J.
4:217–222. 2010. View Article : Google Scholar : PubMed/NCBI
|