Introduction
Thyroid cancer (TC) is a frequently occurring
malignant tumor with steadily increasing incidence (1–5). In
2018, the American Cancer Society predicted that there would be
53,990 newly diagnosed patients with TC that year (6). Based on histopathological
examination, TC is divided into 4 subtypes: Anaplastic thyroid
carcinoma, papillary thyroid carcinoma, medullary thyroid cancer
and follicular thyroid cancer (7–9).
Different hypotypes of TC lead to various clinical outcomes. A
number of studies have reported that intricate biological processes
participating in the interactions between polygenes may contribute
to the occurrence and progression of TC (10–12).
Previous studies have suggested that hsa-miR-200a-5p and
hsa-miR-181a-2-3p could be applied for latent diagnostic and
prognostic biomarkers of TC (13,14).
Nevertheless, the clinical characteristics of molecular profiles in
TC have yet to be elucidated. Therefore, to further understand the
molecular mechanisms of TC, an multi-method study may offer novel
insight for TC prevention and treatment (15).
MicroRNAs (miRNAs/miRs) contain ~19–25 nucleotides
and are endogenous non-coding RNAs with gene-regulating functions
(16–19). miRNAs are critical in the
biological processes of diversified human carcinomas. For instance,
they participate in extensive biological actions, including cell
proliferation, invasion and apoptosis (18,20–23).
Previous studies have demonstrated that miR-193a-3p is a neoplasm
suppressor in various carcinomas, including hepatocellular cancer
(24), gastric cancer (25,26),
lung carcinoma (27), breast
carcinoma (28) and colorectal
carcinoma (29,30). To the best of the authors'
knowledge, thus far only one study has investigated the association
between miR-193a-3p and medullary thyroid carcinoma (31); however, a limitation of this study
was the small sample size, which prevented a comprehensive
description and analysis of TC. To further comprehend the potential
molecular mechanisms, it is necessary to examine miR-193a-3p
expression in TC using a larger volume of data.
Cyclin D1 (CCND1), a member of the highly conserved
cyclin family, can function as a modulator of cyclin-dependent
kinase (CDK)4 or CDK6, and has an important role in adjusting the
progression of the cell cycle (32,33).
Previous studies revealed that CCND1 has a crucial role in
promoting proliferation, migration and tumor metastasis (34,35)
in cancers such as lung cancer (33), gastric cancer (36) and renal cell cancer (37). CCND1 has been reported to exhibit a
high expression in TC tissues and to be associated with invasive
behavior (38).
The present study examined TC specimen information
from The Cancer Genome Atlas (TCGA) to assess the expression levels
of miR-193a-3p and CCND1, and their association with clinical
parameters. The data of miR-193a-3p and CCND1 were extracted and
validated via ArrayExpress databases and the Gene Expression
Omnibus (GEO). Then, the candidate target genes of miR-193a-3p were
identified using miRWalk 3.0 and overlapped with the upregulated
genes in TC identified using TCGA database. The miR-193a-3p
candidate target genes were further investigated using Gene
Ontology (GO), Kyoto Encyclopedia of Genes and Genomes (KEGG)
pathway analysis and protein-protein interaction (PPI) network
enrichment analyses. According to the bioinformatics analysis of
the present study, a hub gene was found in TC, and the targeting
regulatory relations between the hub gene and miR-193a-3p were
confirmed by a dual luciferase assay. By performing a meta-analysis
and bioinformatics analysis, the present study revealed the latent
molecular mechanisms of miR-193a-3p, as well as its associations
with the identified hub gene, which may lead to TC.
Materials and methods
miR-193a-3p expression in TC from
public databases and the literature
TCGA is a pool of molecular datasets for at least 30
types of cancers, including TC (39). The present study explored TCGA to
determine miR-193a-3p expression in TC tissues. miRNA expression
data of 510 TC and 59 normal samples were acquired, along with the
accompanying clinical information, from TCGA, up to December 1,
2018 (40). Chip datasets
(GSE40807, GSE62054 and GSE73182) from GEO were also searched to
examine the profiling of miR-193a-3p expression in TC (41–43).
The following keywords were used: (papillary OR medullary OR
follicular OR anaplastic OR thyroid) AND (carcinoma OR cancer OR
adenocarcinoma OR tumor OR neoplas* OR malignan*) AND (microRNA OR
miR OR miRNA), where ‘*’ refers to a wildcard search. The public
database of microarray gene expression, ArrayExpress (E-MTAB-736)
(44) was also used. In addition,
literature that included miR-193a-3p expression in TC was searched
for in 13 online databases: Wiley Online Library (https://onlinelibrary.wiley.com), Ovid
(https://www.ovid.com), LILACS (https://lilacs.bvsalud.org), Web of Science
(http://www.isiknowledge.com), PubMed
(https://www.ncbi.nlm.nih.gov/pubmed),
Science Direct (https://www.sciencedirect.com), Cochrane Central
Register of Controlled Trials (https://www.cochranelibrary.com), EMBASE (https://www.embase.com), Google Scholar (https://scholar.google.com), Chong Qing VIP
(http://lib.cqvip.com), Wan Fang (http://www.wanfangdata.com), Chinese CNKI (https://www.cnki.net) and the China Biology Medicine
Disc (http://www.sinomed.ac.cn). The studies
needed to meet the following requirements for inclusion: i) The
miR-193a-3p expression data in TC could be tested in humans; and
ii) the relevant information of miR-193a-3p could be abstracted
from the literature. All expression data and clinical information
connected to miR-193a-3p were extracted.
Comprehensive statistical analysis of
TCGA, GEO, ArrayExpress and the literature
The expression levels of both TC and non-cancerous
samples were visualized using scatter diagrams and receiver
operating characteristic (ROC) curves created using GraphPad Prism
6.0 (GraphPad Software, Inc.). Student's t-test was performed to
compare the expression of TC and non-cancer samples, as well as the
association between clinicopathological parameters and miR-193a-3p
from TCGA database. One-way analysis of variance was used for three
or more groups. All miR-193a-3p expression data abstracted from
various databases were normalized to log2, and P<0.05 was
considered to indicate a statistically significant difference. An
all-sided analysis was performed by employing STATA 12.0 software
(StataCorp LLC). The pooled standard mean difference (SMD) was
applied to evaluate miR-193a-3p expression. χ2 and
I2 tests were computed to assess the heterogeneity
within the meta-analysis. The Mantel-Haenszel fixed-effects model
was selected if there was no prominent heterogeneity
(I2<50%). Otherwise, a random-effects model was
applied (I2>50%) (45); meanwhile, heterogeneity analysis
was performed to discover the sources of heterogeneity.
Subsequently, a summary (s)ROC was created to indicate the ability
of miR-193a-3p to identify TC compared with a normal sample
(46–48).
Prediction of miR-193a-3p candidate
target genes and their molecular functions
To further search for the latent molecular functions
of miR-193a-3p in TC, bioinformatics analysis was performed. First,
the target genes of miR-193a-3p were predicted using 12 platforms
[miRWalk 2.0 (version 2; http://zmf.umm.uni-heidelberg.de/apps/zmf/mirwalk2),
PITA (version 6; http://genie.weizmann.ac.il/pubs/mir07/mir07_exe.html),
PicTar2 (https://pictar.mdc-berlin.de),
RNAhybrid 2.1 (https://bibiserv.cebitec.uni-bielefeld.de/rnahybrid),
MicroT4 v4.0 (version 5; http://diana.imis.athena-innovation.gr), miRDB 4.0
(http://www.mirdb.org), miRanda-rel2010
(http://www.microrna.org/microrna/getDownloads.do),
TargetScan 7.2 (version 7.2; http://www.targetscan.org), RNA22 v2 (https://cm.
jefferson.edu/rna22-full-sets-of-predictions), miRBridge
(http://www.ncbi.nlm.nih.gov/pubmed/?term=20385095),
miRNAMap (ftp://mirnamap.mbc.nctu.edu.tw/miRNAMap2) and miRMap
(https://mirmap.ezlab.org)]. The predicted genes
exhibited in the 12 platforms were selected: 3,984 candidate target
genes. Log2 conversion and normalization was performed for the gene
chips and RNA sequencing from the GEO and TCGA databases.
Differentially expressed genes in microarrays and RNA sequencing
data were also screened out by the limma package (version 3.42.2)
of R language (R version 3.6.2; http://www.r-project.org) (49). Integration of differentially
expressed genes identified from gene chips and RNA sequencing was
conducted via RobustRankAggreg (version 1.1; https://cran.r-project.org/web/packages/RobustRankAggreg).
The overexpressed genes in TC from the TCGA and GEO databases were
calculated by selecting the following criteria: P-adj<0.05 and
any upregulated genes with a log2-fold change (FC)>1. The
candidate target genes obtained with the online prediction tools in
TCGA and GEO were then overlapped and presented as Venn diagrams
(50). Then, the overlapping
target genes were used to study molecular mechanisms via GO
(51), KEGG pathway (52), Disease Ontology (DO) (53) and PPI network analyses.
Bioinformatics analyses were implemented using clusterprofiler
package (version 3.10) of R language (54). The ggplot2 package (version 3.3.0)
from R language was utilized to visualize the results of the
functional analysis (55). STRING
11.0 (http://string.embl.de) was also used to
generate a PPI network, which revealed the connection among the
overlapping related genes (56).
Expression of CCND1 in TC samples from
the TCGA and GEO databases
The clinical value of CCND1, whose expression data
was extracted from GEO and TCGA, was further explored. CCND1
expression data and its clinical information were acquired from
TCGA. The GEO database was also mined to obtain chip datasets from
TC samples using the following keywords: (papillary OR medullary OR
follicular OR anaplastic OR thyroid) AND (carcinoma OR tumor OR
cancer OR adenocarcinoma OR neoplas* OR malignan*) AND (Cyclin D1
OR G1/S-Specific Cyclin-D1 OR PRAD1 Protein OR B-Cell CLL/Lymphoma
1 OR U21B31 OR BCL-1 Oncogene OR BCL1 OR PRAD1 Oncogene OR
Parathyroid Adenomatosis 1 OR D11S287E OR B-Cell Lymphoma 1
Protein). Filtering condition: Series [Entry type], Homo sapiens
[Organism]. A total of 13 datasets were obtained: GSE3678, GSE6004,
GSE6339, GSE9115, GSE27155, GSE29265, GSE33630, GSE35570, GSE50901,
GSE53072, GSE53157, GSE58689 and GSE65144 (57–67).
Statistical analysis of CCND1 was also performed. The methods used
were the same as those used above for evaluating the expression of
miR-193a-3p.
Cell culture and transfection
The 293 cell line was obtained from Huzhou Hippo
Biotechnology Co., Ltd. and cultured in DMEM (Gibco; Thermo Fisher
Scientific, Inc.) supplemented with 10% fetal bovine serum (Gibco;
Thermo Fisher Scientific, Inc.) and 1% penicillin/streptomycin.
Cells were cultured in an incubator at 37°C with 5% CO2.
miR-193a-3p mimic (5′-AACUGGCCUACAAAGUCCCAGU-3′), miR-146b-5p mimic
(5′-UGAGAACUGAAUUCCAUAGGCUG-3′) and mimic control
(5′-UUUGUACUACACAAAAGUACUG-3′) were synthesized and obtained from
Hippobio Co., Ltd. miR-193a-3p mimic, miR-146b-5p mimic and their
mimic control (all 75 pM) were transfected into 2.5×10⁵
293 cells/well using Lipofectamine® 3000 reagent
(Invitrogen; Thermo Fisher Scientific, Inc.), according to the
manufacturer's protocol. Transfection efficiency was measured by
reverse transcription-quantitative PCR (RT-qPCR) after 48 h.
RNA extraction and RT-qPCR
Cellular RNA was extracted from 293 cells with
TRIzol© reagent (Tiangen Biotech Co., Ltd.). RevertAid
Reverse Transcriptase (Invitrogen; Thermo Fisher Scientific, Inc.)
was used to reverse transcribe miRNA according to the
manufacturer's protocol. The expression of miR-193a-3p and
miR-146b-5p was performed by qPCR using PerfectStart Green qPCR
SuperMix (Transgen Biotech Co., Ltd.) on an ABI Q1 RT-qPCR System
(Applied Biosystems; Thermo Fisher Scientific, Inc.). U6 was used
as an internal reference. The relevant primer sequences were as
follows: miR-193a-3p forward, 5′-GCCGAGAACTGGCCTACAAA-3′ and
reverse, 5′-CTCAACTGGTGTCGTGGAGTCGGCAATTCAGTTGAGACTGGGAC-3′;
miR-146b-5p forward, 5′-GCCGAGTGAGAACTGAATTCC-3′ and reverse,
5′-CTCAACTGGTGTCGTGGAGTCGGCAATTCAGTTGAGCAGCCTAT-3′; U6 forward,
5′-CTCGCTTCGGCAGCACA-3′ and reverse, 5′-AACGCTTCACGAATTTGCGT-3′.
miR-193a-3p and miR-146b-5p expression levels were calculated by
the 2−∆∆Cq method (68).
Validation of the association between
miR-193a-3p and the hub gene
The protein with the most connections was selected
for further investigation. 293 cells exhibit a high transfection
efficiency and were thus selected for the luciferase activity
assay. The wild-type (Wt) CCND1-3′ untranslated region (UTR) and
seed region mutant (Mut) of the miR-193a-3p binding site were
subcloned into the pGL3 system (Promega Corporation). Its
corresponding positive control [Wt tumor necrosis factor
receptor-associated factor 6 (TRAF6)-3′ UTR + miR-146b-5p] was also
subcloned into the pGL3 system (69,70).
Subsequently, 1×10⁵ 293 cells/well were co-transfected
with 100 ng Wt CCND1-3′ UTR or Wt TRAF6-3′ UTR vector and 400 ng
miRNA mimic or negative control (NC) plasmid using X-tremeGENE™ HP
DNA transfection reagent [Roche Diagnostics (Shanghai) Co., Ltd.].
Then, 2 days following incubation, firefly luciferase activity was
assessed using a Dual-Luciferase Reporter assay system (Promega
Corporation) in accordance with the manufacturer's protocols.
Firefly luciferase activity was normalized to Renilla
luciferase activity. Student's t-test was used to compare mimics
and mimic control for each luciferase plasmid. Pearson's
correlation analysis was also conducted to analyze the relationship
between miR-193a-3p and CCND1, and P<0.05 was considered to
indicate a statistically significant difference. Hub gene
expression between the TC samples and the normal samples was
explored via immunohistochemistry using The Human Protein Atlas
(71).
Results
Downregulated miR-193a-3p expression
in TC and its clinical significance from TCGA
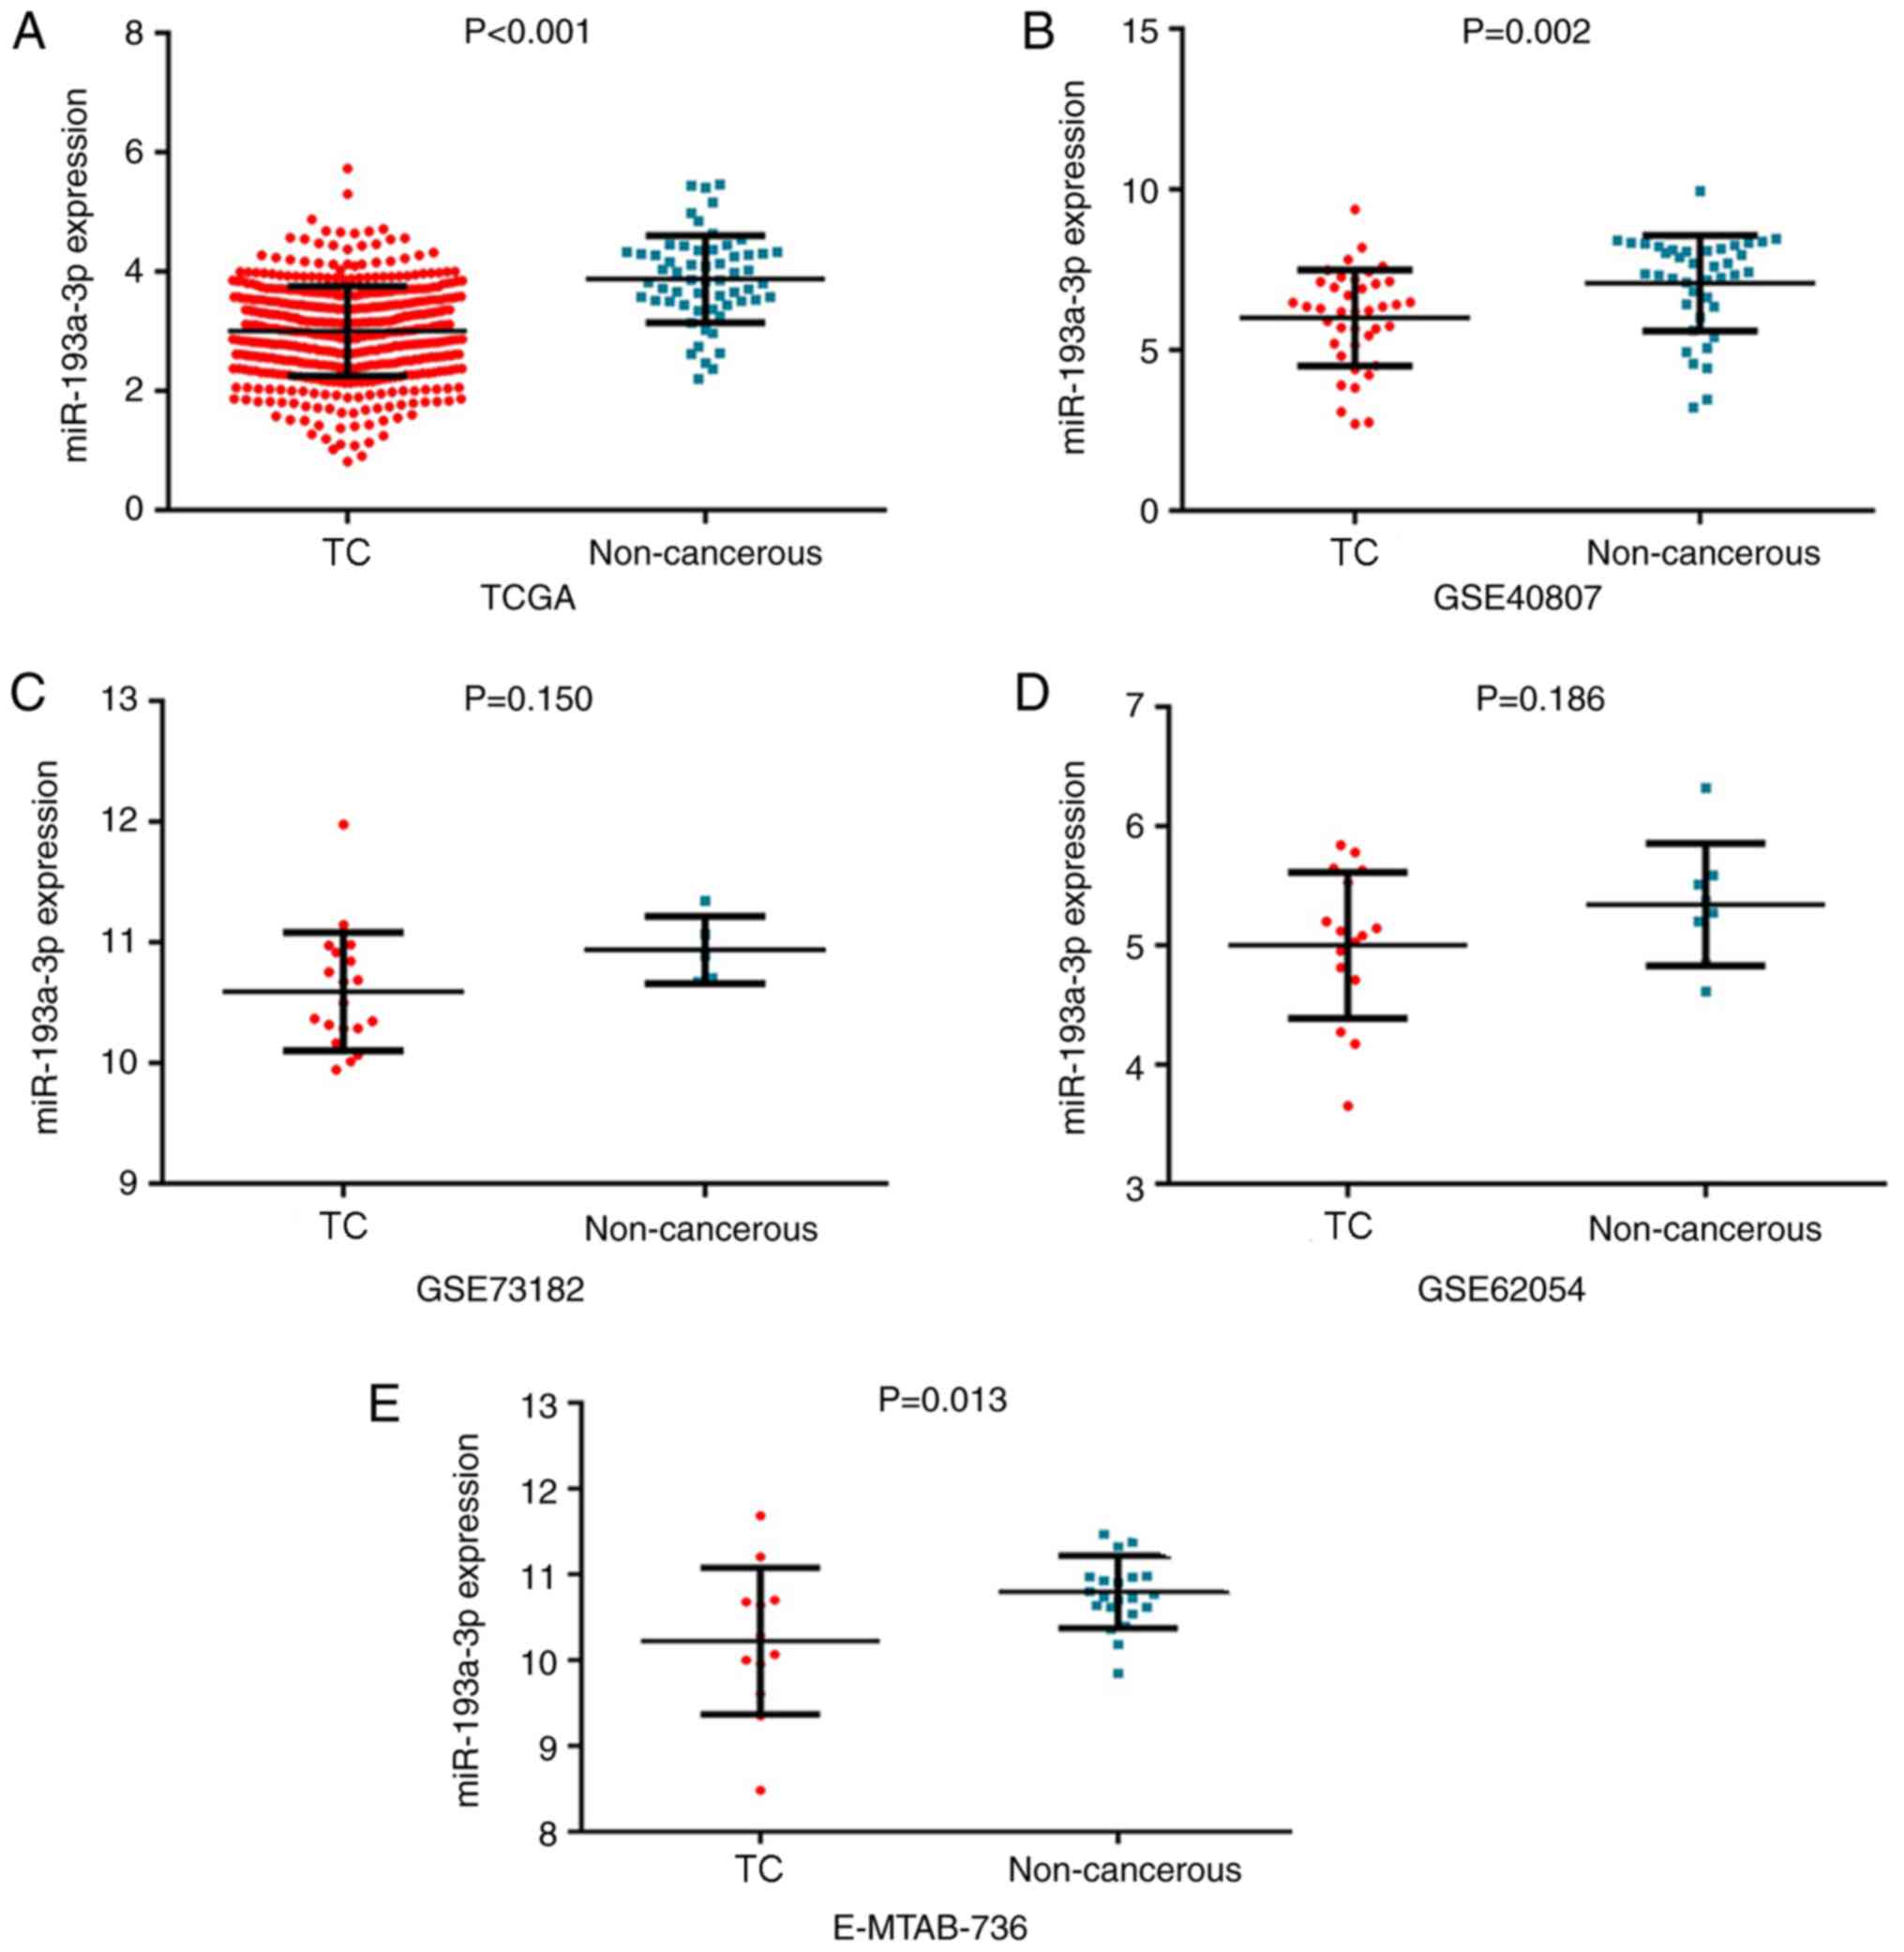
The expression of miR-193a-3p in the TC group was
3.00±0.75 and that in the non-cancerous group was 3.88±0.73.
miR-193a-3p exhibited significantly reduced expression in 510 TC
samples compared with in 59 non-cancer controls (P<0.001;
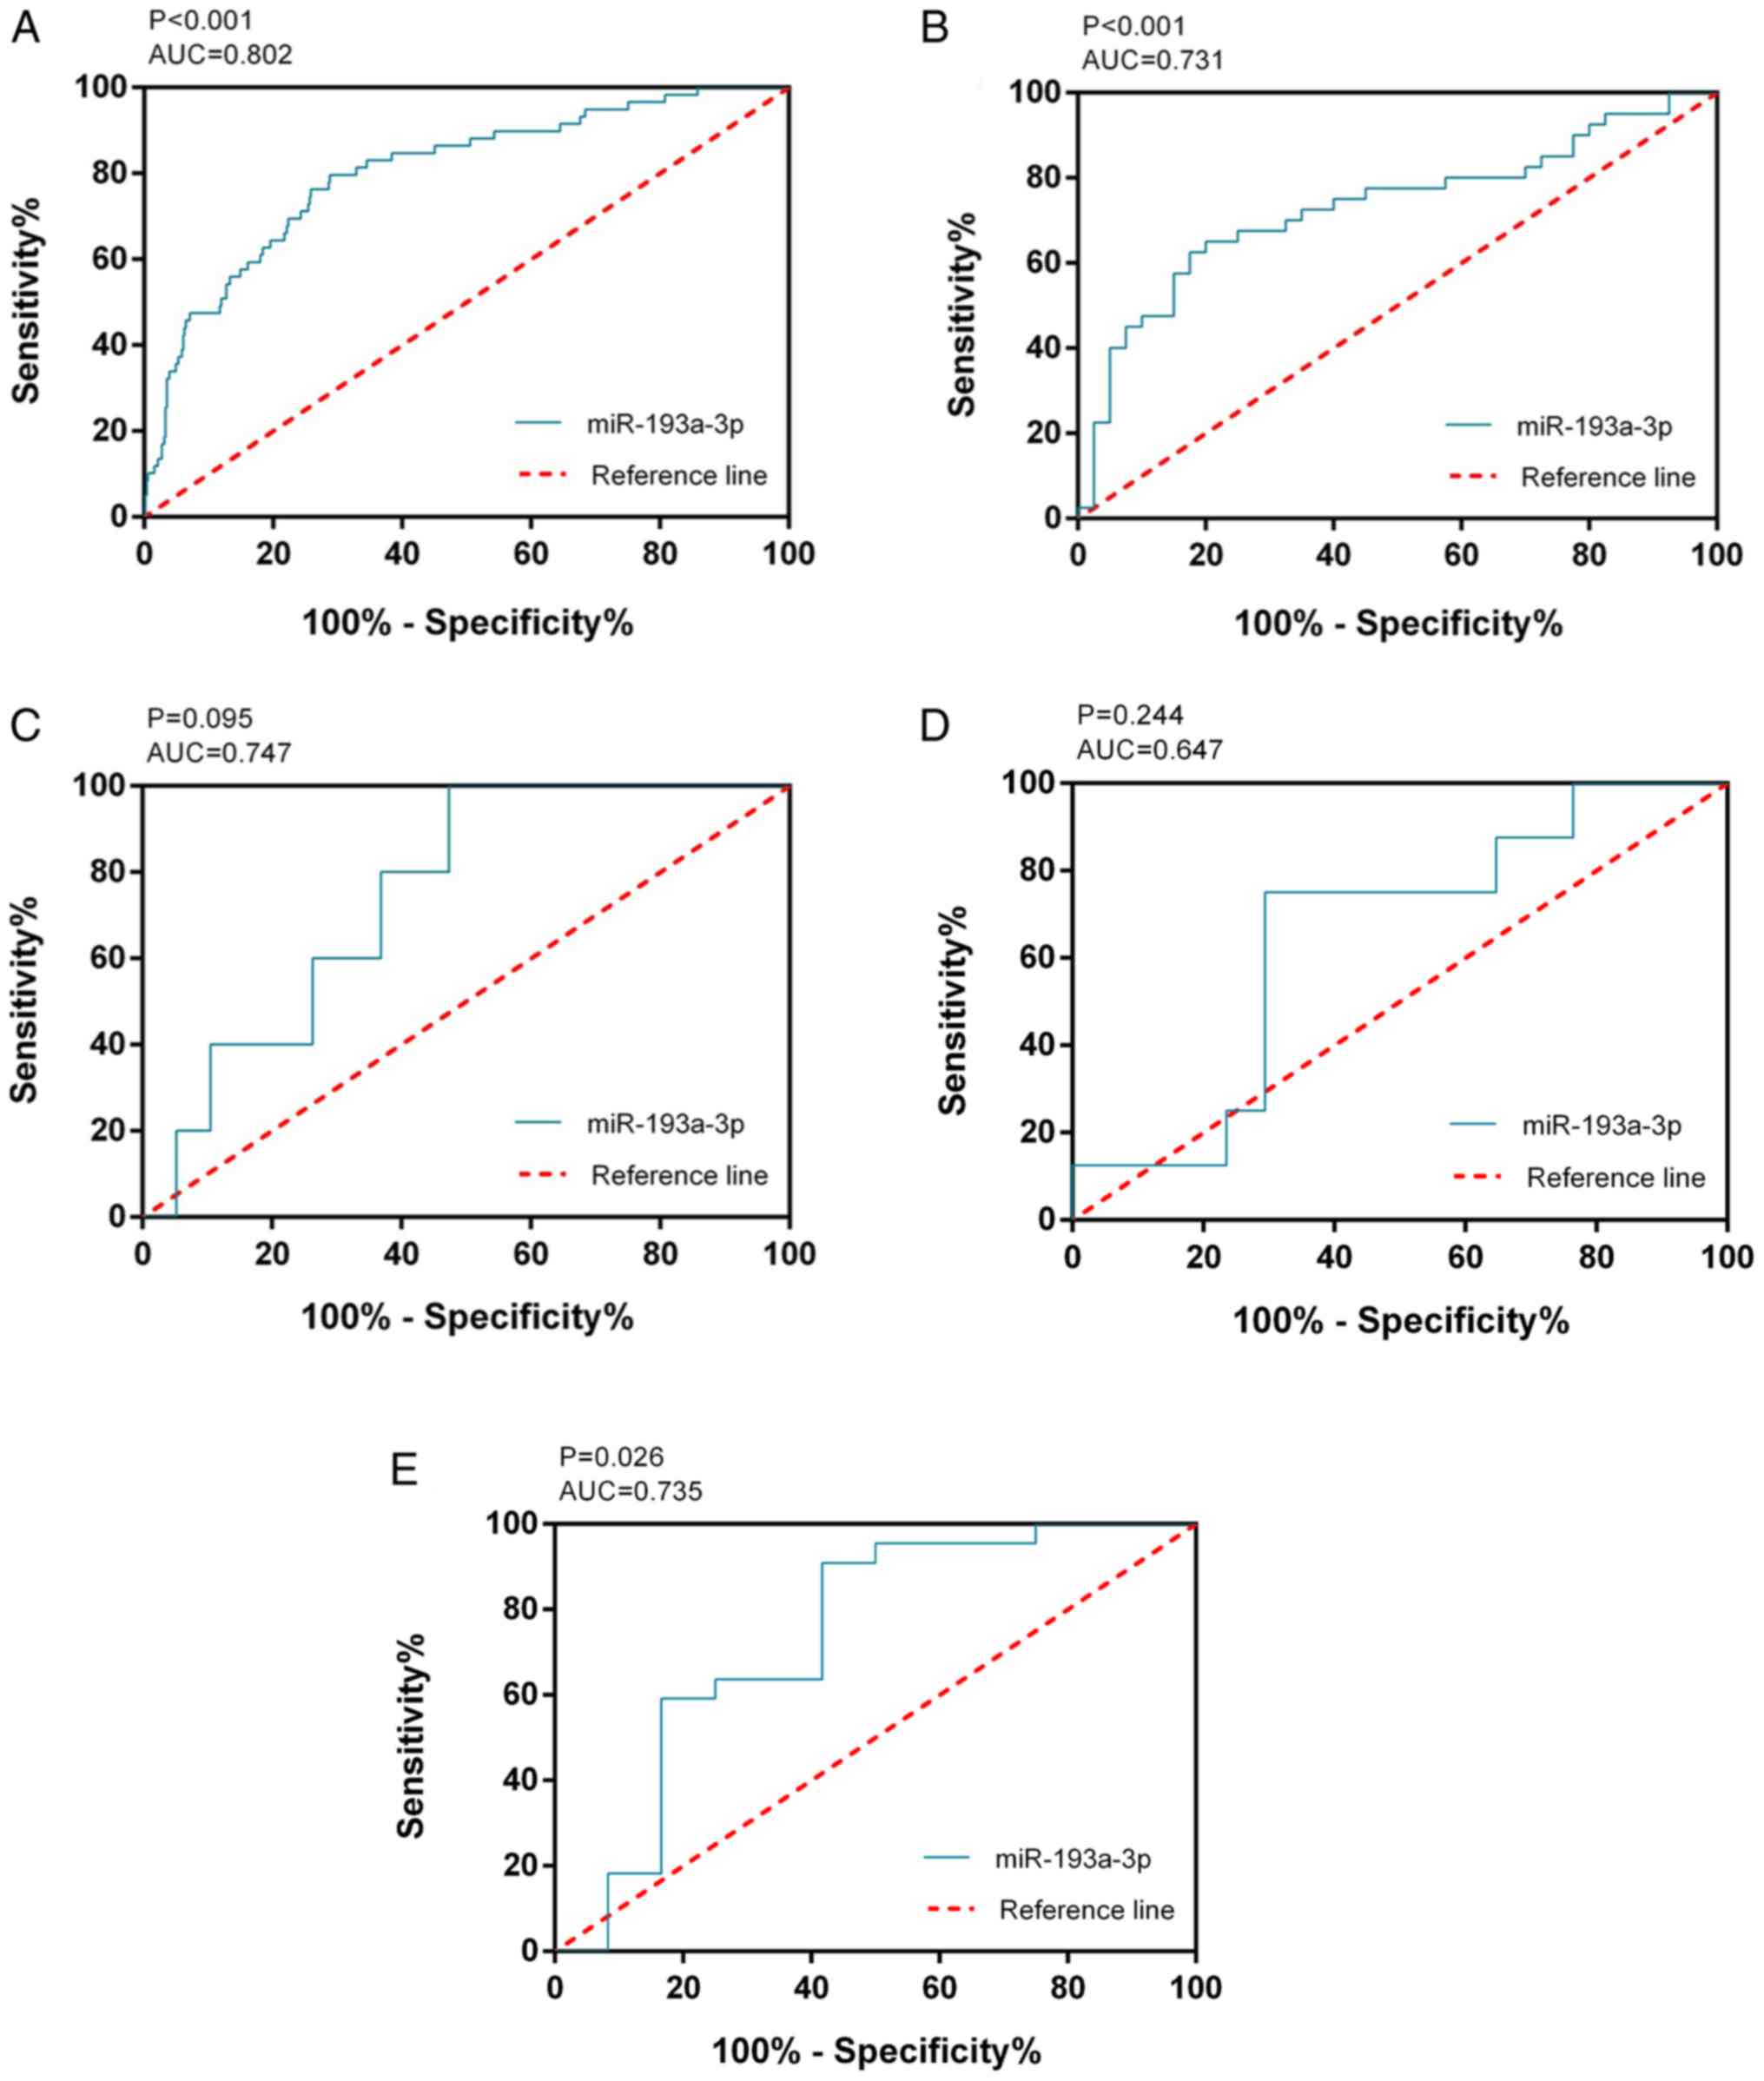
Fig. 1A). The ROC curve of
miR-193a-3p was computed with an area under the curve (AUC) of
0.802 (P<0.001; Fig. 2A), which
reflected the moderate value of miR-193a-3p to differentiate TC
from the non-cancerous groups. The cut-off value was 3.444
(sensitivity 71.2% and specificity 79.7%). miR-193a-3p expression
and clinical parameters are displayed in Table I. The miR-193a-3p levels in females
were notably greater than those in males (P=0.004). miR-193a-3p was
markedly decreased in individuals ≤60 years of age compared with
those >60 years (P=0.020). ln addition, the number of distant
metastases showed a negative association with miR-193a-3p
expression levels (P=0.048).
 | Table I.Association between miR-193a-3p
expression and clinicopathological variables in TC from The Cancer
Genome Atlas. |
Table I.
Association between miR-193a-3p
expression and clinicopathological variables in TC from The Cancer
Genome Atlas.
|
|
| miR-193a-3p
expression |
|---|
|
|
|
|
|---|
| Clinicopathological
feature | Cases | Mean ± SD | t/F value | P-value |
|---|
| Tissue |
|
Non-cancerous tissues | 59 | 3.88±0.73 | 8.468 | <0.001 |
| TC | 510 | 3.00±0.75 |
|
|
| Sex |
|
Male | 134 | 2.89±0.73 | −2.022 |
0.044 |
|
Female | 368 | 3.04±0.76 |
|
|
| Pathologic tumor
grade |
| Stage
I–II | 334 | 2.99±0.78 | −0.459 |
0.647 |
| Stage
III–IV | 166 | 3.02±0.72 |
|
|
| Age |
|
<60 | 383 | 3.04±0.75 | 2.336 |
0.020 |
|
≥60 | 119 | 2.86±0.77 |
|
|
| TNM stage |
|
T1-T2 | 310 | 3.01±0.77 | 0.433 |
0.665 |
|
T3-T4 | 190 | 2.98±0.74 |
|
|
| Pathological lymph
node |
| No | 229 | 2.96±0.75 | −1.074 |
0.283 |
|
Yes | 223 | 3.04±0.73 |
|
|
| Metastasis |
| No | 278 | 3.03±0.76 | 1.990 |
0.048 |
|
Yes | 9 | 2.52±0.95 |
|
|
| Ethnicity |
|
Caucasian | 330 | 3.00±0.77 | 2.236 |
0.108 |
|
African-American | 27 | 2.69±0.73 |
|
|
|
Asian | 52 | 3.01±0.68 |
|
|
miR-193a-3p expression in TC verified
via GEO, ArrayExpress and literature analyses
Subsequently, in other online databases, data from 4
chips (GSE40807, GSE62054, GSE73182 and E-MTAB-736) were acquired
from the GEO and ArrayExpress databases, which provided the
expression information on miR-193a-3p in 88 TC and 75 non-cancerous
tissues (Table II). The
literature was also searched in 13 online databases, but the data
from one study could not be extracted. All 4 datasets obtained from
the GEO and ArrayExpress databases revealed that miR-193a-3p
expression levels in TC were greater compared with non-TC controls,
although two of these four datasets had P-values >0.05 (Fig. 1B-E). ROC analysis was also used to
estimate the capacity of miR-193a-3p in distinguishing TC from
non-cancer tissues (Fig. 2B-E);
three of the four chips demonstrated that miR-193a-3p had a
moderate diagnostic value for TC. miR-193a-3p expression data from
TCGA, GEO and ArrayExpress, which provided 598 TC and 134
non-cancerous samples, were combined for meta-analysis. The SMD of
miR-193a-3p was −1.00 [P<0.001; 95% CI, (−1.21, −0.79); Fig. 3A] via the fixed-effects model, and
the heterogeneity test was P=0.46 (I2=0%). The AUC of
the sROC was 0.80 (95% CI, 0.76–0.83), indicating a moderate
ability to differentiate TC from non-cancer samples. The combined
sensitivity and specificity were 0.69 (95% CI, 0.59–0.78) and 0.82
(95% CI, 0.67–0.91), respectively (Fig. 3B). Publication bias was performed
and showed that there was no conspicuous publication bias among the
datasets (Begg's test and Egger's test were 0.81 and 0.16,
respectively; Fig. 3C and D).
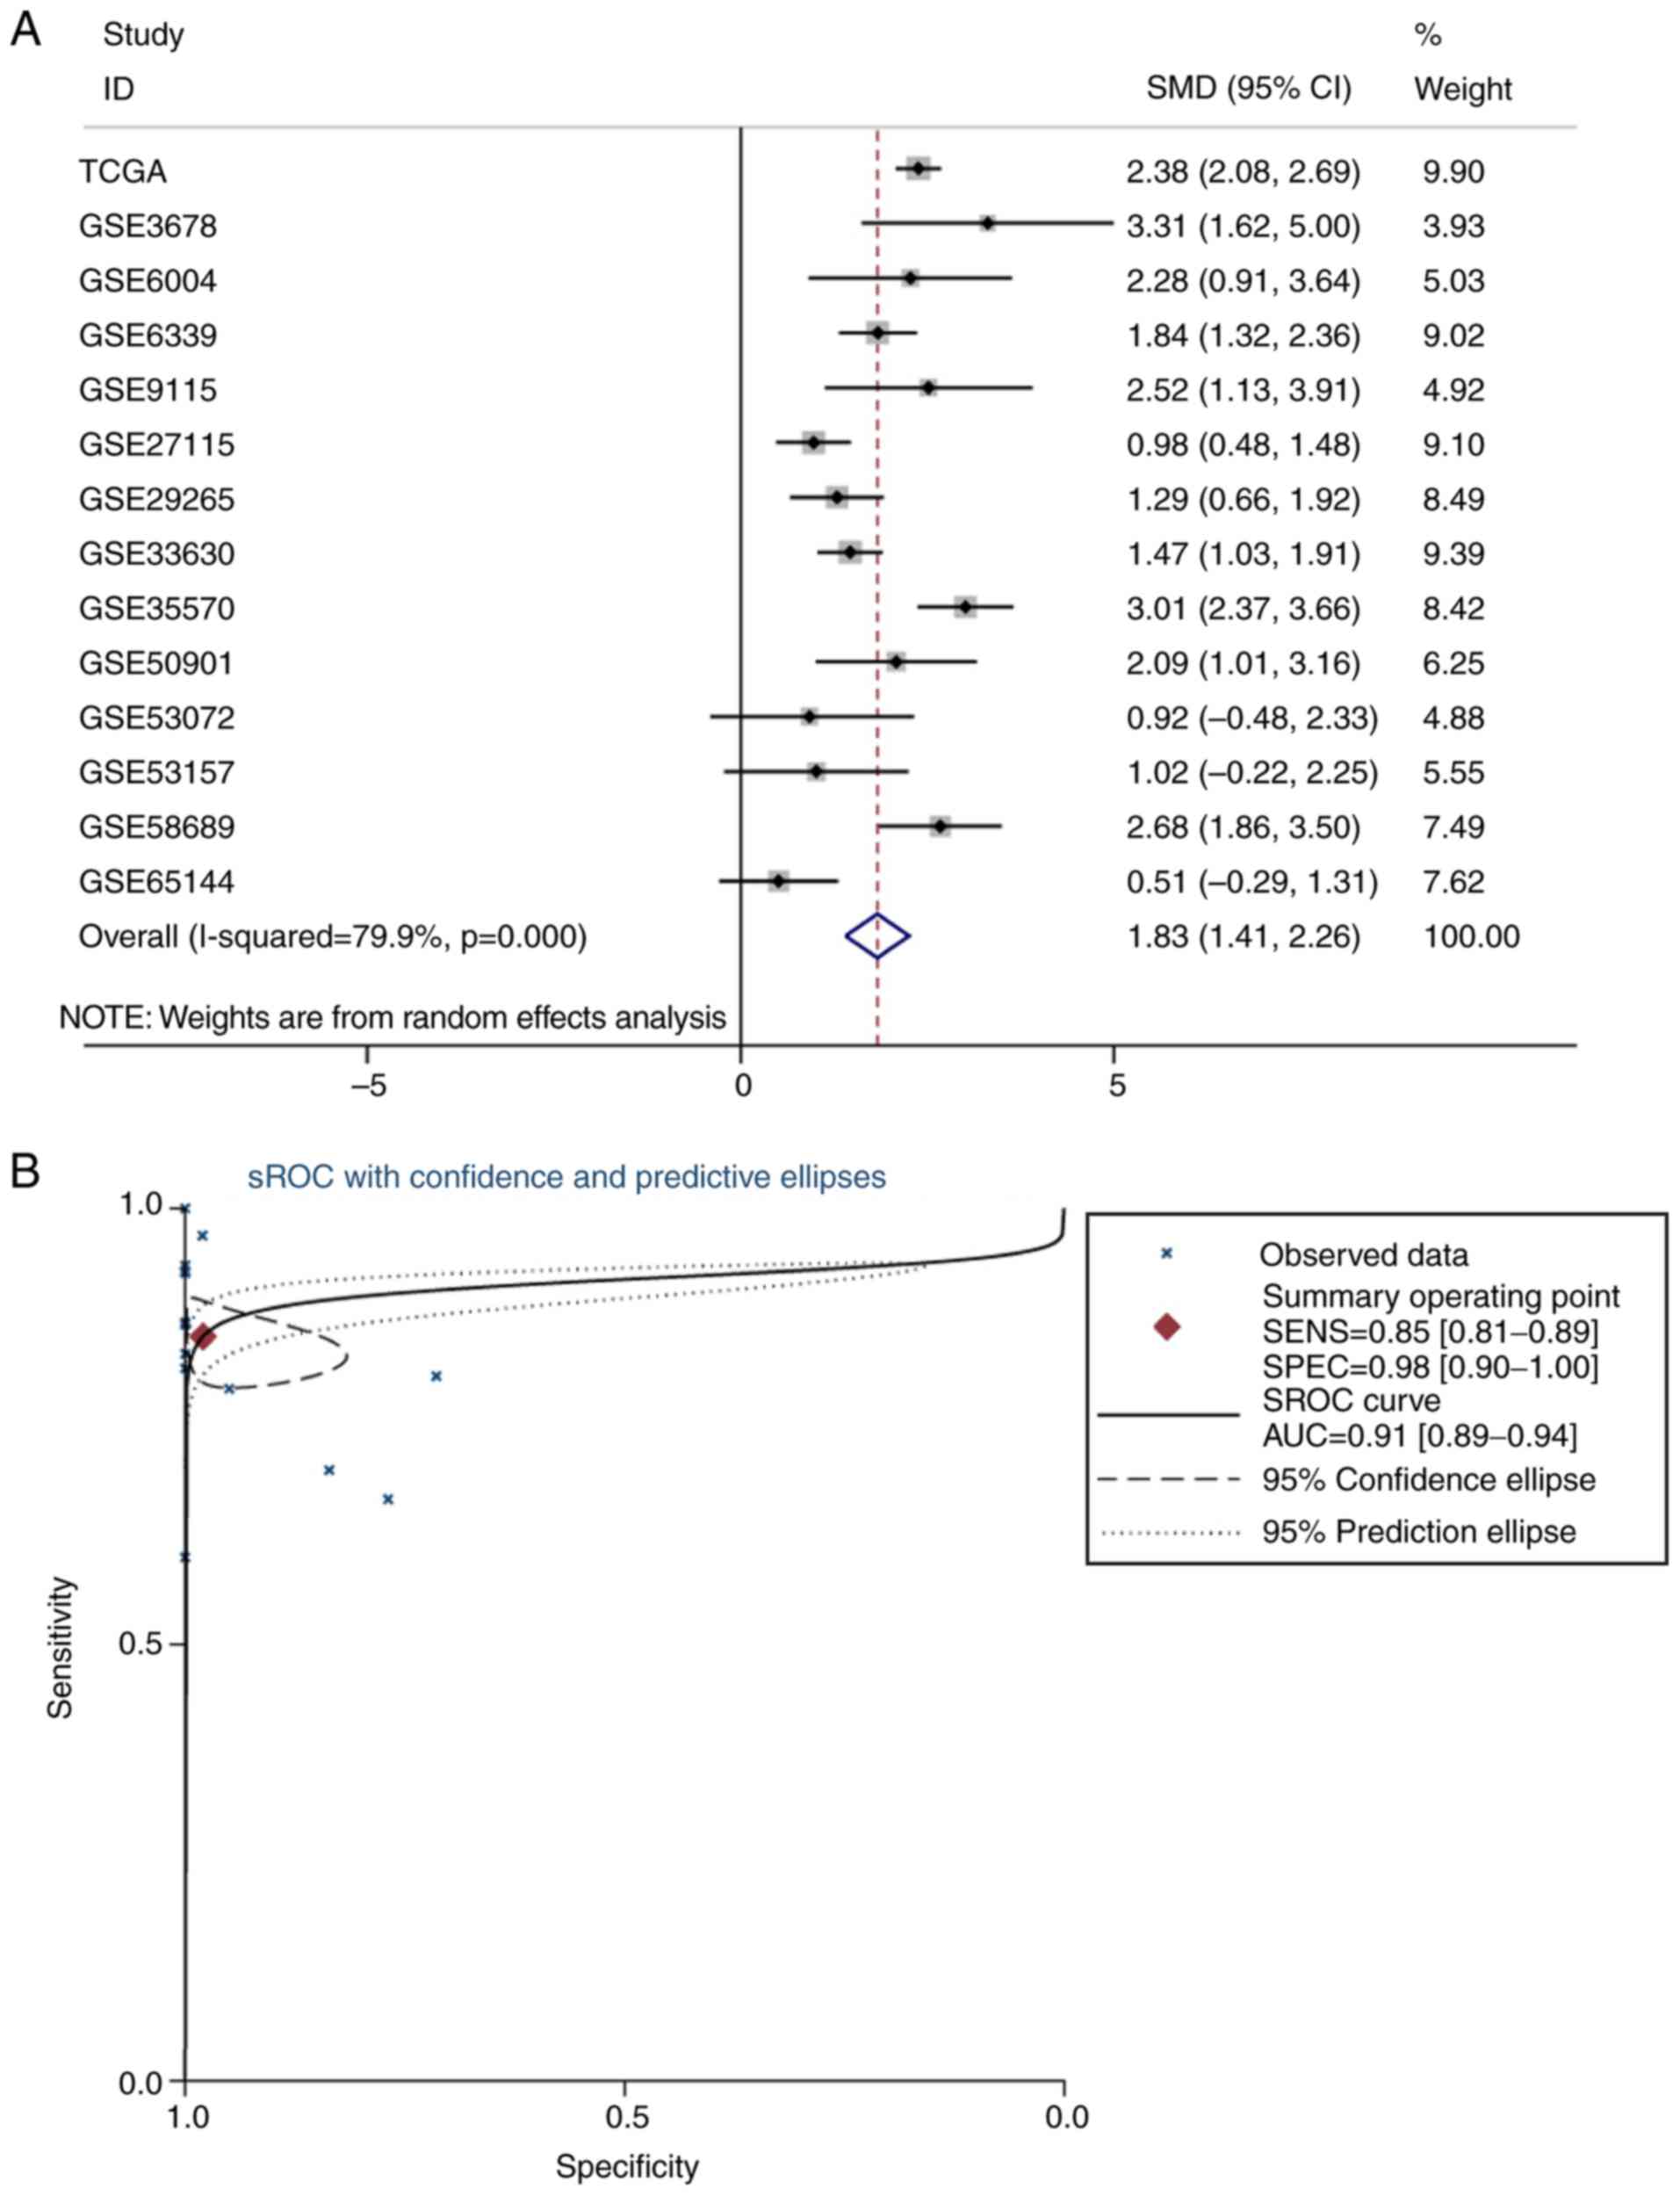
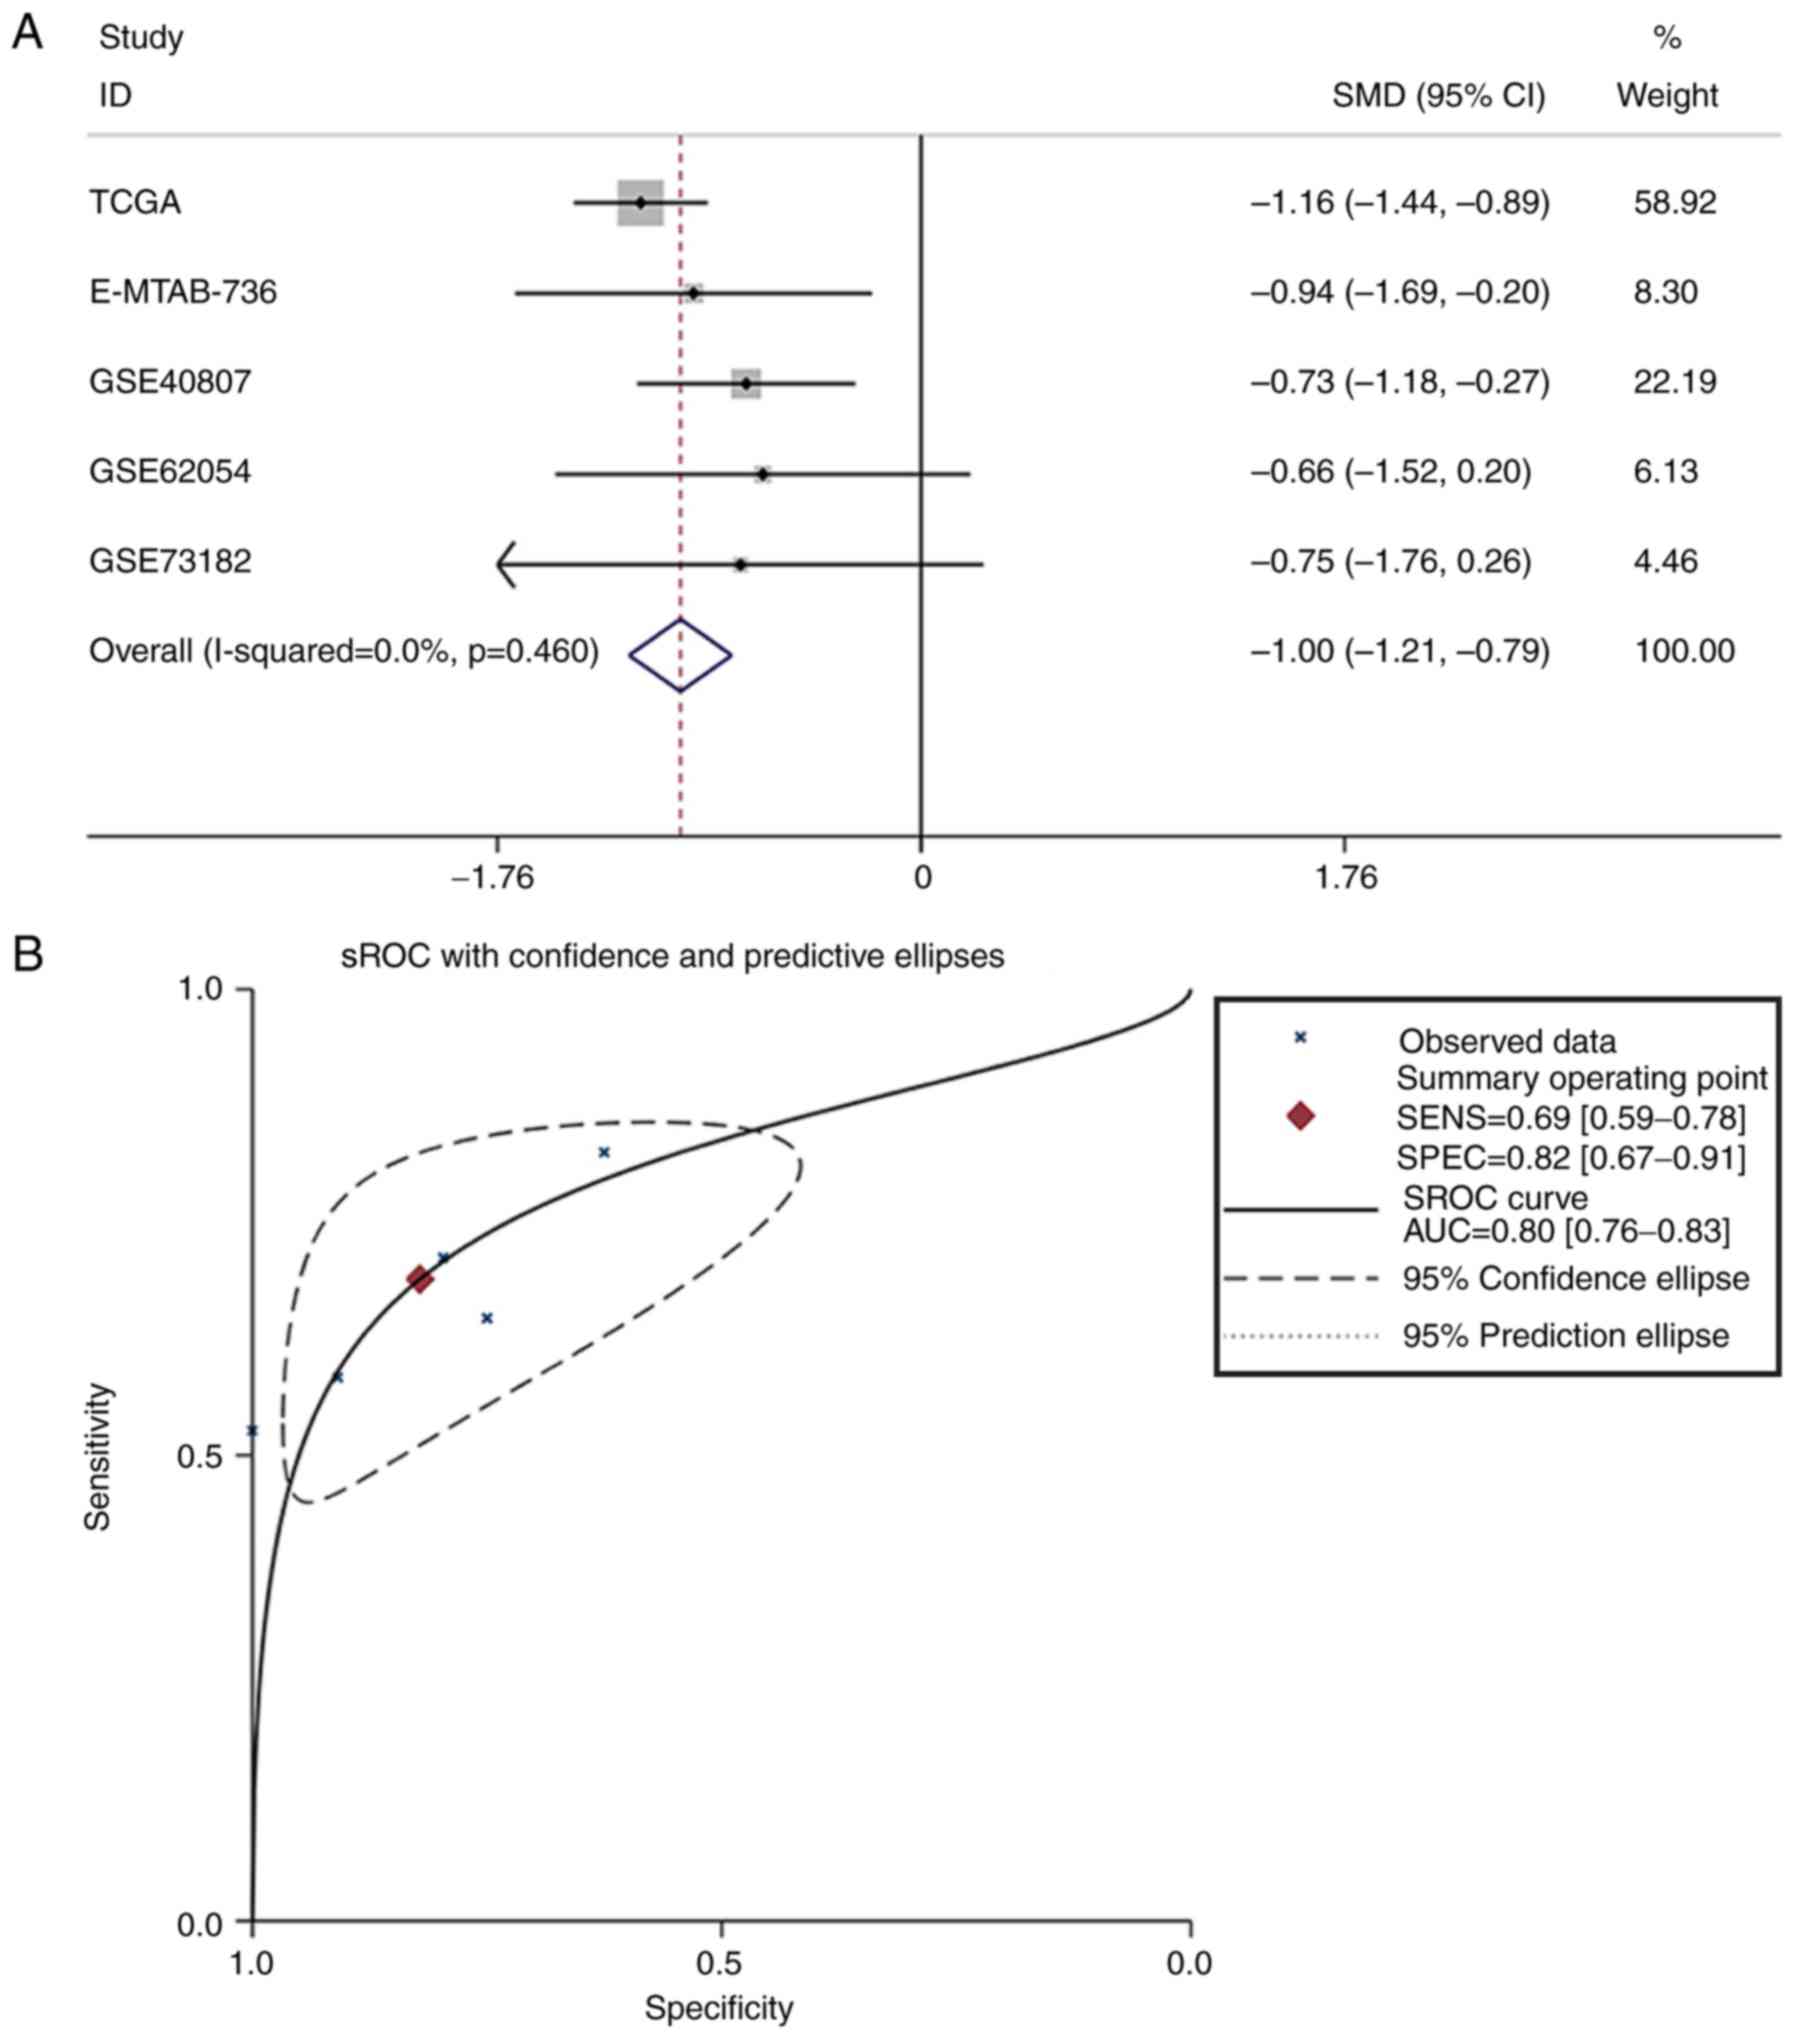 | Figure 3.Meta-analysis of miR-193a-3p in TC.
(A) Forest plot curve for evaluating miR-193a-3p expression in TC
compared with non-cancerous tissues, the pooled SMD was −1.00
[P<0.001; 95% CI, −1.21-(−0.79)]. (B) AUC of sROC Curve was 0.80
(95% CI, 0.76–0.83), which indicated a moderate ability to
differentiate TC from non-cancer samples. The pooled sensitivity
and specificity were 0.69 (95% CI, 0.59–0.78) and 0.82 (95% CI,
0.67–0.91), respectively. (C) Begg's test. (D) Egger's test. miR,
microRNA; TC, thyroid cancer; SMD, standard mean difference; CI,
confidence interval; AUC, area under curve; sROC, summary receiver
operating characteristic; TCGA, The Cancer Genome Atlas. |
| Table II.General characteristics of included
microarray and RNA sequencing datasets. |
Table II.
General characteristics of included
microarray and RNA sequencing datasets.
| Authors, year | Country | Dataset | Cancer group | Non-cancer
groups | Refs. |
|---|
| TCGA, 2018 | USA | TCGA | 510 | 59 | – |
| Lassalle et
al, 2016 | France | GSE40807 | 40 | 40 | (42) |
| Stokowy et
al, 2014 | Norway | GSE62054 | 17 | 5 | Unpublished
data |
| Minna et al,
2016 | Italy | GSE73182 | 19 | 5 | (43) |
| Rossing et
al, 2012 | Denmark | E-MTAB-736 | 12 | 22 | (44) |
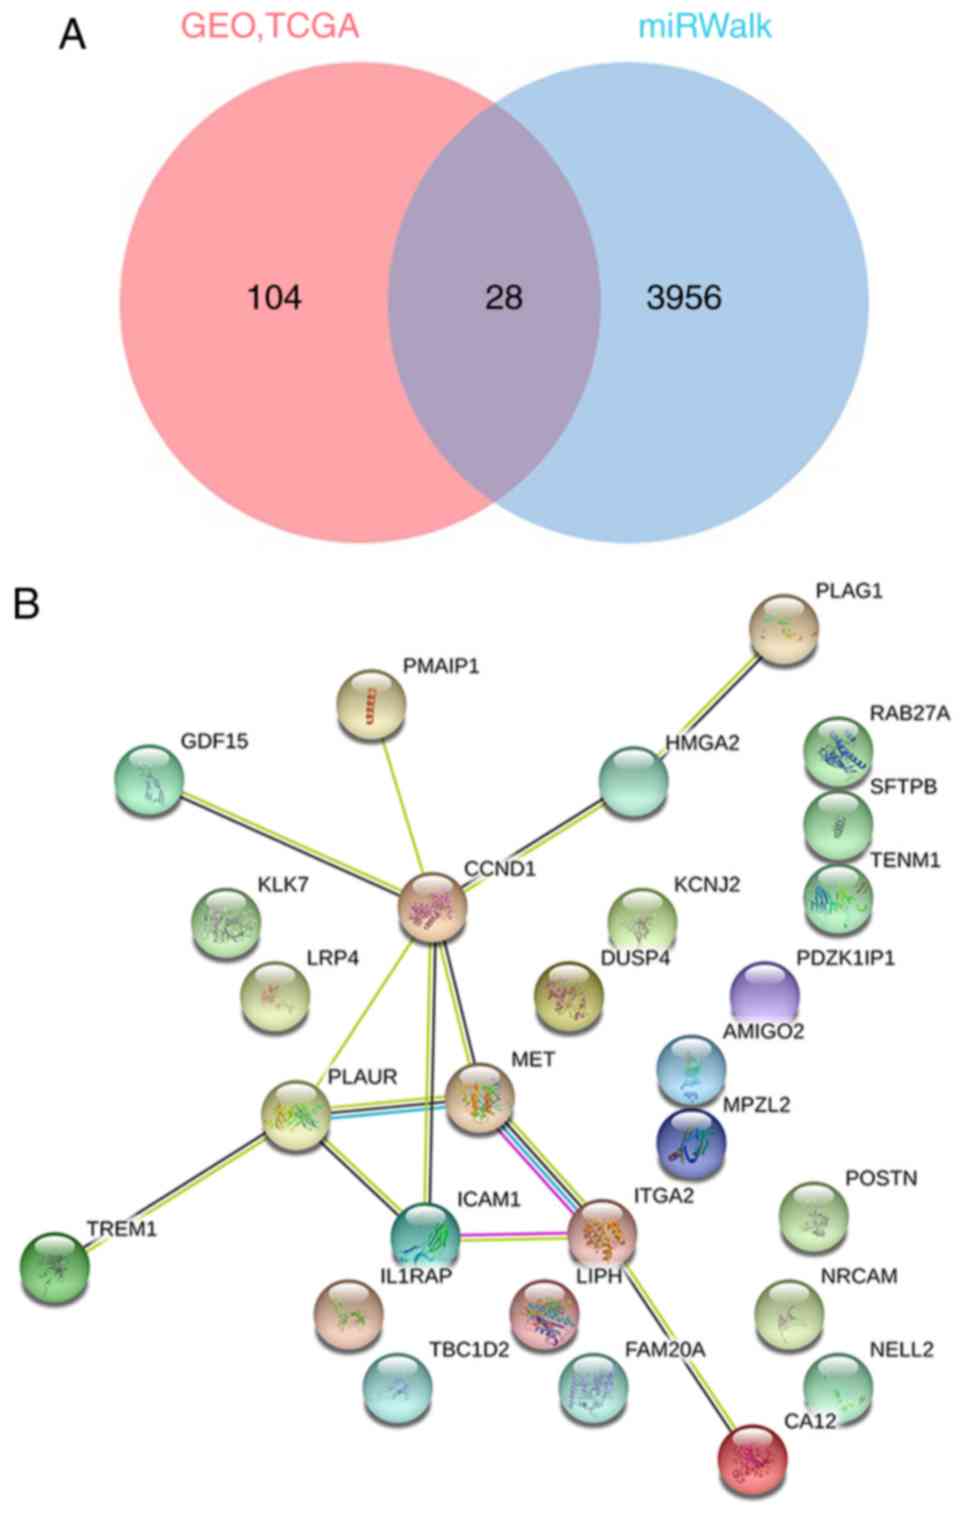
GO annotation, KEGG pathway, DO and
PPI network analysis
The prediction of the candidate target genes of
miR-193a-3p was conducted using miRWalk 3.0, in which 3,984
potential mRNA candidate target genes were discovered. Next, 1,490
and 132 genes with elevated expression were determined from the
TCGA and GEO databases, respectively. A total of 28 overlapping
genes were eventually identified (Fig.
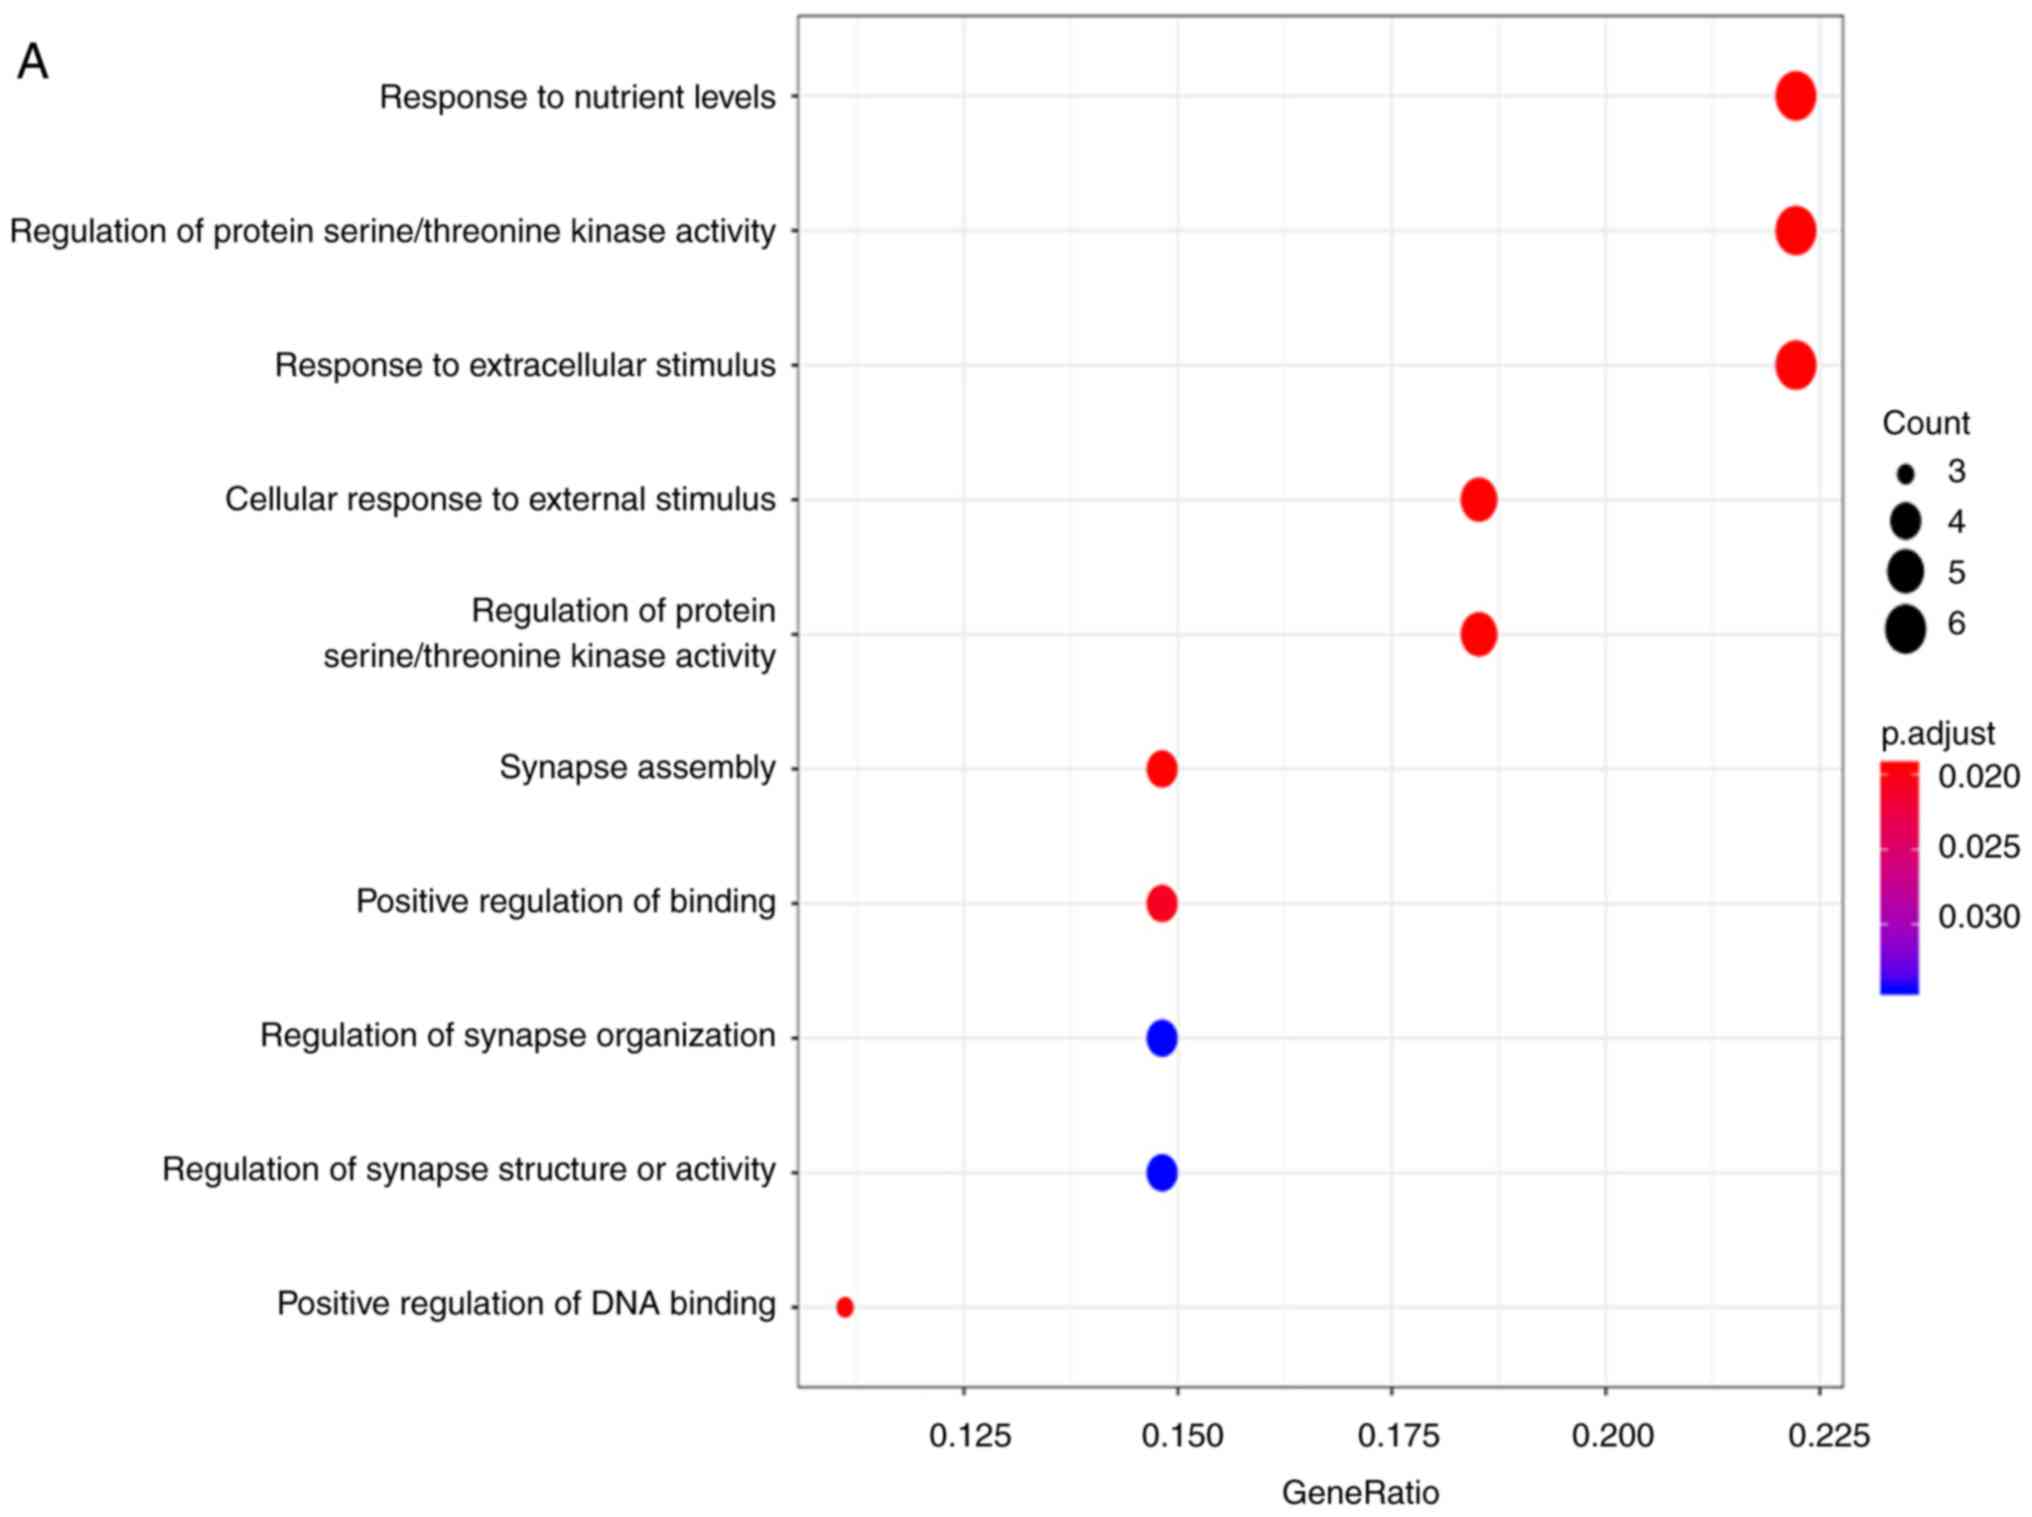
4A). The properties of these target genes were analyzed using
the clusterprofiler R package. The results indicated that ‘response
to nutrient levels’ was the most significantly enriched biological
process (BP); with respect to cellular components (CC), the genes
were mainly enriched in the ‘lamellar body’. In terms of molecular
function (MF), ‘sulfur compound binding’ was the most enriched
(Fig. 5A-C; Table III). However, no KEGG pathways
were significantly enriched with these genes. DO analysis was also
performed to discover related diseases caused by these genes. The
results identified that ‘cell type benign neoplasm’ was the most
enriched (Fig. 5D; Table III). Then, the target genes were
put into the STRING online website to construct a protein-protein
interaction network (Fig. 4B). In
the present study, CCND1 attracted attention as a hub gene, as it
had the most connections among the proteins; therefore, the
targeting association between CCND1 and miR-193a-3p was selected
for further investigation.
| Table III.Enrichment GO and disease ontology
terms of the target genes of microRNA-193a-3p. |
Table III.
Enrichment GO and disease ontology
terms of the target genes of microRNA-193a-3p.
| A, Biological
processes |
|---|
|
|---|
| ID | Term | Count | P-value |
|---|
| GO:0031667 | Response to
nutrient levels | 6 |
5.58×10⁻⁵ |
| GO:0071900 | Regulation of
protein serine/threonine kinase activity | 6 |
6.50×10⁻⁵ |
| GO:0009991 | Response to
extracellular stimulus | 6 |
8.06×10⁻⁵ |
|
| B, Cellular
component |
|
| ID | Term | Count | P-value |
|
| GO:0042599 | Lamellar body | 2 |
2.91×10⁻⁴ |
| GO:0005771 | Multivesicular
body | 2 |
1.71×10⁻³ |
| GO:0045178 | Basal part of
cell | 2 |
2.06×10⁻³ |
|
| C, Molecular
function |
|
| ID | Term | Count | P-value |
|
| GO:1901681 | Sulfur compound
binding | 4 |
3.34×10⁻⁴ |
| GO:0008201 | Heparin
binding | 3 |
1.46×10⁻³ |
| GO:0098631 | Cell adhesion
mediator activity | 2 |
1.87×10⁻³ |
|
| D, DO
terms |
|
| ID | Term | Count | P-value |
|
| DOID:0060084 | Cell type benign
neoplasm | 10 |
2.79×10⁻⁷ |
| DOID:1575 | Rheumatic
disease | 6 |
1.12×10⁻⁵ |
| DOID:418 | Systemic
scleroderma | 6 |
1.12×10⁻⁵ |
Overexpression of CCND1 in TC and its
clinical significance
The expression value and clinical significance of
CCND1 in TC was verified using data from two different sources
(TCGA and GEO databases; Table
IV). The expression of CCND1 in the TC group from TCGA database
was 13.36±0.74 and that in the non-cancerous group was 11.66±0.49.
CCND1 was significantly overexpressed in 513 TC samples compared
with 59 non-cancerous samples (P<0.001; Fig. 6A). The AUC for upregulated CCND1
expression in TC was 0.965 (P<0.001; Fig. 7A), which indicated the high
capacity of the expression value of CCND1 to differentiate TC from
normal samples. The cut-off value was 12.628 (sensitivity 86.9% and
specificity 100%). Differential CCND1 expression was not detected
for the clinical pathological parameters analyzed. The associations
between the expression of CCND1 and clinical pathological
parameters are summarized in Table
V. The expression value of CCND1 was also calculated from the
chip arrays of the GEO database, which included 384 TC and 316
non-cancer controls (GSE3678, GSE6004, GSE6339, GSE9115, GSE27115,
GSE29265, GSE33630, GSE35570, GSE50901, GSE53072, GSE53157,
GSE58689 and GSE65144). Except for GSE53072, GSE53157 and GSE65144,
the remaining chip arrays revealed significantly upregulated
expression of CCND1 in the TC tissues compared with non-cancerous
tissues (P<0.05; Fig. 6B-N).
The GSE53072, GSE53157 and GSE65144 chip arrays displayed
non-significant trends towards upregulated expression of CCND1 in
the TC tissues. AROC curve analysis of CCND1 was also performed and
the results are shown in Fig.
7B-N. Then, CCND1 expression data from TCGA and GEO databases,
which provided 897 TC and 193 non-cancerous tissues, were subjected
to meta-analysis. The pooled SMD of CCND1 was 1.83 (P<0.001; 95%
CI, 1.41–2.26; Fig. 8A) by the
random effects model, and the test for heterogeneity was P<0.01
(I2=79.9%). The sROC curve of the TCGA and GEO
expression data is shown in Fig.
8B. The publication bias was evaluated by a funnel chart:
Begg's test and Egger's test were 0.44 and 0.75, respectively,
which indicated that there was no conspicuous publication bias
among the datasets (Fig. 8C and
D). Furthermore, the AUC of the sROC was 0.91 (95% CI,
0.89–0.94) and the combined sensitivity and specificity were 0.85
(95% CI, 0.81–0.89) and 0.98 (95% CI, 0.90–1.00), respectively. The
results revealed that CCND1 may be a good biomarker to discriminate
TC tissues from non-cancerous tissues.
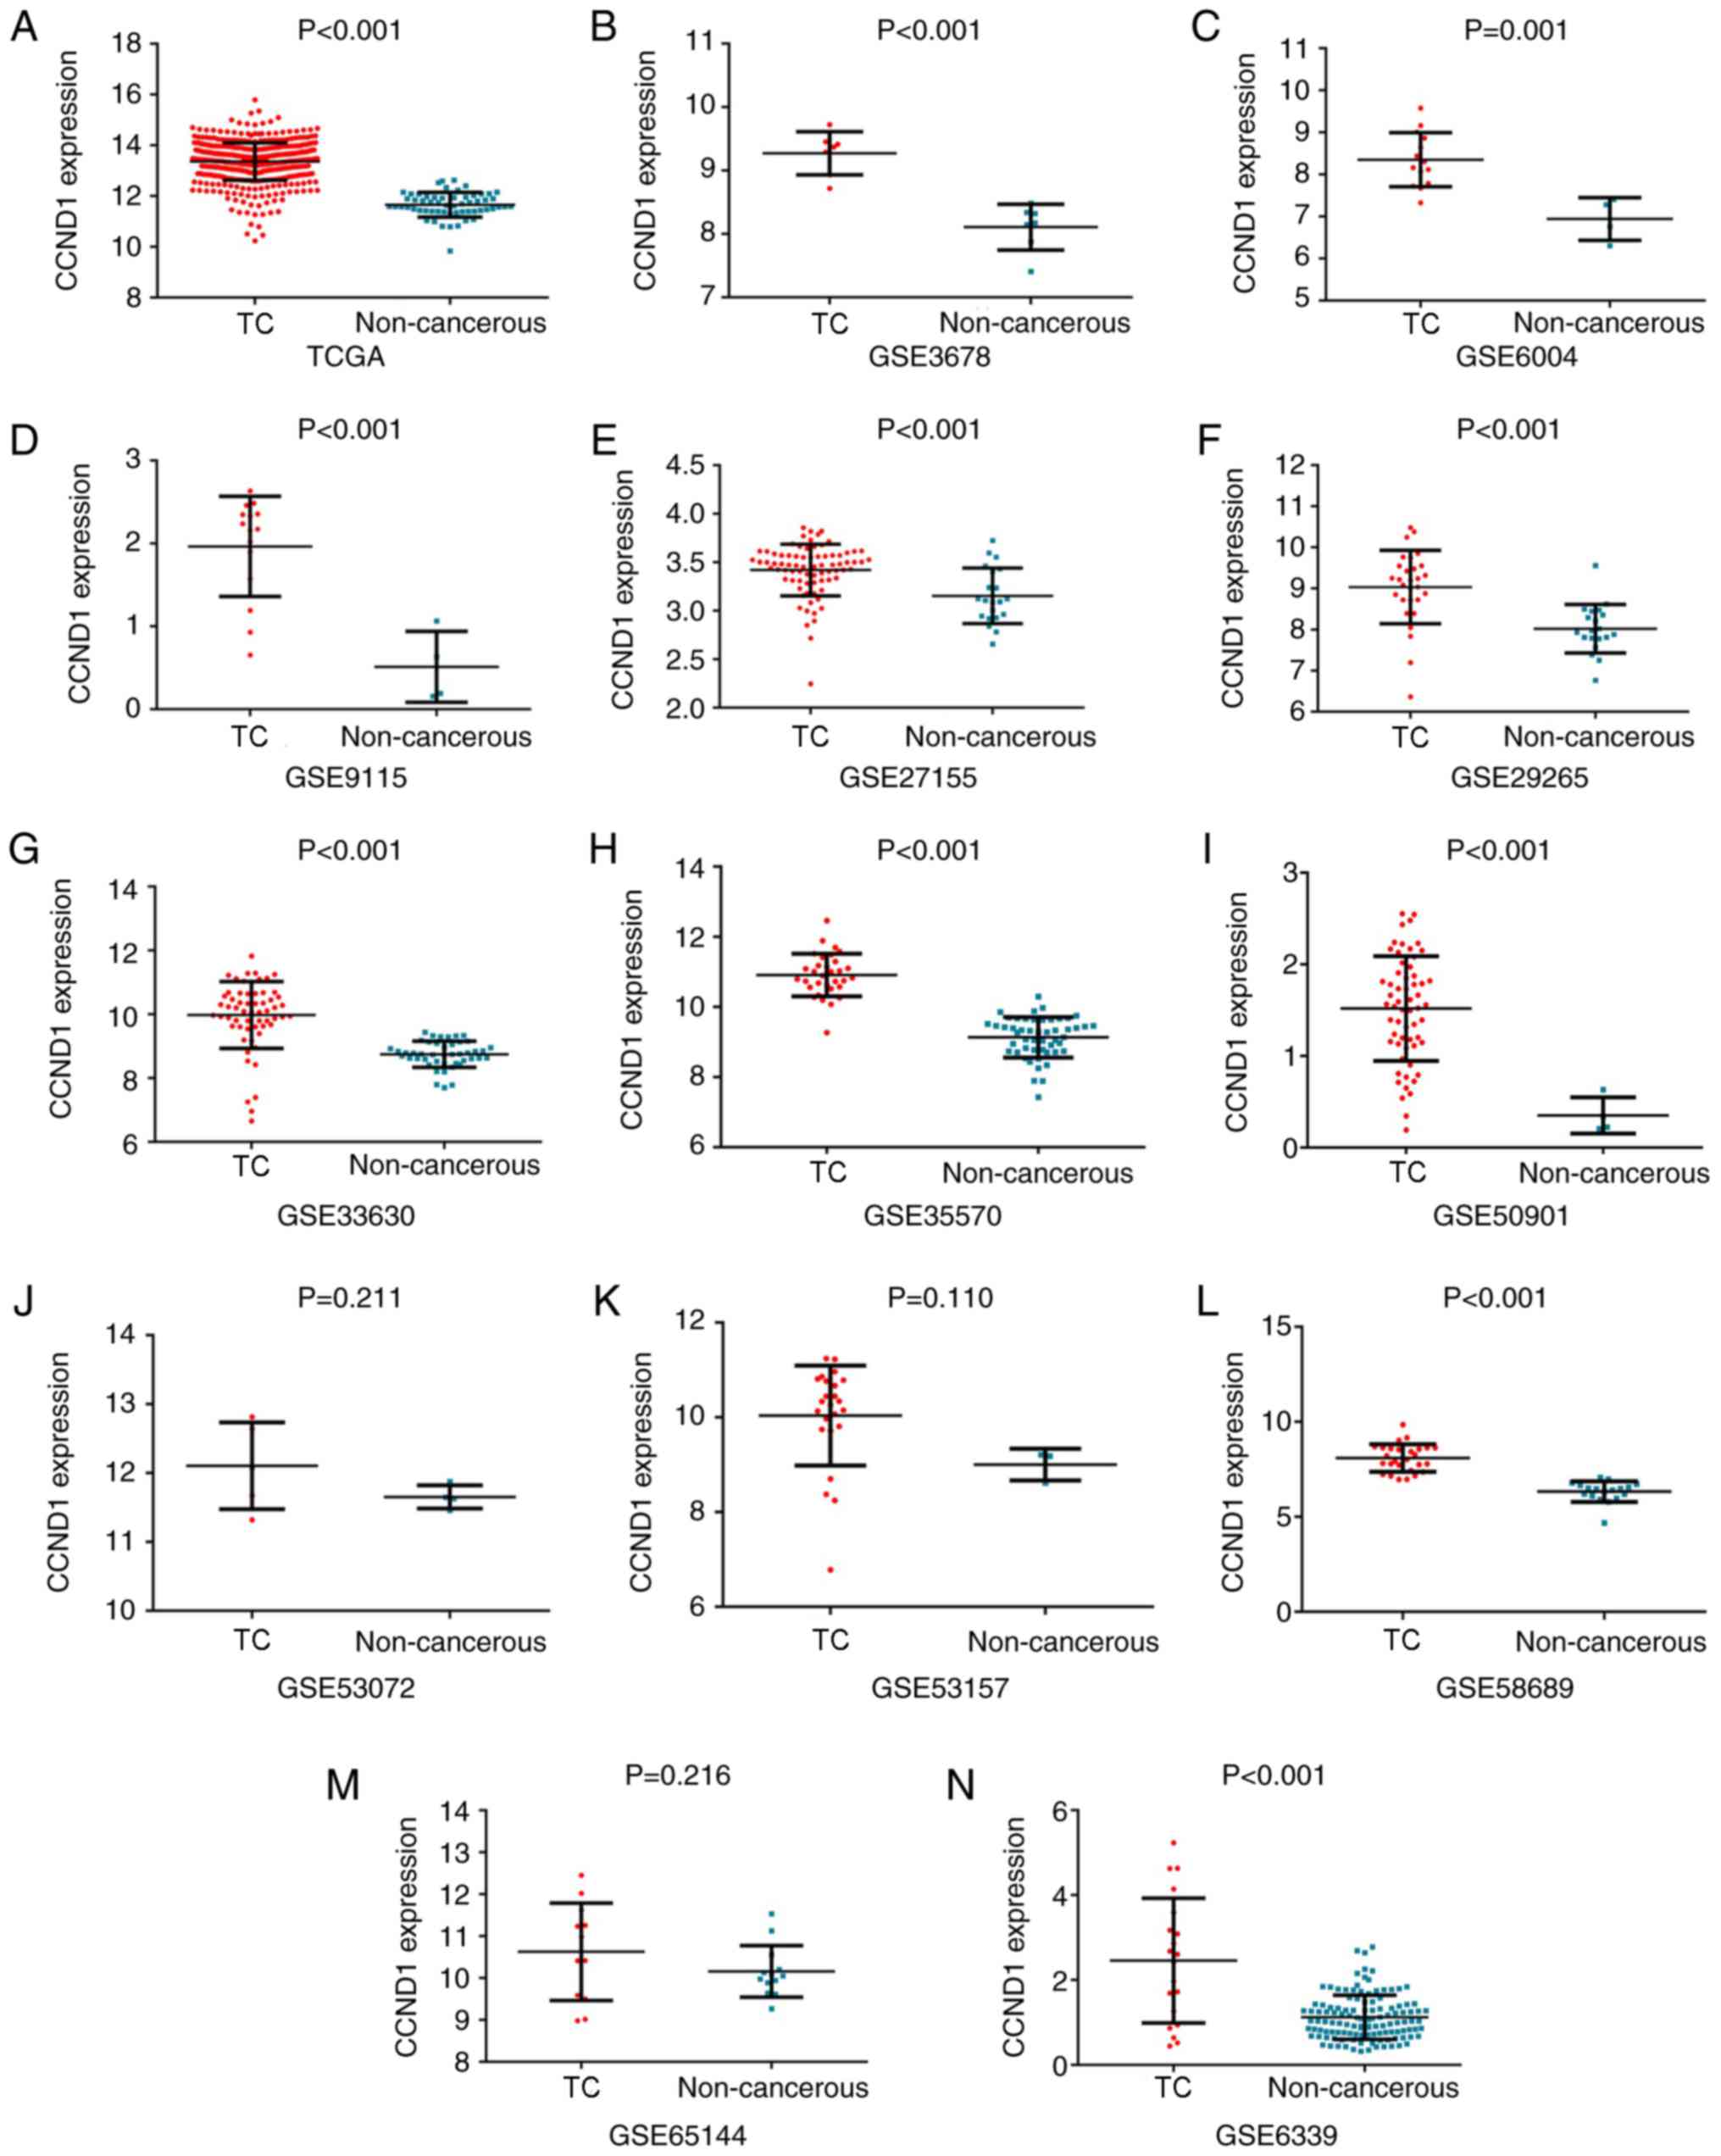 | Figure 6.Upregulation of CCND1 in TC compared
to non-cancerous tissues based on different databases. (A) TCGA,
(B) GSE3678, (C) GSE6004, (D) GSE9115, (E) GSE27115, (F) GSE29265,
(G) GSE33630, (H) GSE35570, (I) GSE50901, (J) GSE53072, (K)
GSE53157, (L) GSE58689, (M) GSE65144 and (N) GSE6339. TC, thyroid
cancer. CCND1, cyclin D1; TCGA, The Cancer Genome Atlas. |
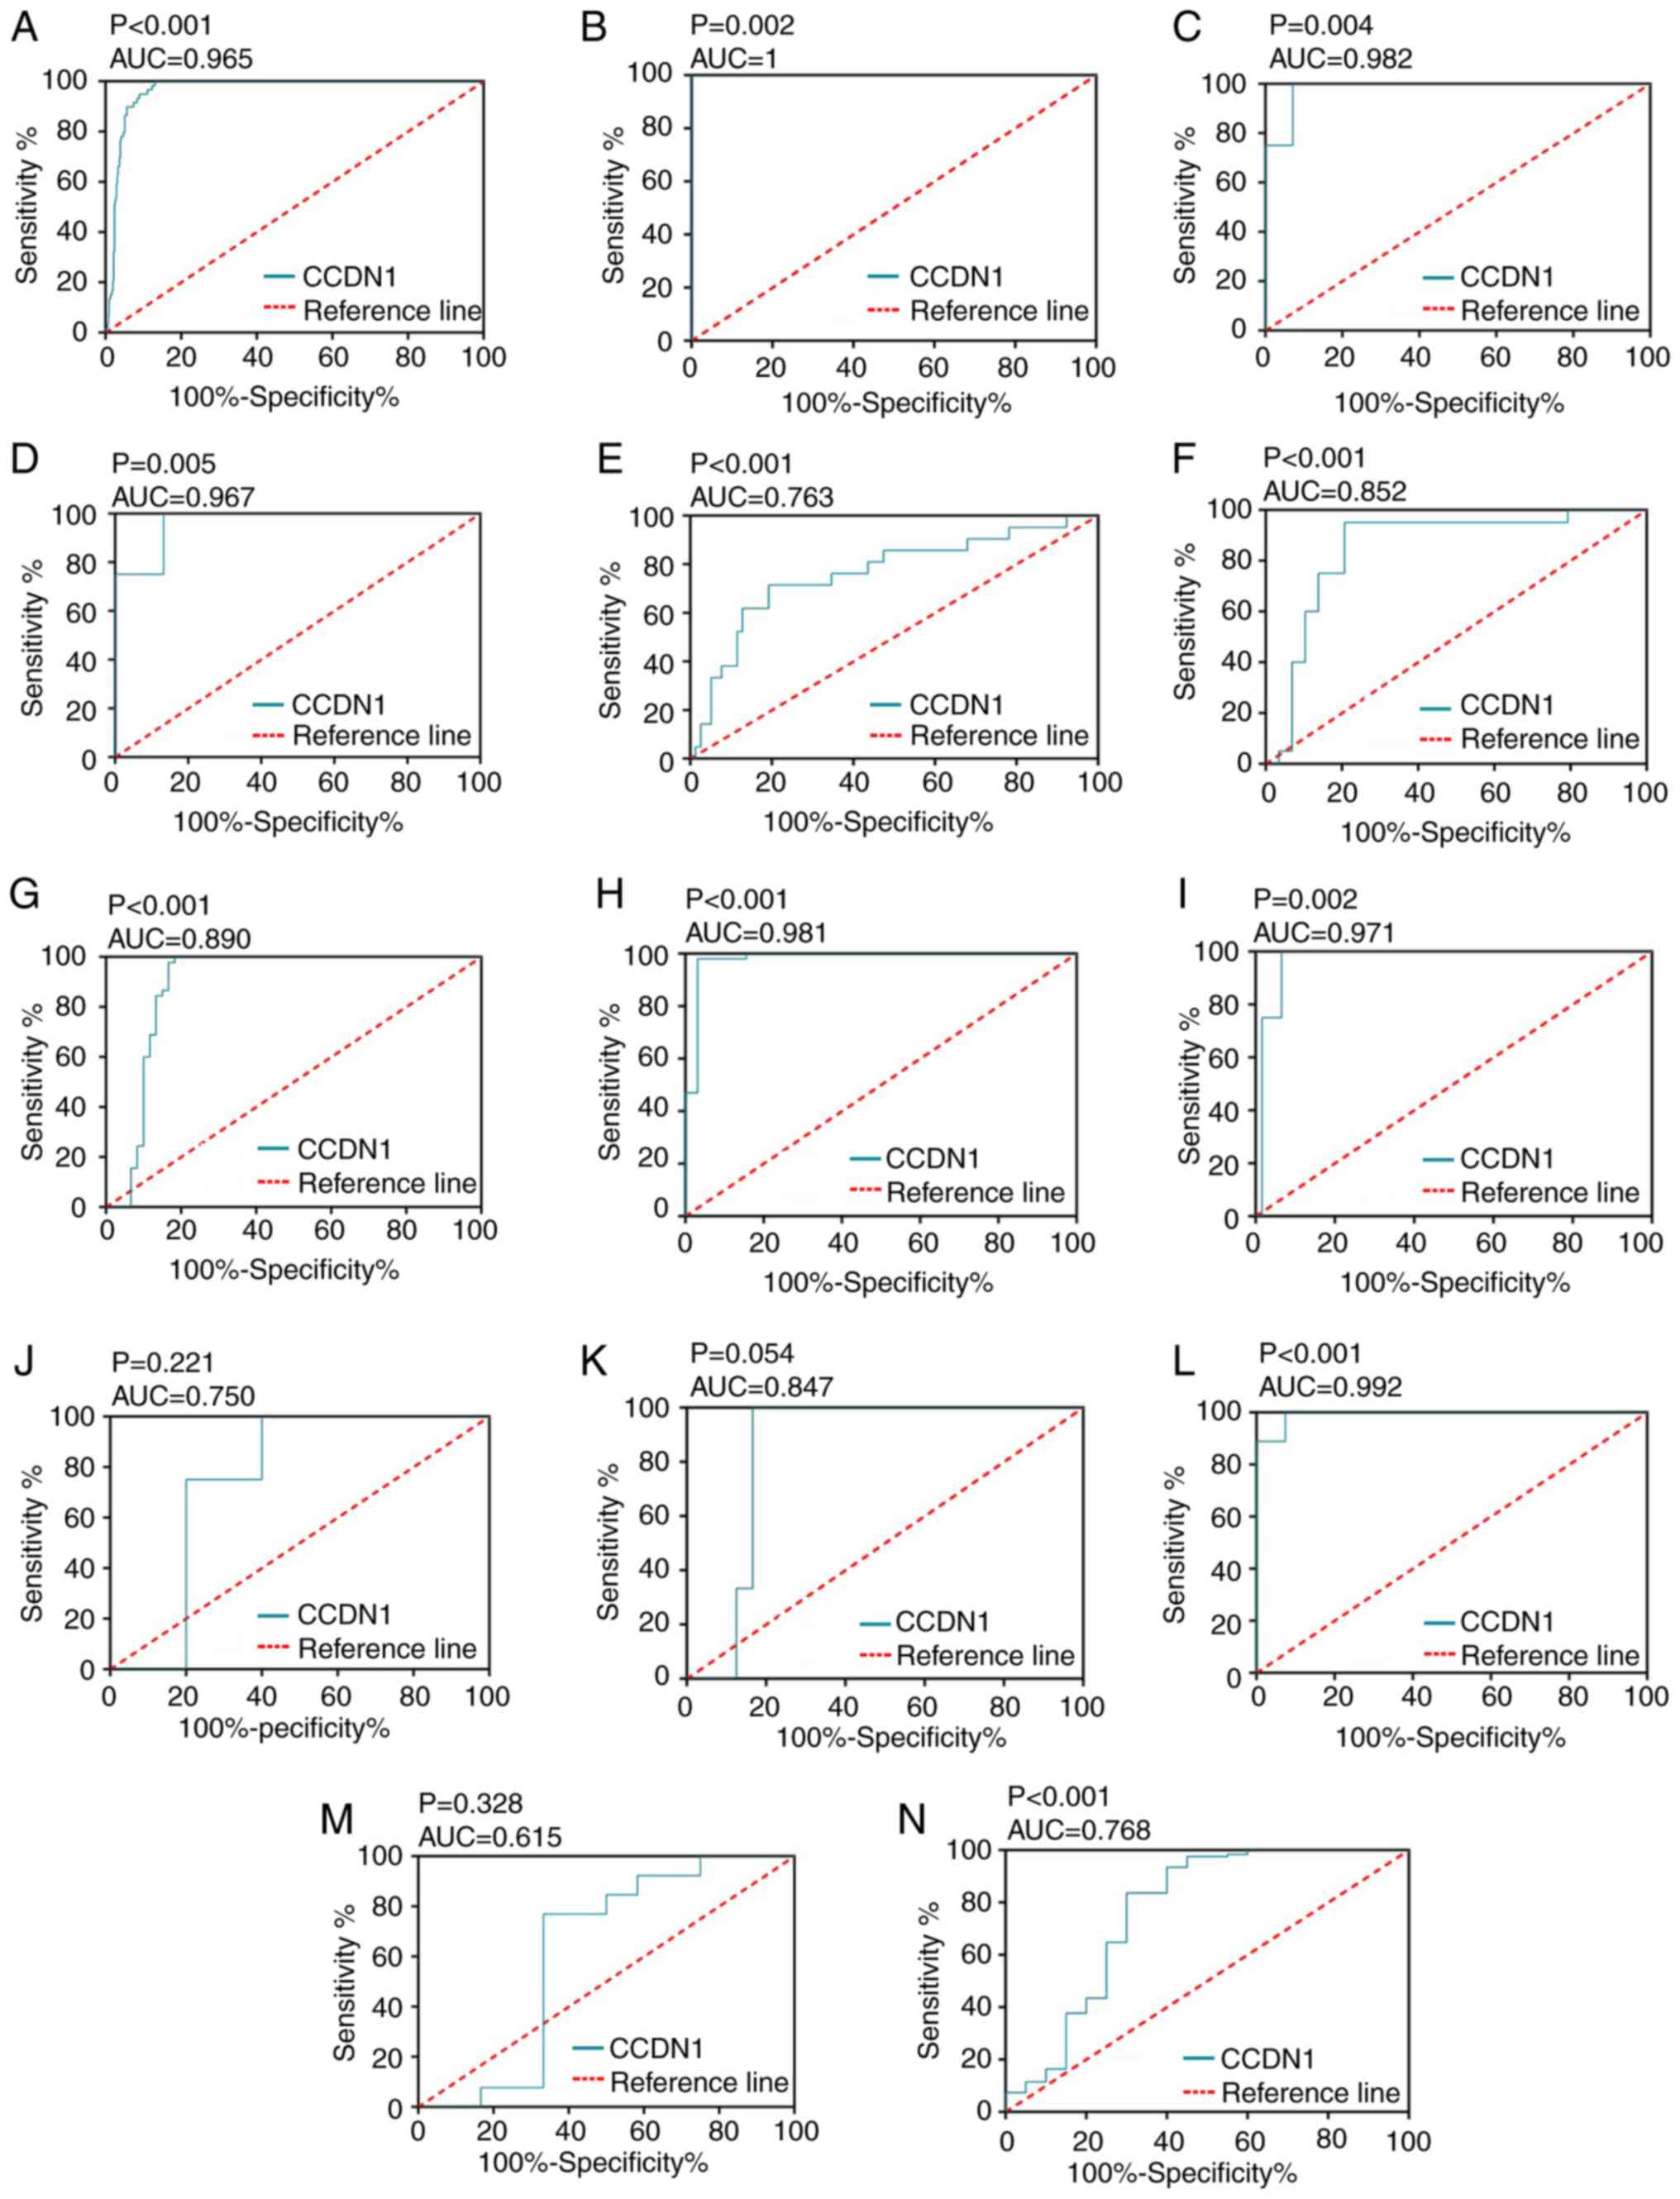 | Figure 7.Receiver operating characteristic
curves of CCND1 expression for differentiating thyroid cancer from
non-cancerous thyroid tissues. (A) The Cancer Genome Atlas, (B)
GSE3678, (C) GSE6004, (D) GSE9115, (E) GSE27115, (F) GSE29265, (G)
GSE33630, (H) GSE35570, (I) GSE50901, (J) GSE53072, (K) GSE53157,
(L) GSE58689, (M) GSE65144 and (N) GSE6339 datasets. CCND1, cyclin
D1; AUC, area under curve. |
 | Figure 8.Meta-analysis of CCND1 from public
databases. (A) Forest plot curve of the meta-analysis for
evaluating CCND1 expression between TC and non-cancerous tissues,
the merged SMD was 1.83 (P<0.001; 95% CI, 1.41–2.26). (B) sROC
of CCND1 in TC from TCGA and GEO databases was 0.91 (95% CI,
0.89–0.94), which demonstrated that CCND1 probably plays crucial
role in distinguishing TC from non-cancerous tissues. The pooled
sensitivity and specificity at 0.85 (95% CI, 0.81–0.89) and 0.98
(95% CI, 0.90–1.00), respectively. (C) Begg's test. (D) Egger's
test. CCND1, cyclin D1; TC, thyroid cancer; SMD, standard mean
difference; sROC, summary receiver operating characteristic; TCGA,
The Cancer Genome Atlas; GEO, Gene Expression Omnibus. |
| Table IV.General characteristics of included
microarray and RNA sequencing datasets. |
Table IV.
General characteristics of included
microarray and RNA sequencing datasets.
| Authors, year | Country | Dataset | Cancer group | Non-cancer
groups | Refs. |
|---|
| TCGA, 2018 | USA | TCGA | 513 | 59 | – |
| Reyes et al,
2005 | USA | GSE3678 | 7 | 7 | Unpublished
data |
| Vasko et al,
2007 | USA | GSE6004 | 14 | 4 | (57) |
| Fontaine et
al, 2008 | France | GSE6339 | 20 | 122 | (58) |
| Salvatore et
al, 2007 | USA | GSE9115 | 15 | 4 | (59) |
| Giordano et
al, 2006 | USA | GSE27155 | 78 | 21 | (60) |
| Tomas et al,
2011 | Belgium | GSE29265 | 29 | 20 | Unpublished
data |
| Dom et al,
2012 | Belgium | GSE33630 | 60 | 45 | (61) |
| Handkiewicz-Junak
et al, 2016 | Poland | GSE35570 | 32 | 51 | (62) |
| Barros-Filho et
al, 2015 | Brazil | GSE50901 | 61 | 4 | (63) |
| Pita et al,
2014 | Portugal | GSE53072 | 5 | 4 | (64) |
| Pita et al,
2009 | Portugal | GSE53157 | 24 | 3 | (65) |
| Rusinek et
al, 2015 | Poland | GSE58689 | 27 | 18 | (66) |
| von Roemeling et
al, 2015 | USA | GSE65144 | 12 | 13 | (67) |
| Table V.Clinical parameters and CCND1
expression in TC from The Cancer Genome Atlas. |
Table V.
Clinical parameters and CCND1
expression in TC from The Cancer Genome Atlas.
|
|
| CCND1
expression |
|---|
|
|
|
|
|---|
| Clinicopathological
feature | Cases | Mean ± SD | t/F value | P-value |
|---|
| Tissue |
|
Non-cancerous tissues | 59 | 11.66±0.49 | −23.800 | <0.001 |
| TC | 513 | 13.36±0.74 |
|
|
| Sex |
|
Male | 136 | 13.33±0.80 |
−0.574 |
0.566 |
|
Female | 369 | 13.37±0.72 |
|
|
| Pathologic tumor
grade |
| Stage
I–II | 336 | 13.33±0.77 |
−1.269 |
0.205 |
| Stage
III–IV | 167 | 13.42±0.68 |
|
|
| Age |
|
<60 | 385 | 13.38±0.73 |
1.114 |
0.266 |
|
≥60 | 120 | 13.30±0.78 |
|
|
| TNM stage |
|
T1-T2 | 309 | 13.33±0.74 |
−1.148 |
0.251 |
|
T3-T4 | 194 | 13.41±0.74 |
|
|
| Pathological lymph
node |
| No | 230 | 13.32±0.84 |
−1.849 |
0.065 |
|
Yes | 225 | 13.44±0.55 |
|
|
| Metastasis |
| No | 282 | 13.40±0.63 |
−0.662 |
0.508 |
|
Yes | 9 | 13.55±0.71 |
|
|
| Ethnicity |
|
Caucasian | 334 | 13.38±0.69 |
1.278 |
0.280 |
|
African-American | 27 | 13.58±0.43 |
|
|
|
Asian | 51 | 13.45±0.73 |
|
|
Validation of the targeting regulatory
relation between miR-193a-3p and CCND1
The putative miR-193a-3p binding site in CCND1 3′
UTR was identified (Fig. 9A). The
targeting regulatory association between miR-193a-3p and CCND1 was
investigated in 293 cells following transfection with miR-193a-3p
or miR-146b-5p mimics. The findings indicated that miR-193a-3p
reduced the luciferase activity of the Wt CCND1 3′ UTR,
demonstrating a direct combination between CCND1 and miR-193a-3p
(P<0.05; Fig. 9B-D).
Furthermore, the luciferase activity of CCND1 3′ UTR (Mut) was not
reduced in the mimic-transfected cells. miR-146-5p reduced the
luciferase activity of the Wt TRAF6-3′ UTR, indicating that the
experiment and its results were reliable. Pearson correlation
analysis was also conducted to evaluate the association between
miR-193a-3p and CCND1; however, no linear correlation was observed
between CCND1 and miR-193a-3p (r=−0.163; Fig. 9E). The Human Protein Atlas database
was utilized to explore the protein levels of CCND1. Consistent
with the gene expression data, CCND1 protein expression was higher
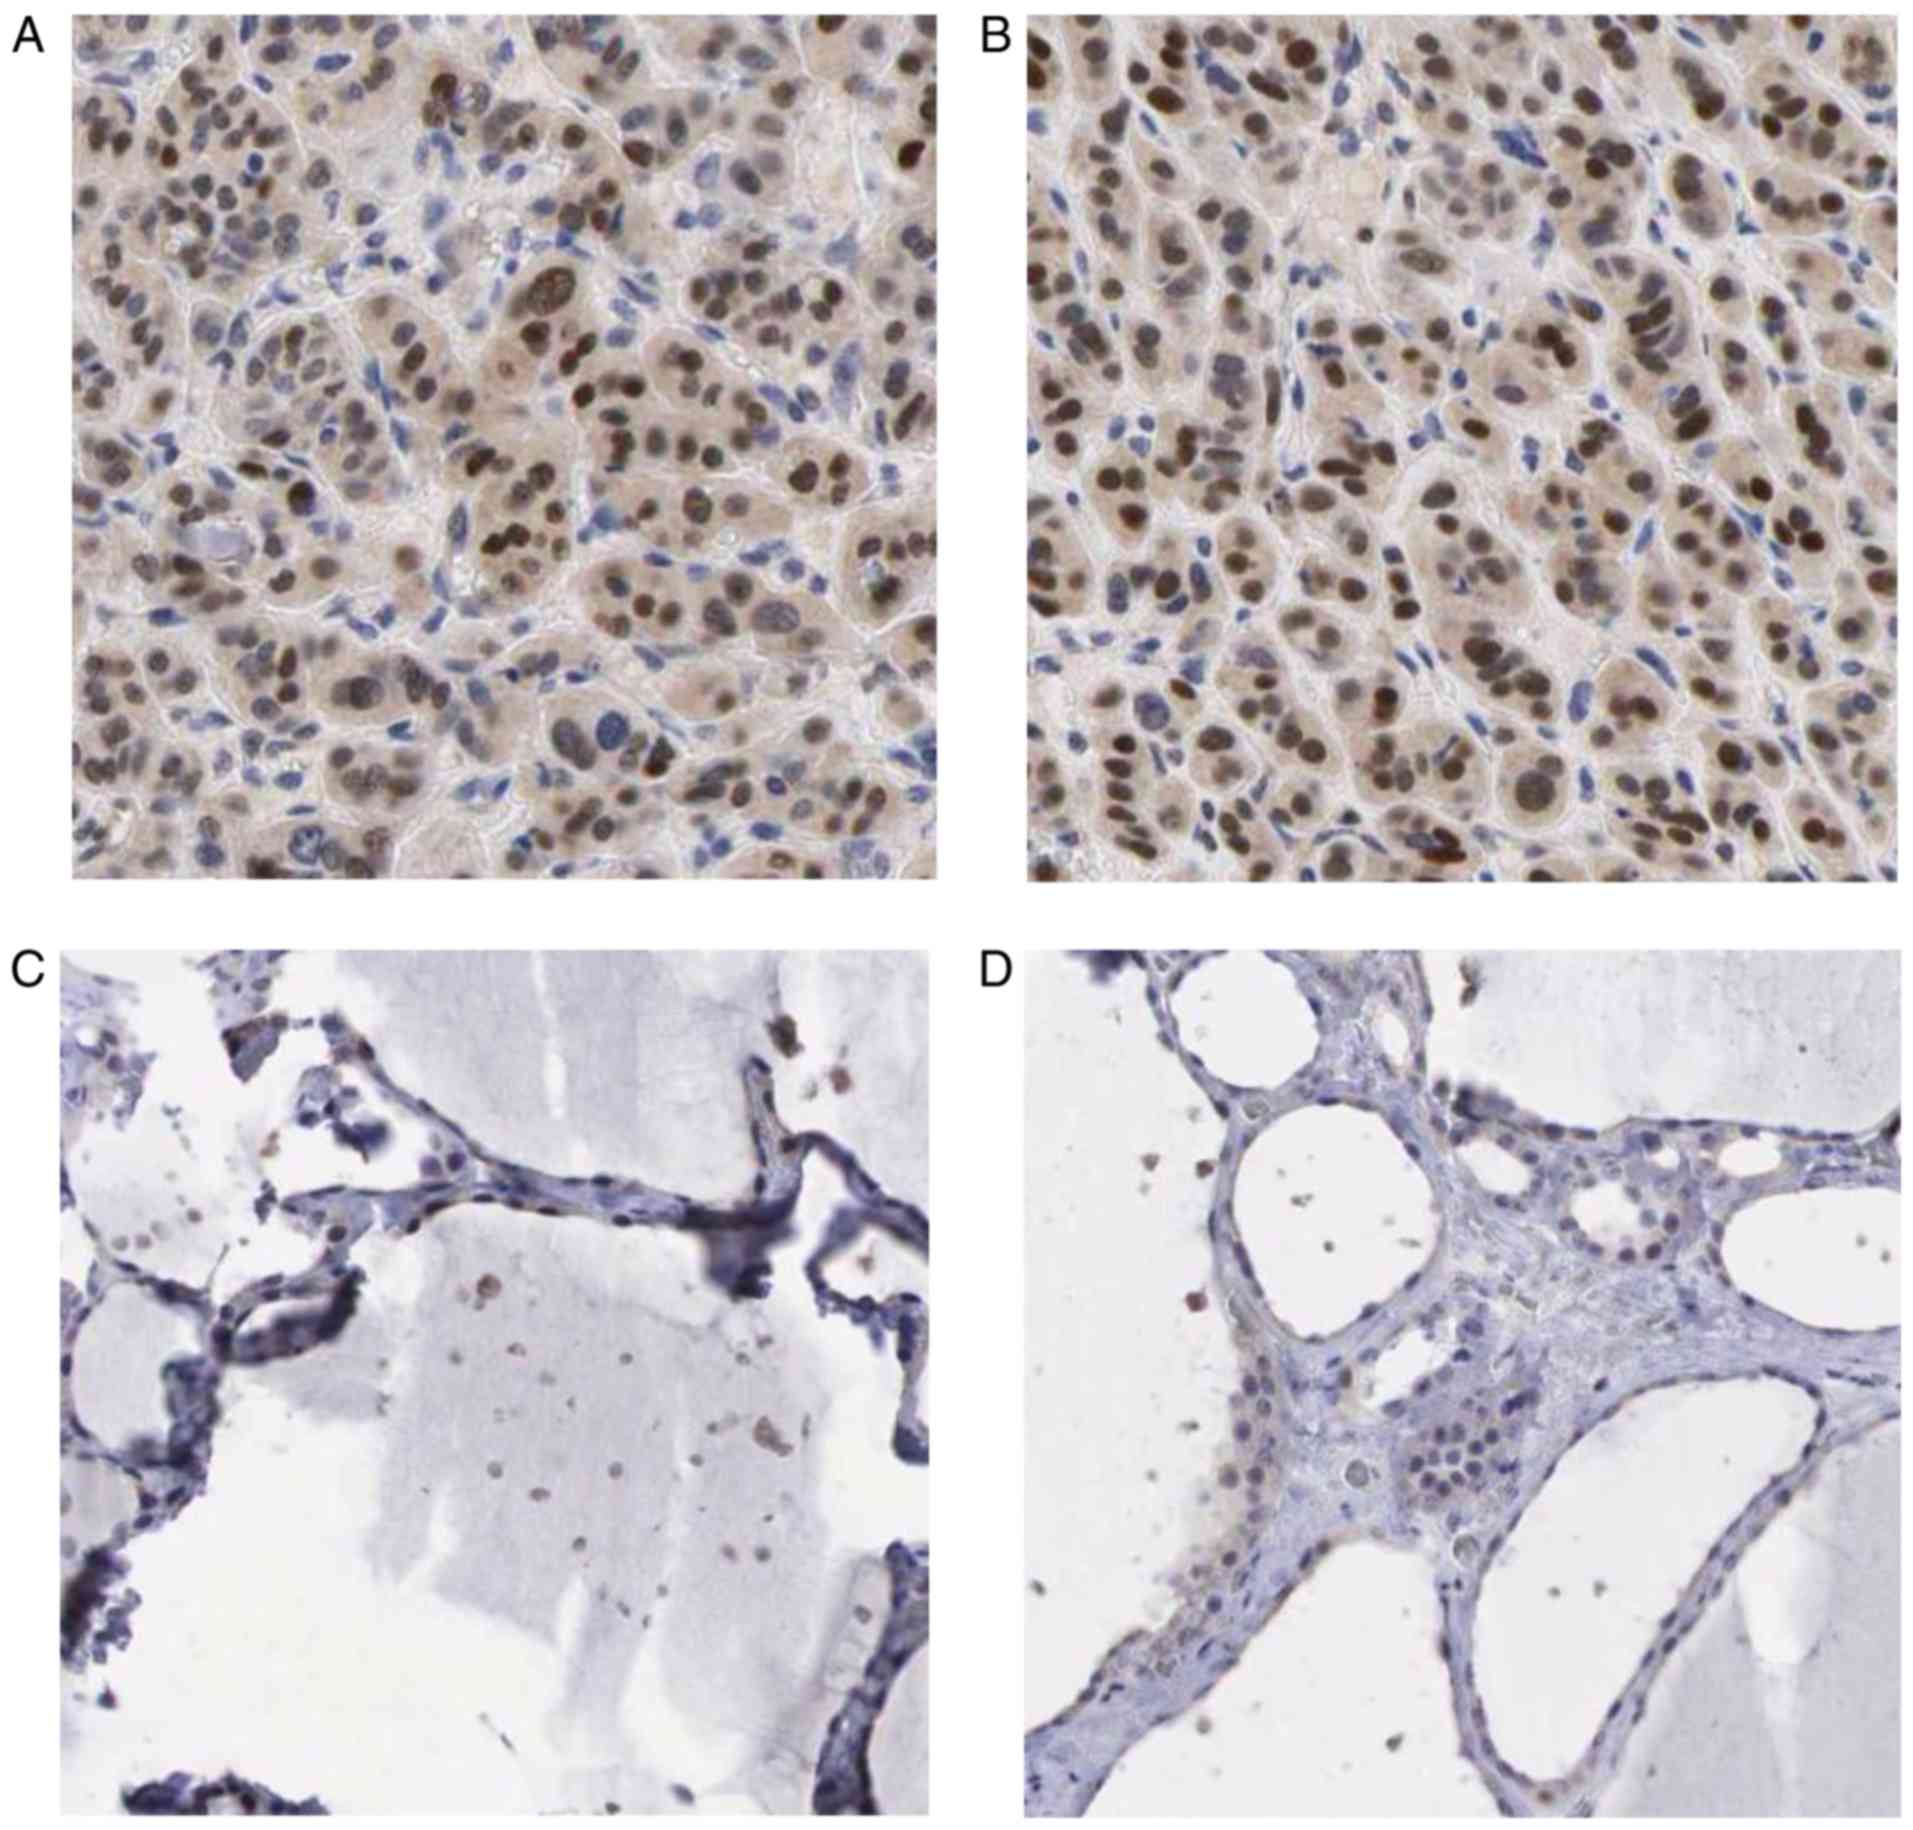
in TC than in non-cancerous tissues, as shown in Fig. 10.
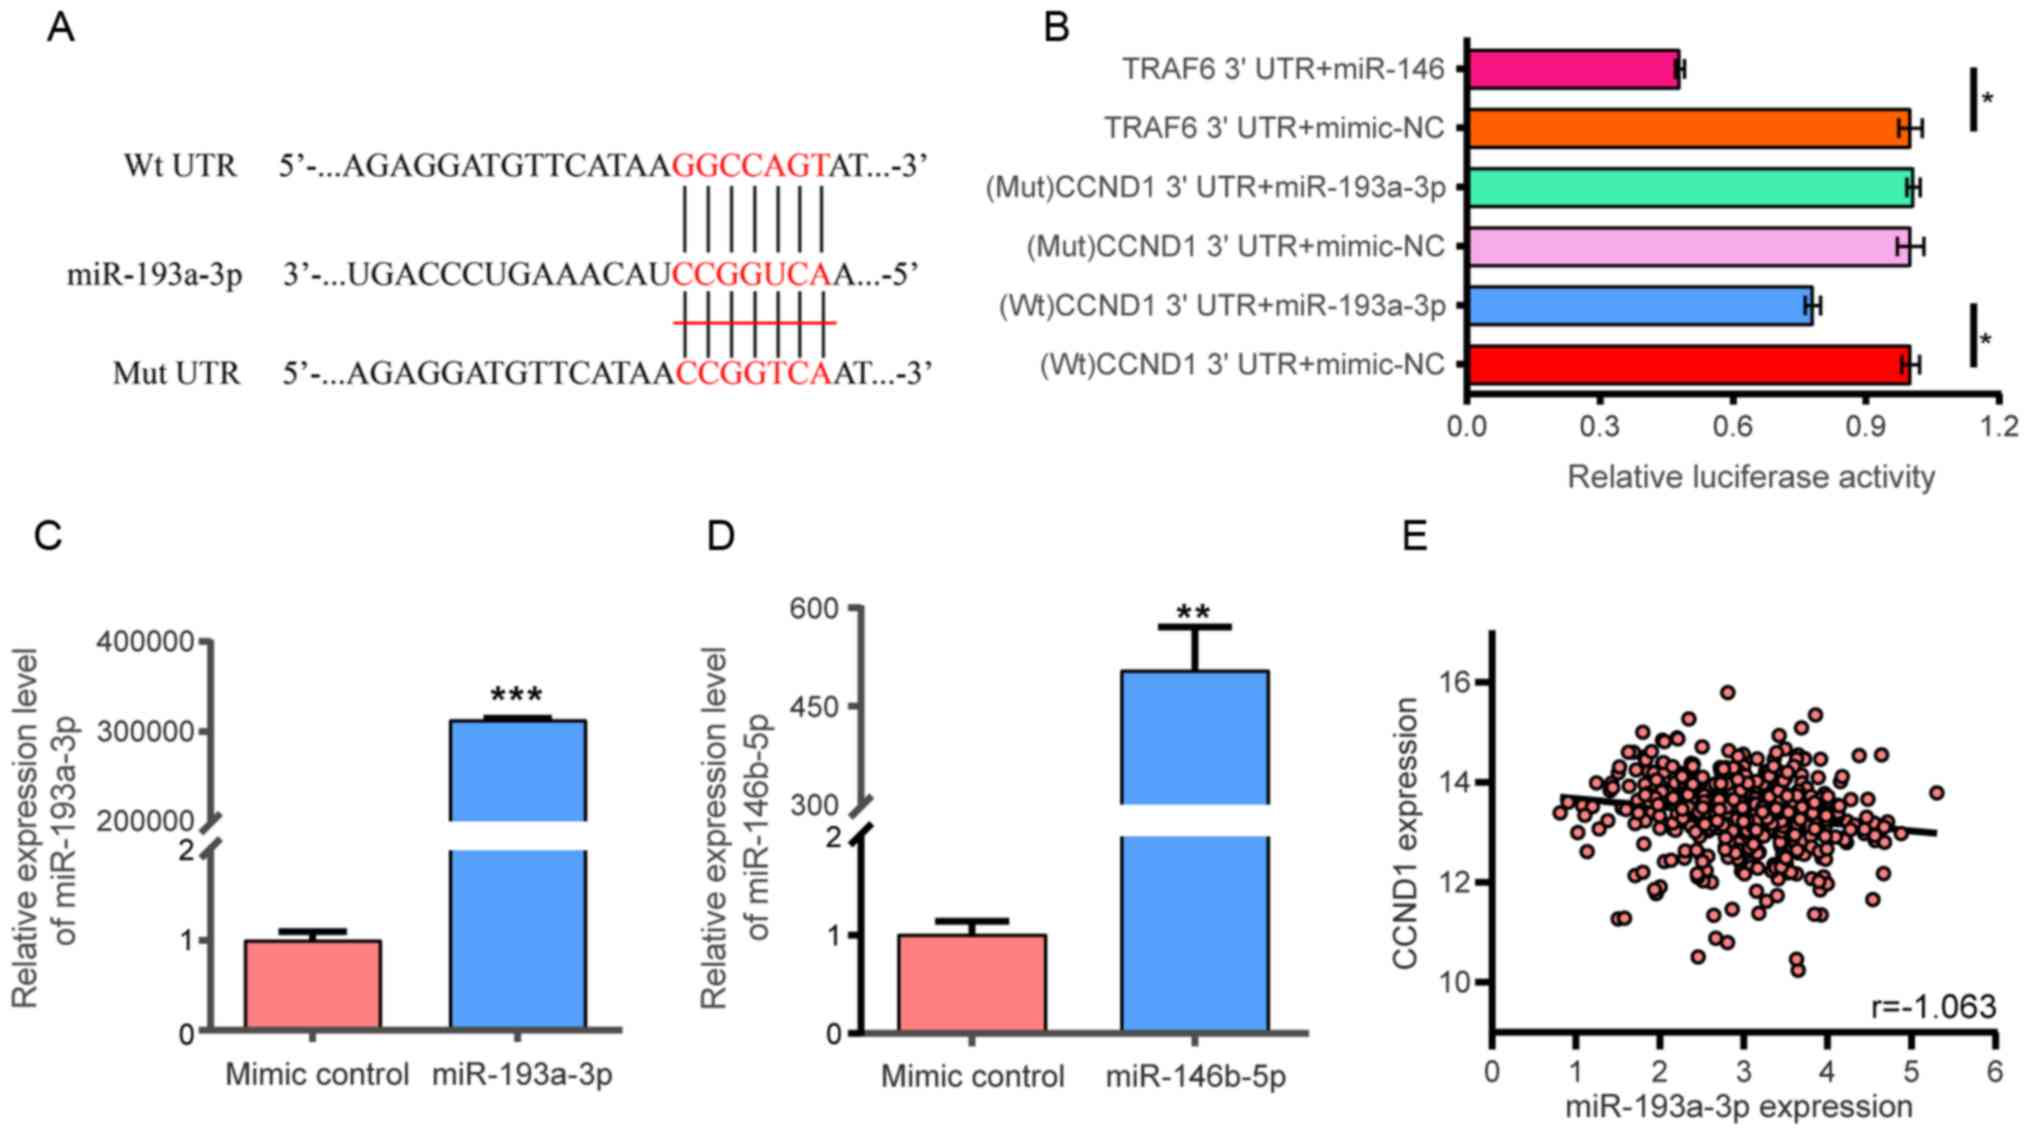 | Figure 9.Dual luciferase assay. (A)
miR-193a-3p binding site in the 3′ UTR region of CCND1. (B) After
co-transfection into 293 cells, miR-193a-3p reduced the luciferase
activity of the CCND1 3′ UTR (P<0.05). TRAF6 3′ UTR + mimic-NC
and TRAF6 3′ UTR + miR-146 were used as positive control. The
x-axis represented the relative fluorescence value. The y-axis
represented different test groups. *P<0.05. Expression of (C)
miR-193a-3p and (D) miR-146 in 293 cells following transfection
with mimic. **P<0.01, ***P<0.001 vs. mimic control. (E)
Pearson's correlation analysis between miR-193a-3p expression
levels and CCND1 levels from TCGA (r=−0.163). miR, microRNA. miR,
microRNA; CCND1, cyclin D1; TNFR6, tumor necrosis factor receptor
associated factor 6; UTR, untranslated region; Wt, wild-type; Mut,
mutant; NC, negative control. |
Discussion
TC is a frequent endocrine malignancy of the
endocrine system (72). The
occurrence rate of TC has been increasing worldwide (73). The main therapy method of TC is
thyroidectomy and radioiodine treatment (74). To the best of the authors'
knowledge, there is currently no effective drug for the treatment
for TC. There is increasing evidence that abnormal miRNA expression
levels give rise to TC tumorigenesis and progression. Prior studies
have demonstrated that various miRNAs may aid in the diagnosis of
TC and help formulate more individualized therapeutic management
strategies (75–78). miR-193a-3p is involved in certain
biological processes, including apoptosis, proliferation, invasion,
metastasis and migration (79). A
number of studies have demonstrated that miR-193a-3p is expressed
at low levels in different human cancers, including colon cancer
(80), lung cancer (81,82),
breast cancer (28) and malignant
pleural mesothelioma (83).
Nevertheless, the expression levels, as well as its mechanisms, in
TC remain to be elucidated. Hence, a comprehensive meta-analysis
was conducted to evaluate clinical valuation of miR-193a-3p in TC.
GO, KEGG pathway and PPI analyses were performed to search for the
latent biological mechanisms of miR-193a-3p in TC. The results
indicated that CCND1 served as the most important hub gene.
Subsequently, the relationship between miR-193a-3p and CCND1 was
validated through a dual luciferase assay.
To the best of the authors' knowledge, the present
study is the first to survey the expression levels and clinical
value of miR-193a-3p in TC by extracting expression data from TCGA,
GEO and ArrayExpress. The present study primarily scrutinized the
miR-193a-3p expression between 510 TC and 59 non-cancerous thyroid
samples using TCGA database. The outcomes revealed that miR-193a-3p
had low expression in TC. Subsequently, the GEO database and
ArrayExpress were used to validate miR-193a-3p expression in TC. A
total of 2 of the 4 chip arrays also revealed that a low
miR-193a-3p expression is significant in TC. Although the remaining
2 chip arrays did not display a significant downregulation in TC
tissues, they indicated the downregulated expression tendency of
miR-193a-3p in TC. According to the results of the present study,
miR-193a-3p may provide a biomarker to test the occurrence and
development of TC. However, in the study by Santarpia et al
(31), the result was the
opposite: miR-193a-3p was overexpressed in TC compared with
non-cancerous groups. The observation of overexpressed miR-193a-3p
may be caused by the small sample size of the study. That
significantly downregulated miR-193a-3p in TC was observed in the
present study was credible due to the quantity of sample data that
was obtained from several public databases. Analysis of the sROC in
miR-193a-3p from TCGA, GEO and ArrayExpress databases demonstrated
that the expression levels may have a moderate ability to
differentiate between TC patients and non-cancerous controls with
an AUC of 0.80. At the same time, its sensitivity and specificity
were 0.69 and 0.82, respectively. Additionally, downregulated
miR-193a-3p was association with age, metastasis and sex in TCGA.
Although the present study identified that downregulated
miR-193a-3p was associated with age, metastasis and sex; how these
factors regulate TC cells requires further investigation by in
vivo and/or in vitro analysis.
At present, several studies have noted that abnormal
miR-193a-3p expression has a pivotal effect on cell biological
processes and leads to numerous pathological conditions (79,80,84).
For example, Pekow et al revealed that miR-193a-3p is a
crucial neoplasm inhibitor in colon carcinoma and facilitates the
progression of cancer (80). Lin
et al (84). demonstrated
that low miR-193a-3p expression is related to a poor disease
outcome in colorectal carcinoma. In addition, miR-193a-3p
suppresses cell multiplication in prostatic carcinoma by targeting
CCND1 (85). However, little
research has been performed into the molecular mechanisms of
miR-193a-3p in TC. To further study the underlying mechanisms
regarding the regulation of miR-193a-3p in TC, the present study
conducted a bioinformatics analysis of the candidate target genes
of miR-193a-3p. A total of 28 candidate target genes of miR-193a-3p
were gathered and GO analysis was performed, which indicated that
the candidate target genes markedly assembled in ‘response to
nutrient levels’ for BP, ‘lamellar body’ for CC and ‘sulfur
compound binding’ for MF. GO analysis revealed that miR-193a-3p
target genes were mainly concentrated in ‘cell adhesion’, which
exerts an oncogenic role in the progression of TC. In addition, PPI
analysis was performed, and it was found that CCND1 was situated at
the core of the PPI network. CCND1 had the most connections among
proteins, which may manifest in the way the gene contributes to
TC.
A previous study by Li et al (35) reported that CCND1 plays a key role
in facilitating migration and tumor metastasis. Liang and Sun
(86) reported that an
upregulation of CCND1 in thyroid cancer tissues is markedly
associated with the clinical stage of TC, indicating that it could
be considered as a biomarker in clinical settings. A study by Jeon
et al (87) showed that
CCND1 is clearly overexpressed in TC, and may be involved in the
occurrence and development of the disease. Lamba Saini et al
(88) demonstrated that CCND1 and
its variants are significantly overexpressed in TC, and that it
should serve as a diagnostic marker for TC. Investigating the
mechanism of CCND1 expression levels is crucial due to the broader
roles of CCND1 in TC tissues. From the present study, the results
calculated from the TCGA database demonstrated that CCND1 exhibited
a notably low expression in TC compared with non-cancerous tissues.
However, differential expression of CCND1 was not obtained for the
clinical parameters analyzed. The present study also included 13
microarrays from the GEO database. In addition to GSE53072,
GSE53157, GSE6339 and GSE65144, other chip arrays all displayed a
significant upregulation of CCND1 expression in TC compared to
non-cancerous tissues. Although the remaining 4 chip arrays did not
show statistical significance, they all showed an increasing trend
in CCND1 expression levels in TC. From the sROC analysis of
miR-193a-3p, the AUC was 0.91. The results showed that CCND1 may
have a high value for differentiating TC from non-cancerous tissue
and may serve as a prognostic biomarker in TC.
The study by Liu et al (85) identified that miR-193a-3p acts as a
key component inhibiting prostate cancer, which could induce
G1-phase arrest by targeting CCND1. Chou et al (25) demonstrated that miR-193a-3p
suppresses the aggression and progression of gastric cancer by
targeting CCND1 expression. Tsai et al (89) also demonstrated that miR-193a-3p
may serve as an underlying neoplasm inhibitor in breast carcinoma,
which could inhibit cell growth by suppressing CCND1. To this end,
the present study performed a dual luciferase assay, and a
regulatory association between miR-193a-3p and CCND1 was validated.
In summary, the findings of the present study revealed that
miR-193a-3p may regulate CCND1 expression to affect the tumor cell
cycle, cell proliferation, differentiation and metabolism.
Nevertheless, further research is required to test this
hypothesis.
However, in the present study, some limitations
should be acknowledged. First, it lacks further in vitro and
in vivo testing, such as reverse transcription-quantitative
PCR. These methods are pivotal to enhancing the understanding of
how miR-193a-3p works in relation to CCND1 in TC. Second, the
present study only focused on the analysis of differential miRNAs
in tissues. Other samples, such as blood, should also be
assessed.
In summary, the present study gathered a great
amount of data from TCGA, GEO, and ArrayExpress databases, and
validated the clinical value of miR-193a-3p and CCND1. The results
showed that miR-193a-3p expression was evidently downregulated in
TC, while CCND1 expression was markedly upregulated. These results
may help to diagnose TC and predict the prognosis of TC when
thyroid tissues are obtained from a fine needle biopsy.
Bioinformatics analysis was next performed to clarify the molecular
mechanisms of miR-193a-3p. In light of the bioinformatics analysis,
CCND1 was regarded as the most important hub gene in TC.
Subsequently, a dual luciferase assay was performed to corroborate
the targeting regulatory association between miR-193a-3p and CCND1.
The results demonstrated that miR-193a-3p markedly contributes to
TC via particular pathways, and both miR-193a-3p and CCND1 may
serve as potential biological markers of TC.
Acknowledgements
Not applicable.
Funding
This study was supported by Fund of National Natural
Science Foundation of China (grant nos. NSFC81060202 and
NSFC81260222), the Fund of Guangxi Key R&D Project Plan (grant
no. AB17195020) and the Future Academic Star of Guangxi Medical
University (grant nos. WLXSZX19050 and WLXSZX19055).
Availability of data and materials
The datasets used and/or analyzed during the current
study are available from the corresponding author on reasonable
request.
Authors' contributions
YYP, HY, XJL and RW contributed to the design of the
study; XJL and RW wrote the manuscript; DYW, PL, DHP, LJZ and YH
collected the data, performed the statistical analysis and
interpreted the data; and LS, YYQ, YHL, JNL, JLY, QQL, JW and JM
contributed to the data collection and statistical analysis. All
authors read and approved the final manuscript.
Ethics approval and consent to
participate
Not applicable.
Patient consent for publication
Not applicable.
Competing interests
The authors declare that they have no competing
interests.
References
|
1
|
Konturek A, Barczyński M, Stopa M and
Nowak W: Trends in Prevalence of Thyroid Cancer Over Three Decades:
A Retrospective Cohort Study of 17,526 Surgical Patients. World J
Surg. 40:538–544. 2016. View Article : Google Scholar : PubMed/NCBI
|
|
2
|
van der Zwan JM, Mallone S, van Dijk B,
Bielska-Lasota M, Otter R, Foschi R, Baudin E and Links TP;
RARECARE WG, : Carcinoma of endocrine organs: Results of the
RARECARE project. Eur J Cancer. 48:1923–1931. 2012. View Article : Google Scholar : PubMed/NCBI
|
|
3
|
Miller KD, Goding Sauer A, Ortiz AP,
Fedewa SA, Pinheiro PS, Tortolero-Luna G, Martinez-Tyson D, Jemal A
and Siegel RL: Cancer Statistics for Hispanics/Latinos, 2018. CA
Cancer J Clin. 68:425–445. 2018. View Article : Google Scholar : PubMed/NCBI
|
|
4
|
Lin P, Guo YN, Shi L, Li XJ, Yang H, He Y,
Li Q, Dang YW, Wei KL and Chen G: Development of a prognostic index
based on an immunogenomic landscape analysis of papillary thyroid
cancer. Aging (Albany NY). 11:480–500. 2019. View Article : Google Scholar : PubMed/NCBI
|
|
5
|
Zarkesh M, Zadeh-Vakili A, Akbarzadeh M,
Fanaei SA, Hedayati M and Azizi F: The role of matrix
metalloproteinase-9 as a prognostic biomarker in papillary thyroid
cancer. BMC Cancer. 18:11992018. View Article : Google Scholar : PubMed/NCBI
|
|
6
|
Siegel RL, Miller KD and Jemal A: Cancer
statistics, 2018. CA Cancer J Clin. 68:7–30. 2018. View Article : Google Scholar : PubMed/NCBI
|
|
7
|
Carling T and Udelsman R: Thyroid cancer.
Annu Rev Med. 65:125–137. 2014. View Article : Google Scholar : PubMed/NCBI
|
|
8
|
Lin P, He Y, Wen DY, Li XJ, Zeng JJ, Mo
WJ, Li Q, Peng JB, Wu YQ, Pan DH, et al: Comprehensive analysis of
the clinical significance and prospective molecular mechanisms of
differentially expressed autophagy-related genes in thyroid cancer.
Int J Oncol. 53:603–619. 2018.PubMed/NCBI
|
|
9
|
Liu C, Su C, Chen Y and Li G: miR-144-3p
promotes the tumor growth and metastasis of papillary thyroid
carcinoma by targeting paired box gene 8. Cancer Cell Int.
18:542018. View Article : Google Scholar : PubMed/NCBI
|
|
10
|
Acquaviva G, Visani M, Repaci A, Rhoden
KJ, de Biase D, Pession A and Giovanni T: Molecular pathology of
thyroid tumours of follicular cells: A review of genetic
alterations and their clinicopathological relevance.
Histopathology. 72:6–31. 2018. View Article : Google Scholar : PubMed/NCBI
|
|
11
|
Riesco-Eizaguirre G and Santisteban P:
Molecular biology of thyroid cancer initiation. Clin Transl Oncol.
9:686–693. 2007. View Article : Google Scholar : PubMed/NCBI
|
|
12
|
DeLellis RA: Pathology and genetics of
thyroid carcinoma. J Surg Oncol. 94:662–669. 2006. View Article : Google Scholar : PubMed/NCBI
|
|
13
|
Liu T, You X, Sui J, Shen B, Zhang Y,
Zhang XM, Yang S, Yao YZ, Yang F, Yin LH, et al: Prognostic value
of a two-microRNA signature for papillary thyroid cancer and a
bioinformatic analysis of their possible functions. J Cell Biochem.
Nov 2–2018.(Epub ahead of print). doi: 10.1002/jcb.27993 2018.
|
|
14
|
Wang X, Huang S, Li X, Jiang D, Yu H, Wu
Q, Gao C and Wu Z: A potential biomarker hsa-miR-200a-5p
distinguishing between benign thyroid tumors with papillary
hyperplasia and papillary thyroid carcinoma. PLoS One.
13:e02002902018. View Article : Google Scholar : PubMed/NCBI
|
|
15
|
Vuong HG, Altibi AM, Abdelhamid AH, Ngoc
PU, Quan VD, Tantawi MY, Elfil M, Vu TL, Elgebaly A, Oishi N, et
al: The changing characteristics and molecular profiles of
papillary thyroid carcinoma over time: A systematic review.
Oncotarget. 8:10637–10649. 2017. View Article : Google Scholar : PubMed/NCBI
|
|
16
|
Tricoli JV and Jacobson JW: MicroRNA:
Potential for Cancer Detection, Diagnosis, and Prognosis. Cancer
Res. 67:4553–4555. 2007. View Article : Google Scholar : PubMed/NCBI
|
|
17
|
Boufraqech M, Klubo-Gwiezdzinska J and
Kebebew E: MicroRNAs in the thyroid. Best Pract Res Clin Endocrinol
Metab. 30:603–619. 2016. View Article : Google Scholar : PubMed/NCBI
|
|
18
|
Macha MA, Seshacharyulu P, Krishn SR, Pai
P, Rachagani S, Jain M and Batra SK: MicroRNAs (miRNAs) as
biomarker(s) for prognosis and diagnosis of gastrointestinal (GI)
cancers. Curr Pharm Des. 20:5287–5297. 2014. View Article : Google Scholar : PubMed/NCBI
|
|
19
|
Parvex P: Are microRNA potential
biomarkers in children with idiopathic nephrotic syndrome?
EBioMedicine. 39:27–28. 2019. View Article : Google Scholar : PubMed/NCBI
|
|
20
|
Farazi TA, Spitzer JI, Morozov P and
Tuschl T: miRNAs in human cancer. J Pathol. 223:102–115. 2011.
View Article : Google Scholar : PubMed/NCBI
|
|
21
|
Li Z, Yu X, Shen J, Law PT, Chan MT and Wu
WK: MicroRNA expression and its implications for diagnosis and
therapy of gallbladder cancer. Oncotarget. 6:13914–13921. 2015.
View Article : Google Scholar : PubMed/NCBI
|
|
22
|
Li L, Peng M, Xue W, Fan Z, Wang T, Lian
J, Zhai Y, Lian W, Qin D and Zhao J: Integrated analysis of
dysregulated long non-coding RNAs/microRNAs/mRNAs in metastasis of
lung adenocarcinoma. J Transl Med. 16:3722018. View Article : Google Scholar : PubMed/NCBI
|
|
23
|
Ma Y and Sun Y: miR-29a-3p inhibits
growth, proliferation, and invasion of papillary thyroid carcinoma
by suppressing NF-κB signaling via direct targeting of OTUB2.
Cancer Manag Res. 11:13–23. 2018. View Article : Google Scholar : PubMed/NCBI
|
|
24
|
Liu Y, Ren F, Luo Y, Rong M, Chen G and
Dang Y: Down-Regulation of miR-193a-3p Dictates Deterioration of
HCC: A Clinical Real-Time qRT-PCR Study. Med Sci Monit.
21:2352–2360. 2015. View Article : Google Scholar : PubMed/NCBI
|
|
25
|
Chou NH, Lo YH, Wang KC, Kang CH, Tsai CY
and Tsai KW: miR-193a-5p and −3p Play a Distinct Role in Gastric
Cancer: miR-193a-3p Suppresses Gastric Cancer Cell Growth by
Targeting ETS1 and CCND1. Anticancer Res. 38:3309–3318. 2018.
View Article : Google Scholar : PubMed/NCBI
|
|
26
|
Huang Y, Luo H, Li F, Yang Y, Ou G, Ye X
and Li N: LINC00152 down-regulated miR-193a-3p to enhance MCL1
expression and promote gastric cancer cells proliferation. Biosci
Rep. 38:BSR201716072018. View Article : Google Scholar : PubMed/NCBI
|
|
27
|
Deng W, Yan M, Yu T, Ge H, Lin H, Li J,
Liu Y, Geng Q, Zhu M, Liu L, et al: Quantitative proteomic analysis
of the metastasis-inhibitory mechanism of miR-193a-3p in non-small
cell lung cancer. Cell Physiol Biochem. 35:1677–1688. 2015.
View Article : Google Scholar : PubMed/NCBI
|
|
28
|
Yu M, Liu Z, Liu Y, Zhou X, Sun F, Liu Y,
Li L, Hua S, Zhao Y, Gao H, et al: PTP1B markedly promotes breast
cancer progression and is regulated by miR-193a-3p. FEBS J.
286:1136–1153. 2019. View Article : Google Scholar : PubMed/NCBI
|
|
29
|
Takahashi H, Takahashi M, Ohnuma S, Unno
M, Yoshino Y, Ouchi K, Takahashi S, Yamada Y, Shimodaira H and
Ishioka C: microRNA-193a-3p is specifically down-regulated and acts
as a tumor suppressor in BRAF-mutated colorectal cancer. BMC
Cancer. 17:7232017. View Article : Google Scholar : PubMed/NCBI
|
|
30
|
Mamoori A, Wahab R, Islam F, Lee K, Vider
J, Lu CT, Gopalan V and Lam AK: Clinical and biological
significance of miR-193a-3p targeted KRAS in colorectal cancer
pathogenesis. Hum Pathol. 71:145–156. 2018. View Article : Google Scholar : PubMed/NCBI
|
|
31
|
Santarpia L, Calin GA, Adam L, Ye L, Fusco
A, Giunti S, Thaller C, Paladini L, Zhang X, Jimenez C, et al: A
miRNA signature associated with human metastatic medullary thyroid
carcinoma. Endocr Relat Cancer. 20:809–823. 2013. View Article : Google Scholar : PubMed/NCBI
|
|
32
|
Baldin V, Lukas J, Marcote MJ, Pagano M
and Draetta G: Cyclin D1 is a nuclear protein required for cell
cycle progression in G1. Genes Dev. 7:812–821. 1993. View Article : Google Scholar : PubMed/NCBI
|
|
33
|
Zhao M, Xu P, Liu Z, Zhen Y, Chen Y, Liu
Y, Fu Q, Deng X, Liang Z, Li Y, et al: Dual roles of miR-374a by
modulated c-Jun respectively targets CCND1-inducing PI3K/AKT signal
and PTEN-suppressing Wnt/β-catenin signaling in non-small-cell lung
cancer. Cell Death Dis. 9:782018. View Article : Google Scholar : PubMed/NCBI
|
|
34
|
Li Y, Li D, Yang W, Fu H, Liu Y and Li Y:
Overexpression of the transcription factor FOXP3 in lung
adenocarcinoma sustains malignant character by promoting G1/S
transition gene CCND1. Tumour Biol. 37:7395–7404. 2016. View Article : Google Scholar : PubMed/NCBI
|
|
35
|
Li Z, Wang C, Prendergast GC and Pestell
RG: Cyclin D1 functions in cell migration. Cell Cycle. 5:2440–2442.
2006. View Article : Google Scholar : PubMed/NCBI
|
|
36
|
Huang H, Han Y, Yang X, Li M, Zhu R, Hu J,
Zhang X, Wei R, Li K and Gao R: HNRNPK inhibits gastric cancer cell
proliferation through p53/p21/CCND1 pathway. Oncotarget.
8:103364–103374. 2017. View Article : Google Scholar : PubMed/NCBI
|
|
37
|
Xue J, Qin Z, Li X, Zhang J, Zheng Y, Xu
W, Cao Q and Wang Z: Genetic polymorphisms in cyclin D1 are
associated with risk of renal cell cancer in the Chinese
population. Oncotarget. 8:80889–80899. 2017. View Article : Google Scholar : PubMed/NCBI
|
|
38
|
Cheng S, Serra S, Mercado M, Ezzat S and
Asa SL: A high-throughput proteomic approach provides distinct
signatures for thyroid cancer behavior. Clin Cancer Res.
17:2385–2394. 2011. View Article : Google Scholar : PubMed/NCBI
|
|
39
|
Deng M, Brägelmann J, Schultze JL and
Perner S: Web-TCGA: An online platform for integrated analysis of
molecular cancer data sets. BMC Bioinformatics. 17:722016.
View Article : Google Scholar : PubMed/NCBI
|
|
40
|
Chandran UR, Medvedeva OP, Barmada MM,
Blood PD, Chakka A, Luthra S, Ferreira A, Wong KF, Lee AV, Zhang Z,
et al: TCGA Expedition: A Data Acquisition and Management System
for TCGA Data. PLoS One. 11:e01653952016. View Article : Google Scholar : PubMed/NCBI
|
|
41
|
Barrett T, Wilhite SE, Ledoux P,
Evangelista C, Kim IF, Tomashevsky M, Marshall KA, Phillippy KH,
Sherman PM, Holko M, et al: NCBI GEO: Archive for functional
genomics data sets - update. Nucleic Acids Res 41D. D991–D995.
2013.
|
|
42
|
Lassalle S, Zangari J, Popa A, Ilie M,
Hofman V, Long E, Patey M, Tissier F, Belléannée G, Trouette H, et
al: MicroRNA-375/SEC23A as biomarkers of the in vitro efficacy of
vandetanib. Oncotarget. 7:30461–30478. 2016. View Article : Google Scholar : PubMed/NCBI
|
|
43
|
Minna E, Romeo P, Dugo M, De Cecco L,
Todoerti K, Pilotti S, Perrone F, Seregni E, Agnelli L, Neri A, et
al: miR-451a is underexpressed and targets AKT/mTOR pathway in
papillary thyroid carcinoma. Oncotarget. 7:12731–12747. 2016.
View Article : Google Scholar : PubMed/NCBI
|
|
44
|
Rossing M, Borup R, Henao R, Winther O,
Vikesaa J, Niazi O, Godballe C, Krogdahl A, Glud M, Hjort-Sørensen
C, et al: Down-regulation of microRNAs controlling tumourigenic
factors in follicular thyroid carcinoma. J Mol Endocrinol.
48:11–23. 2012. View Article : Google Scholar : PubMed/NCBI
|
|
45
|
Ioannidis JP, Patsopoulos NA and Evangelou
E: Uncertainty in heterogeneity estimates in meta-analyses. BMJ.
335:914–916. 2007. View Article : Google Scholar : PubMed/NCBI
|
|
46
|
Gan BL, He RQ, Zhang Y, Wei DM, Hu XH and
Chen G: Downregulation of HOXA3 in lung adenocarcinoma and its
relevant molecular mechanism analysed by RT-qPCR, TCGA and in
silico analysis. Int J Oncol. 53:1557–1579. 2018.PubMed/NCBI
|
|
47
|
Deng Y, He R, Zhang R, Gan B, Zhang Y,
Chen G and Hu X: The expression of HOXA13 in lung adenocarcinoma
and its clinical significance: A study based on The Cancer Genome
Atlas, Oncomine and reverse transcription-quantitative polymerase
chain reaction. Oncol Lett. 15:8556–8572. 2018.PubMed/NCBI
|
|
48
|
Liang YY, Huang JC, Tang RX, Chen WJ, Chen
P, Cen WL, Shi K, Gao L, Gao X, Liu AG, et al: Clinical value of
miR-198-5p in lung squamous cell carcinoma assessed using
microarray and RT-qPCR. World J Surg Oncol. 16:222018. View Article : Google Scholar : PubMed/NCBI
|
|
49
|
Ritchie ME, Phipson B, Wu D, Hu Y, Law CW,
Shi W and Smyth GK: limma powers differential expression analyses
for RNA-sequencing and microarray studies. Nucleic Acids Res.
43:e472015. View Article : Google Scholar : PubMed/NCBI
|
|
50
|
Bardou P, Mariette J, Escudié F, Djemiel C
and Klopp C: jvenn: An interactive Venn diagram viewer. BMC
Bioinformatics. 15:2932014. View Article : Google Scholar : PubMed/NCBI
|
|
51
|
The Gene Ontology Consortium, . The Gene
Ontology Resource: 20 years and still GOing strong. Nucleic Acids
Res. 47(D1): D330–D338. 2019. View Article : Google Scholar : PubMed/NCBI
|
|
52
|
Kanehisa M, Sato Y, Furumichi M, Morishima
K and Tanabe M: New approach for understanding genome variations in
KEGG. Nucleic Acids Res 47D. D590–D595. 2019. View Article : Google Scholar
|
|
53
|
Schriml LM, Mitraka E, Munro J, Tauber B,
Schor M, Nickle L, Felix V, Jeng L, Bearer C, Lichenstein R, et al:
Human Disease Ontology 2018 update: Classification, content and
workflow expansion. Nucleic Acids Res 47D. D955–D962. 2019.
View Article : Google Scholar
|
|
54
|
Yu G, Wang LG, Han Y and He QY:
clusterProfiler: An R package for comparing biological themes among
gene clusters. OMICS. 16:284–287. 2012. View Article : Google Scholar : PubMed/NCBI
|
|
55
|
Wickham H: ggplot2: Elegant Graphics for
Data Analysis. Springer; New York, NY: 2016
|
|
56
|
Szklarczyk D, Gable AL, Lyon D, Junge A,
Wyder S, Huerta-Cepas J, Simonovic M, Doncheva NT, Morris JH, Bork
P, et al: STRING v11: Protein-protein association networks with
increased coverage, supporting functional discovery in genome-wide
experimental datasets. Nucleic Acids Res 47D. D607–D613. 2019.
View Article : Google Scholar
|
|
57
|
Vasko V, Espinosa AV, Scouten W, He H,
Auer H, Liyanarachchi S, Larin A, Savchenko V, Francis GL, de la
Chapelle A, et al: Gene expression and functional evidence of
epithelial-to-mesenchymal transition in papillary thyroid carcinoma
invasion. Proc Natl Acad Sci USA. 104:2803–2808. 2007. View Article : Google Scholar : PubMed/NCBI
|
|
58
|
Fontaine JF, Mirebeau-Prunier D, Franc B,
Triau S, Rodien P, Houlgatte R, Malthièry Y and Savagner F:
Microarray analysis refines classification of non-medullary thyroid
tumours of uncertain malignancy. Oncogene. 27:2228–2236. 2008.
View Article : Google Scholar : PubMed/NCBI
|
|
59
|
Salvatore G, Nappi TC, Salerno P, Jiang Y,
Garbi C, Ugolini C, Miccoli P, Basolo F, Castellone MD, Cirafici
AM, et al: A cell proliferation and chromosomal instability
signature in anaplastic thyroid carcinoma. Cancer Res.
67:10148–10158. 2007. View Article : Google Scholar : PubMed/NCBI
|
|
60
|
Giordano TJ, Au AY, Kuick R, Thomas DG,
Rhodes DR, Wilhelm KG Jr, Vinco M, Misek DE, Sanders D, Zhu Z, et
al: Delineation, functional validation, and bioinformatic
evaluation of gene expression in thyroid follicular carcinomas with
the PAX8-PPARG translocation. Clin Cancer Res. 12:1983–1993. 2006.
View Article : Google Scholar : PubMed/NCBI
|
|
61
|
Dom G, Tarabichi M, Unger K, Thomas G,
Oczko-Wojciechowska M, Bogdanova T, Jarzab B, Dumont JE, Detours V
and Maenhaut C: A gene expression signature distinguishes normal
tissues of sporadic and radiation-induced papillary thyroid
carcinomas. Br J Cancer. 107:994–1000. 2012. View Article : Google Scholar : PubMed/NCBI
|
|
62
|
Handkiewicz-Junak D, Swierniak M, Rusinek
D, Oczko-Wojciechowska M, Dom G, Maenhaut C, Unger K, Detours V,
Bogdanova T, Thomas G, et al: Gene signature of the post-Chernobyl
papillary thyroid cancer. Eur J Nucl Med Mol Imaging. 43:1267–1277.
2016. View Article : Google Scholar : PubMed/NCBI
|
|
63
|
Barros-Filho MC, Marchi FA, Pinto CA,
Rogatto SR and Kowalski LP: High Diagnostic Accuracy Based on
CLDN10, HMGA2, and LAMB3 Transcripts in Papillary Thyroid
Carcinoma. J Clin Endocrinol Metab. 100:E890–E899. 2015. View Article : Google Scholar : PubMed/NCBI
|
|
64
|
Pita JM, Figueiredo IF, Moura MM, Leite V
and Cavaco BM: Cell cycle deregulation and TP53 and RAS mutations
are major events in poorly differentiated and undifferentiated
thyroid carcinomas. J Clin Endocrinol Metab. 99:E497–E507. 2014.
View Article : Google Scholar : PubMed/NCBI
|
|
65
|
Pita JM, Banito A, Cavaco BM and Leite V:
Gene expression profiling associated with the progression to poorly
differentiated thyroid carcinomas. Br J Cancer. 101:1782–1791.
2009. View Article : Google Scholar : PubMed/NCBI
|
|
66
|
Rusinek D, Swierniak M, Chmielik E, Kowal
M, Kowalska M, Cyplinska R, Czarniecka A, Piglowski W, Korfanty J,
Chekan M, et al: BRAFV600E-Associated Gene Expression Profile:
Early Changes in the Transcriptome, Based on a Transgenic Mouse
Model of Papillary Thyroid Carcinoma. PLoS One. 10:e01436882015.
View Article : Google Scholar : PubMed/NCBI
|
|
67
|
von Roemeling CA, Marlow LA, Pinkerton AB,
Crist A, Miller J, Tun HW, Smallridge RC and Copland JA: Aberrant
lipid metabolism in anaplastic thyroid carcinoma reveals stearoyl
CoA desaturase 1 as a novel therapeutic target. J Clin Endocrinol
Metab. 100:E697–E709. 2015. View Article : Google Scholar : PubMed/NCBI
|
|
68
|
Livak KJ and Schmittgen TD: Analysis of
relative gene expression data using real-time quantitative PCR and
the 2(-Delta Delta C(T)) Method. Methods. 25:402–408. 2001.
View Article : Google Scholar : PubMed/NCBI
|
|
69
|
Liu J, Xu J, Li H, Sun C, Yu L, Li Y, Shi
C, Zhou X, Bian X, Ping Y, et al: miR-146b-5p functions as a tumor
suppressor by targeting TRAF6 and predicts the prognosis of human
gliomas. Oncotarget. 6:29129–29142. 2015. View Article : Google Scholar : PubMed/NCBI
|
|
70
|
Xiong DD, Li ZY, Liang L, He RQ, Ma FC,
Luo DZ, Hu XH and Chen G: The LncRNA NEAT1 Accelerates Lung
Adenocarcinoma Deterioration and Binds to Mir-193a-3p as a
Competitive Endogenous RNA. Cell Physiol Biochem. 48:905–918. 2018.
View Article : Google Scholar : PubMed/NCBI
|
|
71
|
Uhlén M, Fagerberg L, Hallström BM,
Lindskog C, Oksvold P, Mardinoglu A, Sivertsson Å, Kampf C,
Sjöstedt E, Asplund A, et al: Proteomics. Tissue-based map of the
human proteome. Science. 347:12604192015. View Article : Google Scholar : PubMed/NCBI
|
|
72
|
Kitahara CM and Sosa JA: The changing
incidence of thyroid cancer. Nat Rev Endocrinol. 12:646–653. 2016.
View Article : Google Scholar : PubMed/NCBI
|
|
73
|
Vigneri R, Malandrino P and Vigneri P: The
changing epidemiology of thyroid cancer: Why is incidence
increasing? Curr Opin Oncol. 27:1–7. 2015. View Article : Google Scholar : PubMed/NCBI
|
|
74
|
Raue F and Frank-Raue K: Thyroid Cancer:
Risk-Stratified Management and Individualized Therapy. Clin Cancer
Res. 22:5012–5021. 2016. View Article : Google Scholar : PubMed/NCBI
|
|
75
|
Qiu J, Zhang W, Zang C, Liu X, Liu F, Ge
R, Sun Y and Xia Q: Identification of key genes and miRNAs markers
of papillary thyroid cancer. Biol Res. 51:452018. View Article : Google Scholar : PubMed/NCBI
|
|
76
|
Nixon AM, Provatopoulou X, Kalogera E,
Zografos GN and Gounaris A: Circulating thyroid cancer biomarkers:
Current limitations and future prospects. Clin Endocrinol (Oxf).
87:117–126. 2017. View Article : Google Scholar : PubMed/NCBI
|
|
77
|
Zhang Y, Pan J, Xu D, Yang Z, Sun J, Sun
L, Wu Y and Qiao H: Combination of serum microRNAs and ultrasound
profile as predictive biomarkers of diagnosis and prognosis for
papillary thyroid microcarcinoma. Oncol Rep. 40:3611–3624.
2018.PubMed/NCBI
|
|
78
|
Nikiforov YE: Role Of Molecular Markers In
Thyroid Nodule Management: Then And Now. Endocr Pract. 23:979–988.
2017. View Article : Google Scholar : PubMed/NCBI
|
|
79
|
Grossi I, Salvi A, Abeni E, Marchina E and
De Petro G: Biological Function of MicroRNA193a-3p in Health and
Disease. Int J Genomics. 2017:59131952017. View Article : Google Scholar : PubMed/NCBI
|
|
80
|
Pekow J, Meckel K, Dougherty U, Huang Y,
Chen X, Almoghrabi A, Mustafi R, Ayaloglu-Butun F, Deng Z, Haider
HI, et al: miR-193a-3p is a Key Tumor Suppressor in Ulcerative
Colitis-Associated Colon Cancer and Promotes Carcinogenesis through
Upregulation of IL17RD. Clin Cancer Res. 23:5281–5291. 2017.
View Article : Google Scholar : PubMed/NCBI
|
|
81
|
Fan Q, Hu X, Zhang H, Wang S, Zhang H, You
C, Zhang CY, Liang H, Chen X and Ba Y: miR-193a-3p is an Important
Tumour Suppressor in Lung Cancer and Directly Targets KRAS. Cell
Physiol Biochem. 44:1311–1324. 2017. View Article : Google Scholar : PubMed/NCBI
|
|
82
|
Ren F, Ding H, Huang S, Wang H, Wu M, Luo
D, Dang Y, Yang L and Chen G: Expression and clinicopathological
significance of miR-193a-3p and its potential target astrocyte
elevated gene-1 in non-small lung cancer tissues. Cancer Cell Int.
15:802015. View Article : Google Scholar : PubMed/NCBI
|
|
83
|
Williams M, Kirschner MB, Cheng YY, Hanh
J, Weiss J, Mugridge N, Wright CM, Linton A, Kao SC, Edelman JJ, et
al: miR-193a-3p is a potential tumor suppressor in malignant
pleural mesothelioma. Oncotarget. 6:23480–23495. 2015. View Article : Google Scholar : PubMed/NCBI
|
|
84
|
Lin M, Duan B, Hu J, Yu H, Sheng H, Gao H
and Huang J: Decreased expression of miR-193a-3p is associated with
poor prognosis in colorectal cancer. Oncol Lett. 14:1061–1067.
2017. View Article : Google Scholar : PubMed/NCBI
|
|
85
|
Liu Y, Xu X, Xu X, Li S, Liang Z, Hu Z, Wu
J, Zhu Y, Jin X, Wang X, et al: MicroRNA-193a-3p inhibits cell
proliferation in prostate cancer by targeting cyclin D1. Oncol
Lett. 14:5121–5128. 2017.PubMed/NCBI
|
|
86
|
Liang W and Sun F: Identification of key
genes of papillary thyroid cancer using integrated bioinformatics
analysis. J Endocrinol Invest. 41:1237–1245. 2018. View Article : Google Scholar : PubMed/NCBI
|
|
87
|
Jeon S, Kim Y, Jeong YM, Bae JS and Jung
CK: CCND1 Splice Variant as A Novel Diagnostic and Predictive
Biomarker for Thyroid Cancer. Cancers (Basel). 10:4372018.
View Article : Google Scholar
|
|
88
|
Lamba Saini M, Weynand B, Rahier J, Mourad
M, Hamoir M and Marbaix E: Cyclin D1 in well differentiated thyroid
tumour of uncertain malignant potential. Diagn Pathol. 10:322015.
View Article : Google Scholar : PubMed/NCBI
|
|
89
|
Tsai KW, Leung CM, Lo YH, Chen TW, Chan
WC, Yu SY, Tu YT, Lam HC, Li SC, Ger LP, et al: Arm Selection
Preference of MicroRNA-193a Varies in Breast Cancer. Sci Rep.
6:281762016. View Article : Google Scholar : PubMed/NCBI
|