Introduction
Acute pancreatitis (AP) is a common digestive
disorder with high morbidity and mortality. It has been reported
that in the USA, AP is a leading cause of inpatient care among
gastrointestinal conditions: >275,000 patients are hospitalized
for AP annually (1). AP is the
second leading cause of hospitalization, the largest contributor to
total hospitalization cost and the fifth leading cause of inpatient
mortality (2,3) In China, 20–30% of patients with AP
are clinically dangerous, and the overall case fatality rate is
5–10% (4). At present, the
pathogenic mechanisms of AP remain unclear. Pancreatic acinar
intracellular trypsinogen activation (PAITA) is considered to be an
important cause of AP and is an important event in the early stages
of AP (5). Studies have
demonstrated that normal activation of trypsinogen is a key factor
for the pancreas to maintain normal function and that the abnormal
activation of trypsinogen in pancreatic acinar cells is an
initiating factor for the occurrence of AP (6,7).
Thus, elucidation of the mechanisms underlying trypsinogen
activation and identification of targets that serve key roles in
this process are important for determining the pathogenesis of AP
and providing clinical treatment.
As an important transcription factor, early growth
response 1 (Egr1) is closely associated with the occurrence and
development of various diseases, including AP (8–10).
Ji et al (11) demonstrated
that Egr1 was expressed in pancreatic acinar cells and served a
role in the development of caerulein-induced AP in mice. Gong et
al (12) reported that as a
proinflammatory transcription factor, Egr1 may serve an important
role in the development of early AP by regulating the expression of
tissue factor. These studies suggest that PAITA is likely to be the
most important early event of AP, and that Egr1 may serve a role in
early AP. However, it remains unclear whether Egr1 serves a role in
PAITA.
In recent years, non-coding RNAs have been
demonstrated to serve important roles in the occurrence and
development of a variety of diseases including cancer and leukemia
(13,14). As an important non-coding RNA, long
non-coding RNA (lncRNAs) have been used as a type of competing
endogenous RNA (ceRNA) to affect multiple target genes and
participate in the regulation of various biological processes that
are closely associated with the occurrence, development and
prevention of human diseases (15,16).
lncRNAs can affect mRNA expression by competing for a common
microRNA (miRNA/miR) binding site; the mRNA-miRNA-lncRNA network is
termed a ceRNA network (17).
Studies have confirmed that the lncRNA has a close relationship
with AP. For example, Zhao et al (18) demonstrated that the lncRNA Fendrr
promoted the apoptosis of pancreatic acinar cells in
caerulein-induced AP by interacting with annexin A2. Wang et
al (19) reported that
overexpression of lncRNA B3GALT5-AS1 may alleviate
caerulein-induced cell injury in AR42J cells through the regulation
of miR-203/NFIL3 axis and by inhibiting the activation of the NF-κB
signals. These studies suggested that lncRNAs may be used as an
important target for research and treatment of AP. However, it
remains unclear whether lncRNAs serve a role in PAITA and whether
there is an interaction between Egr1 and PAITA.
The present study used taurolithocholic acid
3-sulfate (TLC-S) to induce AR42J cells to establish a PAITA model.
A gene microarray was used to detect the differential expression of
lncRNAs, miRNAs and mRNAs in PAITA. Bioinformatics analyses were
performed to identify a protein-protein interaction (PPI) network
in PAITA in order to investigate the potential role of Egr1 in
PAITA. Confocal laser microscopy and flow cytometry were then used
to analyze the effects of Egr1 silencing on PAITA. Finally, a ceRNA
regulatory network was established to predict the potential
mechanisms underlying the influence of Egr1 on PAITA. The results
of the present study may provide novel insight for studies into the
pathogenesis and clinical treatment of AP.
Materials and methods
Cell culture and treatment
Cell culture and treatment were performed in
accordance with a previous study (20). The rat pancreatic acinar AR42J
cells were obtained from the China Center for Type Culture
Collection (Wuhan, China) and cultured in F12K medium
(Sigma-Aldrich; Merck KGaA) supplemented with 10% fetal bovine
serum (Gibco; Thermo Fisher Scientific, Inc.) and 100 U/ml
penicillin/streptomycin (Beyotime Institute of Biotechnology) in a
5% CO2 environment at 37°C. A total of 200 µM TLC-S
(Sigma-Aldrich; Merck KGaA) was used to treat AR42J cells for 40
min at 37°C to establish the PAITA cell model as previously
described (21,22).
Measurement of trypsinogen
activation
Quantification of the activity of trypsin serine
protease in intact living acinar cells was performed as previously
described (22). Briefly, after an
equilibration period of 30 min, 200 µM TLC-S was added for 40 min
at 37°C. Acinar cells were washed and resuspended in NaHEPES
without TLC-S, and then supplemented with 10 µM of the
cell-permeant synthetic trypsin substrate
bis-(CBZ-Ile-Pro-Arg)-rhodamine 110 (BZiPAR; Molecular Probes;
Thermo Fisher Scientific, Inc.) and allowed to react in the dark at
37°C for 20 min. BZiPAR is a specific substrate for trypsin that
emits fluorescence after cleavage of the two oligopeptide side
chains. Activation may be observed by fluorescence of rhodamine 110
by using an excitation wavelength of 485 nm. Then 0.5 µg/ml DAPI
(Beyotime Institute of Biotechnology) was used for 5 min at 37°C to
locate the nuclei, which fluoresced green under the laser confocal
microscope). To ensure that the observed tryptic activity was
solely from intracellular enzymes and not from trypsin released
into the extracellular fluid, cells for these experiments were
prepared in NaHEPES containing 5 mM soybean trypsin inhibitor
(SBTI; Sigma-Aldrich; Merck KGaA); the solutions used all contained
SBTI (SBTI and BZiPAR are added to the cell dish together). At this
concentration, SBTI can inhibit 1,000 U/ml trypsin. Trypsin
activity was investigated by flow cytometry [FACSCalibur II, BD
Biosciences; CellQuest software (version 6.0; BD Biosciences) and
Kaluza Analysis software program (version 2.1; Beckman Coulter,
Inc.)] and confocal microscopy (A1R, Nikon Corporation). A total of
5 different fields in each group were randomly chosen to capture
images at 200× magnification.
Detection of mRNAs, lncRNAs and miRNAs
in PAITA
An Agilent-062716 Rat lncRNA Microarray (8×60K;
Agilent Technologies, Inc.) was used to detect the expression of
mRNA and lncRNA in the present study, and then data analyses of the
TLC-S group (trypsinogen activation model; 3 samples) and control
group (untreated AR42J cells; 3 samples) were performed. Total RNA
was quantified using a NanoDrop™ ND-2000 (NanoDrop Technologies;
Thermo Fisher Scientific, Inc.) and the RNA integrity was assessed
using an Agilent Bioanalyzer 2100 (Agilent Technologies, Inc.).
Sample labeling, microarray hybridization and washing were
performed based on the manufacturer's standard protocols. Briefly,
total RNA was reverse transcribed to double-stranded cDNA, then
synthesized into cRNA and labeled with Cyanine-3-CTP. The labeled
cRNAs were hybridized onto the microarray. After washing, the
arrays were scanned by an Agilent G2505C Scanner (Agilent
Technologies, Inc.). Feature Extraction software (version 10.7.1.1,
Agilent Technologies, Inc.) was used to analyze array images.
The miRNA expression analysis was performed using
Affymetrix® GeneChip® miRNA Arrays
(Affymetrix; Thermo Fisher Scientific, Inc.). Poly (A) Tailing,
FlashTag ligation, hybridization, washing, staining, and detection
were performed in accordance with the protocols of the Affymetrix
GeneChip miRNA Arrays using the Library file (http://www.affymetrix.com/support/downloads/manuals/agcc_command_console_user_guide.pdf).
Data were normalized using the median normalization. After
normalization, differentially expressed (DE) miRNAs were identified
through fold change filtering.
Identification of the DE genes in
PAITA
The limma package (http://bioconductor.org/packages/Limma/) (23) in R software (version 3.2.11,
http://www.bioconductor.org/packages/release/bioc/html/clusterProfiler.html)
(24) was used to perform data
preprocessing, including background correction, quantile
normalization and probe summarization, to obtain the probe
expression matrix (25). UCSC
RefSeq database (http://genome.ucsc.edu/), miRBase database 21
(http://mirbase.org/) and NONCODE V4 database
(http://www.noncode.org/) were used to perform the
blast comparison (identity >95%, coverage >95) and obtain the
gene ID (26). Combining the probe
expression matrix, a gene expression matrix was obtained.
Limma was used to identify the DE mRNAs, miRNAs and
lncRNAs. For each significant DE mRNA and lncRNA, the significance
level of differential expression was set to log2 fold change ≥2 and
P<0.05. For each significant DE miRNA, the significance level of
differential expression was set to log2 fold change ≥2. In
addition, MultiExperiment Viewer software 4.6.0 (http://mev.tm4.org/) was used to conduct the cluster
analysis and draw the heatmaps.
PPI network of the DE mRNAs in
PAITA
A PPI network of the DE mRNAs in trypsinogen
activation was obtained from the Search Tool for the Retrieval of
Interacting Genes/Proteins (STRING) database (version 8.0;
www.string-db.org) and analyzed using Limma
(22,27). Cytoscape software (version 3.6.1;
www.cytoscape.org) was used to visualize the PPI
network. The node color of the genes was set to different gradients
according to the fold change and the node size was set according to
the P-value.
Analysis of gene function and
signaling pathway enrichment
The function of DE genes and the enriched signaling
pathway were investigated via Gene Ontology (GO) (28) analysis and Kyoto Encyclopedia of
Genes and Genomes (KEGG) (29)
analysis through the Database for Annotation, Visualization and
Integrated Discovery (DAVID; http://david.ncifcrf.gov). Fisher's exact test was
applied and P<0.05 was considered to indicate a statistically
significant difference.
Small interfering (si)RNA
transfection
siRNAs were transfected into cells using
Lipofectamine® RNAiMAX transfection reagent (cat. no.
13778-150, Gibco; Thermo Fisher Scientific, Inc.). AR42J cells
(1×10⁵ cells) were seeded into six-well plates in
complete DMEM and cultured overnight at 37°C. The siRNA lipoRNAiMAX
mixture was prepared and added to a culture wells containing cells
suspended in 800 µl F12K medium, with a cell density of about
30–40% (2×10⁵ cells). The siRNAs were used at a final
concentrations of 50 nM. After 4–6 h of culture at 37°C, the
culture medium was replaced with fresh medium (containing fetal
bovine serum and penicillin/streptomycin), followed by continuous
culturing for 48 h at 37°C before subsequent experimentation.
The siRNAs were purchased from Shanghai GenePharma
Co., Ltd., and their sequences were as follows: Egr1-siRNA,
5′-CCAGGACUUAAAGGCUCUUTTAAGAGCCUUUAAGUCCUGGTT-3′ and negative
control (NC)-siRNA, 5′-UUCUCCGAACGUGUCACGUTT-3′.
AR42J cells were divided into four experimental
groups: i) Control group, normally cultured AR42J cells; ii)
NC-siRNA group, AR42J cells transfected with negative control
siRNA; iii) TLC-S + NC-siRNA group, AR42J cells transfected with
NC-siRNA and treated with 200 µM TLC-S for 40 min; and iv) TLC-S +
Egr1-siRNA group, AR42J cells transfected with Egr1-siRNA and
treated with 200 µM TLC-S for 40 min.
Reverse transcription-quantitative
(RT-q)PCR
Total RNA from AR42J cell lines was isolated using
TRIzol® reagent (Invitrogen; Thermo Fisher Scientific,
Inc.) and the isolated RNA was reverse transcribed (cat. no.
FSQ-101; Toyobo Life Science): 37°C for 15 min, 50°C for 5 min and
98°C enzyme inactivation reaction for 5 min. RT-qPCR was conducted
using FastStart Universal SYBR-Green Master (ROX; Roche
Diagnostics) and an ABI 7300 system (Applied Biosystems; Thermo
Fisher Scientific, Inc.) under the following conditions: 95°C for
10 min, followed by 40 cycles of 95°C for 2 sec and 60°C for 30
sec, with a final extension at 72°C for 10 min. The primers for
Egr1 and GAPDH were synthesized by Guangzhou RiboBio Co., Ltd. The
relative expression levels of Egr1 were normalized to GAPDH and
quantified using the 2−∆∆Cq method (30). The Egr1 and GAPDH primers were as
follows: Egr1 forward, 5′-ACTGGAGGAGATGATGCTGCTGAG-3′ and reverse,
5′-CCGCTGCTGCTGCTGCTG-3′; and GAPDH forward,
5′-ACAACTTTGGTATCGTGGAAGG-3′ and reverse,
5′-GCCATCAGCCACAGTTC-3′.
Western blotting
For protein analysis, cells were lysed directly in
RIPA buffer (cat. no. P0013K; Beyotime Institute of Biotechnology),
and then centrifuged for 10 min at 12,000 × g at 4°C, and the
protein concentration was determined using the BCA method. The
protein (40 µg) was separated by 8% SDS-PAGE and transferred onto
0.45 µm PVDF membranes. The membranes were blocked with 5% BSA
(A8020; Beyotime Institute of Biotechnology) in PBST (0.1%
Tween-20, cat. no. 9005-64-5; Beyotime Institute of Biotechnology)
for 1 h at room temperature. The membranes were incubated with Egr1
(1:500; cat. no. 4153; Cell Signaling Technology, Inc.) and GAPDH
(1:2,000; cat. no. TA-08; ZSGB-BIO) at 4°C overnight. Membranes
were then incubated with horseradish peroxidase secondary antibody
(1:2,000; cat. no. ZB-2301; OriGene Technologies, Inc.) for 1 h at
room temperature. A MiniChemi imager (Beijing Sage Creation Science
Co., Ltd.) was used to detect the immunoreactivity. The intensity
of the band was relatively quantified using ImageJ software
(version 1.8.0; National Institutes of Health). All proteins were
normalized to the internal control GAPDH.
Establishing the lncRNA-miRNA-mRNA
ceRNA network
According to the results of the differential
expression analysis, significant DE lncRNAs, miRNAs and mRNAs were
filtered to construct an mRNA-miRNA-lncRNA regulatory network. DE
lncRNA and DE miRNA pairs were generated based on the lnCeDB
database (31). DE miRNA and DE
mRNA pairs were generated based on the miRBase database. When
screening the DE lncRNA-miRNA pairs and DE miRNA-mRNA pairs, a
constraint that the regulatory directions of the miRNA and mRNA
must be different was applied. Based on the results,
Cytoscape(version 3.6.1; www.cytoscape.org) was used to construct the
mRNA-miRNA-lncRNA ceRNA network.
Statistical analysis
All data are presented as the mean ± SD. RT-qPCR
data were analyzed with unpaired Student's t-test. The group
differences in flow cytometry analysis were determined with one-way
ANOVA followed by Tukey's post hoc test. Statistical analysis was
performed using GraphPad Prism 5.0 software (GraphPad Software,
Inc.). P<0.05 was considered to indicate a statistically
significant difference.
Results
DE mRNAs, lncRNAs and miRNAs in
PAITA
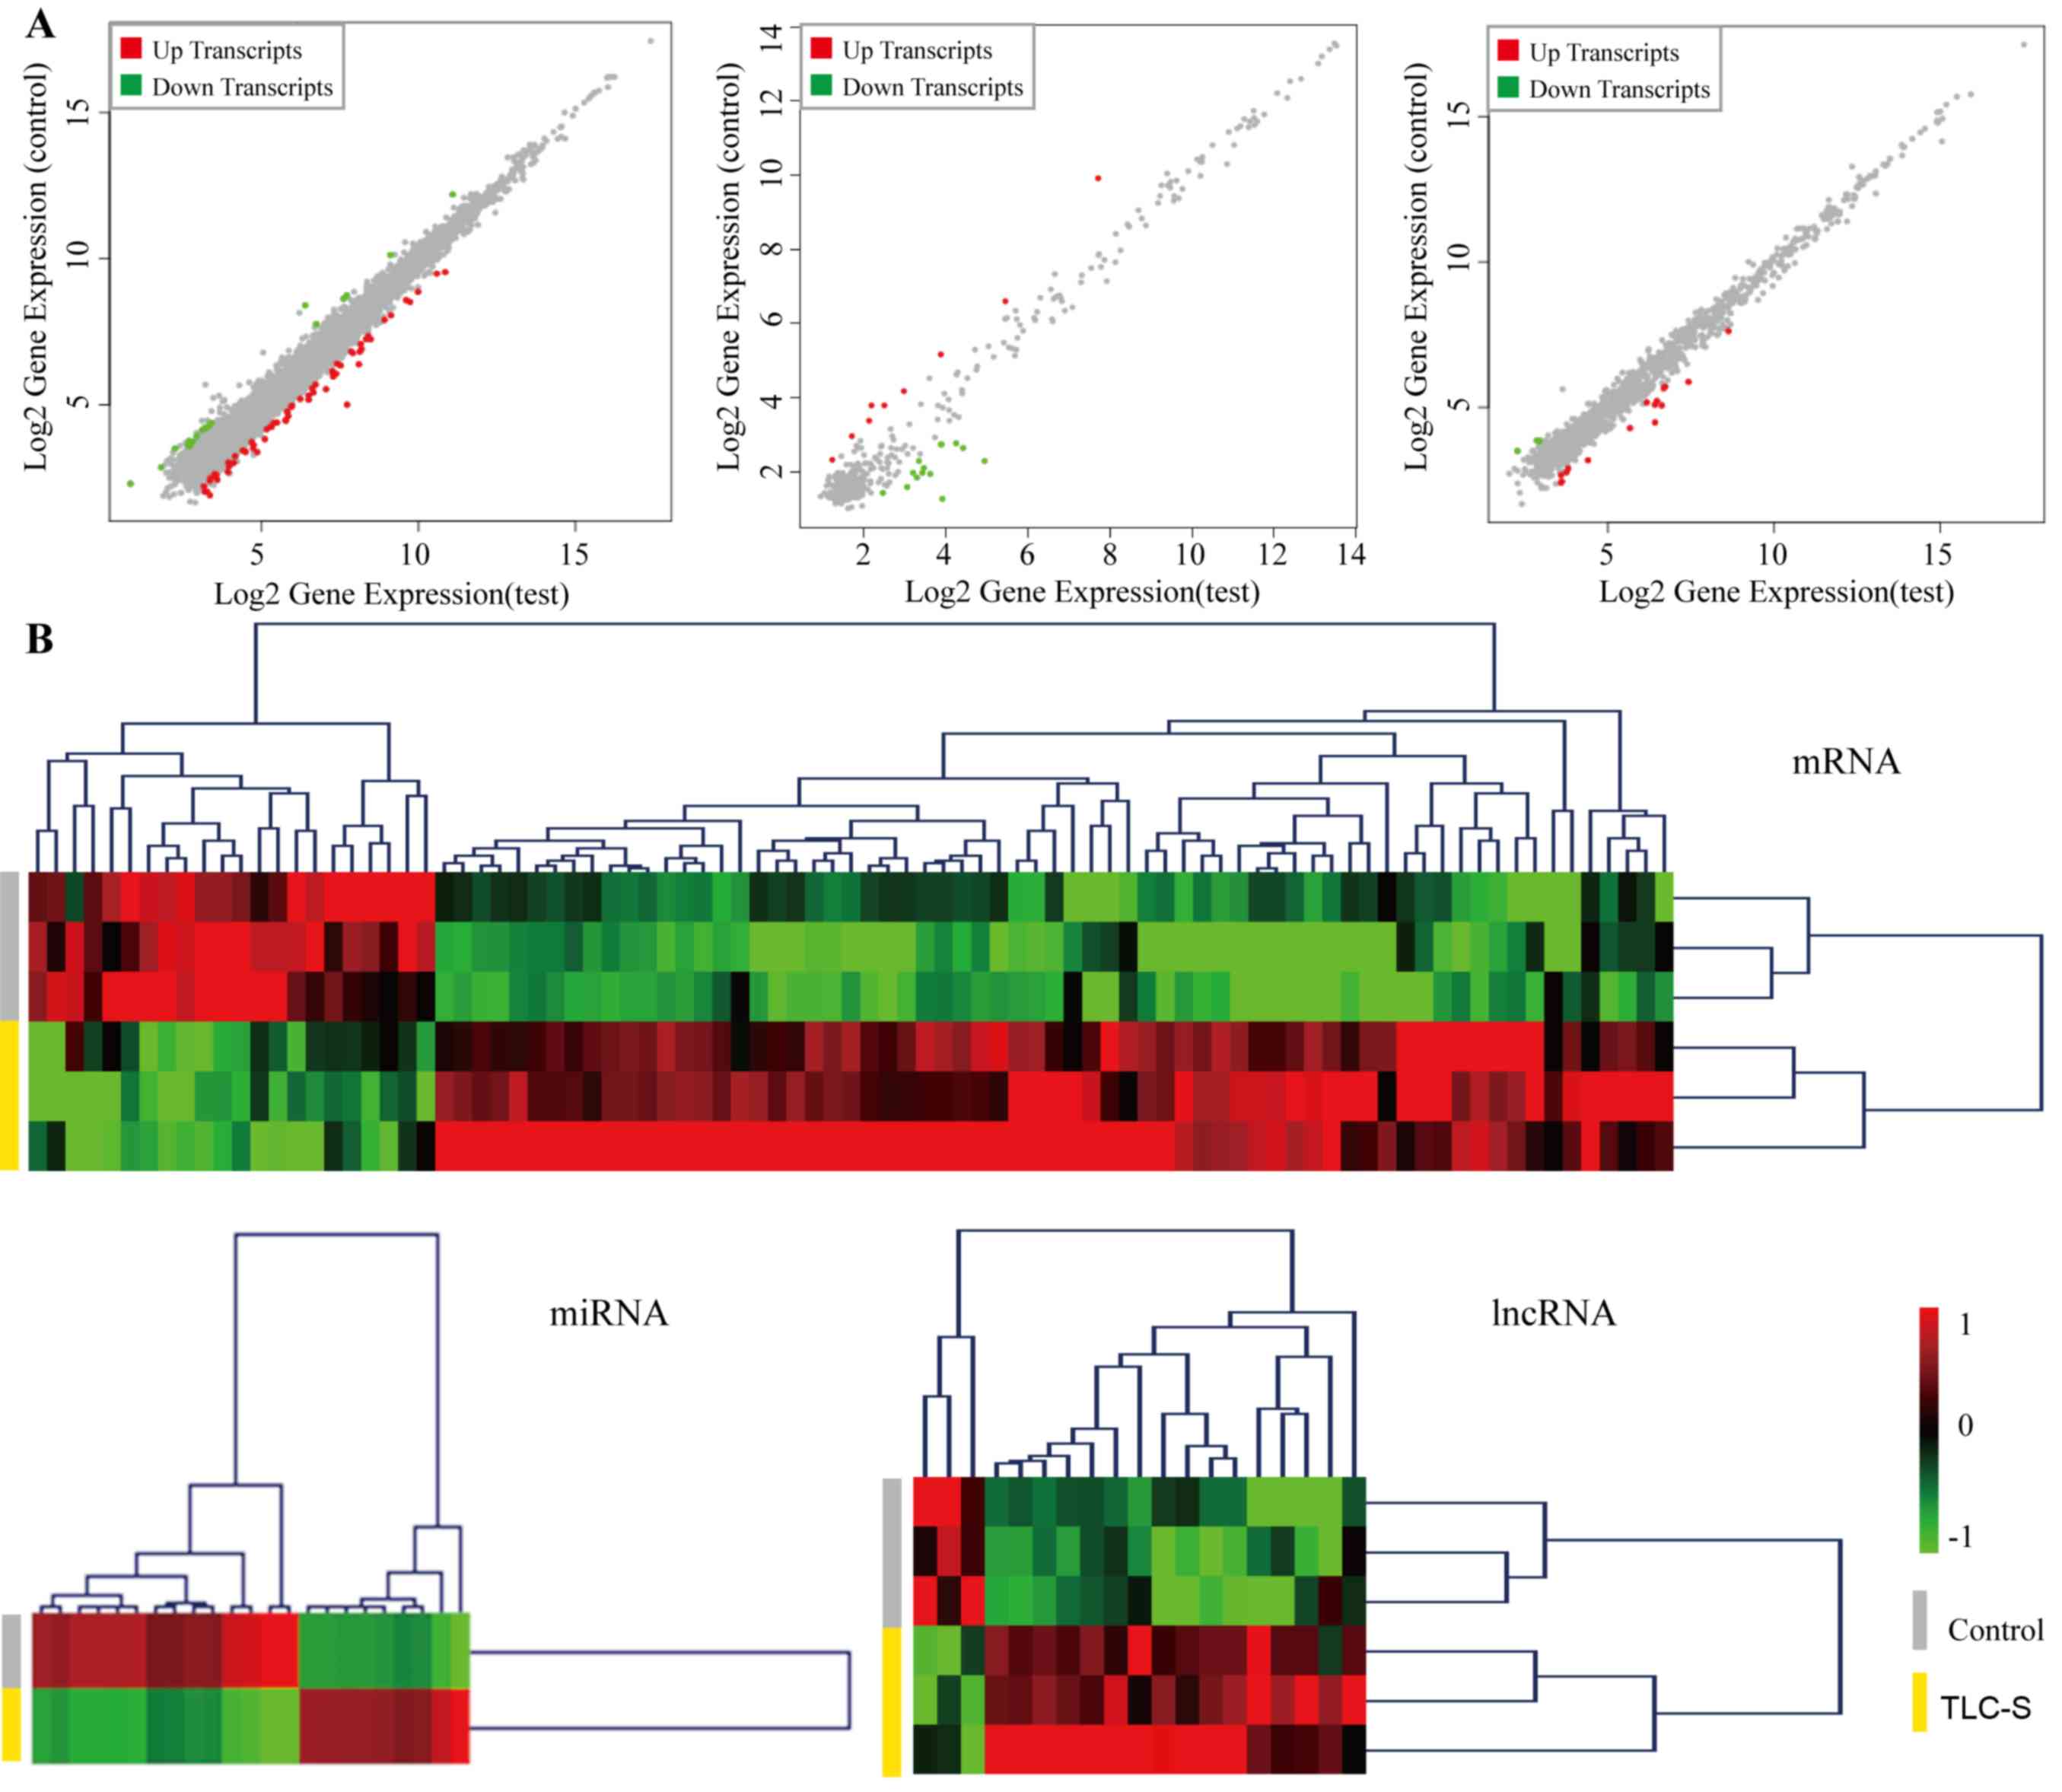
The gene microarray was used to identify the DE
mRNAs, lncRNAs and miRNAs in PAITA. Compared with the control
group, 206 DE mRNAs, 19 DE lncRNAs and 23 DE miRNAs were observed
in PAITA (Table I). The scatter
plot and heatmap of DE genes are presented in Fig. 1A and B. In the scatter plot, the
blue node represents the gene decrease, the yellow node represents
the gene increase, and the node size is positively correlated with
the P-value. In the heat map red sections represent an increase in
expression and green sections represent a decrease in expression.
The values −1 and +1 represent Z-score.
 | Table I.Number of DE mRNAs, miRNAs and
lncRNAs in a cell model of PAITA. |
Table I.
Number of DE mRNAs, miRNAs and
lncRNAs in a cell model of PAITA.
| Expression | DE mRNA | DE miRNA | DE lncRNA |
|---|
| Upregulated | 172 | 9 | 16 |
| Downregulated | 34 | 14 | 3 |
| Sum | 206 | 23 | 19 |
PPI network in PAITA
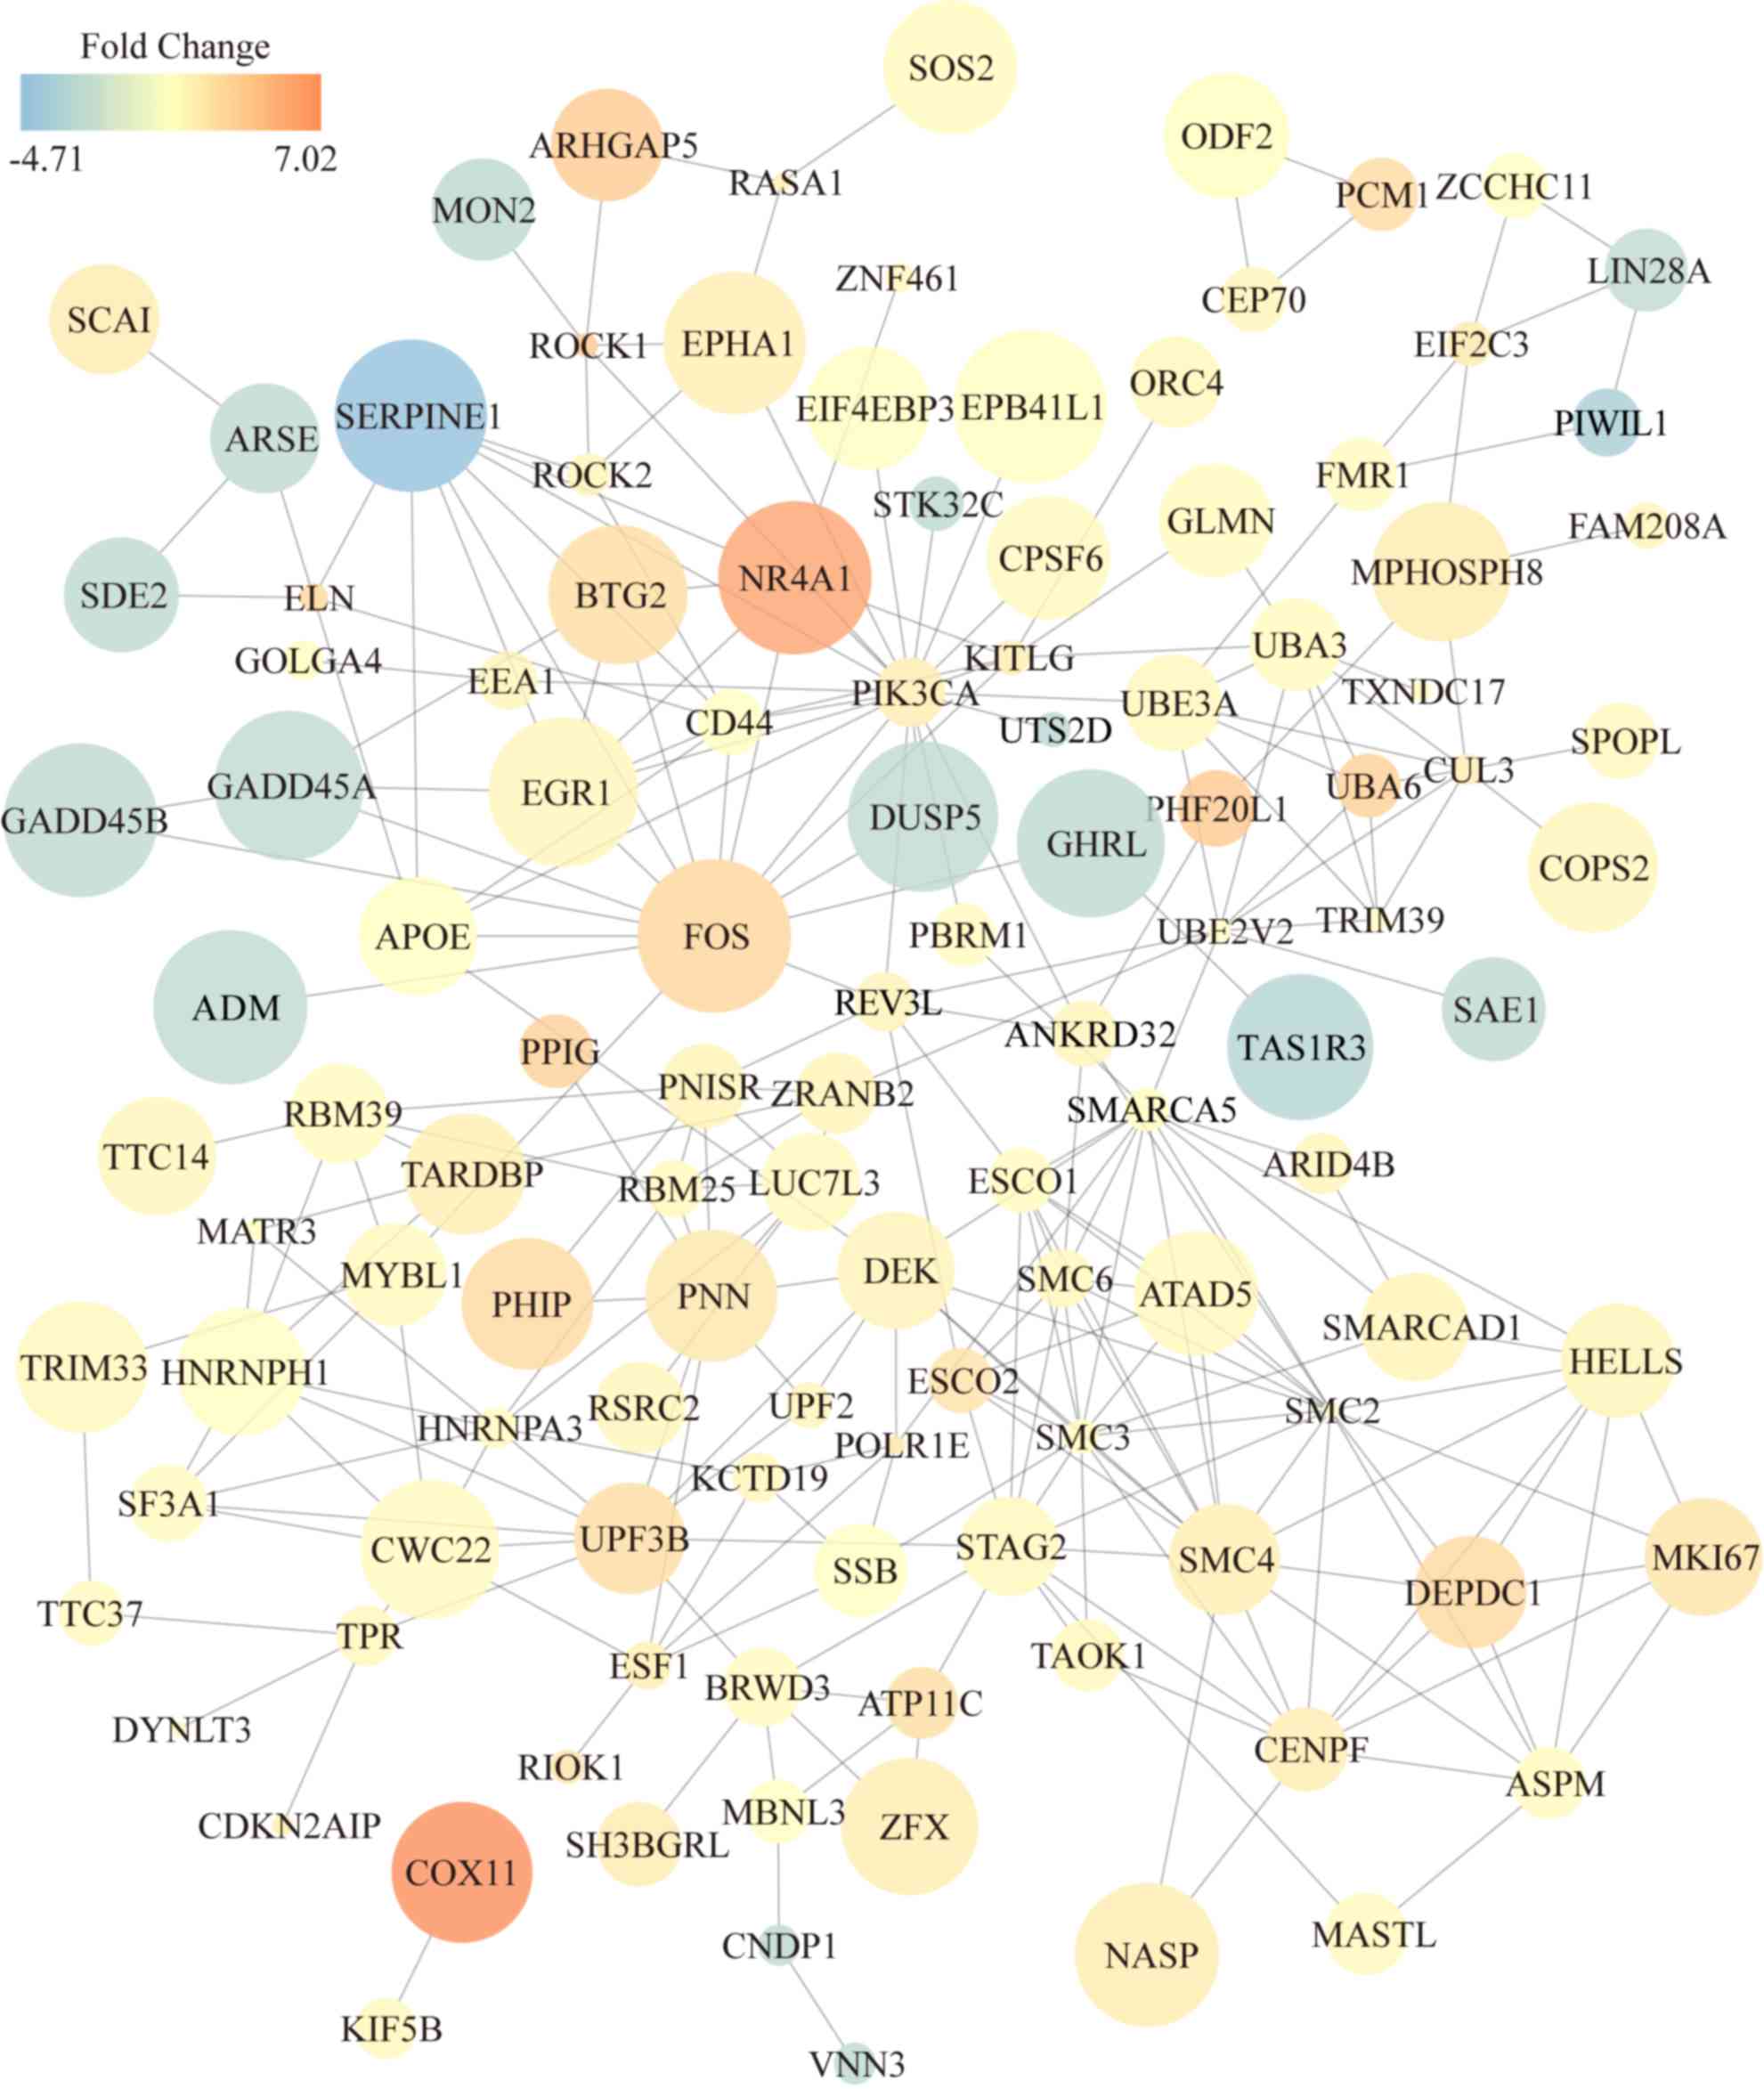
In order to further investigate the potential
mechanisms involved in PAITA, the STRING database and Cytoscape
software were used to establish a PPI network in PAITA. The results
demonstrated 262 interaction pairs among the 206 DE mRNAs (Fig. 2). Important genes in the PAITA
network are indicated by darker colors, larger sizes and higher
degrees of interaction, such as nuclear receptor subfamily 4 group
a member 1 (NR4A1), ARIIGAP5, FOS, COX11, BTG2, Egr1, dual
specificity phosphatase 5 (Dusp5) and adrenomedullin (ADM; Fig. 2). A literature review of
differentially expressed proteins was conducted to determine the
association between proteins from regulatory networks and AP. The
results suggested that although Egr1 did not display the most
pronounced fold change, it is indeed most closely associated with
AP.
Functional and pathway analysis of the
PPI network in PAITA
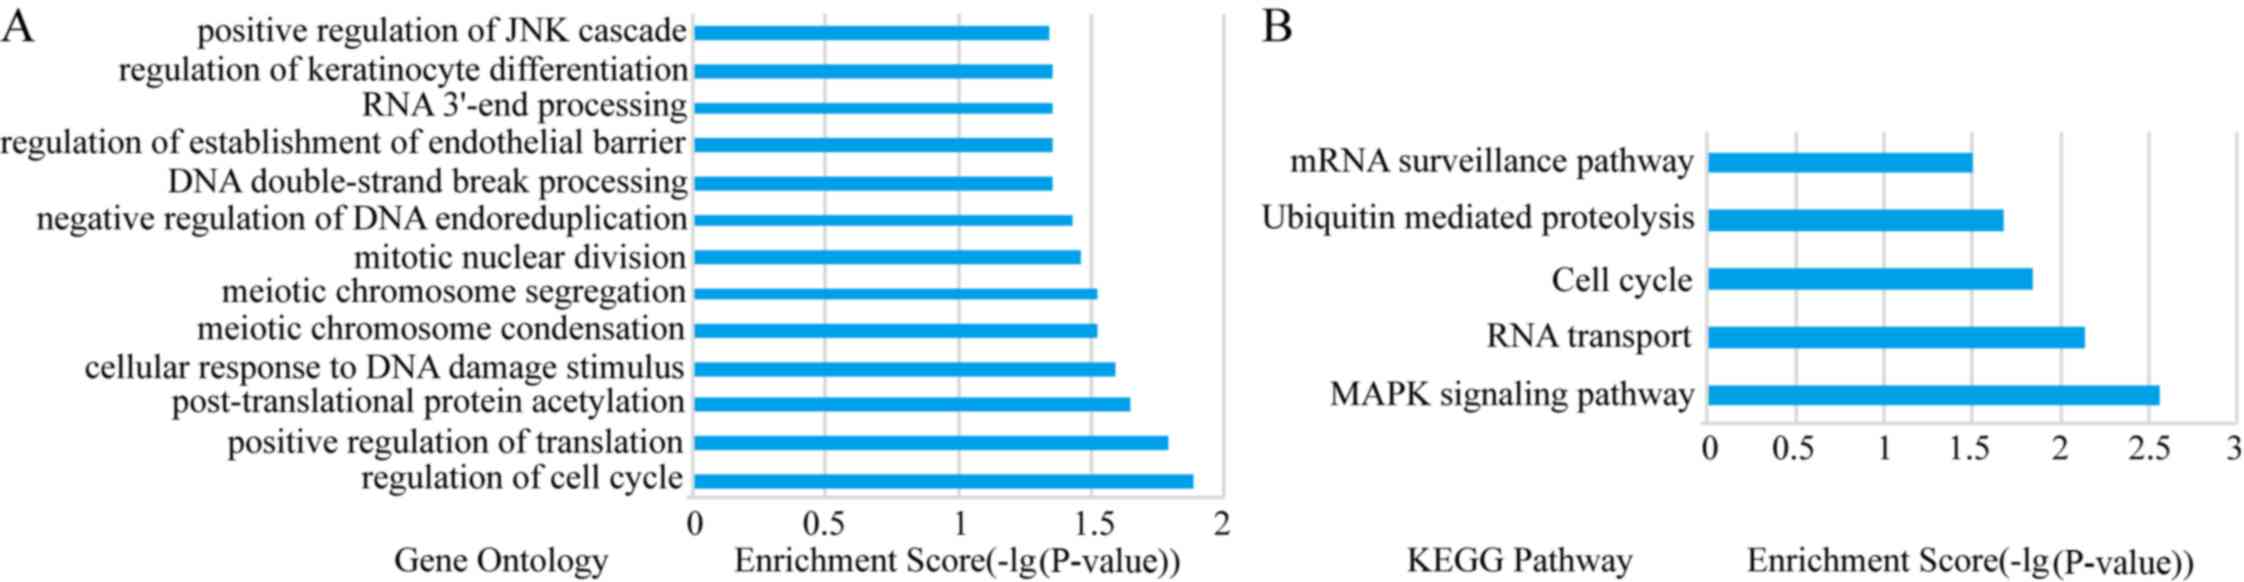
The DAVID database was used to analyze the enriched
functions and pathways of genes in the PPI network. GO analyses
demonstrated that the network genes were mainly enriched in
‘regulation of cell cycle’, ‘positive regulation of translation’,
‘cellular response to DNA damage stimulus’, ‘meiotic chromosome
condensation’ and ‘mitotic nuclear division’ (P<0.05; Fig. 3A).
KEGG analyses demonstrated that the network genes
were mainly enriched in ‘MAPK signaling pathway’, ‘RNA
transportation’, ‘cell cycle’, ‘ubiquitin mediated proteolysis’ and
‘mRNA surveillance pathway’ (P<0.05; Fig. 3B).
Egr1 knockdown
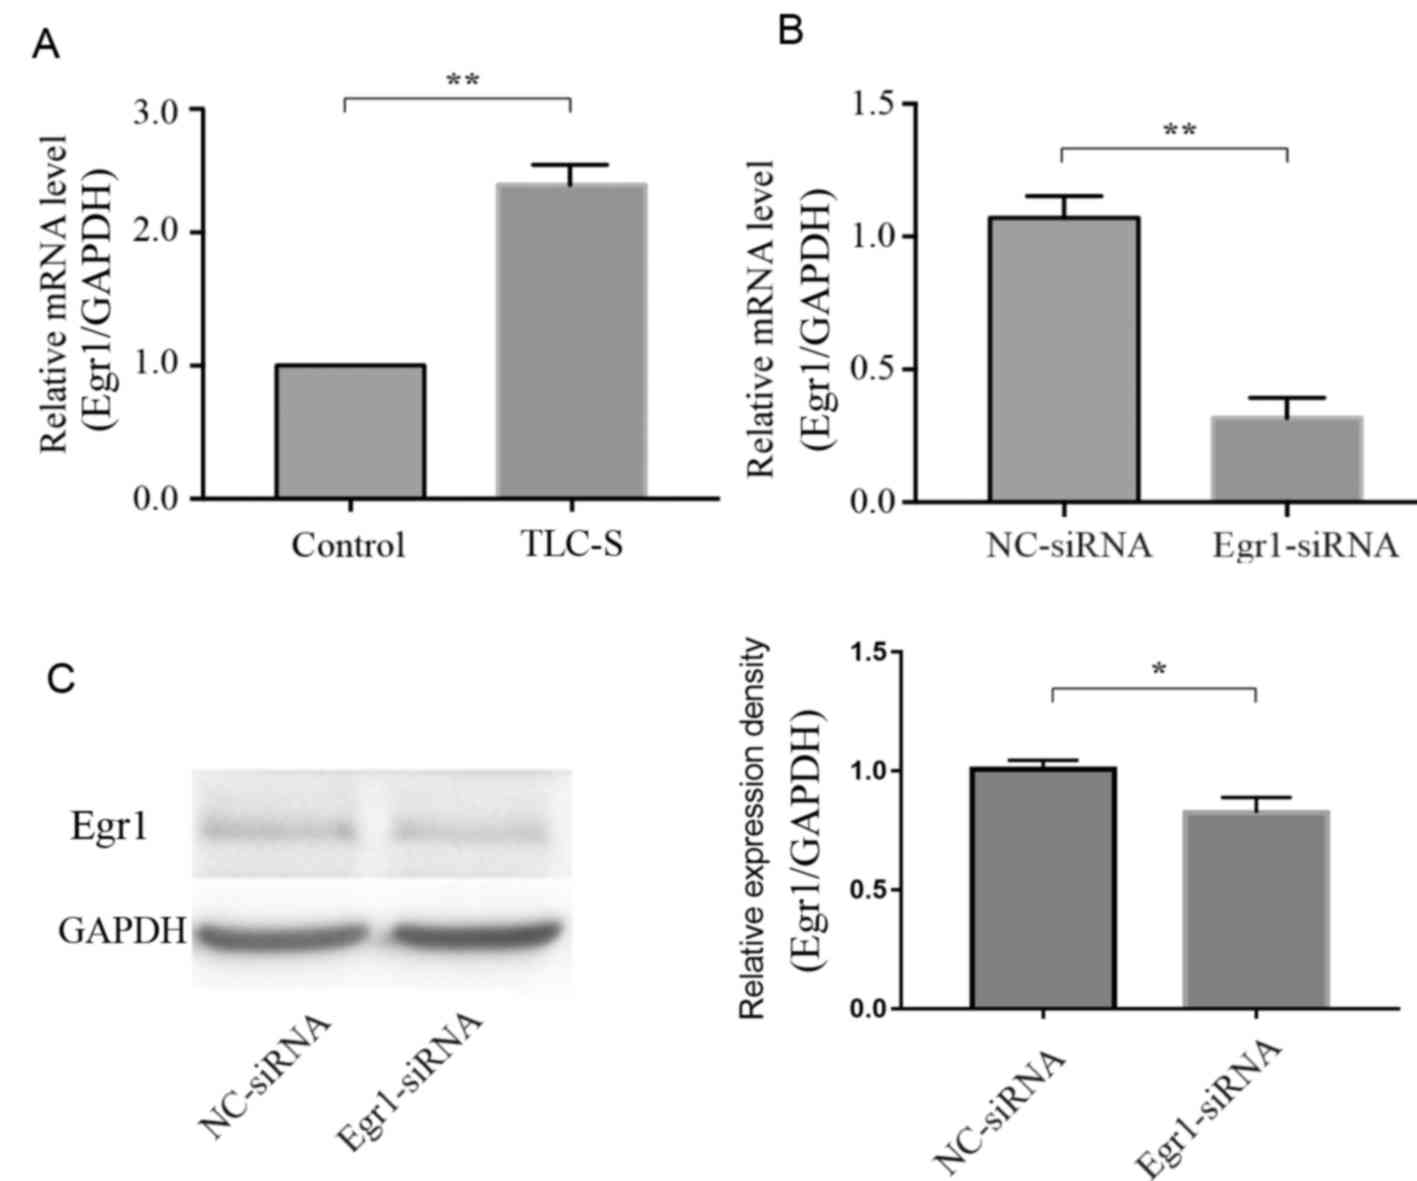
Among the important genes of the PPI network, Egr1
exhibited the closest relationship with AP according to a review of
the literature (8–12). The microarray analysis demonstrated
that Egr1 was upregulated in PAITA (Fig. 4A), but its effects remain unclear.
Thus, siRNA was used to knockdown the expression of Egr1. RT-qPCR
and western blotting were performed to detect the efficiency of
knockdown. RT-qPCR and western blotting demonstrated that the
expression levels of Egr1 were significantly decreased in the
Egr1-siRNA group compared with in the of the NC-siRNA group; the
knockdown rate was ~75% (Fig. 4B and
C).
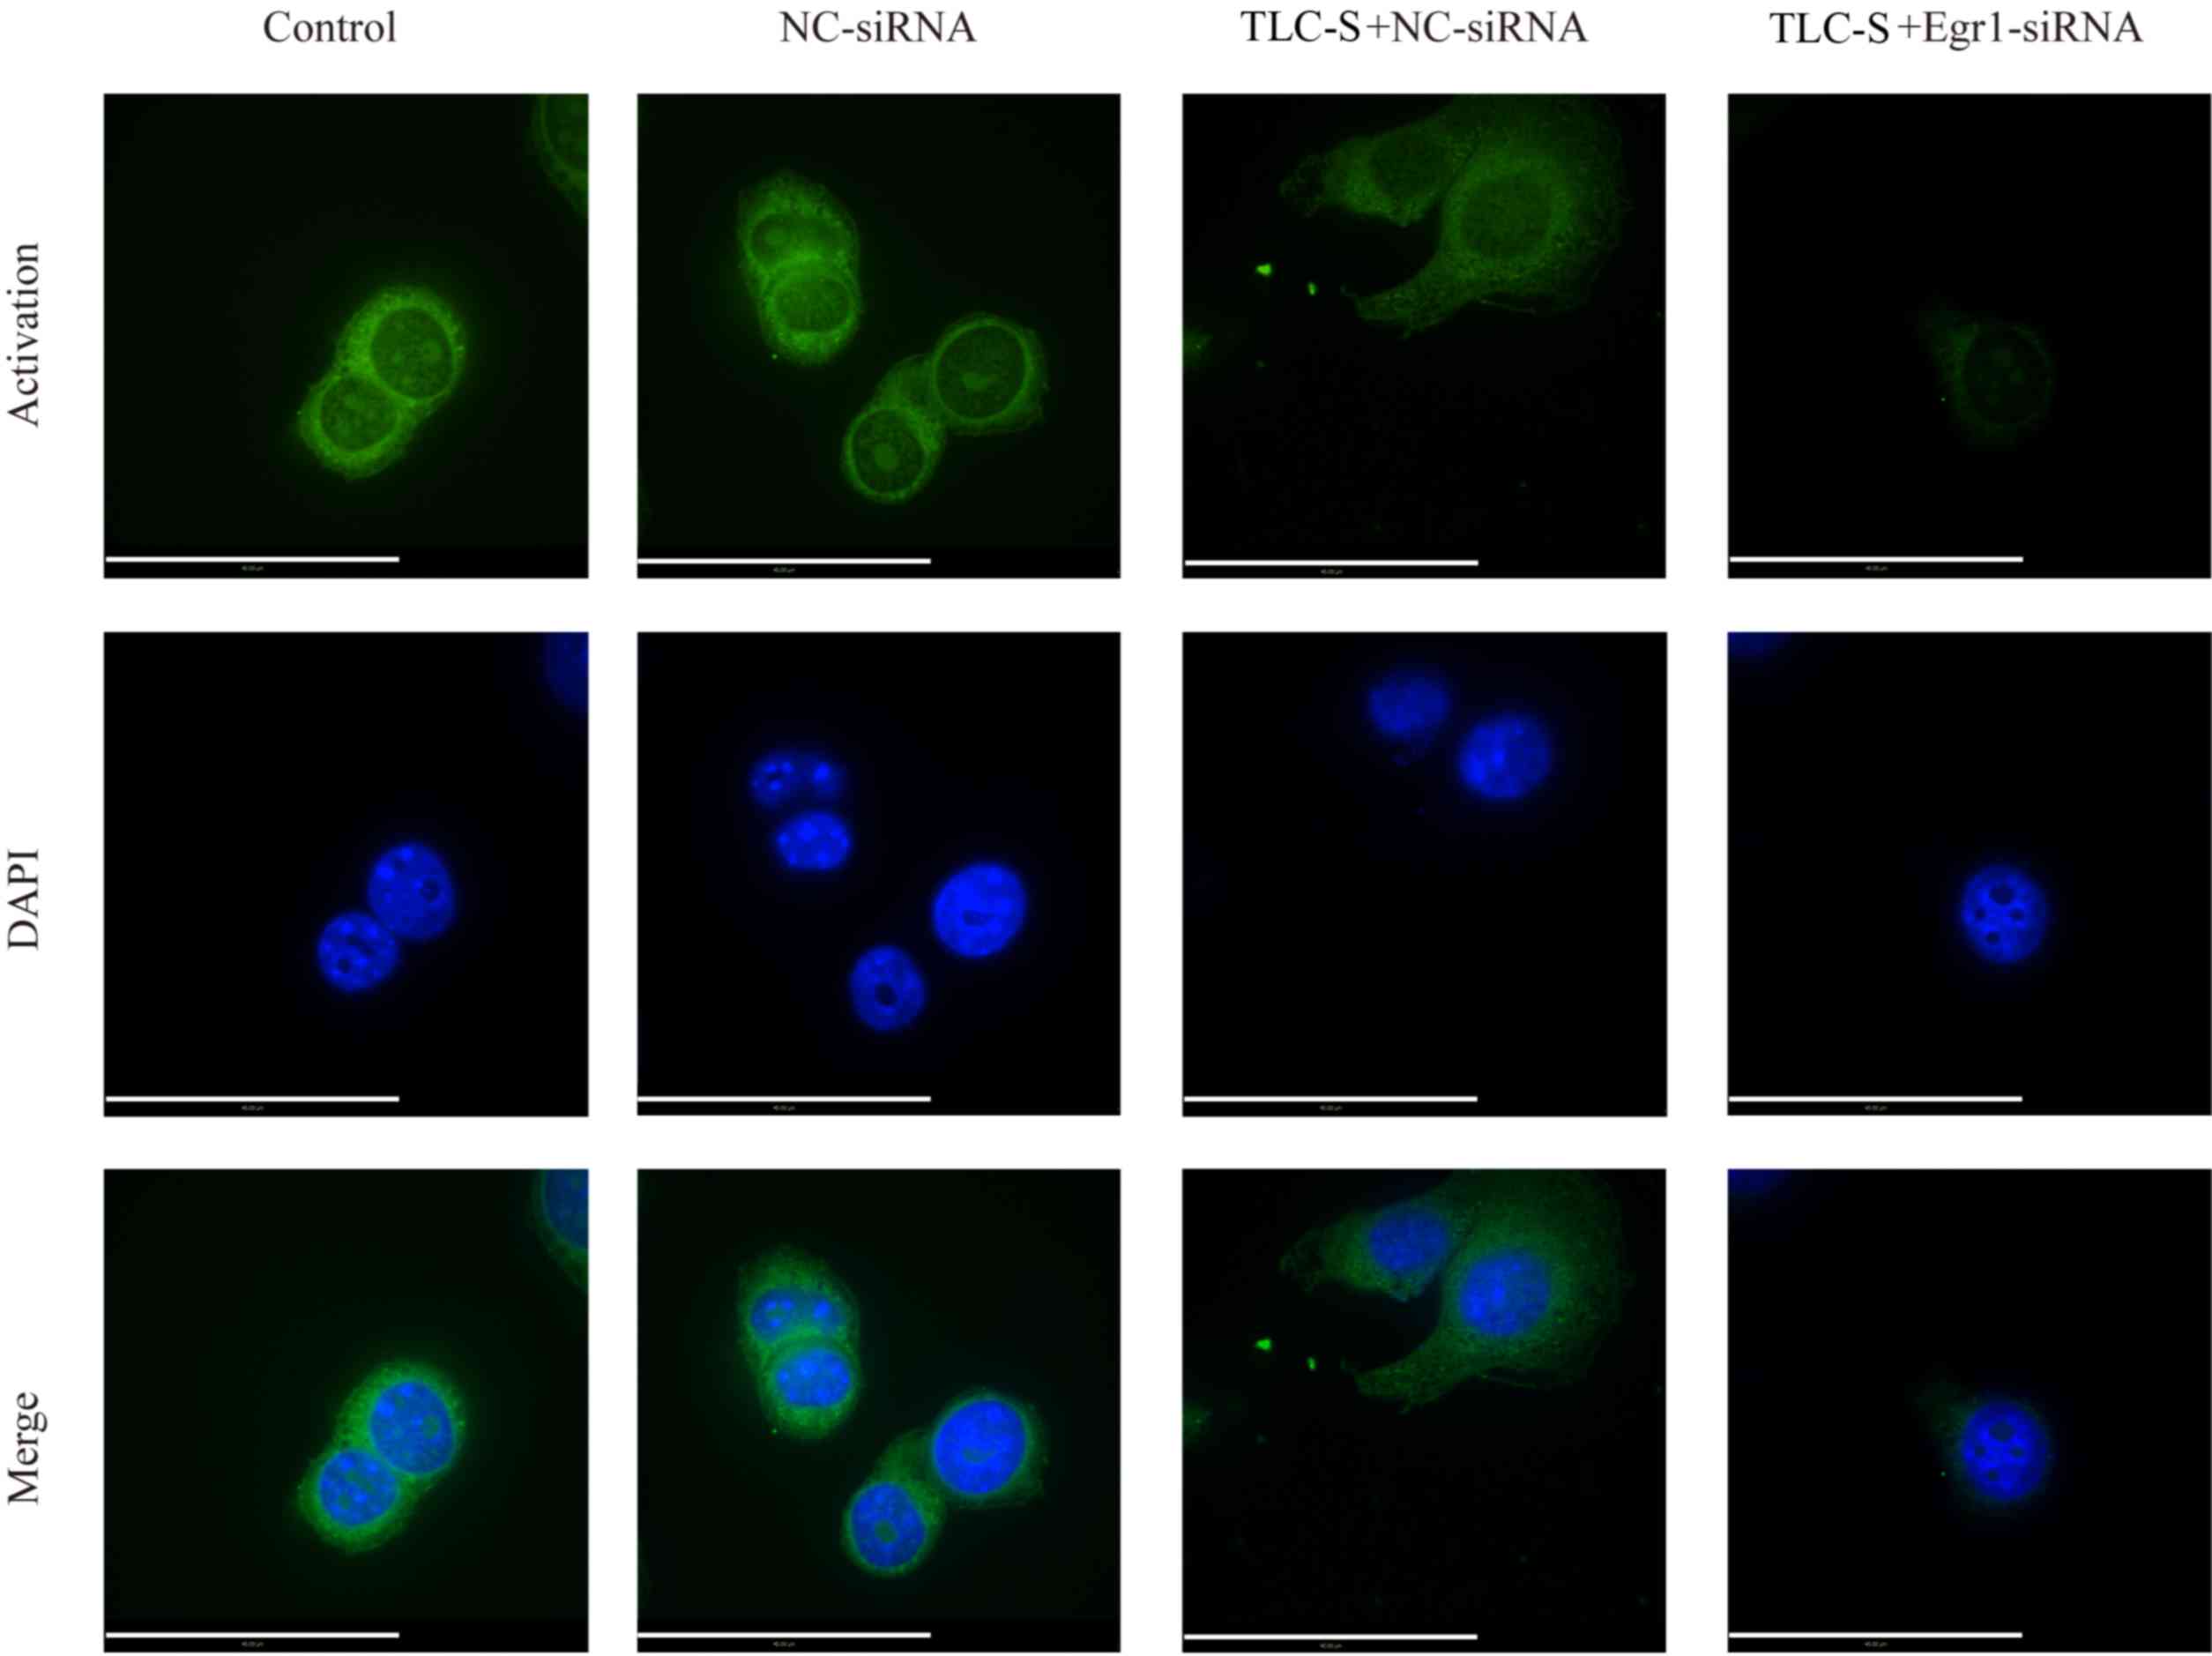
Egr1 regulates the activation of
trypsinogen
To understand the effects of Egr1 on PAITA, laser
scanning confocal microscopy was performed to detect the levels of
trypsinogen activation in the TLC-S + Egr1-siRNA, TLC-S + NC-siRNA
and NC-siRNA groups. The results demonstrated that the
intracellular fluorescent area in the TLC-S + NC-siRNA group was
notably larger compared with that of the NC-siRNA group. In
addition, compared with the intracellular fluorescent area of the
TLC-S + NC-siRNA group, the TLC-S + Egr1-siRNA group demonstrated a
decreased intracellular fluorescent area (Fig. 5).
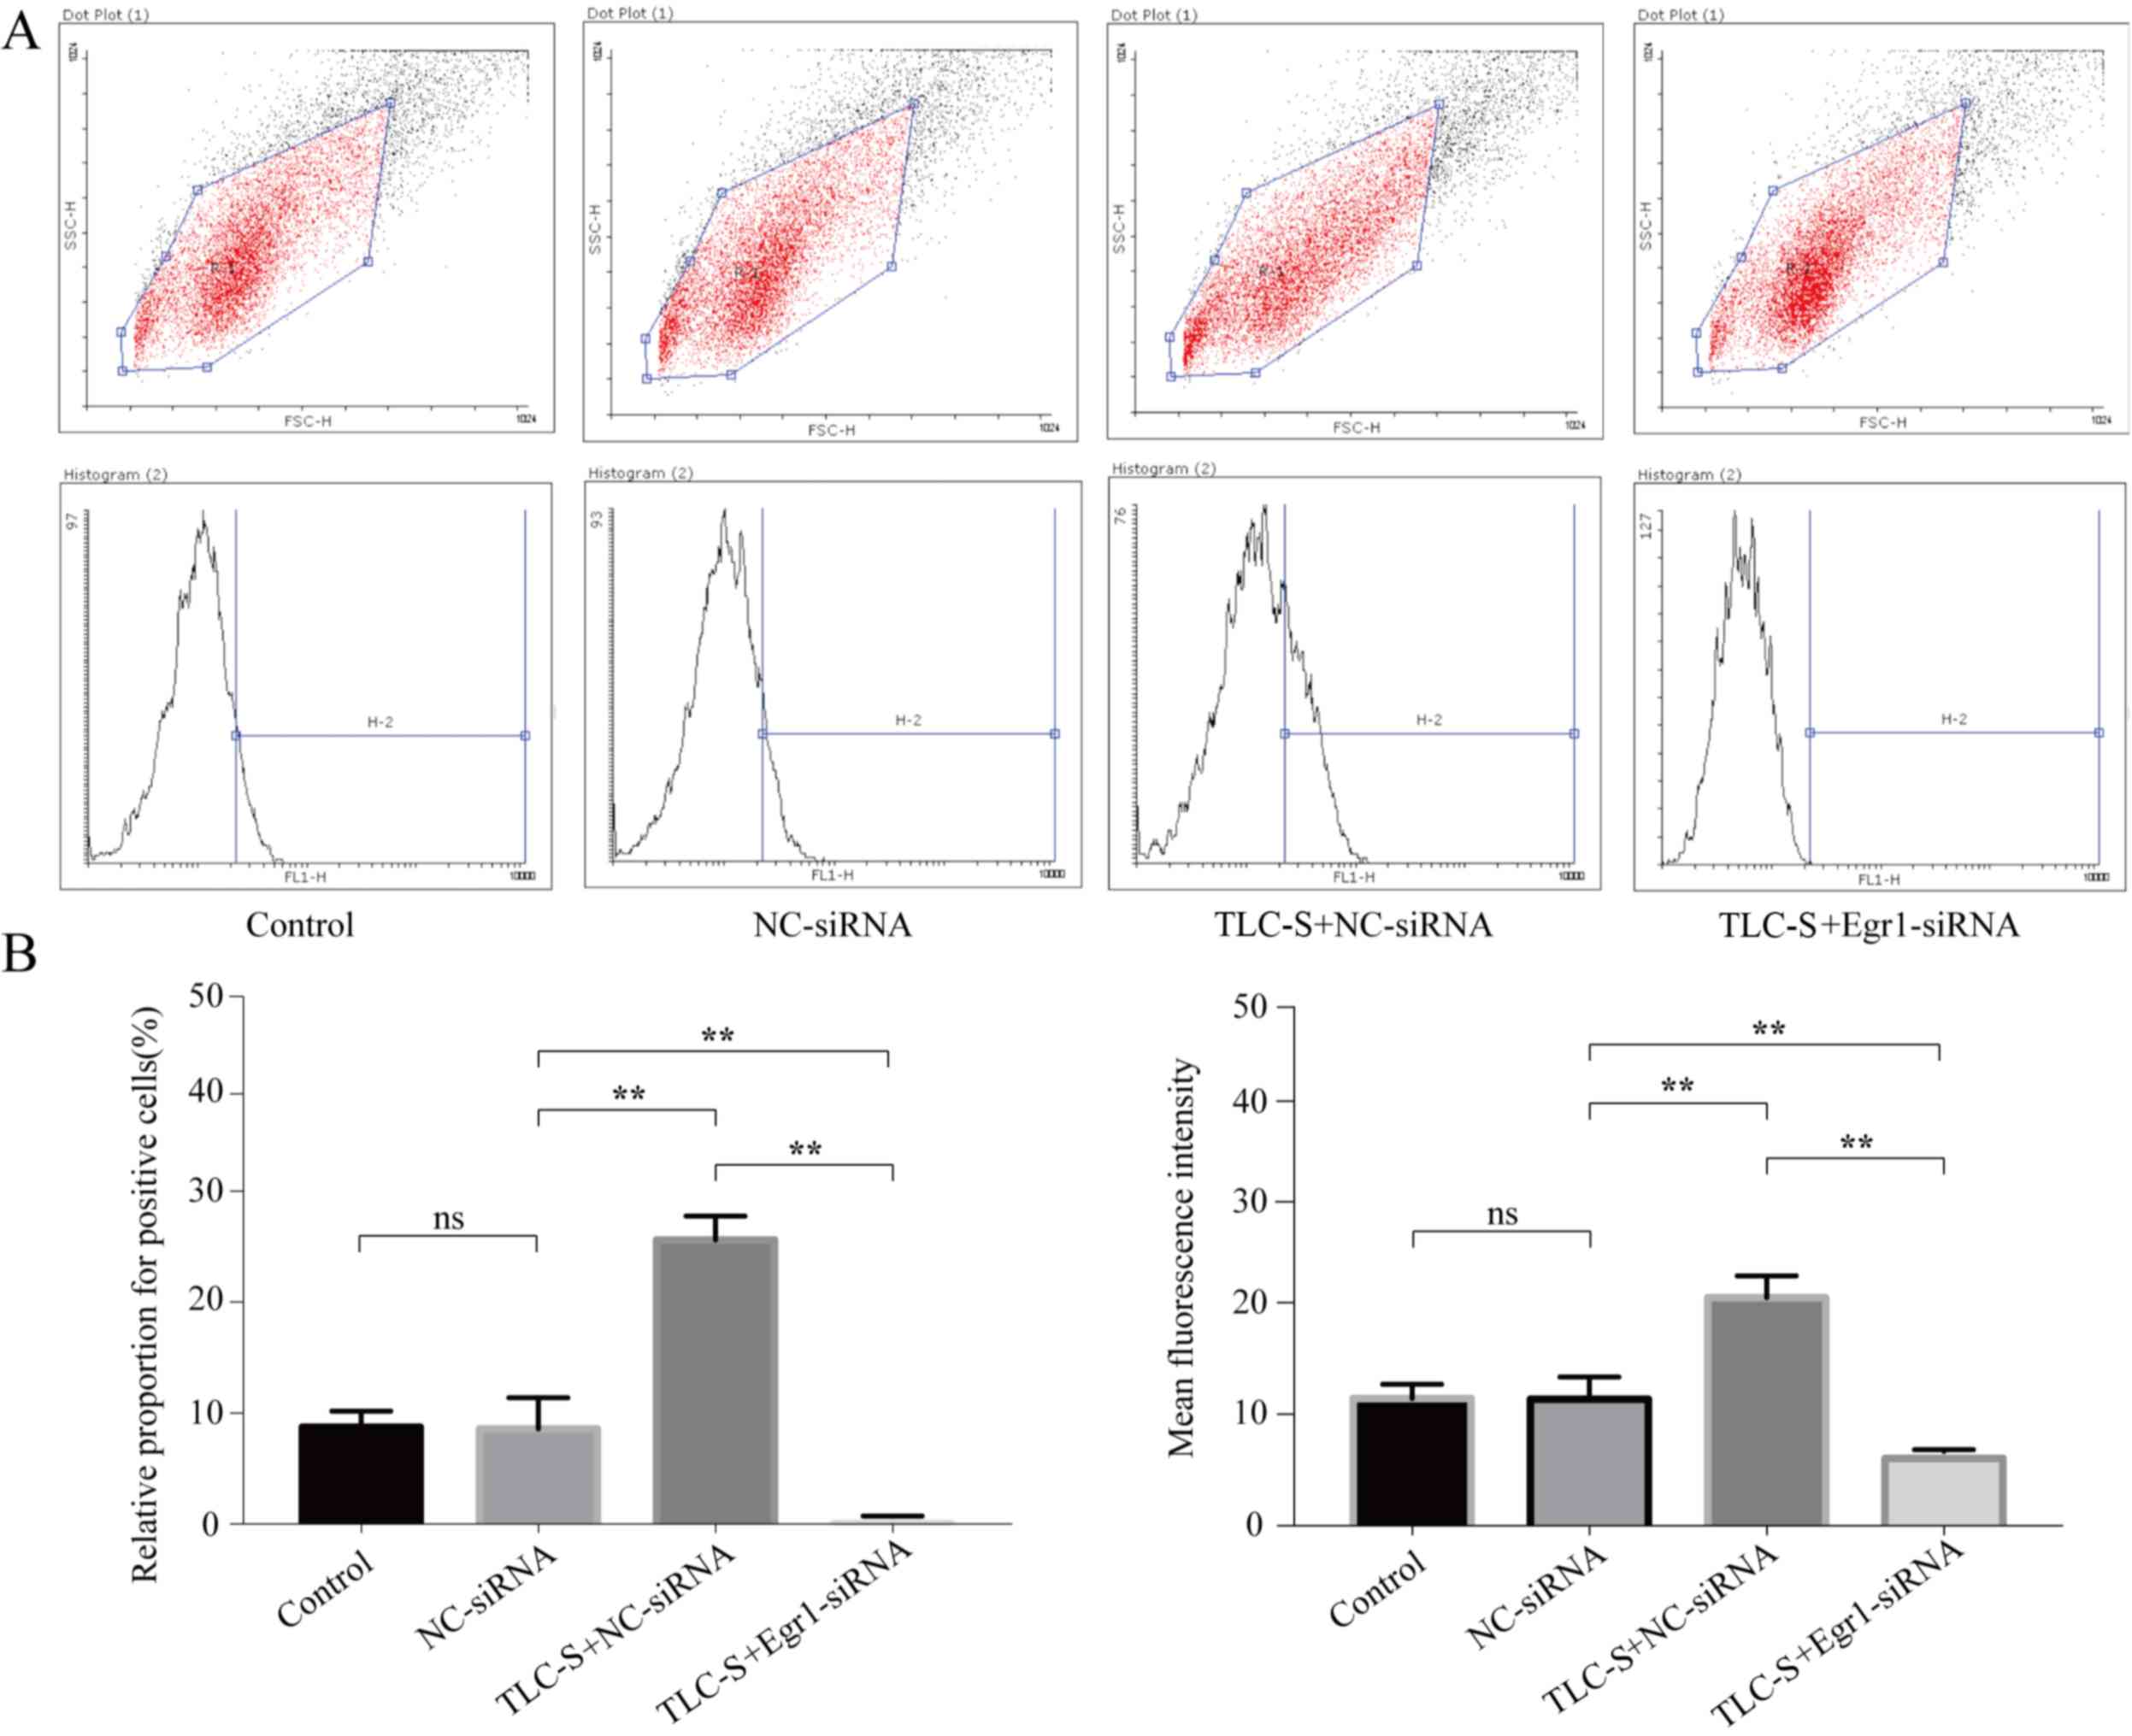
To quantify the fluorescence levels, flow cytometry
was performed to detect the levels of trypsinogen activation in the
three groups. The result demonstrated that the percentage of
PAITA-positive cells was 9.12±1.40, 8.95±2.43, 25.61±2.16 and
0.07±0.03% in the control, NC-siRNA, TLC-S + NC-siRNA and TLC-S +
Egr1-siRNA groups, respectively (Fig.
6B). No significant difference was observed between the control
group and the NC-siRNA group (P>0.05), but the percentage of
positive cells in the TLC-S + NC-siRNA group was significantly
higher compared with that of the NC-siRNA and TLC-S + Egr1-siRNA
groups (P<0.05) and the percentage of positive cells in the
NC-siRNA group was significantly higher compared with that of the
TLC-S + Egr1-siRNA group (P<0.01; Fig. 6A and B).
The results also demonstrated that the mean
fluorescence intensity was 11.53±1.05, 11.61±1.71, 20.71±1.65 and
6.25±0.52 in the control, NC-siRNA, TLC-S + NC-siRNA and TLC-S +
Egr1-siRNA groups, respectively. No significant difference was
observed between the control group and the NC-siRNA group
(P>0.05), but the mean fluorescence intensity in the TLC-S +
NC-siRNA group was significantly higher than that of the NC-siRNA
group and the TLC-S + Egr1-siRNA group (P<0.01), and the mean
fluorescence intensity in the NC-siRNA group was significantly
higher compared with the TLC-S + Egr1-siRNA group (P<0.01;
Fig. 6C).
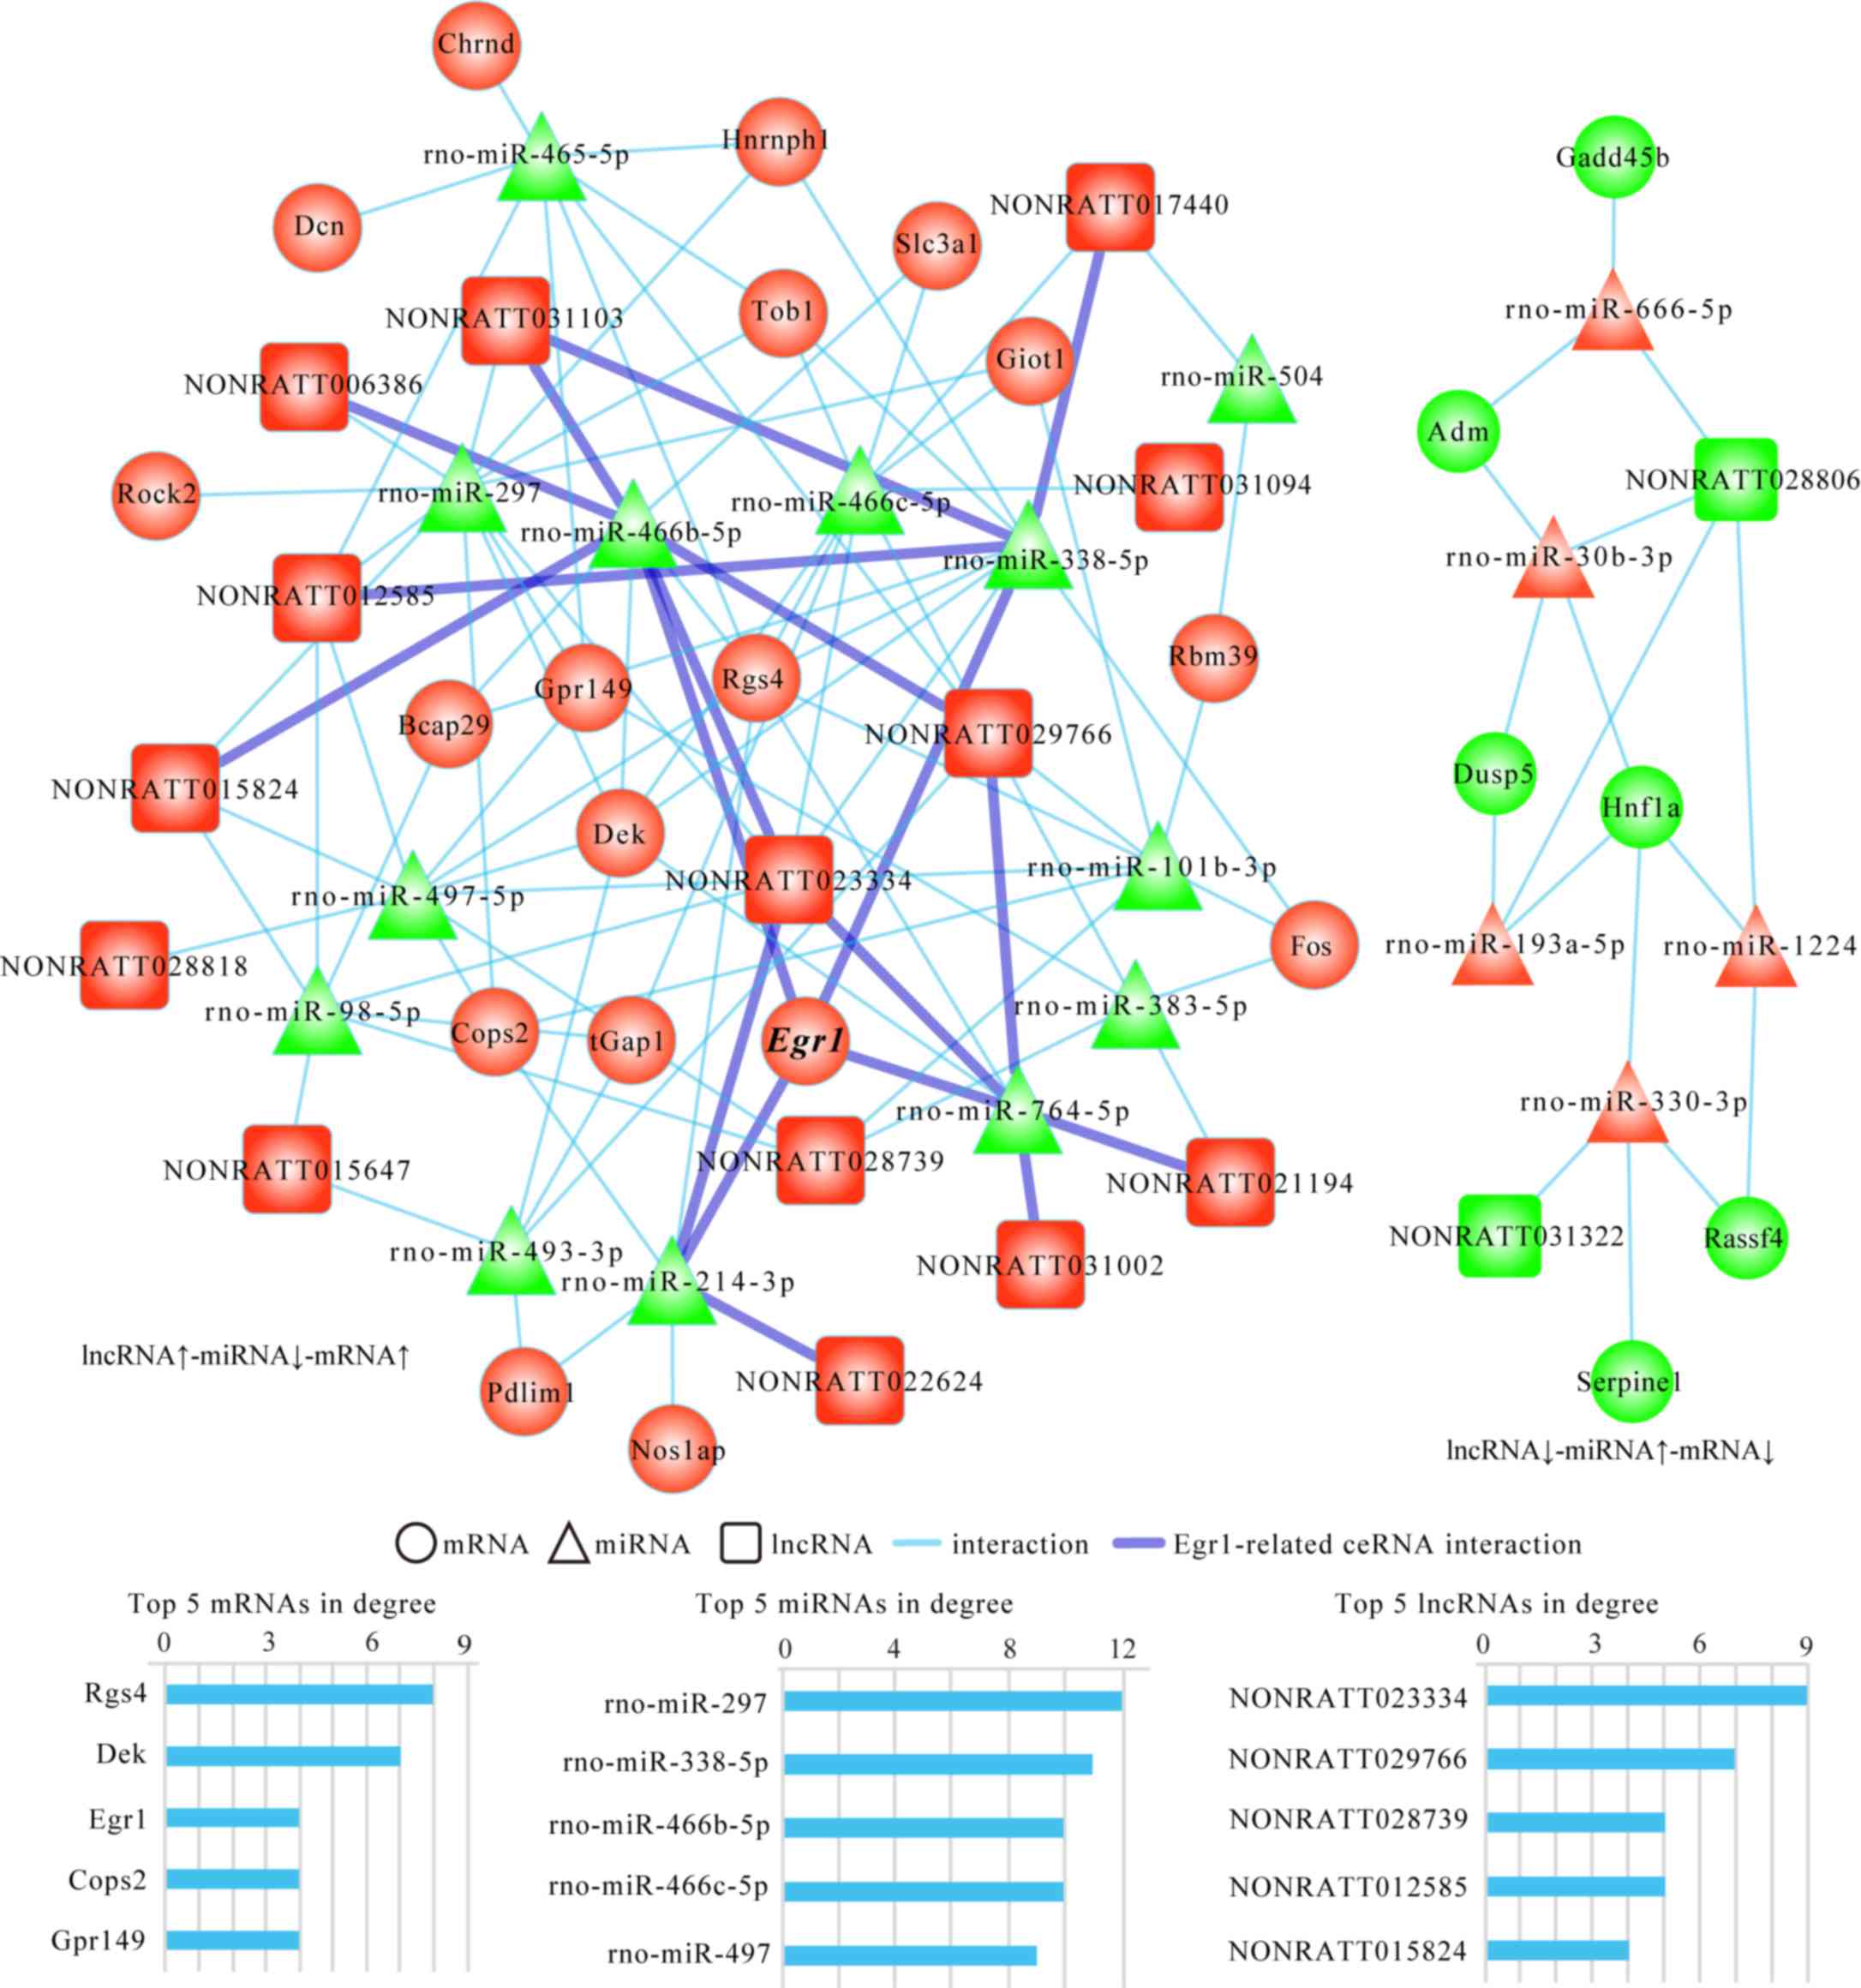
ceRNA network of PAITA
The microarray and bioinformatics analyses were used
to establish an lncRNA-miRNA-mRNA network of PAITA, which contained
16 lncRNAs, 18 miRNAs and 25 mRNAs, indicating that PAITA has a
complex ceRNA regulatory network (Fig.
7). In order to further clarify the mechanism of Egr1 in PAITA,
it was demonstrated that the Egr1-associated ceRNA sub-network
included four miRNAs [Rattus norvegicus (rno)-miR-214-3p,
rno-miR-764-5p, rno-miR-338-5p and rno-miR-466b-5p] and 10 lncRNAs
(NONRATT022624, NONRATT031002, NONRATT021194, NONRATT029766,
NONRATT023334, NONRATT031103, NONRATT006386, NONRATT012585,
NONRATT017440 and NONRATT015824) in total (Fig. 7).
The microarray and bioinformatics results also
demonstrated that Egr1 displayed the top three degrees in the
network, which suggested that Egr1 maybe serve an important role in
PAITA. Additionally, two miRNAs and four lncRNAs in the
Egr1-associated ceRNA sub-network displayed the top five degrees in
the network, including rno-miR-338-5p, rno-miR-466b-5p,
NONRATT029766, NONRATT023334, NONRATT012585 and NONRATT015824.
These results suggested that the effects of Egr1 on PAITA may be
regulated by multiple ceRNA pairs, and the lncRNAs and miRNAs
included in the ceRNA pairs may serve important roles in PAITA
through increasing the expression of Egr1.
Discussion
Studies have demonstrated that maintaining the
normal activated form of trypsinogen is key to maintaining the
normal function of the pancreas and that inappropriate early
activation is the initiating factor for the occurrence of AP
(32–34). However, the pathogenic mechanisms
of AP and PAITA have not been studied thoroughly. Previous studies
have observed that complex genetic network regulation, including
coding genes and non-coding genes, is involved in the pathogenesis
and development of diseases (35,36).
Thus, in the present study, gene chips were used to discover the
gene networks and corresponding important network nodes involved in
a cell model of PAITA. The microarray results demonstrated that 206
mRNAs, 19 lncRNAs and 23 miRNAs were differentially expressed, and
that these differential genes were mainly highly expressed. Based
on this result, the present study established a genetic interaction
network in PAITA. Through functional analysis, the present study
demonstrated that these genes mainly served roles in regulating the
cell cycle and positive translation, and that the network genes are
mainly enriched in signaling pathways such as the mitogen-activated
protein kinase (MAPK) pathway, RNA transportation and the cell
cycle. de Dios et al (37)
observed that cell cycle changes are important features of AP and
occur throughout the entire process of AP; in early AP, pancreatic
cells exhibit S phase arrest, and with the aggravation of
inflammation, G2/M phase arrest occurs. The results of
the present study suggested that PAITA, as an early AP event, is
characterized by cell cycle changes. The MAPK signaling pathway is
one of the most classical signaling pathways in the occurrence and
development of AP (38). For
example, Cao et al (39)
demonstrated that inhibition of MAPK signaling in mice effectively
inhibited the development of pancreatitis. Additionally, another
study demonstrated that inhibition of MAPK signaling accelerated
the apoptosis of pancreatic acinar cells and decreased the
AP-associated inflammatory response (40). In the present study, the DE network
genes in PAITA were mainly enriched in the MAPK signaling pathway,
suggesting that activation of the MAPK signaling pathway affects
the process of PAITA and may generate a subsequent cascade
reaction, ultimately promoting further development of AP.
In addition, the gene network in PAITA revealed some
potentially important genes, including Fos, Egr1, Dusp5, ADM and
NR4A1. These genes exhibited higher degree scores in the network,
larger fold changes and smaller P-values. Among these genes, the
transcription factor Egr1 has a very close relationship with AP.
For example, Sandoval et al (41) observed that Egr1 was expressed at
high levels in the early inflammatory reaction of AP, and Ji et
al (11) demonstrated that
after initiating caerulein-induced AP in mice, the severity of AP
in Egr1 gene-deficient mice was significantly lower compared with
that in normal mice. Their study suggested that Egr1 may be a key
regulator of early development of AP. However, it has not been
reported whether Egr1 is involved in PAITA (the initial stage of
AP). The microarray and gene network results of the present study
suggested that Egr1 may serve a role in PAITA. To further verify
this effect, siRNA was used to silence Egr1, and then confocal
laser microscopy and flow cytometry were used to detect the effect
of Egr1 on PAITA. The results demonstrated that silencing of Egr1
significantly inhibited PAITA.
Previous studies have observed that Egr1 is located
on the q31.1 ‘cytokine aggregation’ region of human chromosome 5,
and as a transcription factor, it is closely associated with cell
proliferation, differentiation, apoptosis and inflammatory
responses (42–45). A number of transcription factors,
including activator protein 1, NF-κB and Egr1, can regulate the
expression of tumor necrosis factor-α (TNF-α), transforming growth
factor β1 and other cytokines by various stimulating factors in
different types of cells, such as macrophages and epidermal
keratinocytes (46,47). In addition, a number of studies
have observed that the transcription factor Egr1 serves an
important role in regulating the expression of these stimulating
factors and affects the occurrence and development of diseases
(48–52). These results suggested that Egr1
may cause PAITA via the regulation of PAITA-associated pathogenic
factors. However, the effect of Egr1 on the regulation of PAITA
through the regulation of downstream genes require validation in
further molecular experiments.
With the generation of large quantities of basic
experimental data, bioinformatics has been widely used as an
effective means for big data analysis in various diseases. To
further investigate the potential mechanisms underlying the effects
of Egr1 on PAITA, gene mapping and bioinformatics methods were used
to establish an mRNA-miRNA-lncRNA network in the cell model of
PAITA. The expression of lncRNAs was increased, and these can
reduce miRNA inhibition of mRNA by competing to bind miRNA binding
sites, thereby causing increased mRNA expression. The results of
the present study demonstrated that there was an Egr1-associated
ceRNA sub-network in PAITA, including four miRNAs and 10 lncRNAs.
miRNA was the first type of non-coding RNA to be discovered, and
its function has been extensively studied (53). Of the four miRNAs in the
Egr1-related ceRNA network, two have been clearly associated with
inflammation. Liu et al (54) reported that miR-338 inhibits TNF-α
and thereby inhibits the occurrence of sebaceous inflammation. Zhao
et al (55) demonstrated
that miR-214 is closely associated with inflammatory responses, and
could promote the release of the inflammatory cytokines TNF-α and
interleukin-6. These four miRNAs (miR-214-3p, rno-miR-764-5p,
rno-miR-338-5p and rno-miR-466b-5p) displayed low expression in the
cell model of PAITA, suggesting that they may serve a role in
processes involved in PAITA. Notably, these miRNAs all have
complementary binding base sites to Egr1, suggesting that Egr1 may
be regulated by these upstream miRNAs. A previous study suggested
that the regulation of target RNAs by miRNAs is negative and
unidirectional (54), but later
studies have reported that lncRNAs can compete with their encoded
genes for miRNAs via conserved miRNA response elements, resulting
in decreased miRNA content and thereby reduced inhibition by miRNAs
of target RNAs (56,57). The Egr1-related ceRNA sub-network
contains 10 lncRNAs; currently, the role of these lncRNAs in PAITA
remains unclear. Combined with the results of microarray and
bioinformatics analysis, these 10 lncRNAs were determined to be
highly expressed in PAITA and exhibited a competitive relationship
with Egr1, suggesting that these lncRNAs may become therapeutic
targets for PAITA.
In summary, the results of the present study
suggested that Egr1 was highly expressed in PAITA and may affect
the development of PAITA. Further analysis revealed that a
lncRNA-miRNA-Egr1 regulatory network may be the basis for the
effects of Egr1 on PAITA. The results of the present study may
provide novel insight for studies into the pathogenesis of AP and
PAITA, as well as the development of strategies for the clinical
treatment of AP.
Acknowledgements
Not applicable.
Funding
The present study was supported by the National
Natural Science Foundation of China (grant no. 81570581), the Youth
Program of National Natural Science Foundation of China (grant no.
81800573) and by the Peking University People's Hospital Research
And Development Funds (grant no. RDY2018-06).
Availability of data and materials
The datasets used and/or analyzed during the current
study are available from the corresponding author on reasonable
request.
Authors' contributions
DX and WZ designed the study. BG and XZ provided
study material, performed the experiments and assembled the data.
BG performed experiments and wrote the manuscript. All authors
approved the final version of the manuscript.
Ethics approval and consent to
participate
Not applicable.
Patient consent for publication
Not applicable.
Competing interests
The authors declare that they have no competing
interests.
References
|
1
|
Krishna SG, Kruger AJ, Patel N, Hinton A,
Yadav D and Conwell DL: Cholecystectomy during index admission for
acute biliary pancreatitis lowers 30-day readmission rates.
Pancreas. 47:996–1002. 2018. View Article : Google Scholar : PubMed/NCBI
|
|
2
|
Chaitoff A, Cifu AS and Niforatos JD:
Initial management of acute pancreatitis. JAMA. May 7–2020.(Epub
ahead of print). View Article : Google Scholar : PubMed/NCBI
|
|
3
|
Lankisch PG, Apte M and Banks PA: Acute
pancreatitis. Lancet. 386:85–96. 2015. View Article : Google Scholar : PubMed/NCBI
|
|
4
|
Pancreas Study Group, Chinese Society of
Gastroenterology, Chinese Medical Association, Editorial Board of
Chinese Journal of Pancreatology & Editorial Board of Chinese
Journal of Digestion, . Chinese guidelines for the management of
acute pancreatitis (Shanghai, 2013). J Clin Hepatol. 29:656–660.
2013.
|
|
5
|
Hofbauer B, Saluja AK, Lerch MM, Bhagat L,
Bhatia M, Lee HS, Frossard JL, Adler G and Steer ML: Intra-acinar
cell activation of trypsinogen during caerulein-induced
pancreatitis in rats. Am J Physiol. 275:G352–G362. 1998.PubMed/NCBI
|
|
6
|
Dawra R, Sah RP, Dudeja V, Rishi L,
Talukdar R, Garg P and Saluja AK: Intra-acinar trypsinogen
activation mediates early stages of pancreatic injury but not
inflammation in mice with acute pancreatitis. Gastroenterology.
141:2210–2217.e2. 2011. View Article : Google Scholar : PubMed/NCBI
|
|
7
|
Lerch MM and Gorelick FS: Early
trypsinogen activation in acute pancreatitis. Med Clin North Am.
84549–563. (viii)2000. View Article : Google Scholar : PubMed/NCBI
|
|
8
|
Hu F, Xue M, Li Y, Jia YJ, Zheng ZJ, Yang
YL, Guan MP, Sun L and Xue YM: Early growth response 1 (Egr1) is a
transcriptional activator of NOX4 in oxidative stress of diabetic
kidney disease. J Diabetes Res. 2018:34056952018. View Article : Google Scholar : PubMed/NCBI
|
|
9
|
Kaufmann A, Rössler OG and Thiel G:
Expression of the transcription factor Egr-1 in pancreatic acinar
cells following stimulation of cholecystokinin or Gαq-coupled
designer receptors. Cell Physiol Biochem. 33:1411–1425. 2014.
View Article : Google Scholar : PubMed/NCBI
|
|
10
|
Shajahan-Haq AN, Boca SM, Jin L,
Bhuvaneshwar K, Gusev Y, Cheema AK, Demas DD, Raghavan KS, Michalek
R, Madhavan S and Clarke R: EGR1 regulates cellular metabolism and
survival in endocrine resistant breast cancer. Oncotarget.
8:96865–96884. 2017. View Article : Google Scholar : PubMed/NCBI
|
|
11
|
Ji B, Chen XQ, Misek DE, Kuick R, Hanash
S, Ernst S, Najarian R and Logsdon CD: Pancreatic gene expression
during the initiation of acute pancreatitis: Identification of
EGR-1 as a key regulator. Physiol Genomics. 14:59–72. 2003.
View Article : Google Scholar : PubMed/NCBI
|
|
12
|
Gong LB, He L, Liu Y, Chen XQ and Jiang B:
Expression of early growth response factor-1 in rats with
cerulein-induced acute pancreatitis and its significance. World J
Gastroenterol. 11:5022–5024. 2005. View Article : Google Scholar : PubMed/NCBI
|
|
13
|
Wang W, Han Y, Jo HA, Lee J and Song YS:
Non-coding RNAs shuttled via exosomes reshape the hypoxic tumor
microenvironment. J Hematol Oncol. 13:672020. View Article : Google Scholar : PubMed/NCBI
|
|
14
|
Ren N, Jiang T, Wang C, Xie S, Xing Y,
Piao D, Zhang T and Zhu Y: lncRNA ADAMTS9-AS2 inhibits gastric
cancer (GC) development and sensitizes chemoresistant GC cells to
cisplatin by regulating miR-223-3p/NLRP3 axis. Aging (Albany NY).
12:110252020. View Article : Google Scholar : PubMed/NCBI
|
|
15
|
Renganathan A and Felley-Bosco E: Long
noncoding RNAs in cancer and therapeutic potential. Adv Exp Med
Biol. 1008:199–222. 2017. View Article : Google Scholar : PubMed/NCBI
|
|
16
|
Li B, Mao R, Liu C, Zhang W, Tang Y and
Guo Z: lncRNA FAL1 promotes cell proliferation and migration by
acting as a CeRNA of miR-1236 in hepatocellular carcinoma cells.
Life Sci. 197:122–129. 2018. View Article : Google Scholar : PubMed/NCBI
|
|
17
|
Salmena L, Poliseno L, Tay Y, Kats L and
Pandolfi PP: A ceRNA hypothesis: The rosetta stone of a hidden RNA
language? Cell. 146:353–358. 2011. View Article : Google Scholar : PubMed/NCBI
|
|
18
|
Zhao D, Ge H, Ma B, Xue D, Zhang W, Li Z
and Sun H: The interaction between ANXA2 and lncRNA Fendrr promotes
cell apoptosis in caerulein-induced acute pancreatitis. J Cell
Biochem. Nov 26–2018.(Epub ahead of print).
|
|
19
|
Wang L, Zhao X and Wang Y: The pivotal
role and mechanism of long non-coding RNA B3GALT5-AS1 in the
diagnosis of acute pancreatitis. Artif Cells Nanomed Biotechnol.
47:2307–2315. 2019. View Article : Google Scholar : PubMed/NCBI
|
|
20
|
Li Z, Lu M, Chu J, Qiao X, Meng X, Sun B,
Zhang W and Xue D: Early proteome analysis of rat pancreatic acinar
AR42J cells treated with taurolithocholic acid 3-sulfate.
Pancreatology. 12:248–256. 2012. View Article : Google Scholar : PubMed/NCBI
|
|
21
|
Yang Z, Yang W, Lu M, Li Z, Qiao X, Sun B,
Zhang W and Xue D: Role of the c-Jun N-terminal kinase signaling
pathway in the activation of trypsinogen in rat pancreatic acinar
cells. Int J Mol Med. 41:1119–1126. 2018. View Article : Google Scholar : PubMed/NCBI
|
|
22
|
Song Z, Huang Y, Liu C, Lu M, Li Z, Sun B,
Zhang W and Xue D: miR-352 participates in the regulation of
trypsinogen activation in pancreatic acinar cells by influencing
the function of autophagic lysosomes. Oncotarget. 9:10868–10879.
2018. View Article : Google Scholar : PubMed/NCBI
|
|
23
|
Fan T, Qu R, Yu Q, Sun B, Jiang X, Yang Y,
Huang X, Zhou Z, Ouyang J, Zhong S and Dai J: Bioinformatics
analysis of the biological changes involved in the osteogenic
differentiation of human mesenchymal stem cells. J Cell Mol Med.
May 28–2020.(Epub ahead of print). View Article : Google Scholar
|
|
24
|
Zhang J, Cong R, Zhang Q, Zeng T, Song R
and Meng X: Integrative analysis of ceRNA network and DNA
methylation associated with gene expression in malignant
pheochromocytomas: A study based on the cancer genome atlas. Transl
Androl Urol. 9:344–354. 2020. View Article : Google Scholar : PubMed/NCBI
|
|
25
|
Mente S and Kuhn M: The use of the R
language for medicinal chemistry applications. Curr Top Med Chem.
12:1957–1964. 2012. View Article : Google Scholar : PubMed/NCBI
|
|
26
|
Xie C, Yuan J, Li H, Li M, Zhao G, Bu D,
Zhu W, Wu W, Chen R and Zhao Y: NONCODEv4: Exploring the world of
long non-coding RNA genes. Nucleic Acids Res 42 (Database Issue).
D98–D103. 2014. View Article : Google Scholar
|
|
27
|
Szklarczyk D, Morris JH, Cook H, Kuhn M,
Wyder S, Simonovic M, Santos A, Doncheva NT, Roth A, Bork P, et al:
The STRING database in 2017: Quality-controlled protein-protein
association networks, made broadly accessible. Nucleic Acids Res.
45(D1): D362–D368. 2017. View Article : Google Scholar : PubMed/NCBI
|
|
28
|
Kanehisa M and Goto S: KEGG: Kyoto
encyclopaedia of genes and genomes. Nucleic Acids Res. 28:27–30.
2000. View Article : Google Scholar : PubMed/NCBI
|
|
29
|
Ashburner M, Ball CA, Blake JA, Botstein
D, Butler H, Cherry JM, Davis AP, Dolinski K, Dwight SS, Eppig JT,
et al: Gene ontology: Tool for the unification of biology. The gene
ontology consortium. Nat Genet. 25:25–29. 2000. View Article : Google Scholar : PubMed/NCBI
|
|
30
|
Livak KJ and Schmittgen TD: Analysis of
relative gene expression data using real-time quantitative PCR and
the 2(-Delta Delta C(T)) method. Methods. 25:402–408. 2001.
View Article : Google Scholar : PubMed/NCBI
|
|
31
|
Das S, Ghosal S, Sen R and Chakrabarti J:
lnCeDB: Database of human long noncoding RNA acting as competing
endogenous RNA. PLoS One. 9:e989652014. View Article : Google Scholar : PubMed/NCBI
|
|
32
|
Yao W, Zhu D, Lu H, Liu C, Sun B, Zhang W
and Xue D: The regulatory effect of the kinase inhibitor PD98059 on
autophagic flux during trypsinogen activation in pancreatic acinar
cells. Pancreas. 49:290–299. 2020. View Article : Google Scholar : PubMed/NCBI
|
|
33
|
Gukovskaya AS, Gorelick FS, Groblewski GE,
Mareninova OA, Lugea A, Antonucci L, Waldron RT, Habtezion A, Karin
M, Pandol SJ and Gukovsky I: Recent insights into the pathogenic
mechanism of pancreatitis: Role of acinar cell organelle disorders.
Pancreas. 48:459–470. 2019. View Article : Google Scholar : PubMed/NCBI
|
|
34
|
Bhatia M, Wong FL, Cao Y, Lau HY, Huang J,
Puneet P and Chevali L: Pathophysiology of acute pancreatitis.
Pancreatology. 5:132–144. 2005. View Article : Google Scholar : PubMed/NCBI
|
|
35
|
Gao B, Zhang X, Huang Y, Yang Z, Zhang Y,
Zhang W, Gao ZH and Xue D: Coding and non-coding gene regulatory
networks underlie the immune response in liver cirrhosis. PLoS One.
12:e01741422017. View Article : Google Scholar : PubMed/NCBI
|
|
36
|
Gao B, Shao Q, Choudhry H, Marcus V, Dong
K, Ragoussis J and Gao ZH: Weighted gene co-expression network
analysis of colorectal cancer liver metastasis genome sequencing
data and screening of anti-metastasis drugs. Int J Oncol.
49:1108–1118. 2016. View Article : Google Scholar : PubMed/NCBI
|
|
37
|
de Dios I, Uruñuela A, Pinto RM, Orfao A
and Manso MA: Cell-cycle distribution of pancreatic cells from rats
with acute pancreatitis induced by bile-pancreatic obstruction.
Cell Tissue Res. 300:307–314. 2000. View Article : Google Scholar : PubMed/NCBI
|
|
38
|
Zhang B, Li SL, Xie HL, Fan JW, Gu CW,
Kang C and Teng MJ: Effects of silencing the DUSP1 gene using
lentiviral vector-mediated siRNA on the release of proinflammatory
cytokines through regulation of the MAPK signaling pathway in mice
with acute pancreatitis. Int J Mol Med. 41:2213–2224.
2018.PubMed/NCBI
|
|
39
|
Cao MH, Xu J, Cai HD, Lv ZW, Feng YJ, Li
K, Chen CQ and Li YY: p38 MAPK inhibition alleviates experimental
acute pancreatitis in mice. Hepatobiliary Pancreat Dis Int.
14:101–106. 2015. View Article : Google Scholar : PubMed/NCBI
|
|
40
|
Ma R, Yuan F, Wang S, Liu Y, Fan T and
Wang F: Calycosin alleviates cerulein-induced acute pancreatitis by
inhibiting the inflammatory response and oxidative stress via the
p38 MAPK and NF-κB signal pathways in mice. Biomed Pharmacother.
105:599–605. 2018. View Article : Google Scholar : PubMed/NCBI
|
|
41
|
Sandoval J, Pereda J, Pérez S, Finamor I,
Vallet-Sánchez A, Rodríguez JL, Franco L, Sastre J and López-Rodas
G: Epigenetic regulation of early- and late-response genes in acute
pancreatitis. J Immunol. 197:4137–4150. 2016. View Article : Google Scholar : PubMed/NCBI
|
|
42
|
Woo SM, Min KJ, Kim S, Park JW, Kim DE,
Chun KS, Kim YH, Lee TJ, Kim SH, Choi YH, et al: Silibinin induces
apoptosis of HT29 colon carcinoma cells through early growth
response-1 (EGR-1)-mediated non-steroidal anti-inflammatory
drug-activated gene-1 (NAG-1) up-regulation. Chem Biol Interact.
211:36–43. 2014. View Article : Google Scholar : PubMed/NCBI
|
|
43
|
Yan L, Wang Y, Liang J, Liu Z, Sun X and
Cai K: miR-301b promotes the proliferation, mobility, and
epithelial-to-mesenchymal transition of bladder cancer cells by
targeting EGR1. Biochem Cell Biol. 95:571–577. 2017. View Article : Google Scholar : PubMed/NCBI
|
|
44
|
Leu SY, Kuo LH, Weng WT, Lien IC, Yang CC,
Hsieh TT, Cheng YN, Chien PH, Ho LC, Chen SH, et al: Loss of EGR-1
uncouples compensatory responses of pancreatic β cells.
Theranostics. 10:4233–4249. 2020. View Article : Google Scholar : PubMed/NCBI
|
|
45
|
Billah M, Ridiandries A, Rayner BS,
Allahwala UK, Dona A, Khachigian LM and Bhindi R: Egr-1 functions
as a master switch regulator of remote ischemic
preconditioning-induced cardioprotection. Basic Res Cardiol.
115:32019. View Article : Google Scholar : PubMed/NCBI
|
|
46
|
Fichtner-Feigl S, Strober W, Kawakami K,
Puri RK and Kitani A: IL-13 signaling through the IL-13alpha2
receptor is involved in induction of TGF-beta1 production and
fibrosis. Nat Med. 12:99–106. 2016. View
Article : Google Scholar
|
|
47
|
Hogan KA, Ravindran A, Podolsky MA and
Glick AB: The TGFβ1 pathway is required for NFκB dependent gene
expression in mouse keratinocytes. Cytokine. 64:652–659. 2013.
View Article : Google Scholar : PubMed/NCBI
|
|
48
|
Ho LC, Sung JM, Shen YT, Jheng HF, Chen
SH, Tsai PJ and Tsai YS: Egr-1 deficiency protects from renal
inflammation and fibrosis. J Mol Med (Berl). 94:933–942. 2016.
View Article : Google Scholar : PubMed/NCBI
|
|
49
|
Solovey A, Somani A, Belcher JD, Milbauer
L, Vincent L, Pawlinski R, Nath KA, Kelm RJ Jr, Mackman N,
O'Sullivan MG, et al: A monocyte-TNF-endothelial activation axis in
sickle transgenic mice: Therapeutic benefit from TNF blockade. Am J
Hematol. 92:1119–1130. 2017. View Article : Google Scholar : PubMed/NCBI
|
|
50
|
Bi JG, Zheng JF, Li Q, Bao SY, Yu XF, Xu P
and Liao CX: MicroRNA-181a-5p suppresses cell proliferation by
targeting Egr1 and inhibiting Egr1/TGF-β/Smad pathway in
hepatocellular carcinoma. Int J Biochem Cell Biol. 106:107–116.
2019. View Article : Google Scholar : PubMed/NCBI
|
|
51
|
Li DM, Zhong M, Su QB, Song FM, Xie TG, He
JH, Wei J, Lu GS, Hu XX and Wei GN: Active fraction of polyrhachis
vicina rogers (AFPR) suppressed breast cancer growth and
progression via regulating EGR1/lncRNA-NKILA/NF-κB axis. Biomed
Pharmacother. 123:1096162020. View Article : Google Scholar : PubMed/NCBI
|
|
52
|
Pang Z, Raudonis R, McCormick C and Cheng
Z: Early growth response 1 deficiency protects the host against
pseudomonas aeruginosa lung infection. Infect Immun. 88:e00678–19.
2019. View Article : Google Scholar : PubMed/NCBI
|
|
53
|
Xiao C, Nemazee D and Gonzalez-Martin A:
MicroRNA control of B cell tolerance, autoimmunity and cancer.
Semin Cancer Biol. 64:102–107. 2020. View Article : Google Scholar : PubMed/NCBI
|
|
54
|
Liu J, Cao L, Feng Y, Li Y and Li T:
miR-338-3p inhibits TNF-α-induced lipogenesis in human sebocytes.
Biotechnol Lett. 39:1343–1349. 2017. View Article : Google Scholar : PubMed/NCBI
|
|
55
|
Zhao L, Liu YW, Yang T, Gan L, Yang N, Dai
SS and He F: The mutual regulation between miR-214 and A2AR
signaling plays an important role in inflammatory response. Cell
Signal. 27:2026–2034. 2015. View Article : Google Scholar : PubMed/NCBI
|
|
56
|
Tay Y, Rinn J and Pandolfi PP: The
multilayered complexity of ceRNA crosstalk and competition. Nature.
505:344–352. 2014. View Article : Google Scholar : PubMed/NCBI
|
|
57
|
Thomson DW and Dinger ME: Endogenous
microRNA sponges: Evidence and controversy. Nat Rev Genet.
17:272–283. 2016. View Article : Google Scholar : PubMed/NCBI
|