Introduction
A chronic excessive intake of fat is associated with
its accumulation in various tissues. For instance, this process
does not only occur in adipose tissues, but also in the liver,
skeletal muscle and other non-adipose tissues, leading to the
development of obesity and insulin resistance (1,2).
Exercise improves insulin resistance by reducing obesity-induced
fat accumulation in adipose tissues and ectopic deposition of fat
in the liver (3,4). Moreover, it has been reported that
mTOR serves an important role in the development of insulin
resistance induced by obesity (5).
mTOR is a highly conserved serine/threonine kinase, which includes
two functionally distinct multiprotein complexes, known as the
rapamycin-sensitive mTOR complex 1 (mTORC1) and
rapamycin-insensitive mTOR complex 2 (mTORC2) (5). mTORC1 leads to feedback suppression
of the insulin signals and of its substrate ribosomal protein S6
kinase 1 (S6K1). Furthermore, high-fat diet (HFD)-induced obesity
constitutively activates mTORC1 signaling pathways in the liver,
leading to cellular damage, while exercise markedly lowers the
increased activities of mTORC1 signaling in the liver caused by HFD
(6–8). The mTORC1 inhibitor rapamycin, which
is used as a potent immunosuppressant in patients with organ
transplants, has been considered for the treatment of metabolic
disorders (9). However, the
precise mechanisms underlying the improvement of insulin resistance
induced by exercise and the maintenance of hepatic lipid
homeostasis in HFD remain unknown.
mTORC1 is an important sensor that allows cells and
tissues to adapt to their metabolism in response to nutritional
stimuli (10). It has been shown
that nuclear transcription factors, including peroxisome
proliferator-activated receptor γ coactivator 1 (PGC-1), peroxisome
proliferator-activated receptors (PPARs), sterol regulatory element
binding protein-1c (SREBP-1c) and carbohydrate-response
element-binding protein (ChREBP), are critical to the regulation of
liver glucose and lipid metabolism gene expression, which in turn
affects the activity of the enzymes involved in fatty acid
metabolism (11,12). mTORC1 has been identified as a
positive regulator of hepatic triglyceride synthesis and a negative
regulator of the expression levels of hepatic PGC-1α, PPARα and its
target genes, such as carnitine palmitoyl transferase-1 (CPT1) and
pyruvate dehydrogenase kinase 4 (PDK4) (13,14).
Exercise can promote glucose and lipid homeostasis, as well as
improve glucose tolerance and insulin intolerance (15). Chronic administration of rapamycin
may led to dysregulated lipid and glucose metabolism, causing a
reduction of fat mass and the aggravation of glucose intolerance
(16). Previous studies have
investigated the changes noted in hepatic lipid and glucose
metabolism in response to mTOR activation or inactivation based on
liver-specific knockout models of phosphatase and tensin homolog,
Tuberous Sclerosis Complex-1 (Tsc1), mTORC1 component and rapamycin
administration in different contexts (17–19).
For example, the liver-specific deletion of DEP domain containing
mTOR-interacting protein increased the activity of mTORC1, thereby
promoting oxidative metabolism and reducing circulating glucose
levels in fasting mice, which were corrected by rapamycin (17). In addition, the activation of
mTORC1 induced by the loss of hepatic Tsc1, suppressed
gluconeogenesis and tricarboxylic acid cycle oxidation (18).
In the present study, biochemical, molecular
biological and histological methods were used to investigate the
effects of rapamycin on the exercise-induced changes caused in
genes associated with energy metabolism in the liver of HFD
rats.
Materials and methods
Experimental animals
A total of 30 male Sprague-Dawley rats (weight,
150–180 g; age, 5–6 weeks) were purchased from Guangdong Province
Experimental Animal Center. All the experimental procedures were
approved by the Institutional Animal Care and Use Committee of the
Guangzhou Sport University. All rats were raised in specific
pathogen free animal laboratory of Guangzhou Institute of Sports
Science. Rats were housed under standardized conditions with stable
temperature (22–25°C) and humidity (60±5%), a controlled light/dark
cycle (light: 06:00-18:00; dark: 18:00-06:00) and free access to
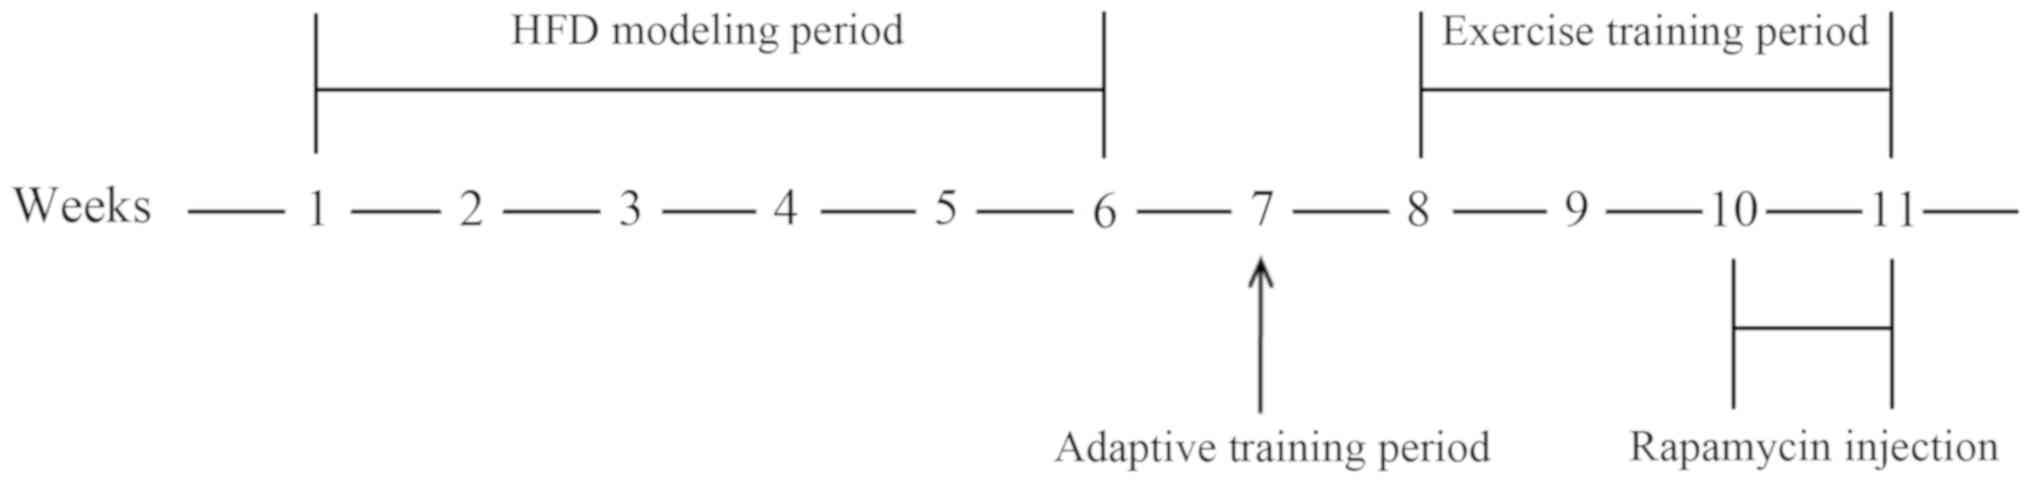
water and food. After 1 week of adaptation maintenance, rats were
randomized into normal group (N; n=6) fed chow diet and HFD group
(n=24) fed HFD (20% carbohydrate, 59% fat, 21% protein) (20) for 6 weeks.
At week 7, HFD rats were given an adaptive exercise
training by running on a motor-driven rodent treadmill (tail
electro-stimulation) for 15 min per day for 4 days at a speed of 15
m/min (0° incline), then randomly subdivided into the following
groups (n=6 rats/group): i) HFD rats with sedentary (H group); ii)
HFD rats with exercise (HE group); iii) HFD rats with rapamycin (HR
group); and iv) HFD rats with exercise and rapamycin (HER
group).
Exercise program and treatment
From weeks 8–11, the rats in the HE and HER groups
were running on a treadmill for 20–40 min once a day, 5 days per
week. The exercise volume consisted of 20–23 m/min (20–30 min) at
0% slope on week 1, 23–25 m/min (30–40 min) at 0% slope on week 2
and 25 m/min (40 min) at 0% slope on weeks 3–4. From the 10th week,
the rats in the HR and HER groups received intraperitoneal (IP)
injection of rapamycin (2 mg/kg daily; Sigma-Aldrich; Merck KGaA)
at an exercising day (1 h prior exercise) for 2 weeks (5
days/week). In the last 2 days of the 11th week, the Glucose
Tolerance Test (GTT) and the Insulin Tolerance Test (ITT) were
performed. GTT was performed by IP injection of glucose (2 g/kg
body weight; Sigma-Aldrich; Merck KGaA) following fasting for 16 h.
Blood glucose was measured at 0, 30, 60 and 120 min in 10–20 µl
blood obtained via tail nicking using the GLUCO™ CardII
glucometer (GT-1640). Similarly, ITT was performed via IP injection
of regular insulin (0.75 U/kg; Novo Nordisk) followed by glucose
measurements at 0, 15, 30 and 60 min.
At the end of the 11th week, all animals were fasted
for 12–16 h and subsequently anesthetized with pentobarbital sodium
(50 mg/kg) via IP injection. After rats were deeply anesthetized,
4–6 ml arterial blood from the abdominal aorta was collected and
the plasma was immediately separated using centrifugation (1,000 ×
g for 10 min at room temperature) and stored at −80°C for
biochemical analysis. Then, rats were euthanatized via cervical
dislocation. The liver tissues were quickly excised and fixed with
4% paraformaldehyde at room temperature for 48 h or frozen in
liquid nitrogen and subsequently stored at −80°C for further
analysis. Visceral fat weight was removed and estimated by the
weight of greater mesenteric, epididymal and perirenal fat
(20). The experimental procedure
is presented in Fig. 1. All
animals maintained good health throughout the experiment, with no
need for early euthanasia.
Blood biochemical analysis
Fasting blood glucose (FBG; cat. no. F006-1-1),
fasting plasma TG (FTG; cat. no. A110-2-1) and fasting plasma
non-esterified fatty acids (FFA; cat. no. A042-1-1) were detected
using colorimetric assay kits (Nanjing Jiancheng Bioengineering
Institute). Fasting plasma insulin (FINS; cat. no. MM-0587R1) and
β-hydroxybutyrate (cat. no. MM-20814R1) were measured according to
the manufacturers' protocols of commercially available ELISA kits
(Jiangsu Meimian industrial Co., Ltd.).
Measurement of hepatic TG content and
mitochondrial enzyme activities
The TG content in the liver was determined following
lipid extraction using the Folch method (21). The mitochondrial enzyme activities
were measured as follows: A portion of liver tissue was homogenized
in ice-cold buffer containing 175 mM KCl, 10 mM glutathione and 2
mM EDTA at pH 7.4. The homogenized extracts were centrifuged at
18,000 × g for 5 min at 4°C and the supernatants were transferred
to new tubes. Succinate dehydrogenase (SDH; cat. no. K660-100) and
cytochrome c oxidase (COX; cat. no. K287-100) activities were
measured at 37°C using commercially available kits according to the
manufacturers' instructions (BioVision, Inc.). β-hydroxyacyl-CoA
dehydrogenase (HADH) activity was determined at 37°C using the
reaction media containing 0.1 M triethanolamine-HCl, 5 mM EDTA,
0.45 mM NADH and 0.1 mM acetoacetyl-CoA at pH 7.0 (22). Enzyme activity was assayed
spectrophotometrically using the Tecan Microplate Reader (Infinite
M200; Tecan Group, Ltd.).
Hematoxylin and eosin (H&E) and
Oil Red O staining
For H&E staining, the liver tissue was fixed
with 4% paraformaldehyde for 48 h at room temperature, dehydrated
with an ascending alcohol series, made transparent in xylene at
room temperature and embedded in paraffin. Subsequently, the
samples were cut into 12-µm thick cross sections using a rotary
microtome (Leica Microsystems GmbH). The sections were washed with
xylene at room temperature, rehydrated using a descending alcohol
series and stained with hematoxylin (Sigma-Aldrich; Merck KGaA) for
15 min at room temperature. Subsequently, the sections were washed
with water for 10 min, immersed in 0.2% hydrochloric acid alcohol
for 3–5 sec, washed with water for another 10 min and then stained
with 1% eosin (Sigma-Aldrich; Merck KGaA) for 1 min at room
temperature. Following the staining, the sections were dehydrated
with an ascending alcohol series, washed with xylene and mounted
with neutral balsam (Beijing Solarbio Science & Technology Co.,
Ltd.).
For Oil Red O staining, the liver tissue was fixed
in 4% paraformaldehyde for 48 h at room temperature, rinsed with
0.1 M PBS for 10 min at room temperature, dehydrated with an
ascending sucrose series at 4°C, embedded in OCT-freeze medium
(cat. no. 4583; Sakura Finetek USA, Inc.) and sectioned in 12-µm
thick sections using a freezing microtome (Leica Microsystems
GmbH). Subsequently, the sections were washed with deionized water
3 times for 30 sec each, stained with a working solution of 0.3%
Oil red O (cat. no. O0625; Sigma-Aldrich; Merck KGaA) at room
temperature for 30 min, rinsed with water for 10 min and then
mounted with glycerol gelatin (Sigma-Aldrich; Merck KGaA). Stained
sections were visualized using a light microscope (magnification,
×100 and ×200; LEICA DM750; Leica Microsystems GmbH).
Reverse transcription-quantitative PCR
(RT-qPCR)
The mRNA expression levels of PPARα, PPARβ, PGC-1α,
PGC-1β, SREBP-1c, ChREBP, CPT1α, acyl-CoA carboxylase 1(ACCα) and
PDK4 were detected in the liver tissues using RT-qPCR
(LightCycler®; Roche Diagnostic). Total RNA was
extracted from 50 mg liver tissue using an RNA extraction reagent
(cat. no. CW0580; CoWin Biosciences). Following spectroscopic
quantification, cDNA was synthesized using 4 µl RNA template at the
following conditions: 37°C for 15 min and 85°C for 5 sec using the
PrimeScript™ RT reagent kit (cat. no. RR047A; Takara
Bio, Inc.). Subsequently, 9.5 µl dH2O, 12.5 µl TB Green
Premix Ex Taq buffer (2X), 0.5 µl forward primer (10 pmol/µl), 0.5
µl reverse primer (10 pmol/µl) and 2 µl cDNA were mixed based on
the manufacturer's protocol of the TB Green Premix Ex
Taq™ kit (cat. no. RR420A; Takara Bio, Inc.), and
RT-qPCR was performed using the following conditions: Initial
denaturation at 93°C for 2 min, followed by 40 cycles at 93°C for
15 sec, 55°C for 25 sec and 72°C for 25 sec. The primer sequences
of each gene are listed in Table
SI. The Cycle Threshold values, which represented the cycle
times when the fluorescence signal in each reaction tube reached
the set threshold value, were calculated. The housekeeping gene
GAPDH was used in order to normalize the expression levels for each
gene of interest according to the mean cycle number. The
2−ΔΔCq method was used to calculate the relative amounts
of the target gene (23).
Western blotting
The liver tissues were lysed with a solution
containing 150 mM NaCl, 5 mM EDTA, 50 mM Tri-HCl (pH 8.0), 1% NP
40, 1 mM aprotinin, 0.1 mM leupeptin and 1 mM pepstatin. The
solution was centrifuged at 4°C at 18,000 × g for 30 min. The
supernatants were collected and the protein concentration in the
homogenates was measured using the Bradford method (24). Subsequently, 30 µg protein/lane was
separated using 10% SDS-PAGE, transferred to nitrocellulose
membranes, blocked in 5% skimmed milk for 1 h at room temperature,
incubated with the primary antibodies overnight at 4°C and then
incubated with secondary antibodies for 2 h at room temperature.
The primary antibodies used were as follows: Anti-akt (1:200; cat.
no. sc-5298; Santa Cruz Biotechnology, Inc.), anti-phosphorylated
(p)-Akt ser473(1:1,000; cat. no. AF887; Bio-Techne Ltd.), anti-S6
(1:200; cat. no. sc-8418; Santa Cruz Biotechnology, Inc.),
anti-p-S6 (1:200; cat. no. sc-54279; Santa Cruz Biotechnology,
Inc.) and anti-GAPDH (1:3,000; cat. no. CW0100M; CoWin Biosciences,
Inc.). The fluorescent secondary antibodies were as follows: IRDye
680LT-conjugated anti-rabbit (red; 1:20,000; cat. no. 925-68021;
LI-COR Biosciences) and IRDye 800-conjugated anti-mouse secondary
antibody (green; 1:20,000; cat. no. 925-32212; LI-COR Biosciences).
The membrane bands were scanned and assessed using the LI-COR
Odyssey infrared imaging system (LI-COR Biosciences). The
expression levels were analyzed using LI-COR Odyssey application
software (version 3.0.30; LI-COR Biosciences).
Statistical analysis
One-way ANOVA followed by Bonferroni post hoc test
was performed for any intergroup differences. All of the analyses
were performed using the SPSS 21.0 software (IBM Corp.). Data are
presented as the mean ± standard error. P<0.05 was considered to
indicate a statistically significant difference.
Results
Exercise but not rapamycin reduces TG
content in the liver of HFD rats
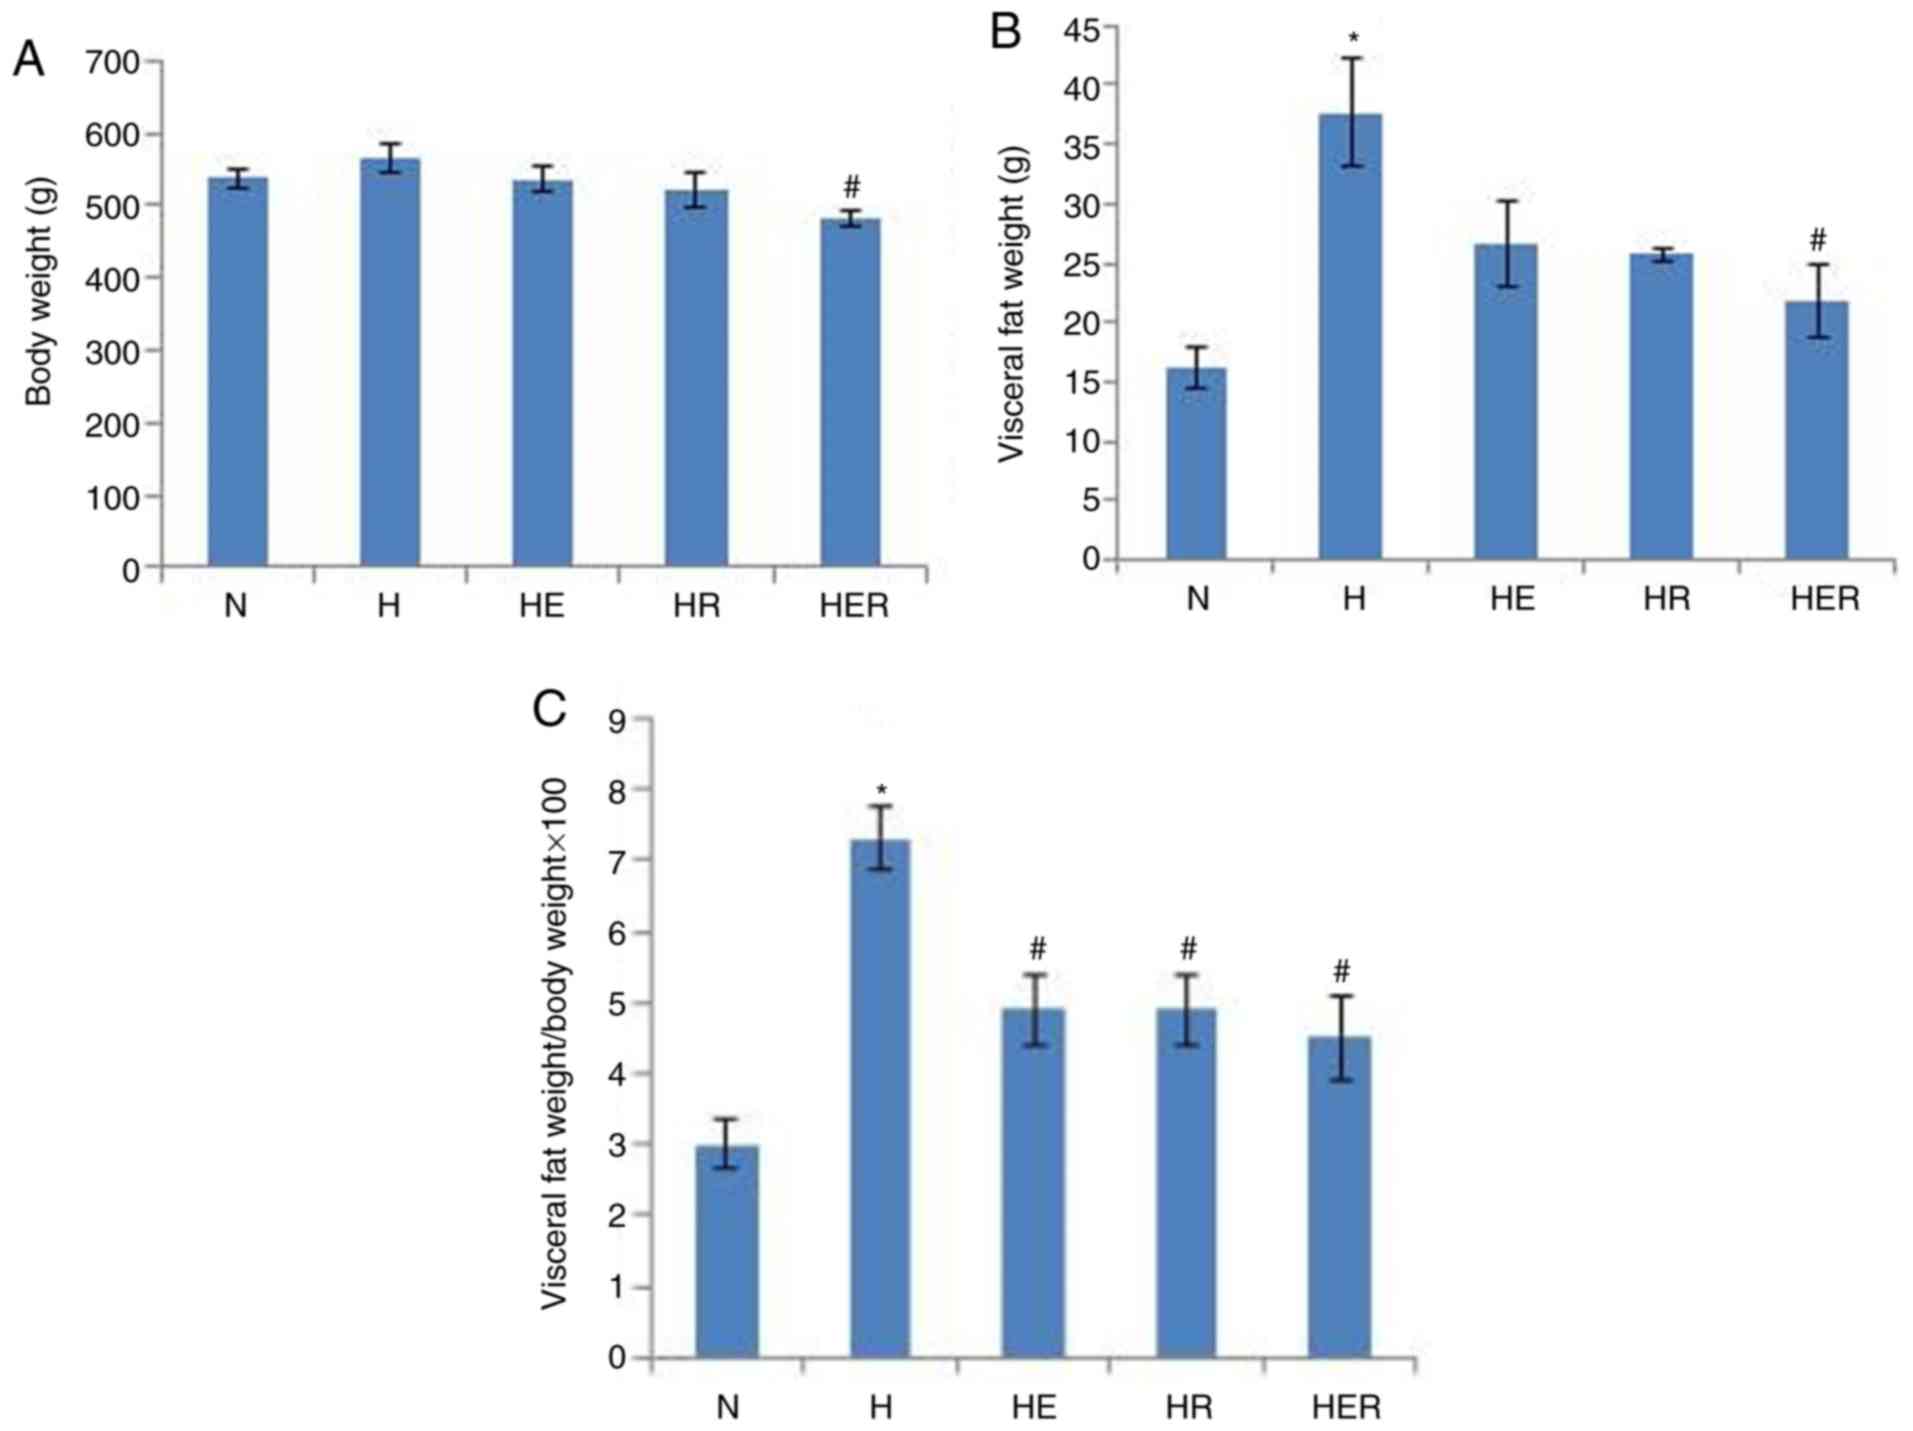
Compared with the N group, the visceral fat weight
was significantly increased in the H group (Fig. 2B). HER rats exhibited significantly
lower body weight and visceral fat compared with the H rats
(Fig. 2A-C). However, exercise and
rapamycin exhibited no significant effects on the levels of blood
biochemical parameters (Table
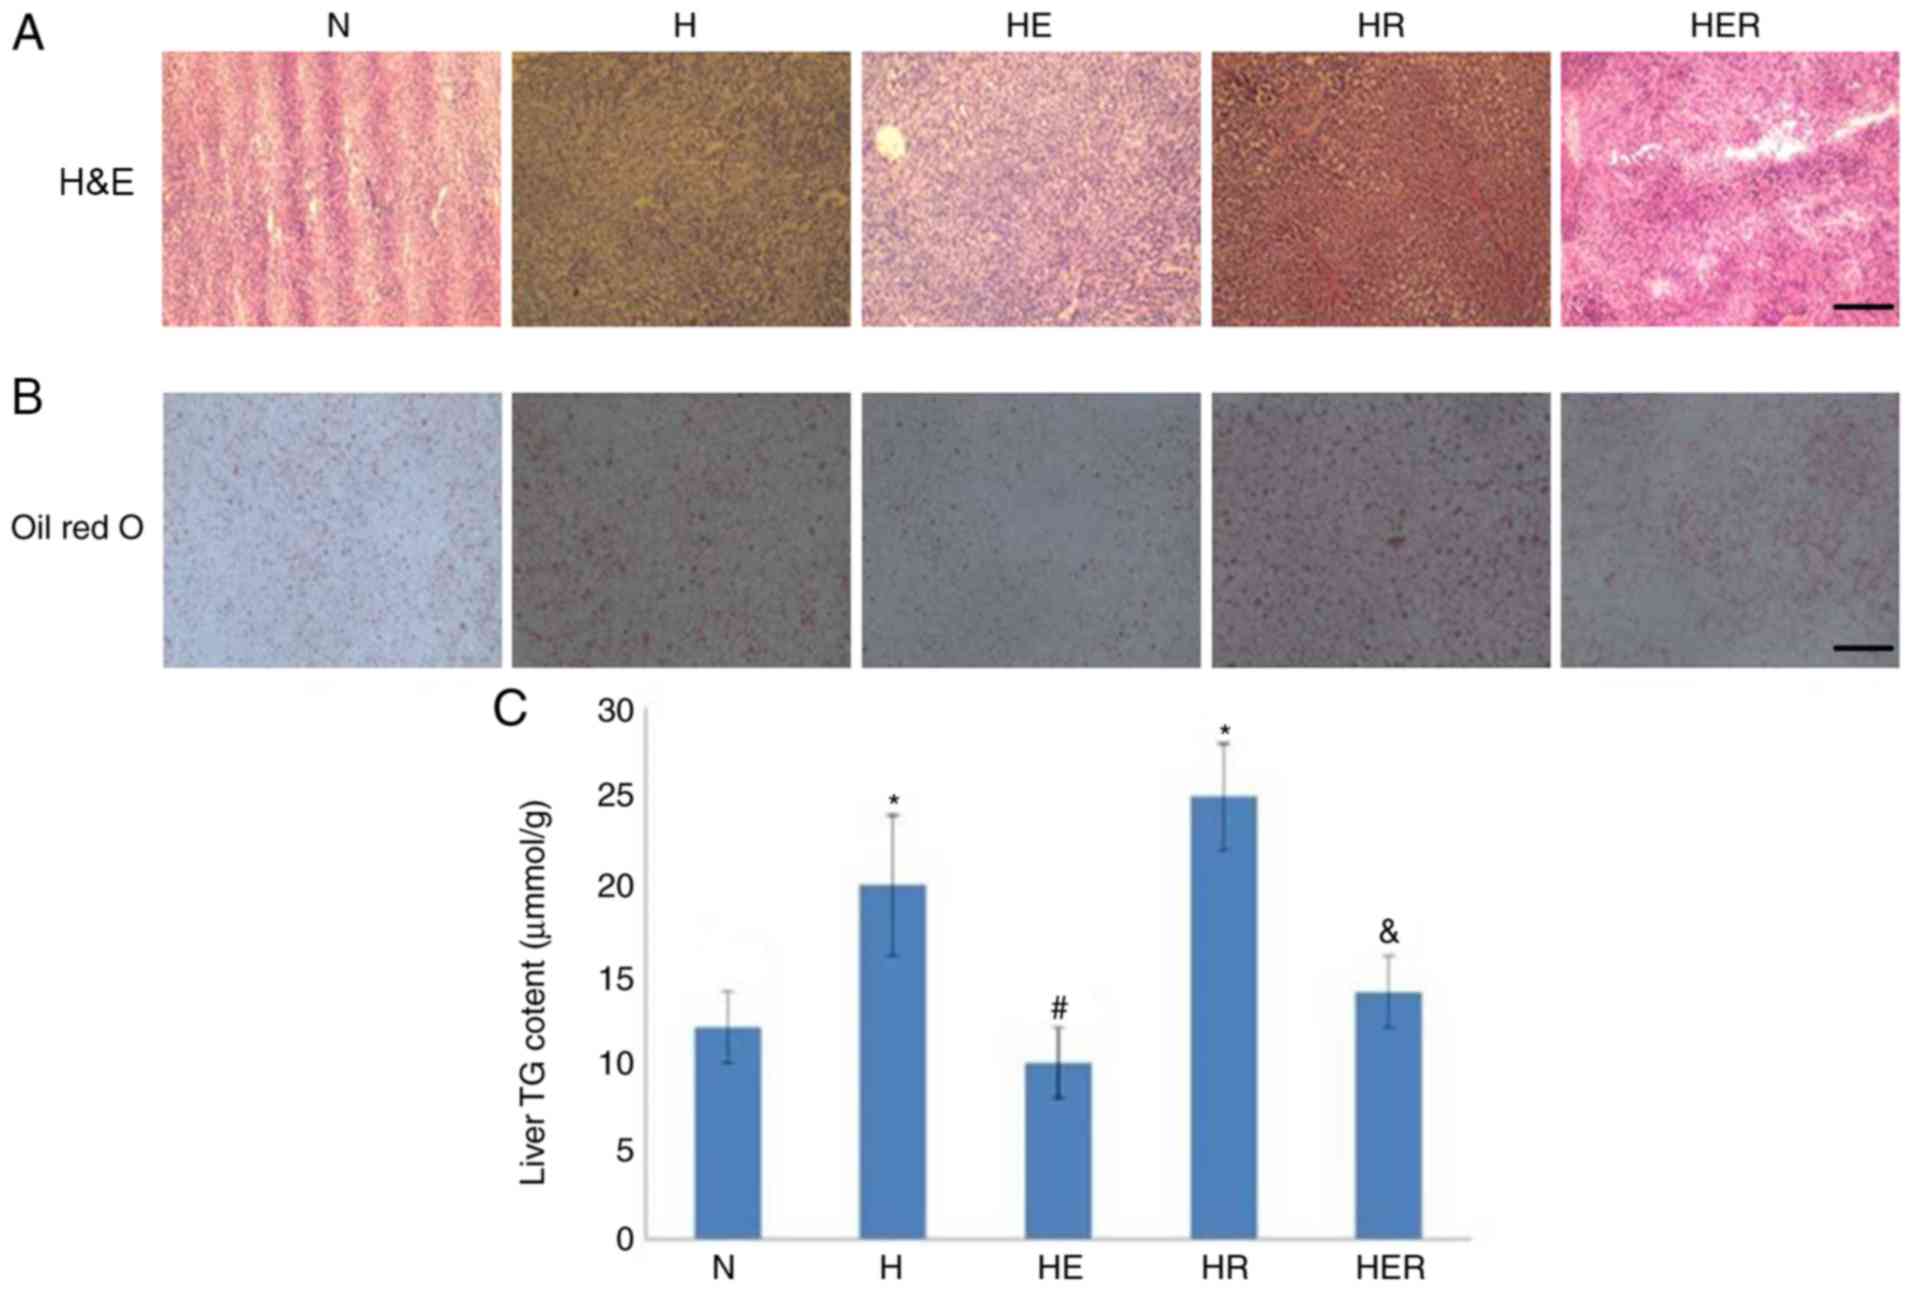
SII). Histological analysis and biochemical measurements
indicated significant lipid deposition in the rats of the H group
compared with rats in the N group. In contrast, compared with the H
group, lipid deposition was markedly reduced in the HE group.
Compared with the HR group, lipid deposition was markedly reduced
in the HER group. These results indicated that exercise can reduce
lipid deposition (Fig. 3).
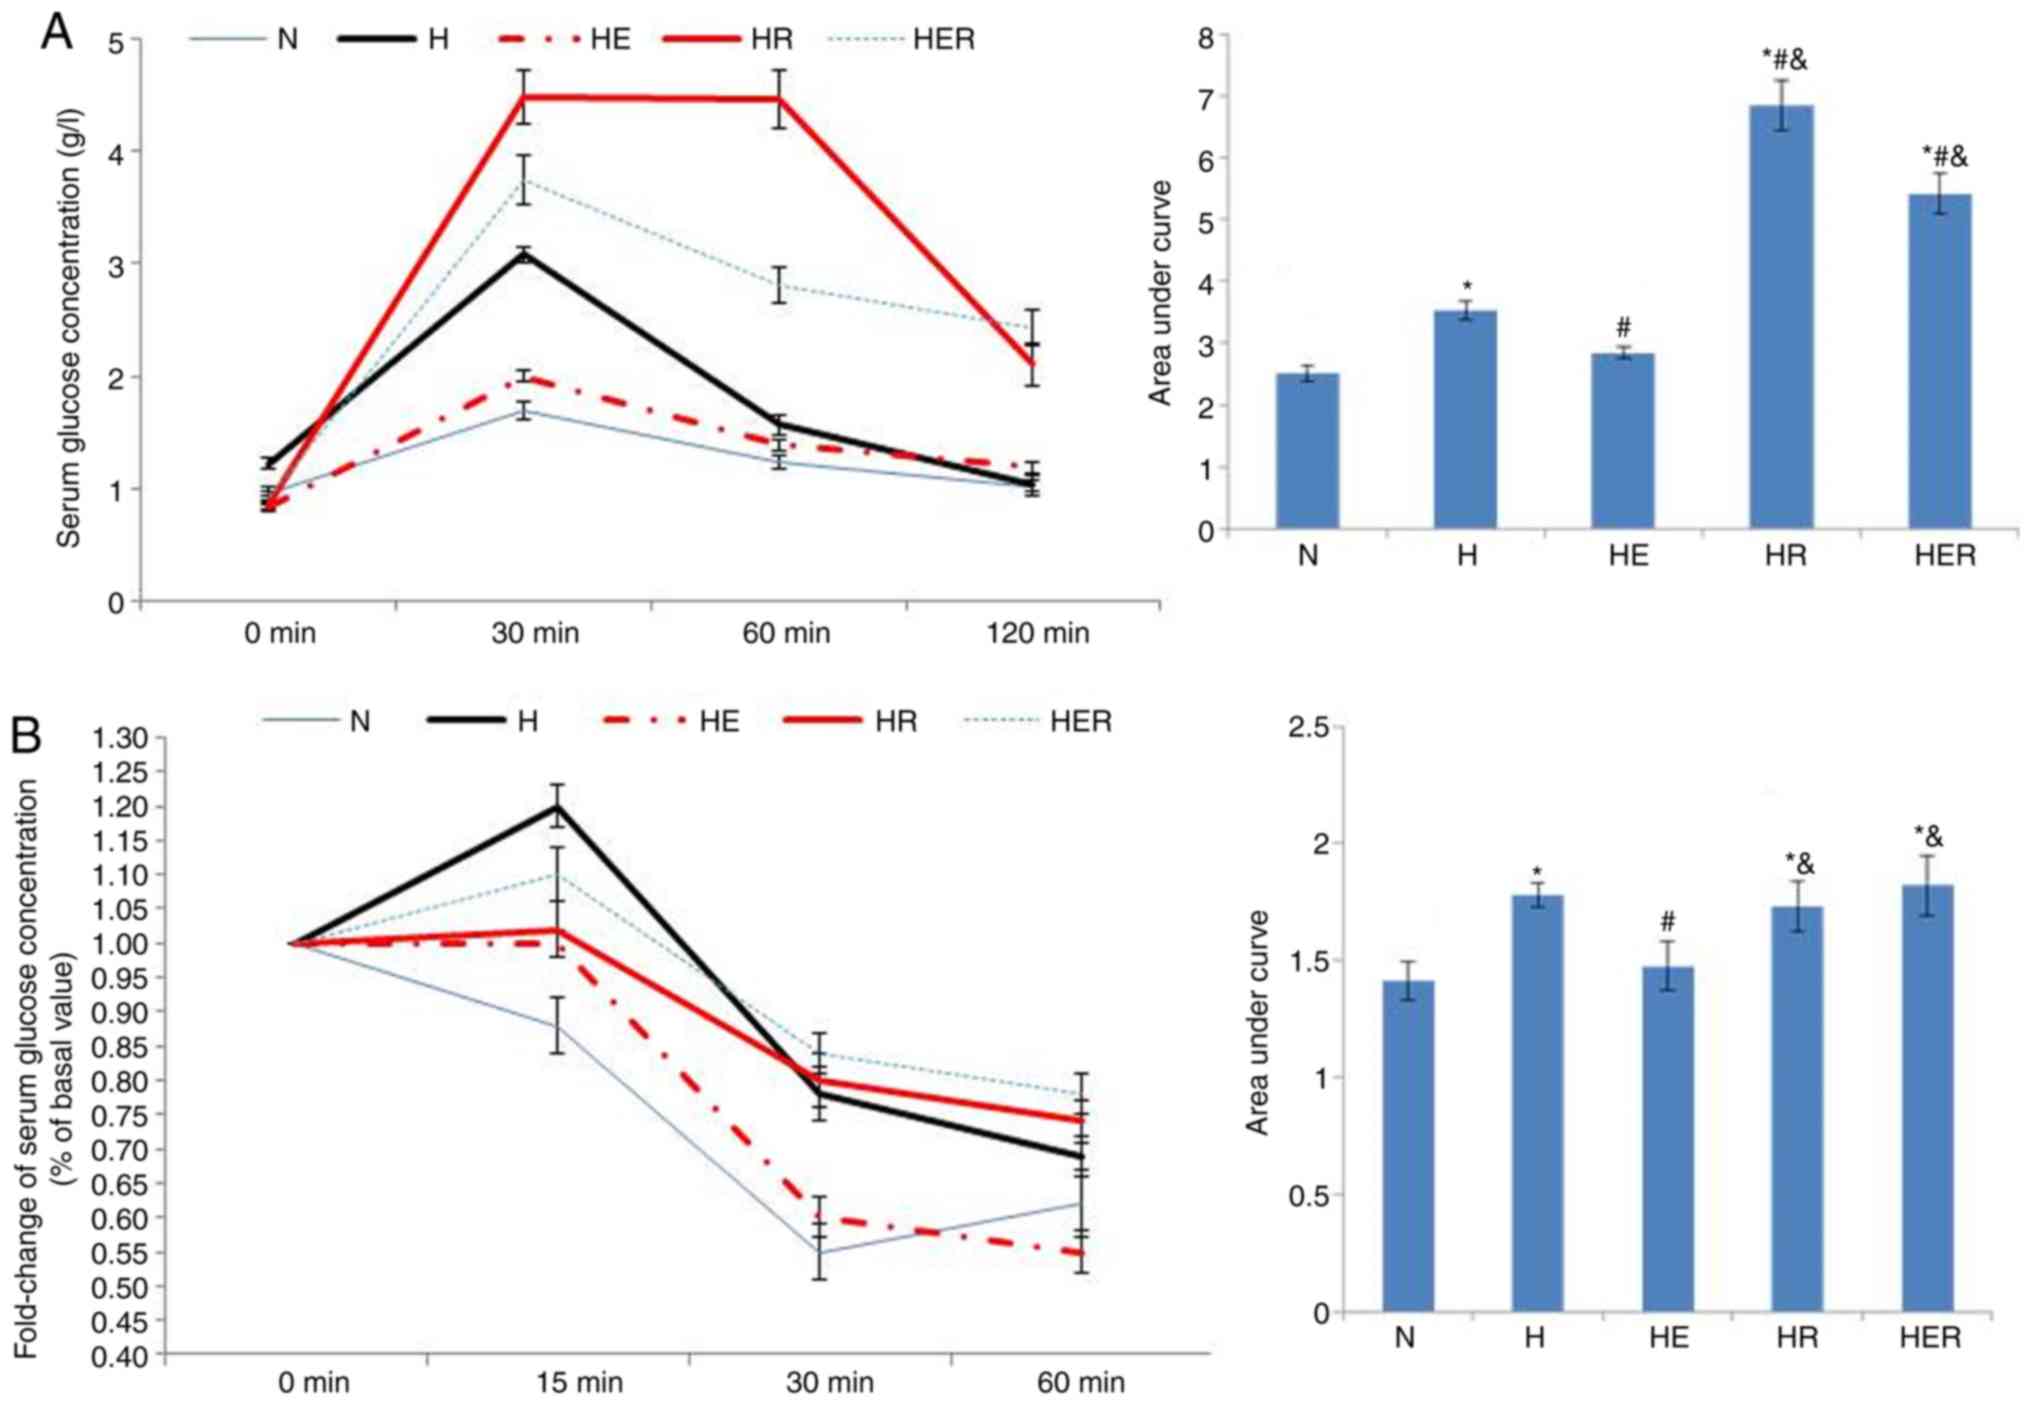
In the glucose tolerance test, the serum glucose
concentration was significantly increased in the H, HR and HER
groups compared with the N group (Fig.
4A). Compared with the H group, the serum glucose concentration
was markedly reduced in the HE group, while increased in the HR and
HER groups. Compared with the HE group, the serum glucose
concentration was increased in the HR and HER groups. In the
insulin tolerance test, the fold-change of serum glucose
concentration was significantly increased in the H, HR and HER
groups compared with the N group (Fig.
4B). Compared with the H group, the fold change of serum
glucose concentrations in the HE group was significantly reduced.
Compared with the HE group, the fold change of serum glucose
concentrations in the HR and HER groups were significantly
increased. These results indicated that exercise significantly
alleviated glucose intolerance and insulin intolerance, while
rapamycin not only increased glucose intolerance, but also impaired
exercise-induced improvement of glucose intolerance and insulin
intolerance (Fig. 4).
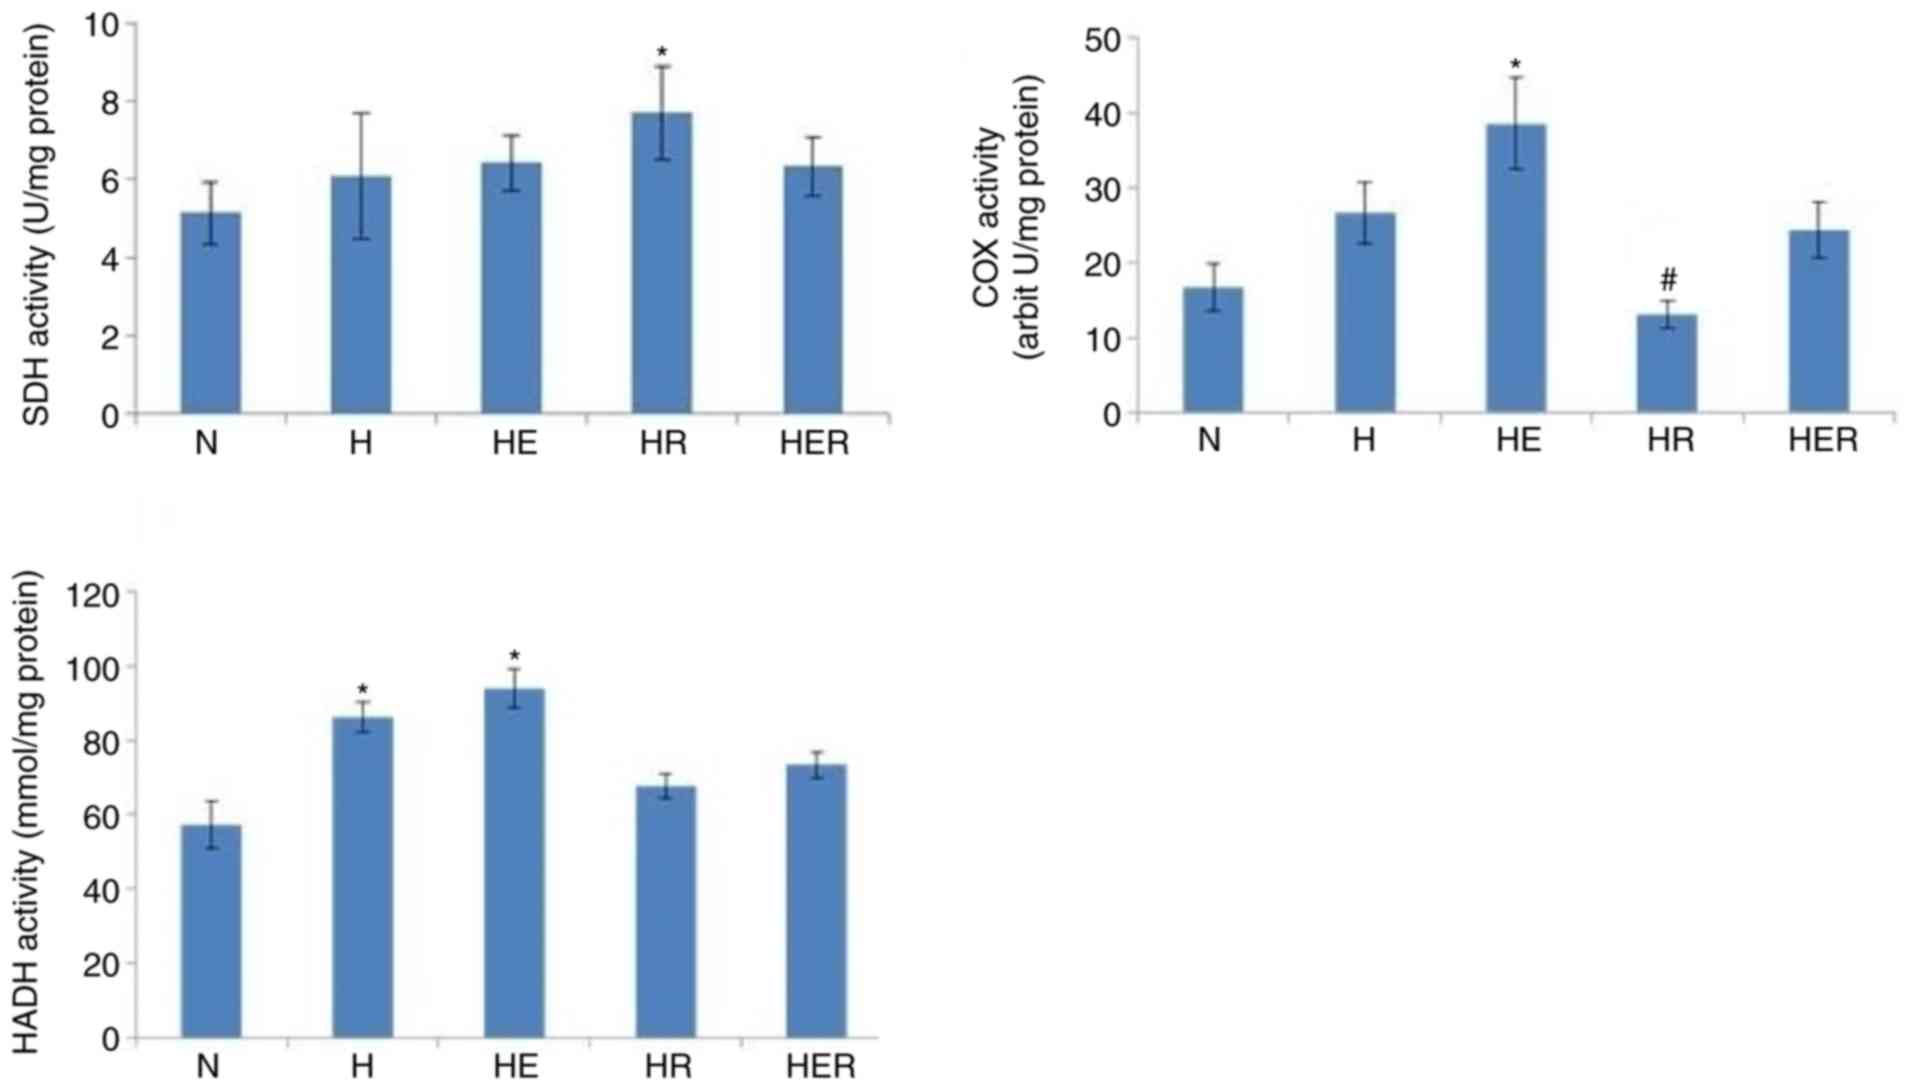
Effects of exercise and rapamycin on
mitochondrial enzyme activities
Exercise increased the activities of COX and HADH,
but not those of SDH, in the liver of HFD rats compared with the N
group. In addition, compared with the H group, rapamycin
significantly reduced COX activity, while it exhibited no effects
on the activities of SDH and HADH in the liver tissues of HFD rats
(Fig. 5).
Effects of exercise and rapamycin on
the expression levels of energy metabolism genes in the liver
The mRNA expression of PGC-1α in the HER group was
significantly increased compared with the N and H groups. Moreover,
hepatic PPARβ mRNA expression was significantly reduced in the H,
HR, and HER groups compared with the N group, and hepatic PGC-1β
mRNA expression was significantly increased in the HE group
compared with the N and H group. Rapamycin administration alone did
not affect PGC-1α, PGC-1β, PPARα, PPARβ, SREBP-1c, ChREBP, CPT1α,
ACCα and PDK4 mRNA expression levels (Fig. 6) in fasting HFD rats with exercise
or without exercise.
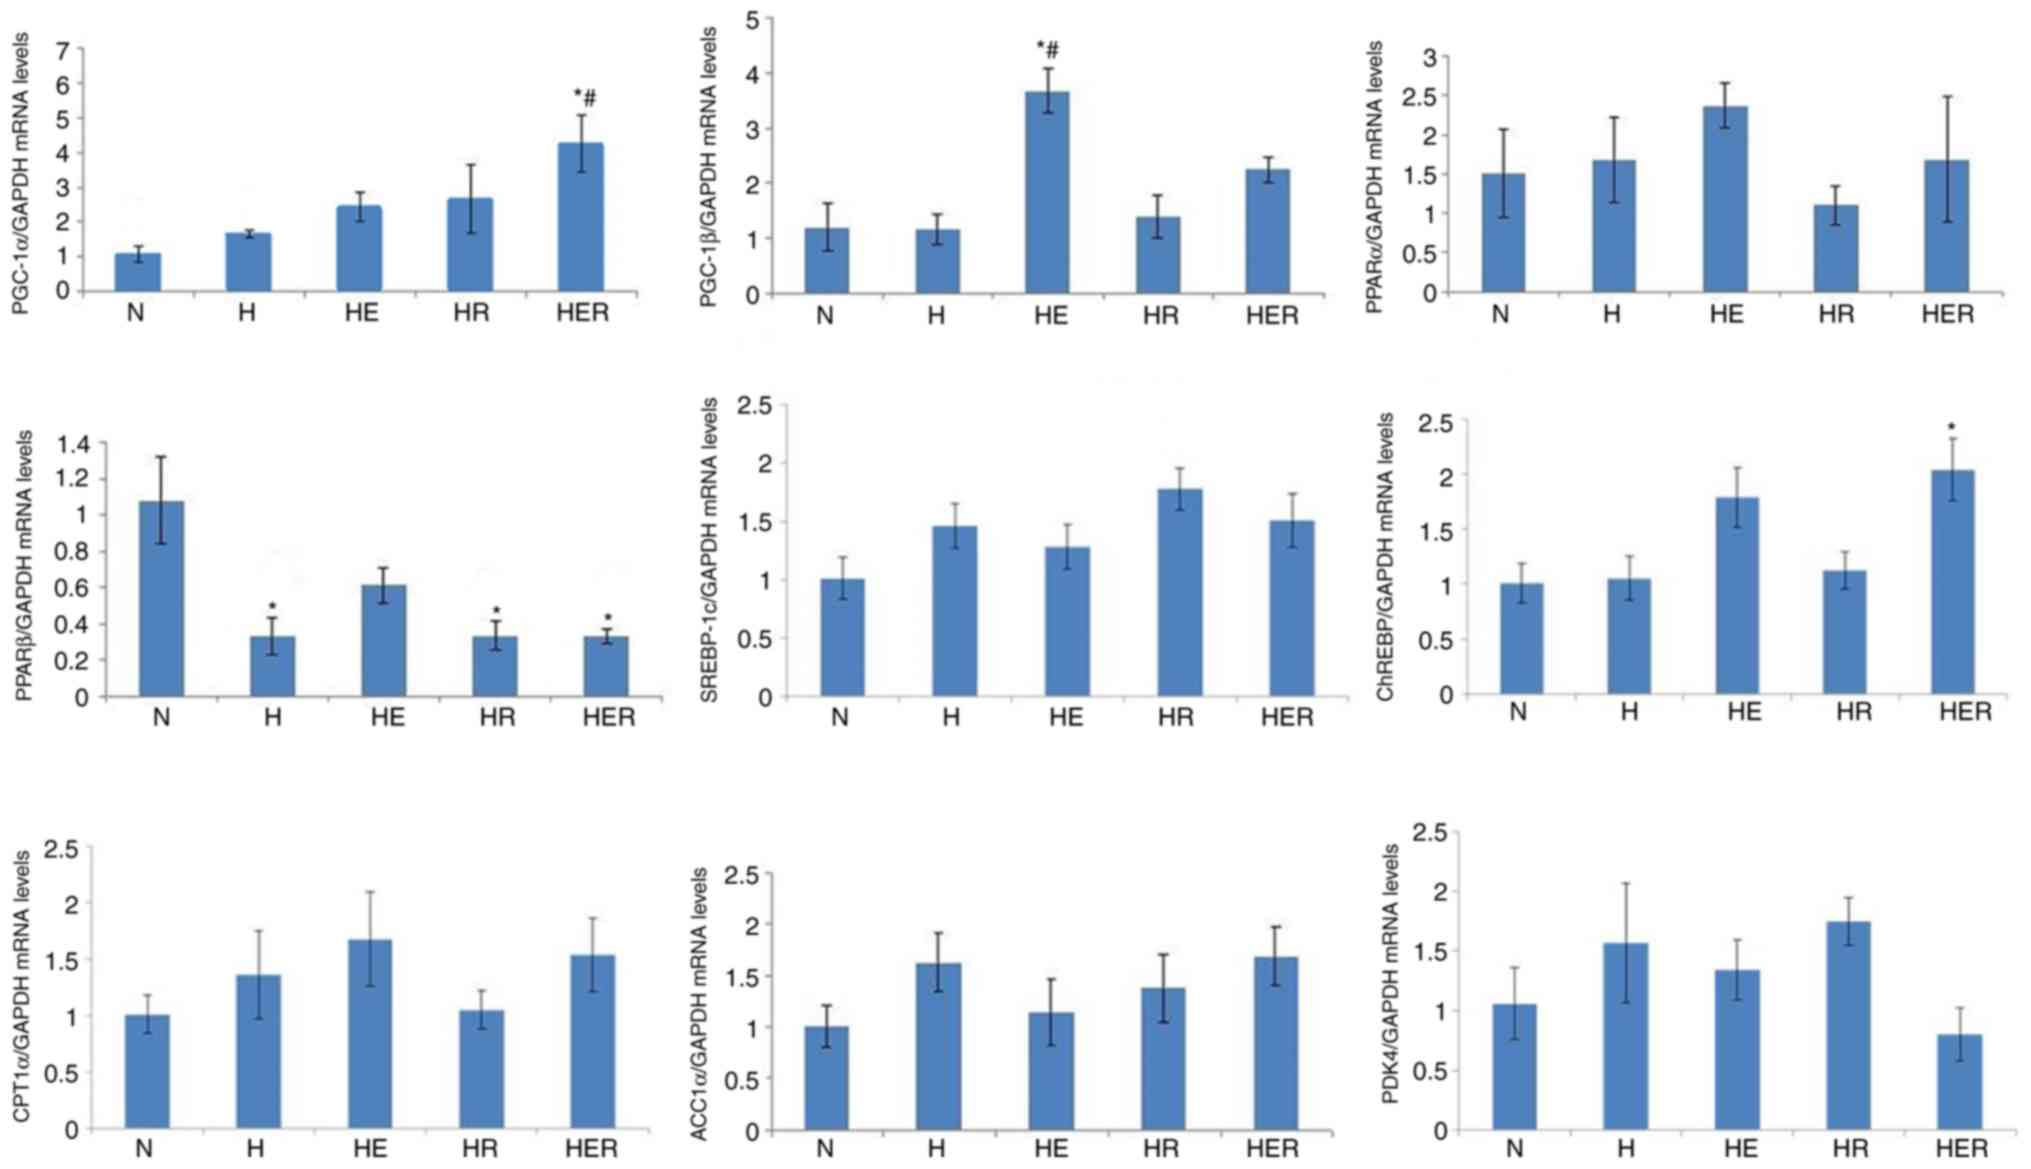 | Figure 6.Gene expression levels associated
with energy metabolism in the liver tissues of rats fed N chow or
HFD with or without E following R administration. Data are
presented as the mean ± SE for n=4-6 rats. *P<0.05 vs. N group;
#P<0.05 vs. H group. N, normal; H, HFD rats with
sedentary; HFD, high-fed diet; E, exercise; R, rapamycin; PGC,
peroxisome proliferator-activated receptor γ coactivator; PPAR,
peroxisome proliferator-activated receptor; SREBP, sterol
regulatory element binding protein; ChREBP, carbohydrate-response
element-binding protein; CPT1α, carnitine palmitoyl transferase1α;
ACCα, acyl-CoA carboxylase 1; PDK4, pyruvate dehydrogenase kinase
4. |
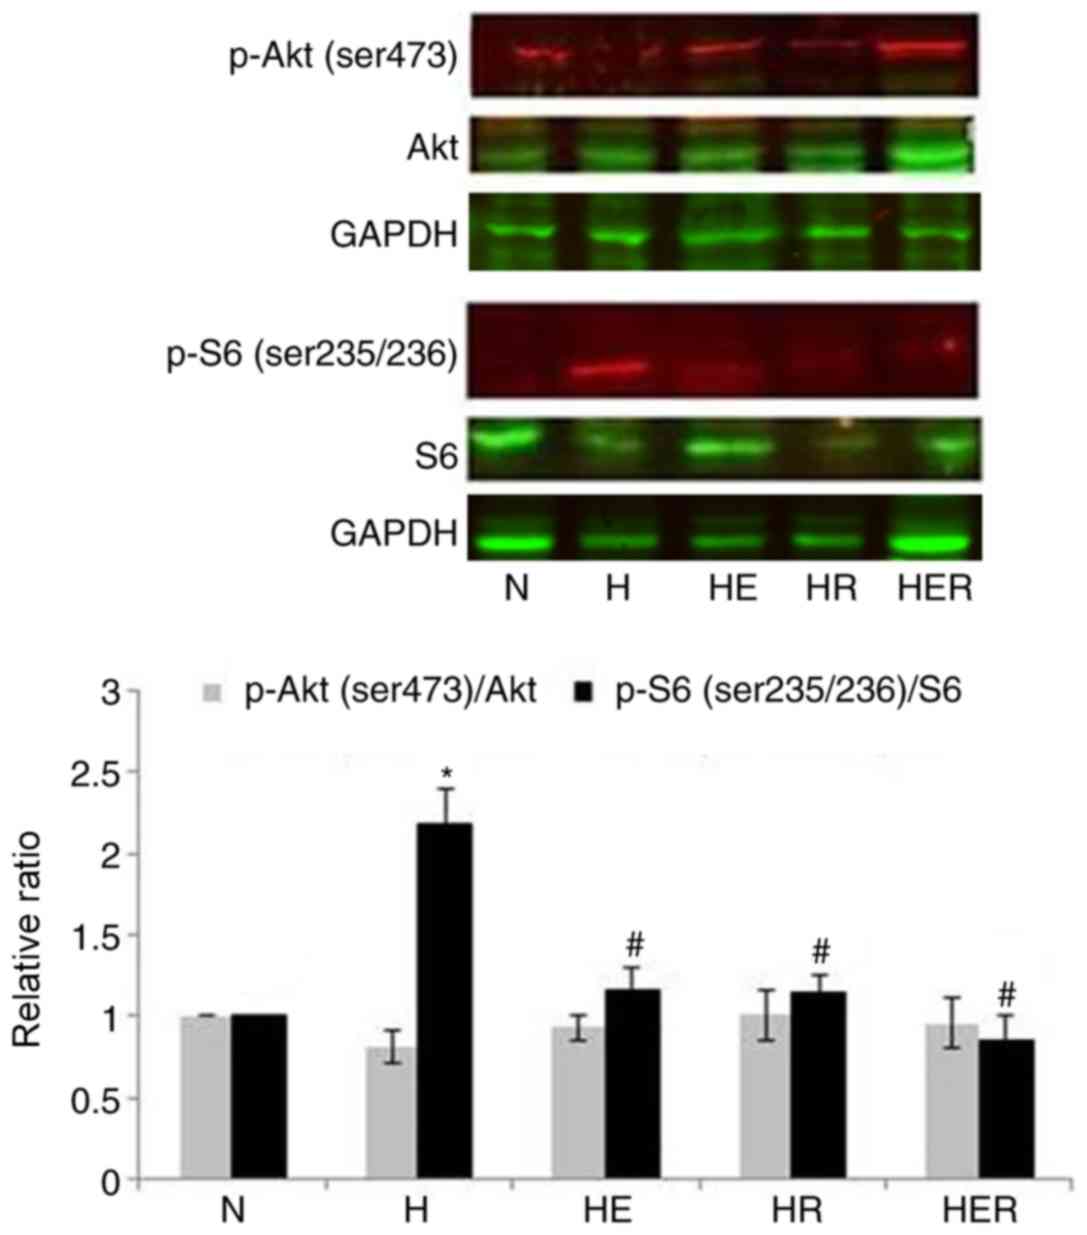
Rapamycin inhibits hepatic mTORC1
activity
mTORC1 is sensitive, while mTORC2 is insensitive to
the inhibition of their activity caused by rapamycin (5). However, it has been reported that
long-term exposure to rapamycin can inhibit mTOR2 (25). To examine whether rapamycin could
inhibit liver mTORC1 and mTORC2 activity, the phosphorylation
levels of S6 (a marker of mTORC1 pathway activity) were measured.
In addition, the phosphorylation of the ser473 site of Akt (a
specific phosphorylation site of mTORC2) was assessed. Compared
with the N group, the p-S6/S6 but not p-Akt/Akt ratio was
significantly increased in the H group. Compared with the H group,
the p-S6/S6 but not p-Akt/Akt ratio was significantly decreased in
the HE, HR and HER groups. The results indicated that exercise and
rapamycin significantly reduced the p-S6/S6 ratio without affecting
p-Akt/Akt ratio in the liver tissues of HFD rats (Fig. 7).
Discussion
It has been reported that mTORC1 participates in the
development of obesity-related insulin resistance. For instance,
mTORC1 is overactivated in the liver of obese rats (26), while genetic inactivation of mTORC1
activity or acute rapamycin administration improves insulin
sensitivity and alleviates hyperglycemia (19,27).
However, chronic rapamycin administration (>2 weeks) may induce
a diabetic-like syndrome, such as insulin resistance, glucose
intolerance and dyslipidemia (16). In contrast to these findings, it
has been shown that long-term administration of rapamycin exerts
beneficial metabolic effects in diet-induced obese mice (28). Previous studies have also reported
different effects of rapamycin on insulin sensitivity depending on
the dose, route, frequency and time period of rapamycin
administration (24,29–31).
Moreover, the status of islet function is an important factor
affecting insulin sensitivity caused by rapamycin in experimental
animal models (32). Prolonged
treatment with rapamycin results in the inactivation of both mTORC1
and mTORC2, which may be a cause of rapamycin-aggravated glucose
intolerance and insulin resistance (25). The results of present study were in
line with previous reports (18,19,33,34),
demonstrating that mTORC1 was overactivated in the liver tissues of
HFD rats and that both exercise and rapamycin treatment (2 weeks)
effectively reduced hepatic mTORC1 activity without altering basal
hepatic mTORC2 activity in HFD rats. It was found that rapamycin
administration protected against obesity without affecting
biochemical parameters including FBG, FFA, FTG and FINS, whereas it
aggravated glucose intolerance and failed to suppress hepatic lipid
deposition in HFD rats. Furthermore, exercise reduced visceral
fat/body weight and hepatic lipid deposition, as well as improved
glucose intolerance and insulin intolerance. Exercise combined with
rapamycin administration also reduced body weight and visceral fat
in HFD rats, while rapamycin impaired the exercise-induced
improvement of glucose intolerance and insulin intolerance.
Mitochondrial dysfunction is an important cause of
insulin resistance and of the development of metabolic disorders
(35). Previous studies have
reported that the decreased activity and increased acetylation of
CPT1α, along with the repression of PPARγ activity by tafazzin,
impair mitochondrial size and function, resulting in the
development of insulin resistance and metabolic dysregulation
(11,36). mTOR is also essential for
maintaining mitochondrial function and energy balance (37,38).
The present results demonstrated that rapamycin did not affect
hepatic HADH activity (fatty acids β-oxidation), SDH activity and
the mRNA expression levels of CPT1α, ACCα and PDK4, while it
impaired exercise-induced hepatic COX activity (oxidative
phosphorylation of mitochondria) in fasting HFD rats. The findings
also indicated that rapamycin damaged mitochondrial oxidative
capacity in HFD rats with or without exercise, which may contribute
to rapamycin-aggravated glucose intolerance and insulin resistance,
as well as counteract the effects of exercise on glucose tolerance
and insulin tolerance.
In mammalian systems, PPARs, PGC-1α and PGC-1β serve
critical roles in the modulation of mitochondrial oxidation
(39–41), while transcription factors, such as
SREBP-1c and ChREBP drive hepatic lipogenesis (42,43).
PPARα is the key regulator of hepatic fatty acid β-oxidation and
PPARβ indirectly modulates hepatic gluconeogenesis by regulating
the expression of forkhead box-containing protein O subfamily-1
(39,42). PGC-1α induces hepatic
gluconeogenesis, whereas PGC-1β is restricted to the maintenance of
basal mitochondrial function and exerts dual roles in regulating
fatty acid metabolism (40,44).
The results of the present study indicated that HFD downregulated
hepatic PPARβ gene expression, which may favor hepatic
gluconeogenesis. In addition, exercise upregulated PGC-1α and
PGC-1β mRNA expression levels in HFD rats, which may contribute to
the reduction of liver TG levels via gluconeogenesis and fatty acid
metabolism (44).
It has been reported that mTOR is critical in the
regulation of lipid and glucose metabolism in the liver (12,14,44,45).
For instance, inhibition of hepatic mTORC1 activity is required for
fasting-induced hepatic PGC-1α and PPARα upregulation (14). In addition, mTORC1 upregulates
SREBP-1c and ChREBP transcriptional activity (12,45,46).
Despite this evidence, the present results demonstrated that
rapamycin administration alone caused no effects on fasting hepatic
PGC-1α, PGC-1β, PPARα, PPARβ, SREBP-1c and ChREBP mRNA expression
levels in HFD rats, which may be associated with the dosage and
time course of rapamycin treatment. However, there are several
other important genes for hepatic metabolism and adipogenesis, such
as PPARγ and fatty acid binding protein 4 (FABP4). A previous study
revealed that the decreased activity of PPARγ led to insulin
resistance and metabolic dysregulation (11). It has also been shown that
high-intensity exercise significantly increases serum
concentrations of FABP4 secreted by adipocytes via β-adrenergic
mediated lipolysis (47).
Moreover, adiponectin supplementation in pregnant mice prevents
maternal obesity-associated fetal overgrowth by improving insulin
resistance and restoring normal mTORC1 signaling (48). Therefore, the lack of detection of
these genes in the model established in the present study was a
limitation.
In conclusion, the present results indicated that
chronic rapamycin administration reduced COX activity, while it
exhibited no effects on the reduction of TG levels following
exercise and on the upregulation of the mitochondrial metabolic
gene expression in the liver tissues of HFD rats. The results
suggested that exercise reduced TG content and upregulated
mitochondrial metabolic gene expression in the liver of HFD rats,
which may not be mediated via the mTOR pathway.
Supplementary Material
Supporting Data
Acknowledgements
Not applicable.
Funding
This work was supported by Natural Science
Foundation of China (grant no. 31571217).
Availability of data and materials
The datasets used and/or analyzed during the present
study are available from the corresponding author on reasonable
request.
Authors' contributions
BL conceived and designed the present study. BL, GT,
CD, HQ and YW conducted the experiments and analyzed the data. BL
and GT wrote the manuscript. All authors have read and approved the
final manuscript.
Ethics approval and consent to
participate
All the experimental procedures were approved by the
Institutional Animal Care and Use Committee of the Guangzhou Sport
University.
Patient consent for publication
Not applicable.
Competing interests
The authors declare that they have no competing
interests.
References
|
1
|
Lara-Castro C and Garvey WT: Intracellular
lipid accumulation in liver and muscle and the insulin resistance
syndrome. Endocrinol Metab Clin North Am. 37:2932–856. 2008.
View Article : Google Scholar
|
|
2
|
Samuel VT and Shulman GI: Mechanisms for
insulin resistance: Common threads and missing links. Cell.
148:852–871. 2012. View Article : Google Scholar : PubMed/NCBI
|
|
3
|
Di Meo S, Iossa S and Venditti P:
Improvement of obesity-linked skeletal muscle insulin resistance by
strength and endurance training. J Endocrinol. 234:R159–R181. 2017.
View Article : Google Scholar : PubMed/NCBI
|
|
4
|
Golabi P, Locklear CT, Austin P, Afdhal S,
Byrns M, Gerber L and Younossi ZM: Effectiveness of exercise in
hepatic fat mobilization in non-alcoholic fatty liver disease:
Systematic review. World J Gastroenterol. 22:6318–6327. 2016.
View Article : Google Scholar : PubMed/NCBI
|
|
5
|
Laplante M and Sabatini DM: mTOR signaling
in growth control and disease. Cell. 149:274–293. 2012. View Article : Google Scholar : PubMed/NCBI
|
|
6
|
Guillén C and Benito M: mTORC1
overactivation as a key aging factor in the progression to type 2
diabetes mellitus. Front Endocrinol (Lausanne). 9:6212018.
View Article : Google Scholar : PubMed/NCBI
|
|
7
|
Lushchak O, Strilbytska O, Piskovatska V,
Storey KB, Koliada A and Vaiserman A: The role of the TOR pathway
in mediating the link between nutrition and longevity. Mech Ageing
Dev. 164:127–138. 2017. View Article : Google Scholar : PubMed/NCBI
|
|
8
|
Kimball SR: Integration of signals
generated by nutrients, hormones, and exercise in skeletal muscle.
Am J Clin Nutr. 99:237S–242S. 2014. View Article : Google Scholar : PubMed/NCBI
|
|
9
|
Li J, Kim SG and Blenis J: Rapamycin: One
drug, many effects. Cell Metab. 19:373–379. 2014. View Article : Google Scholar : PubMed/NCBI
|
|
10
|
Sabatini DM: Twenty-five years of mTOR:
Uncovering the link from nutrients to growth. Proc Natl Acad Sci
USA. 114:11818–11825. 2017. View Article : Google Scholar : PubMed/NCBI
|
|
11
|
El Ouarrat D, Isaac R, Lee YS, Oh DY,
Wollam J, Lackey D, Riopel M, Bandyopadhyay G, Seo JB,
Sampath-Kumar R and Olefsky JM: TAZ Is a negative regulator of
PPARgamma activity in adipocytes and TAZ deletion improves insulin
sensitivity and glucose tolerance. Cell Metab. 31:162–173 e165.
2020. View Article : Google Scholar : PubMed/NCBI
|
|
12
|
Peterson TR, Sengupta SS, Harris TE,
Carmack AE, Kang SA, Balderas E, Guertin DA, Madden KL, Carpenter
AE, Finck BN and Sabatini DM: mTOR complex 1 regulates lipin 1
localization to control the SREBP pathway. Cell. 146:408–420. 2011.
View Article : Google Scholar : PubMed/NCBI
|
|
13
|
Sengupta S, Peterson TR, Laplante M, Oh S
and Sabatini DM: mTORC1 controls fasting-induced ketogenesis and
its modulation by ageing. Nature. 468:1100–1104. 2010. View Article : Google Scholar : PubMed/NCBI
|
|
14
|
Li S, Brown MS and Goldstein JL:
Bifurcation of insulin signaling pathway in rat liver: mTORC1
required for stimulation of lipogenesis, but not inhibition of
gluconeogenesis. Proc Natl Acad Sci USA. 107:3441–3446. 2010.
View Article : Google Scholar : PubMed/NCBI
|
|
15
|
Fletcher JA, Meers GM, Linden MA, Kearney
ML, Morris EM, Thyfault JP and Rector RS: Impact of various
exercise modalities on hepatic mitochondrial function. Med Sci
Sports Exerc. 46:1089–1097. 2014. View Article : Google Scholar : PubMed/NCBI
|
|
16
|
Houde VP, Brûlé S, Festuccia WT, Blanchard
PG, Bellmann K, Deshaies Y and Marette A: Chronic rapamycin
treatment causes glucose intolerance and hyperlipidemia by
upregulating hepatic gluconeogenesis and impairing lipid deposition
in adipose tissue. Diabetes. 59:1338–1348. 2010. View Article : Google Scholar : PubMed/NCBI
|
|
17
|
Caron A, Mouchiroud M, Gautier N, Labbé
SM, Villot R, Turcotte L, Secco B, Lamoureux G, Shum M, Gélinas Y,
et al: Loss of hepatic DEPTOR alters the metabolic transition to
fasting. Mol Metab. 6:447–458. 2017. View Article : Google Scholar : PubMed/NCBI
|
|
18
|
Kucejova B, Duarte J, Satapati S, Fu X,
Ilkayeva O, Newgard CB, Brugarolas J and Burgess SC: Hepatic mTORC1
opposes impaired insulin action to control mitochondrial metabolism
in obesity. Cell Rep. 16:508–519. 2016. View Article : Google Scholar : PubMed/NCBI
|
|
19
|
Kenerson HL, Subramanian S, McIntyre R,
Kazami M and Yeung RS: Livers with constitutive mTORC1 activity
resist steatosis independent of feedback suppression of Akt. PLoS
One. 10:e01170002015. View Article : Google Scholar : PubMed/NCBI
|
|
20
|
Liao B and Xu Y: Exercise improves
skeletal muscle insulin resistance without reduced basal mTOR/S6K1
signaling in rats fed a high-fat diet. Eur J Appl Physiol.
111:2743–2752. 2011. View Article : Google Scholar : PubMed/NCBI
|
|
21
|
Bass A, Brdiczka D, Eyer P, Hofer S and
Pette D: Metabolic differentiation of distinct muscle types at the
level of enzymatic organization. Eur J Biochem. 10:198–206. 1969.
View Article : Google Scholar : PubMed/NCBI
|
|
22
|
Osumi T and Hashimoto T: Occurrence of two
3-hydroxyacyl-CoA dehydrogenases in rat liver. Biochim Biophys
Acta. 574:258–267. 1979. View Article : Google Scholar : PubMed/NCBI
|
|
23
|
Livak KJ and Schmittgen TD: Analysis of
relative gene expression data using real-time quantitative PCR and
the 2(-Delta Delta C(T)) method. Methods. 25:402–408. 2001.
View Article : Google Scholar : PubMed/NCBI
|
|
24
|
Leontieva OV, Paszkiewicz GM and
Blagosklonny MV: Comparison of rapamycin schedules in mice on
high-fat diet. Cell Cycle. 13:3350–3356. 2014. View Article : Google Scholar : PubMed/NCBI
|
|
25
|
Lamming DW, Ye L, Katajisto P, Goncalves
MD, Saitoh M, Stevens DM, Davis JG, Salmon AB, Richardson A, Ahima
RS, et al: Rapamycin-induced insulin resistance is mediated by
mTORC2 loss and uncoupled from longevity. Science. 335:1638–1643.
2012. View Article : Google Scholar : PubMed/NCBI
|
|
26
|
Khamzina L, Veilleux A, Bergeron S and
Marette A: Increased activation of the mammalian target of
rapamycin pathway in liver and skeletal muscle of obese rats:
Possible involvement in obesity-linked insulin resistance.
Endocrinology. 146:1473–1481. 2005. View Article : Google Scholar : PubMed/NCBI
|
|
27
|
Volkers M, Doroudgar S, Nguyen N,
Konstandin MH, Quijada P, Din S, Ornelas L, Thuerauf DJ, Gude N,
Friedrich K, et al: PRAS40 prevents development of diabetic
cardiomyopathy and improves hepatic insulin sensitivity in obesity.
EMBO Mol Med. 6:57–65. 2014. View Article : Google Scholar : PubMed/NCBI
|
|
28
|
Makki K, Taront S, Molendi-Coste O,
Bouchaert E, Neve B, Eury E, Lobbens S, Labalette M, Duez H, Staels
B, et al: Beneficial metabolic effects of rapamycin are associated
with enhanced regulatory cells in diet-induced obese mice. PLoS
One. 9:e926842014. View Article : Google Scholar : PubMed/NCBI
|
|
29
|
Salmon AB: About-face on the metabolic
side effects of rapamycin. Oncotarget. 6:2585–2586. 2015.
View Article : Google Scholar : PubMed/NCBI
|
|
30
|
Liu Y, Diaz V, Fernandez E, Strong R, Ye
L, Baur JA, Lamming DW, Richardson A and Salmon AB:
Rapamycin-induced metabolic defects are reversible in both lean and
obese mice. Aging (Albany NY). 6:742–754. 2014. View Article : Google Scholar : PubMed/NCBI
|
|
31
|
Fang Y, Westbrook R, Hill C, Boparai RK,
Arum O, Spong A, Wang F, Javors MA, Chen J, Sun LY and Bartke A:
Duration of rapamycin treatment has differential effects on
metabolism in mice. Cell Metab. 17:456–462. 2013. View Article : Google Scholar : PubMed/NCBI
|
|
32
|
Reifsnyder PC, Flurkey K, Te A and
Harrison DE: Rapamycin treatment benefits glucose metabolism in
mouse models of type 2 diabetes. Aging (Albany NY). 8:3120–3130.
2016. View Article : Google Scholar : PubMed/NCBI
|
|
33
|
Kenerson HL, Yeh MM and Yeung RS: Tuberous
sclerosis complex-1 deficiency attenuates diet-induced hepatic
lipid accumulation. PLoS One. 6:e180752011. View Article : Google Scholar : PubMed/NCBI
|
|
34
|
Binsch C, Jelenik T, Pfitzer A, Dille M,
Müller-Lühlhoff S, Hartwig S, Karpinski S, Lehr S, Kabra DG, Chadt
A, et al: Absence of the kinase S6k1 mimics the effect of chronic
endurance exercise on glucose tolerance and muscle oxidative
stress. Mol Metab. 6:1443–1453. 2017. View Article : Google Scholar : PubMed/NCBI
|
|
35
|
Kim JA, Wei Y and Sowers JR: Role of
mitochondrial dysfunction in insulin resistance. Circ Res.
102:401–414. 2008. View Article : Google Scholar : PubMed/NCBI
|
|
36
|
Softic S, Meyer JG, Wang GX, Gupta MK,
Batista TM, Lauritzen HPMM, Fujisaka S, Serra D, Herrero L,
Willoughby J, et al: Dietary sugars alter hepatic fatty acid
oxidation via transcriptional and post-translational modifications
of mitochondrial proteins. Cell Metab. 30:735–753 e734. 2019.
View Article : Google Scholar : PubMed/NCBI
|
|
37
|
Ramanathan A and Schreiber SL: Direct
control of mitochondrial function by mTOR. Proc Natl Acad Sci USA.
106:22229–22232. 2009. View Article : Google Scholar : PubMed/NCBI
|
|
38
|
Schieke SM, Phillips D, McCoy JP Jr,
Aponte AM, Shen RF, Balaban RS and Finkel T: The mammalian target
of rapamycin (mTOR) pathway regulates mitochondrial oxygen
consumption and oxidative capacity. J Biol Chem. 281:27643–27652.
2006. View Article : Google Scholar : PubMed/NCBI
|
|
39
|
Han L, Shen WJ, Bittner S, Kraemer FB and
Azhar S: PPARs: Regulators of metabolism and as therapeutic targets
in cardiovascular disease. Part II: PPAR-b/δ and PPAR-g. Future
Cardiol. 13:279–296. 2017. View Article : Google Scholar : PubMed/NCBI
|
|
40
|
Villena JA: New insights into PGC-1
coactivators: Redefining their role in the regulation of
mitochondrial function and beyond. FEBS J. 282:647–672. 2015.
View Article : Google Scholar : PubMed/NCBI
|
|
41
|
Souza-Mello V: Peroxisome
proliferator-activated receptors as targets to treat non-alcoholic
fatty liver disease. World J Hepatol. 7:1012–1019. 2015. View Article : Google Scholar : PubMed/NCBI
|
|
42
|
Shimano H and Sato R: SREBP-regulated
lipid metabolism: Convergent physiology-divergent pathophysiology.
Nat Rev Endocrinol. 13:710–730. 2017. View Article : Google Scholar : PubMed/NCBI
|
|
43
|
Wang Y, Viscarra J, Kim SJ and Sul HS:
Transcriptional regulation of hepatic lipogenesis. Nat Rev Mol Cell
Biol. 16:678–689. 2015. View Article : Google Scholar : PubMed/NCBI
|
|
44
|
Chambers KT, Chen Z, Crawford PA, Fu X,
Burgess SC, Lai L, Leone TC, Kelly DP and Finck BN: Liver-specific
PGC-1beta deficiency leads to impaired mitochondrial function and
lipogenic response to fasting-refeeding. PLoS One. 7:e526452012.
View Article : Google Scholar : PubMed/NCBI
|
|
45
|
Chau GC, Im DU, Kang TM, Bae JM, Kim W,
Pyo S, Moon EY and Um SH: mTOR controls ChREBP transcriptional
activity and pancreatic β cell survival under diabetic stress. J
Cell Biol. 216:2091–2105. 2017. View Article : Google Scholar : PubMed/NCBI
|
|
46
|
Iizuka K: Recent progress on the role of
ChREBP in glucose and lipid metabolism. Endocrine J. 60:543–555.
2013. View Article : Google Scholar
|
|
47
|
Iso T, Sunaga H, Matsui H, Kasama S,
Oshima N, Haruyama Furukawa N, Nakajima K, Machida T, Murakami M,
et al: Serum levels of fatty acid binding protein 4 and fat
metabolic markers in relation to catecholamines following exercise.
Clin Biochem. 50:896–902. 2017. View Article : Google Scholar : PubMed/NCBI
|
|
48
|
Aye IL, Rosario FJ, Powell TL and Jansson
T: Adiponectin supplementation in pregnant mice prevents the
adverse effects of maternal obesity on placental function and fetal
growth. Proc Natl Acad Sci USA. 112:12858–12863. 2015. View Article : Google Scholar : PubMed/NCBI
|