Introduction
Diabetes is considered a chronic metabolic disease
worldwide, which is characterized by high blood glucose levels due
to inadequate insulin secretion or/and activity (1). Worldwide, diabetes presented in 3.82%
of the general population in 2017 (2). Diabetes is associated with different
types of disease due to durable hyperglycemia, such as periodontal
disease, microvascular disease, nephropathy, retinopathy,
neuropathy and osteopathy (3,4).
Diabetic osteopathy is one of the most common types of disease
associated with diabetes, which often results in skeletal
fragility, osteoporosis and bone pain (5,6).
Diabetics are reported to have an osteopathy rate of 0.1-6.8%
(7–9). Its poor prognosis decreases the
quality of life of patients and negatively affects the social
economy (1). However, the
development of effective novel therapeutic strategies for diabetic
osteopathy remains limited as its pathogenic mechanism is not yet
fully understood.
Metformin is a relatively cheap and efficient
antihyperglycemic biguanide, which is extensively used as a
first-line treatment for type 2 diabetes mellitus (T2dm) (10). In addition to its predominant role
in lowering high blood glucose levels, metformin also exerts an
osteogenic effect by promoting the differentiation of
preosteoblasts and mesenchymal stem cells (MSCs) (11,12).
Furthermore, metformin has been demonstrated to exhibit protective
effects against injury induced by high glucose on osteoblastic
cells, including proliferation (13). Smith et al (9) reported that metformin induces
osteoblastic differentiation of human induced pluripotent stem
cell-derived MSCs by activating LKB1/AMP-activated protein kinase
signaling. Notably, metformin has also been demonstrated to affect
osteoblasts against the effect of high glucose levels on
proliferation, suggesting that metformin is directly involved in
the regulation of both osteogenic cells and osteoblasts (14).
Hyperglycemic damage is frequently caused by
long-term exposure to high glucose levels (15). During long-term exposure, high
glucose levels induce generation and accumulation of reactive
oxygen species (ROS), which is closely associated with the
pathogenesis of diabetic osteopathy (16). Zhen et al (13) reported that ROS induced by high
glucose levels regulate ROS-AKT (protein kinase B)-mTOR signaling
that is downstream of ROS, and tightly regulate high
glucose-associated proliferation and apoptosis. Metformin was also
demonstrated to decrease ROS accumulation and promote osteogenesis,
potentially by regulating the ROS-AKT-mTOR axis (17). However, whether metformin is
involved in regulating the ROS-AKT-mTOR axis in MSCs, under high
glucose conditions still remains unclear.
The present study aimed to investigate the effect of
metformin on the regulatory roles of proliferation and
differentiation in MSCs, under high glucose conditions. To achieve
this, Alizarin Red S staining was performed to detect osteogenesis
of MSCs following metformin treatment, and hallmarkers of
osteogenesis, including ALP, osteocalcin, OPN and run-related
transcription factor 2, were detected. The results of the present
study provided novel insight into the regulatory effects of
metformin on MSCs, and provided a better understanding on the
protective role metformin plays against high glucose-induced damage
and a novel therapeutic strategy to avid from suffering from
diabetic osteopathy.
Materials and methods
Animal information and cell
culture
A total of two female C57B mice (4-weeks old, 20–25
g in weight, bought from Chengdu Dashuo Experimental Animal Limited
Company) were maintained under SPF conditions. The mice were housed
at room temperature with 12 h light/dark cycles, 50–65% humidity,
and access to standard chow and water. All animal experiments were
approved by the Ethics Committee of The First Affiliated Hospital
of China Medical University (approval no. 2019014).
After one week mice were euthanatized by 30 mg/kg
sodium pentobarbital and cervical dislocation to collect the femur.
The bone marrow was subsequently washed out using 5 ml ice cold
DMEM-F12 (Thermo Fisher Scientific, Inc.) and centrifuged at 400 ×
g for 10 min at 4°C. Then, bone marrow was treated using
SoniConvert® sonicator (DocSense) to obtain single
cells. The cells were resuspended in 5 ml ice cold DMEM-F12 and 3
ml ice cold Ficoll solution (Jixing Biotech Inc.), and centrifuged
at 1,000 × g for 30 min at 4°C. The white-fog layer on the surface
of the Ficoll was collected and equal volume of DMEM-F12 (~500 µl)
was added followed by centrifugation at 400 × g at 4°C for 20 min.
The pellet was collected and incubated in DMEM-F12 supplemented
with 10% FBS and 1% mix of penicillin-streptomycin (Thermo
Scientific, Inc.) for the primary culture at 37°C for ≥4 weeks.
DMEM-F12 supplemented with 10% FBS and 1% mix of
penicillin-streptomycin was used as the growth medium for cell
proliferation analysis, while differentiating medium (cat. no.
MUXMT-90021; Cyagen Biosciences, Inc.) was used for cell
differentiation analysis.
CCK-8 assay cell viability was
determined by the CCK-8 assay
Briefly, cells (5×10⁴) were cultured in
96-well plates. Then, 10 µl of freshly prepared CCK-8 solution was
added to the cell culture for 2-h co-incubation. The absorbance was
measured at 620 nm by using a microplate reader (Synergy 2
Multi-Mode Microplate Reader; BioTek Instruments, Inc.). The cell
viability was expressed as the optical density (OD) 620.
Alkaline phosphatase (ALP) assay
Bone marrow stromal cells (BMSCs) were seeded into
6-well plates at a density of 1×10⁵ cells/well and maintained in
growth medium and differentiating medium for 3, 5, 14 and 21 days,
respectively. Cells were washed three times with ice-cold PBS,
digested with 0.25% trypsin and suspended. Pelleted cells were
resuspended in extraction lysis buffer containing 50 mM Tris-HCl
8.0, 150 mM NaCl, 0.5 mM EDTA, 0.25% Nonidet P(NP)-40 and incubated
for 30 min at 4°C. The supernatant was collected and total protein
concentration was measured using a bicinchoninic acid assay
(Pierce; Thermo Fisher Scientific, Inc.). The results were analyzed
at a wavelength of 520 nm using a Synergy 2 Multi-Mode microplate
reader (BioTek Instruments, Inc.) and the ALP activity assay
detection kit (cat. no. A509-1; Nanjing Jiancheng Bioengineering
Institute). Osteogenic differentiation was determined by measuring
the area stained for ALP, using MetaMorph Imaging software (version
7.7.8; Universal Imaging, Inc.). All experiments were performed in
triplicate.
Alizarin Red S (ARS) staining
assay
BMSCs (1×10⁵) were cultured in growth
medium for 14 and 21 days, respectively. Cells were subsequently
washed three times with ice-cold PBS and fixed with 4% formaldehyde
in PBS for 10 min at room temperature. Following a brief wash with
PBS, cells were stained with ARS solution (0.5%, Sigma-Aldrich;
Merck KGaA) supplemented with a final concentration of 40 mM ARS
(pH 4.2) for 30 min at room temperature. Subsequently, cells were
washed five times with PBS to inhibit non-specific staining and the
stained cells were imaged under an X71 (U-RFL-T) fluorescence
microscope (Olympus Corporation). All experiments were performed in
triplicate.
Reverse transcription-quantitative
(RT-q)PCR
BMSCs cells (1×10⁶) were cultured in
differentiating medium for 24 and 48 h, respectively. Total RNA was
extracted using TRIzol reagent (Thermo Fisher Scientific, Inc.),
according to the manufacturer's protocol and RNA concentration was
measured using a UV spectrophotometer (Thermo Fisher Scientific,
Inc.). cDNA was synthesized from 1 µg of total RNA using the
Reverse Transcriptase kit (cat. no. QP056; Guangzhou RiboBio Co.,
Ltd.) at 37°C for 40 min and inactivated at 85°C for 10 min. qPCR
was subsequently performed using the SYBR-Green Master Mix (Thermo
Fisher Scientific, Inc.), in a ABI7500 system (Applied Biosystems;
Thermo Fisher Scientific, Inc.). The following primer sequences
were used for qPCR: ALP forward, 5′-CCTTGAAAAATGCCCTGAAA-3′ and
reverse, 5′-CTTGGAGAGAGCCACAAAGG-3′; osteocalcin (OCN) forward,
5′-GAGGGCAGTAAGGTGGTGAA-3′ and reverse, 5′-CCTAAACGGTGGTGCCATAG-3′;
OPN forward, 5′-AGTGTGAGGAAGGGCGTTAC-3′ and reverse,
5′-AATGTGCTGCAGTTCGTGTG-3′; runt-related transcription factor 2
(RUNX2) forward, 5′-AAATGCCTCCGCTGTTATGAA-3′ and reverse,
5′-GCTCCGGCCCACAAATCT-3′; COX I forward, 5′-GGAGCAGTATTCGCCATCAT-3′
and reverse, 5′-CGACGAGGTATCCCTGCTAA-3′; COX 3 forward,
5′-GAACATACCAAGGCCACCAC-3′ and reverse, 5′-TAATTCCTGTTGGGGGTCAG-3′;
ND1 forward, 5′-CTCCCTATTCGGAGCCCTAC-3′ and reverse,
5′-GGAGCTCGATTTGTTTCTGC-3′; Cyb forward, 5′-GTCGGCGAAGAAAAATGTGT-3′
and reverse, 5′-AAGCTGCTCACAGAGGGGTA-3′; and β-actin forward,
5′-CATGTACGTTGCTATCCAGGC-3′ and reverse,
5′-CTCCTTAATGTCACGCACGAT-3′. The following thermocycling conditions
were used for qPCR: Initial denaturation 98°C 5min, 35 of cycles of
denaturation at 98°C for 10 sec, annealing and elongation at 60°C
for 1 min; and final extension at 60 °C for 10 min.
To detect mitochondrial DNA contents, total DNA was
isolated using Genome DNA isolation kit (DocSense) with 20 ng of
DNA being used as a template. The following thermocycling
conditions were used for qPCR: Initial denaturation 98°C 5 min, 35
of cycles of denaturation at 98°C for 10 sec, annealing and
elongation at 60°C for 1 min. The specific primers used were
followed: 12S rDNA forward: 5′-ACCGCGGTCATACGATTAAC-3′; reverse:
5′-AGTACCGCCAAGTCCTTTGA-3′; 18S rDNA forward:
5′-TCAATCTCGGGTGGCTGAACG-3′; reverse: 5′-GGACCAGAGCGAAAGCATTTG-3′.
All PCR data were quantified using the 2−ΔΔCq method
(18).
Western blotting
BMSCs were cultured in differentiating medium for 48
h. Cells (1×10⁶) suspended in 0.5 ml of Laemmle buffer
(50 mM tris pH6.8, 1.25% SDS, 10% glycerol) were lysed using
SoniConvert sonicator (DocSense) and denatured by heating at 100°C
for 15 min. Then, protein concentration was determined using BCA
kit (Sigma-Aldrich; Merck KGaA). Total protein (20 µg) was
separated in each lane via 6–12% gradient SDS-PAGE electrophoresis,
transferred onto nitrocellulose membranes (EMD Millipore) and
subsequently blocked with PBS containing 5% skimmed milk (Beyotime
Institute of Biotechnology) at room temperature for 30 min. The
membranes were incubated with primary antibodies against: AKT
(1:3,000; cat. no. ab9905), AKT phosphor T308 (1:2,000; cat. no.
ab38449), mTOR (1:1,000; cat. no. ab2732), mTOR phosphor S2448
(1:1,000; cat. no. ab109268) and β-actin (1:5,000; cat. no. ab8226;
all from Abcam) for 1 h at room temperature. Membranes were washed
three times with PBS containing 0.1% Tween-20 (Beyotime Institute
of Biotechnology) and subsequently incubated with horseradish
peroxidase-labeled goat anti-rabbit secondary antibody (1:5,000;
cat. no. ab7090; Abcam) for 1 h at room temperature. Proteins bands
were visualized on X-ray film using enhanced chemiluminescence
substrate (Thermo Fisher Scientific, Inc.) and quantified using
ImageJ software (version-2.0; National Institutes of Health).
Cell cycle analysis
BMSCs were cultured in growth medium for 48 h. Cells
(1×10⁶) were suspended and fixed with ice-cold 75% ethyl
alcohol (1 ml; Sigma-Aldrich; Merck KGaA), and stored overnight at
4°C. Cells were subsequently collected and washed twice with
ice-cold PBS, prior to incubation with 100 µl RNase A and 400 µl
propidium iodide (PI; both from Sigma-Aldrich; Merck KGaA) for 30
min at room temperature in the dark. Following an additional
incubation for 30 min at 4°C, cell cycle distribution was assessed
using a FACS LSRII flow cytometer (BD Biosciences). All experiments
were performed in triplicate.
ROS detection
BMSCs were cultured in differentiating medium for 48
h. To scavenge accumulated ROS, 10 µM of antioxidant NAC was added
for 2-h incubation. The addition of the same volume of DMSO was
considered as the control (mock) group. Cells (1×10⁵)
were co-cultured with 10 µM 2′,7′-dichlorodihydrofluorescein
diacetate (DCFH-DA; Beyotime Institute of Biotechnology) for 30 min
at 37°C in the dark. Cells were washed three times with PBS and
fluorescence was detected via fluorescence microscopy
(magnification, ×100). Fluorescence was measured at wavelengths of
488 nm excitation and 525 nm emission using a two-laser Navios flow
cytometer (Beckman Coulter, Inc.). All experiments were performed
in triplicate.
JC-1 staining
BMSCs were cultured in differentiating medium for 48
h. In order to measure mitochondrial membrane potential (MMP),
cells (1×10⁵) were stained with JC-1 (cat. no. T3168;
Thermo Fisher Scientific, Inc.), according to the manufacturer's
protocol. Briefly, cells were washed twice with ice-cold PBS and
stained with JC-1 work solution for 30 min at 37°C in the dark.
Following incubation, the supernatant was discarded and cells were
re-washed twice with PBS, prior to imaging via fluorescence
microscopy (X71; Olympus Corporation; magnification, ×100). All
experiments were performed in triplicate.
ATP measurement
BMSCs were cultured in differentiating medium for 48
h. In order to assess ATP synthesis, cells (5×10⁵) were
stained with reagents from the ATP Bioluminescent Assay kit (cat.
no. FLAA-1KT; Sigma-Aldrich; Merck KGaA) at room temperature for 20
min, and subsequently maintained in solution containing 0.22 M
sucrose, 0.12 M mannitol, 40 mM Tricine, pH 7.5 and 1 mM EDTA (all
from Sigma-Aldrich; Merck KGaA) at room temperature for 10 min, and
the supernatant was analyzed using an Optocomp I luminometer (MGM
Instruments, Inc.). Grounded mitochondrial lysate was incubated in
buffer containing 5 mM MgCl2, 10 mM
KH2PO4, 0.2% Bovine serum albumin, 0.1 mM ADP
and 54 µM APP at 4°C for 10 min. Glutamate and malate (both 10 mM)
were used as the substrates. All experiments were performed in
triplicate.
Statistical analysis
All data were presented in mean ± standard
deviation. Statistical analysis was performed using GraphPad Prism
software (GraphPad Software, Inc.; version 5.01). Unpaired
Student's t-test was used to determine differences between two
independent groups, while one- or two-way analysis of variance
(ANOVA) was used compare differences between multiple groups.
Bonferroni's post hoc test was performed for all pairwise
comparisons following ANOVA. All experiments were performed in
triplicate. P<0.05 (2-tailed) was considered to indicate a
statistically significant difference.
Results
High glucose inhibits osteogenic
differentiation of BMSCs in differentiating medium
In order to assess the effect of high, medium and
regular glucose conditions on the osteogenesis of BMSCs in growth
medium and differentiating medium, respectively, ALP staining was
performed following cell culture for 3 and 5 days. Under
differentiating conditions, ALP staining significantly decreased
under high and medium glucose conditions at both 3 and 5 days
(Fig. 1A). Similarly, under
differentiating medium for 14 and 21 days, ARS staining
significantly decreased under both high and medium glucose
conditions (Fig. 1B). In order to
confirm osteogenesis, markers of osteogenesis, including ALP, OCN,
osteoprotegerin (OPG) and RUNX2 were detected via RT-qPCR analysis
following cell culture in differentiating medium for 24 and 48 h,
which were notably induced at the early stage of differentiation,
but not the later stage of differentiation. As expected, high and
medium glucose conditions significantly decreased the mRNA levels
of these genes (Fig. 1C). Based on
the dose-dependent effect of glucose, the high glucose condition
was selected for further experimentation.
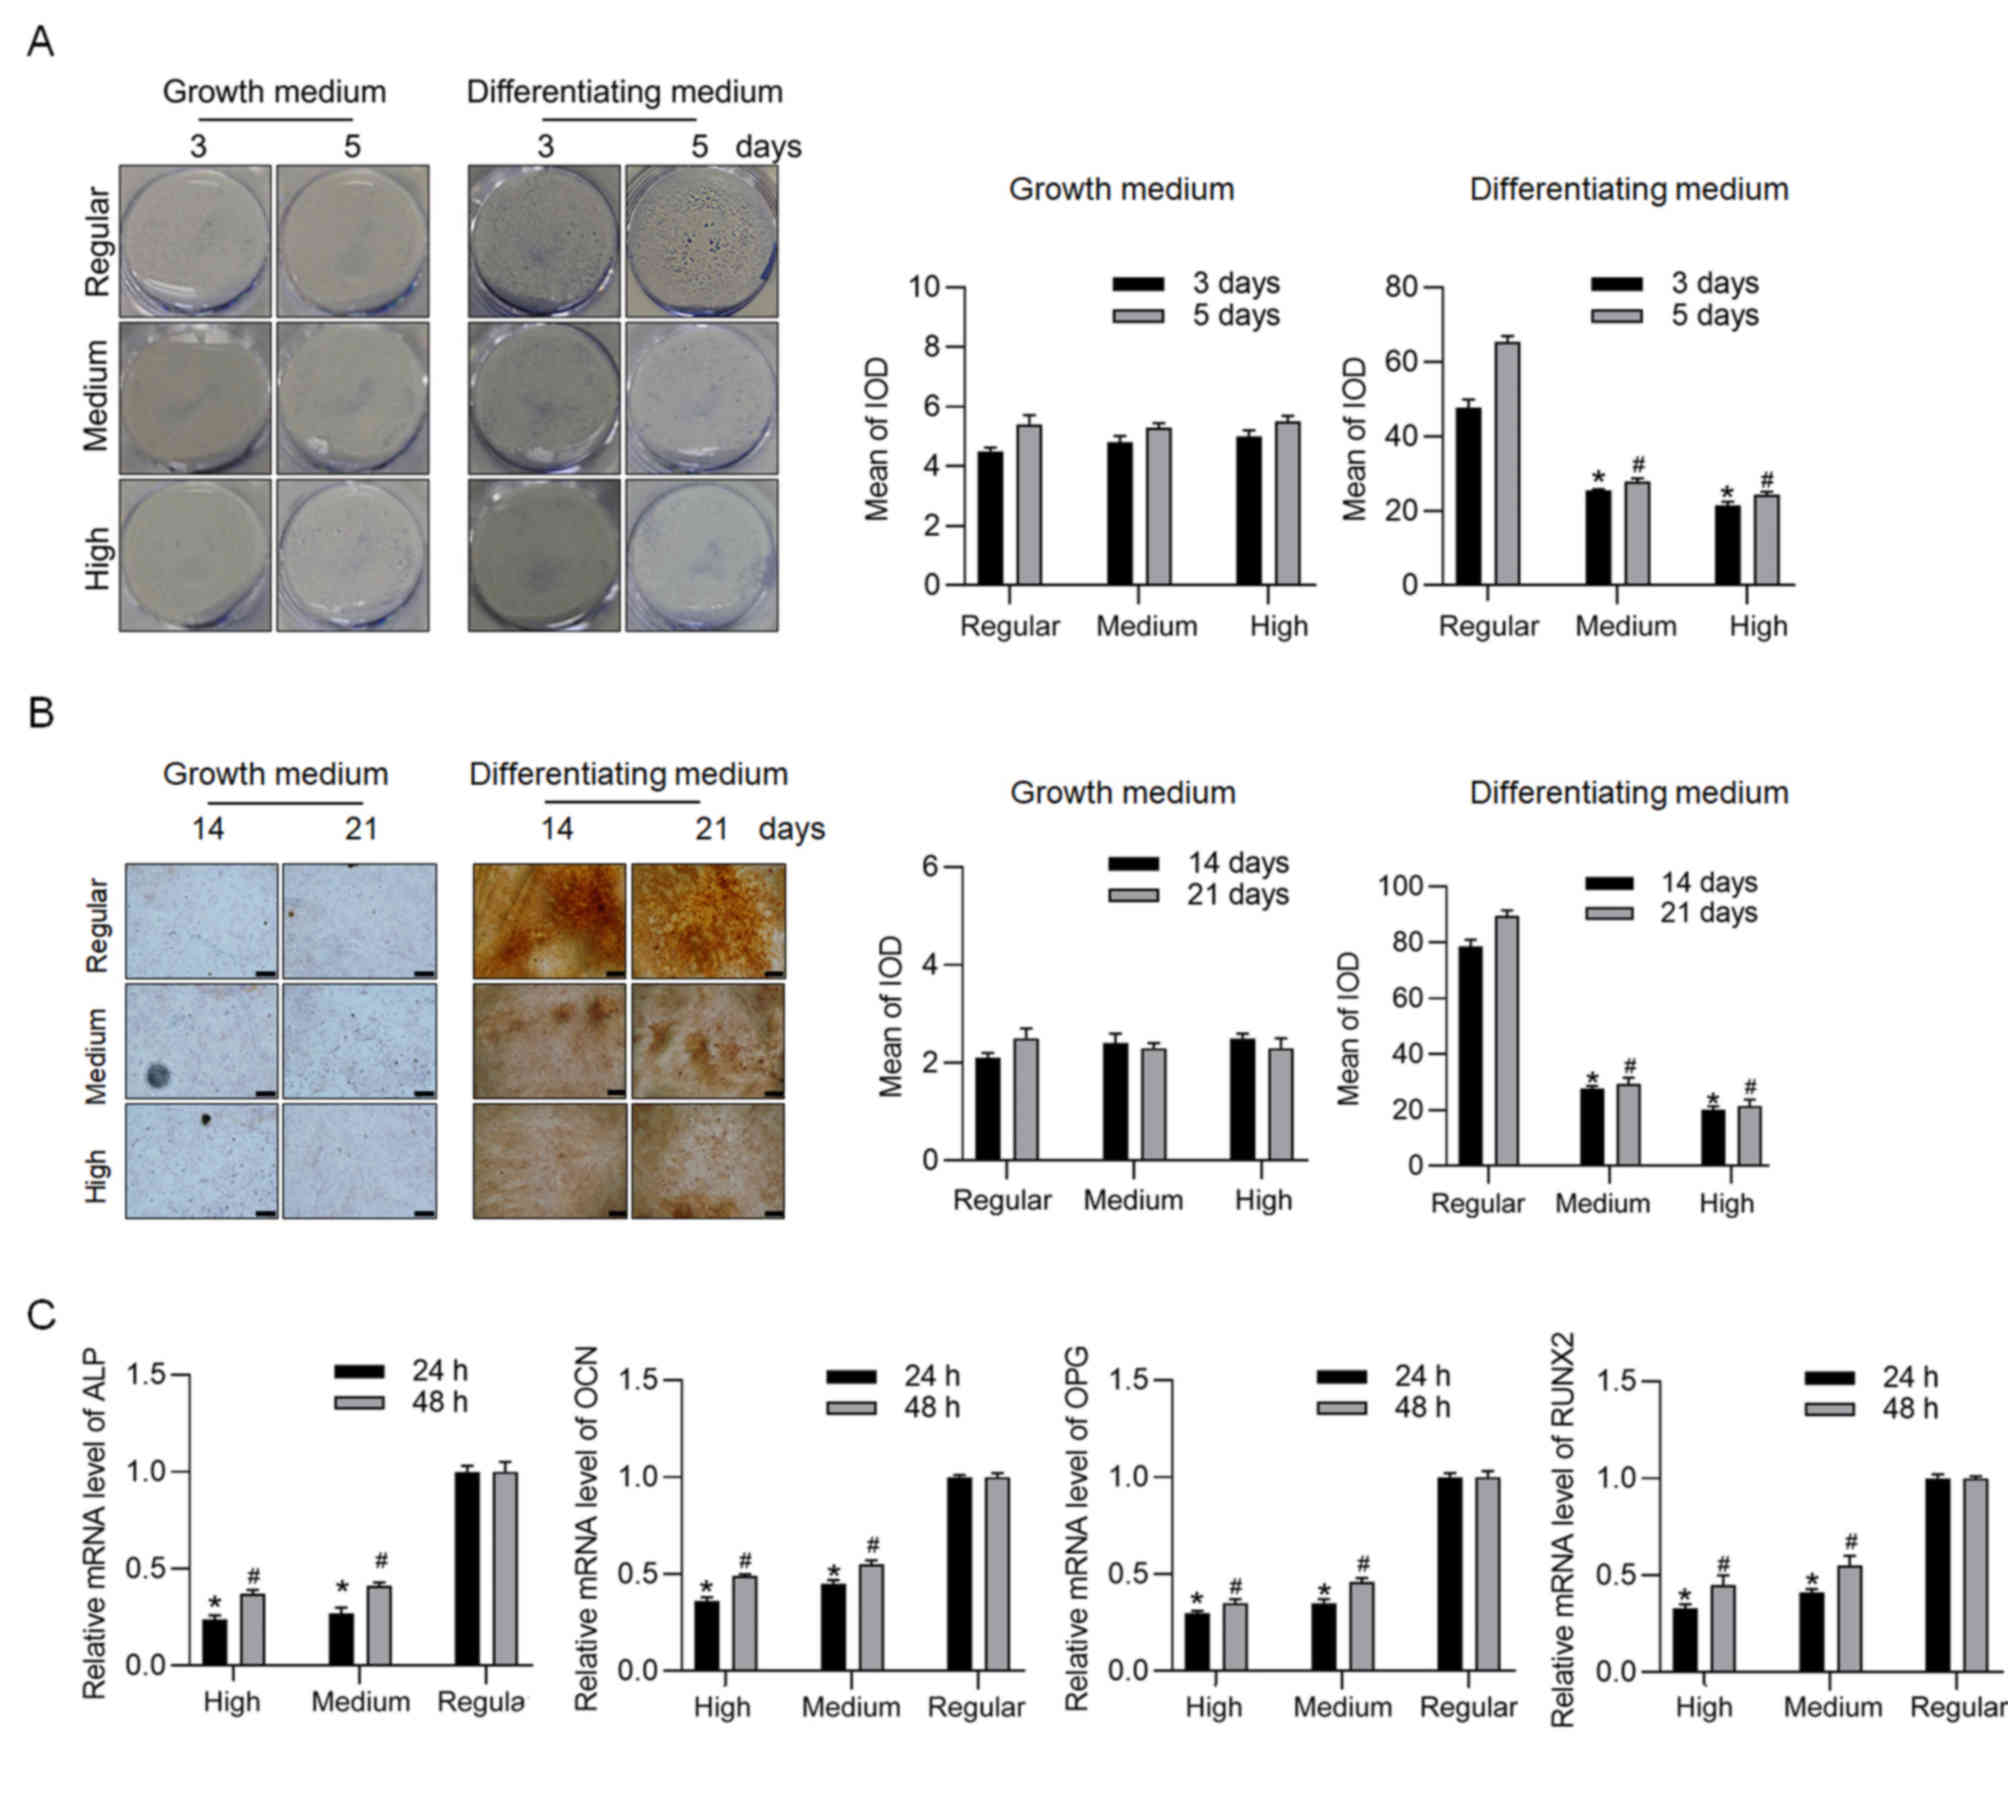 | Figure 1.Effects of high, medium and regular
glucose conditions on osteogenic differentiation of BMSCs. (A) ALP
and (B) Alizarin Red S staining assays were performed following
incubation for 3 and 5 days (magnification, ×40; scale bar=50 µm).
(C) mRNA expression levels of ALP, OCN, OPG and RUNX2, of BMSCs
cultured in differentiating medium were detected via reverse
transcription-quantitative PCR analysis. *P<0.05 vs. regular
group at 3 days; #P<0.05 vs. regular group at 5 days.
BMSCs, bone marrow stromal cells; ALP, alkaline phosphatase; OCN,
osteocalcin; OPG, osteoprotegerin; RUNX2, runt-related
transcription factor 2; IOD, integrated optical density. |
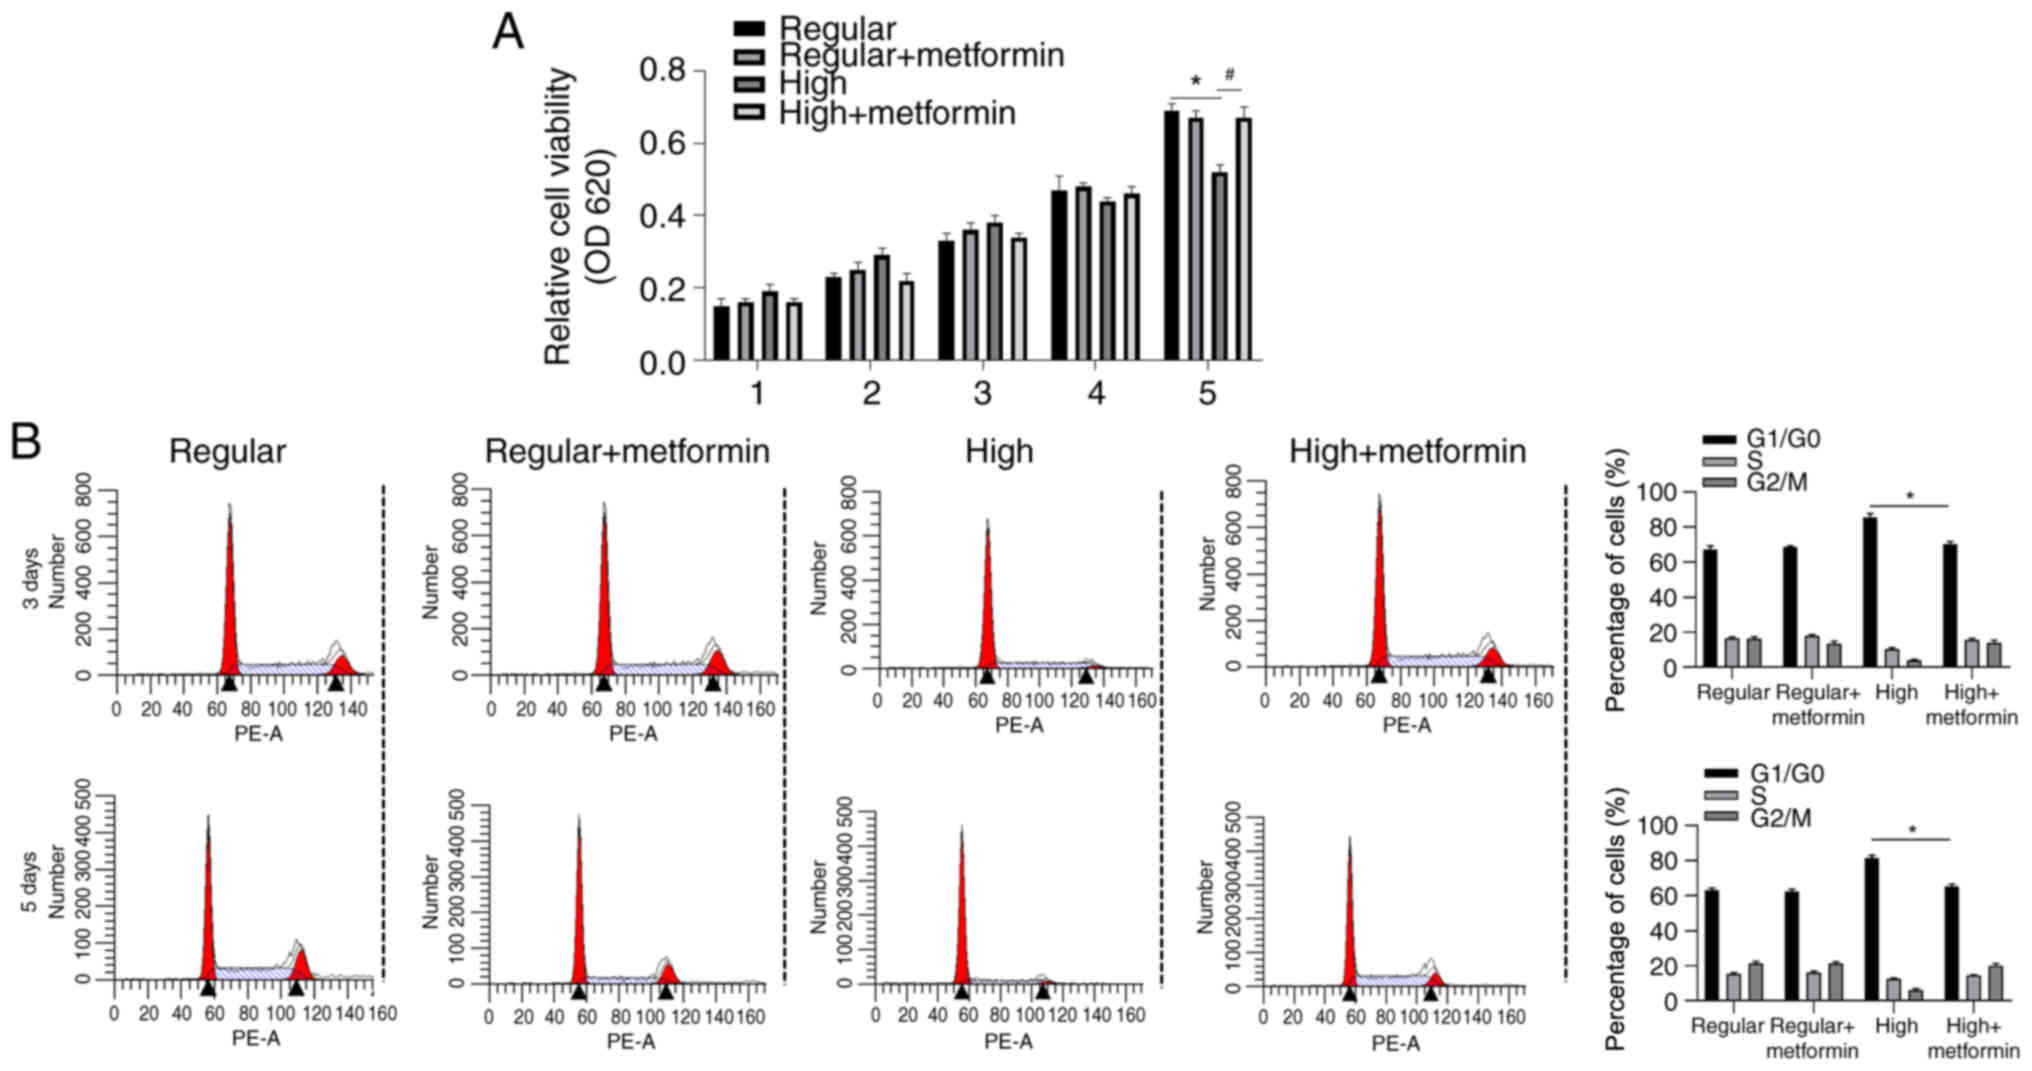
Metformin regulates cell proliferation
and differentiation under specific culture conditions
The present study set out to determine whether
metformin exerts different roles under different culturing
conditions. Cell viability was assessed in BMSCs cultured in growth
medium supplemented with regular or high glucose at days 1–5.
Although no significant differences were observed between days 1–5,
high glucose condition significantly decreased cell viability at
day 5 compared with the regular glucose group, which was reversed
following addition of metformin (Fig.
2A).
Cell cycle distribution was subsequently assessed in
cells treated at days 3 and 5 via flow cytometric analysis. The
results demonstrated that addition of metformin significantly
decreased the proportion of cells in the
G1/G0 phase at both days 3 and 5 compared
with the high glucose group, suggesting the promoting effect of
metformin on cell proliferation (Fig.
2B).
The effect of metformin on osteogenesis of BMSCs
cultured in differentiating medium, under regular or high glucose
conditions was assessed. Consistent with previous findings
(13), the results of the present
study demonstrated that high glucose condition inhibited
osteogenesis of BMSCs cultured in differentiating medium for 14
days, the effect of which was significantly reversed following the
addition of metformin (Fig. 3A and
B). Addition of metformin significantly increased the mRNA
levels of hallmarkers of osteogenesis, including ALP, OCN, OPG and
RUNX2 (Fig. 3C). Taken together,
these results suggest that metformin is remarkably involved in
regulating both proliferation and osteogenesis of BMSCs, which are
inhibited under high glucose condition.
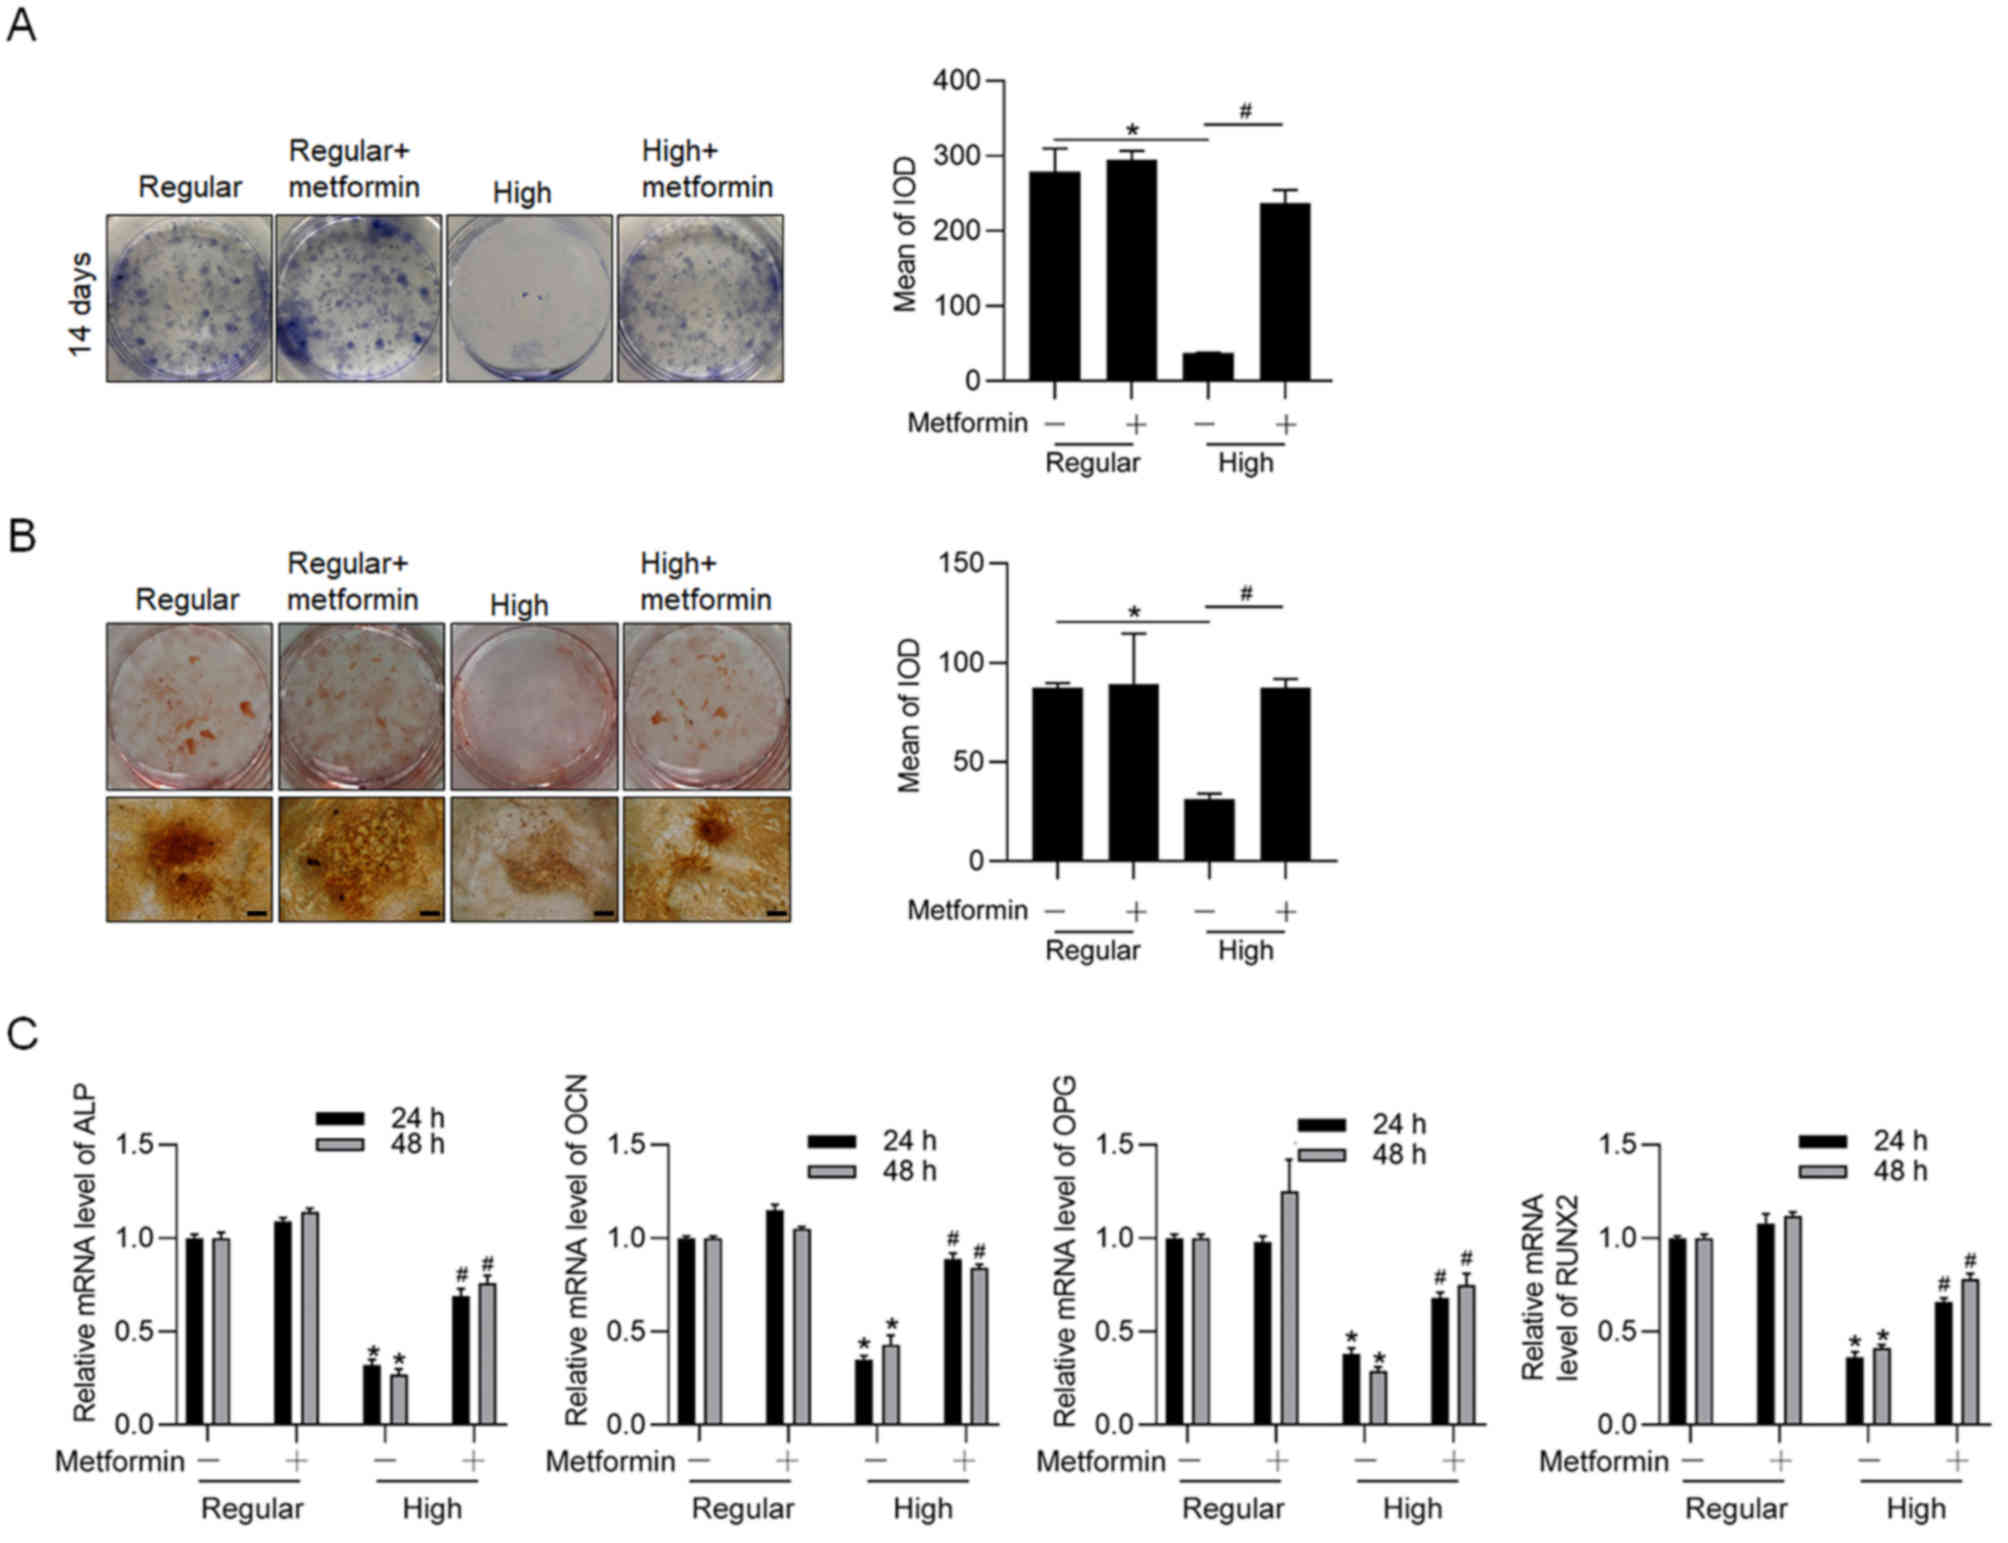 | Figure 3.Metformin promotes osteogenic
differentiation of BMSCs under high glucose/differentiating
condition. (A) ALP and (B) Alizarin Red S staining assays were
performed following incubation in differentiating medium under high
glucose condition for 14 days, with or without metformin
(magnification, ×40; scale bar=50 µm). (C) mRNA expression levels
of ALP, OCN, OPG and RUNX2, of BMSCs cultured in differentiating
medium under regular and high glucose conditions were detected via
reverse transcription-quantitative PCR analysis. *P<0.05 vs.
regular glucose group; #P<0.05 vs. high glucose
group. BMSCs, bone marrow stromal cells; ALP, alkaline phosphatase;
OCN, osteocalcin; OPG, osteoprotegerin; RUNX2, runt-related
transcription factor 2; IOD, integrated optical density. |
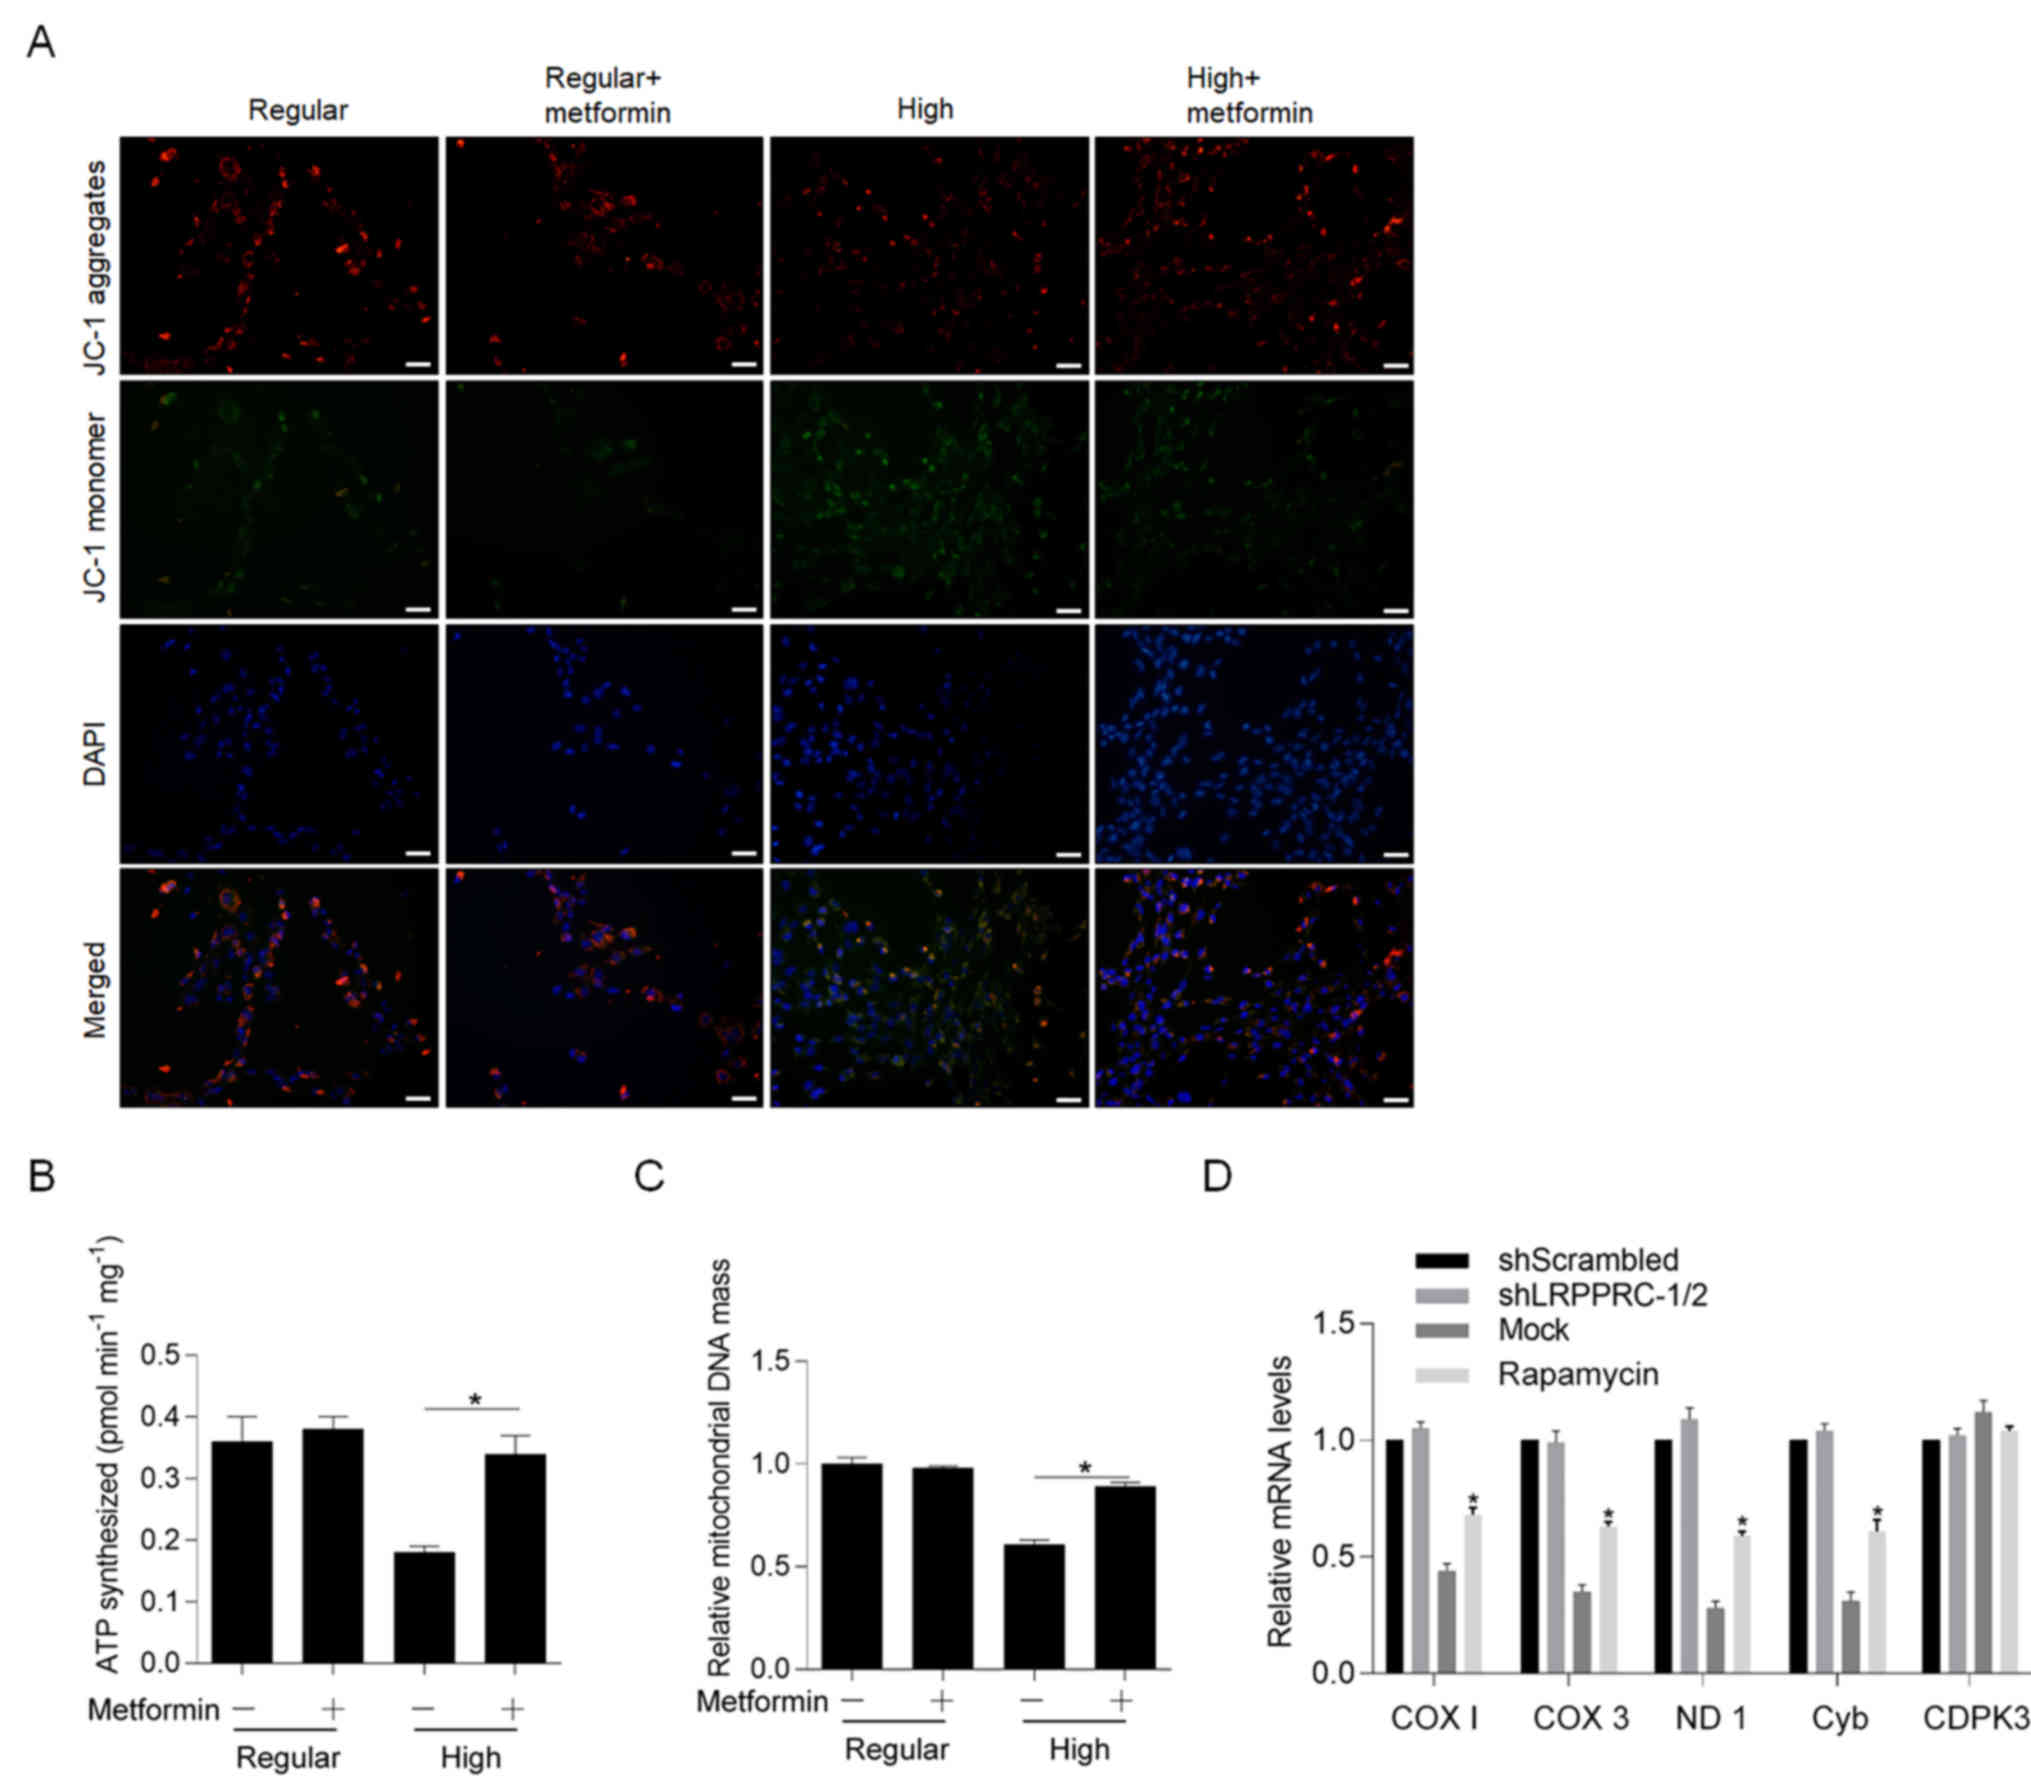
Metformin promotes mitochondrial
maintenance and function inhibited by high glucose condition
The effects of metformin on high glucose condition
in differentiating medium was subsequently assessed. Following
incubation in differentiating medium for 48 h at 37°C, cells were
stained with JC-1, and aggregates and monomers were observed. The
results demonstrated that high glucose condition significantly
decreased aggregates and increased monomers, both of which were
reversed following addition of metformin (Fig. 4A). Notably, metformin failed to
affect JC-1 staining under regular glucose condition, indicating
its specific role on exerting protective effects against high
glucose conditions. The present study also investigated whether
metformin reversed glucose-induced mitochondrial dysfunction by
detecting ATP synthesis (Fig. 4B),
mitochondrial DNA mass (Fig. 4C)
and mitochondrial transcriptional activity (Fig. 4D). As expected, incubation with
high glucose for 48 h at 37°C significantly decreased mitochondrial
function, whereas co-culture with metformin significantly reversed
these effects.
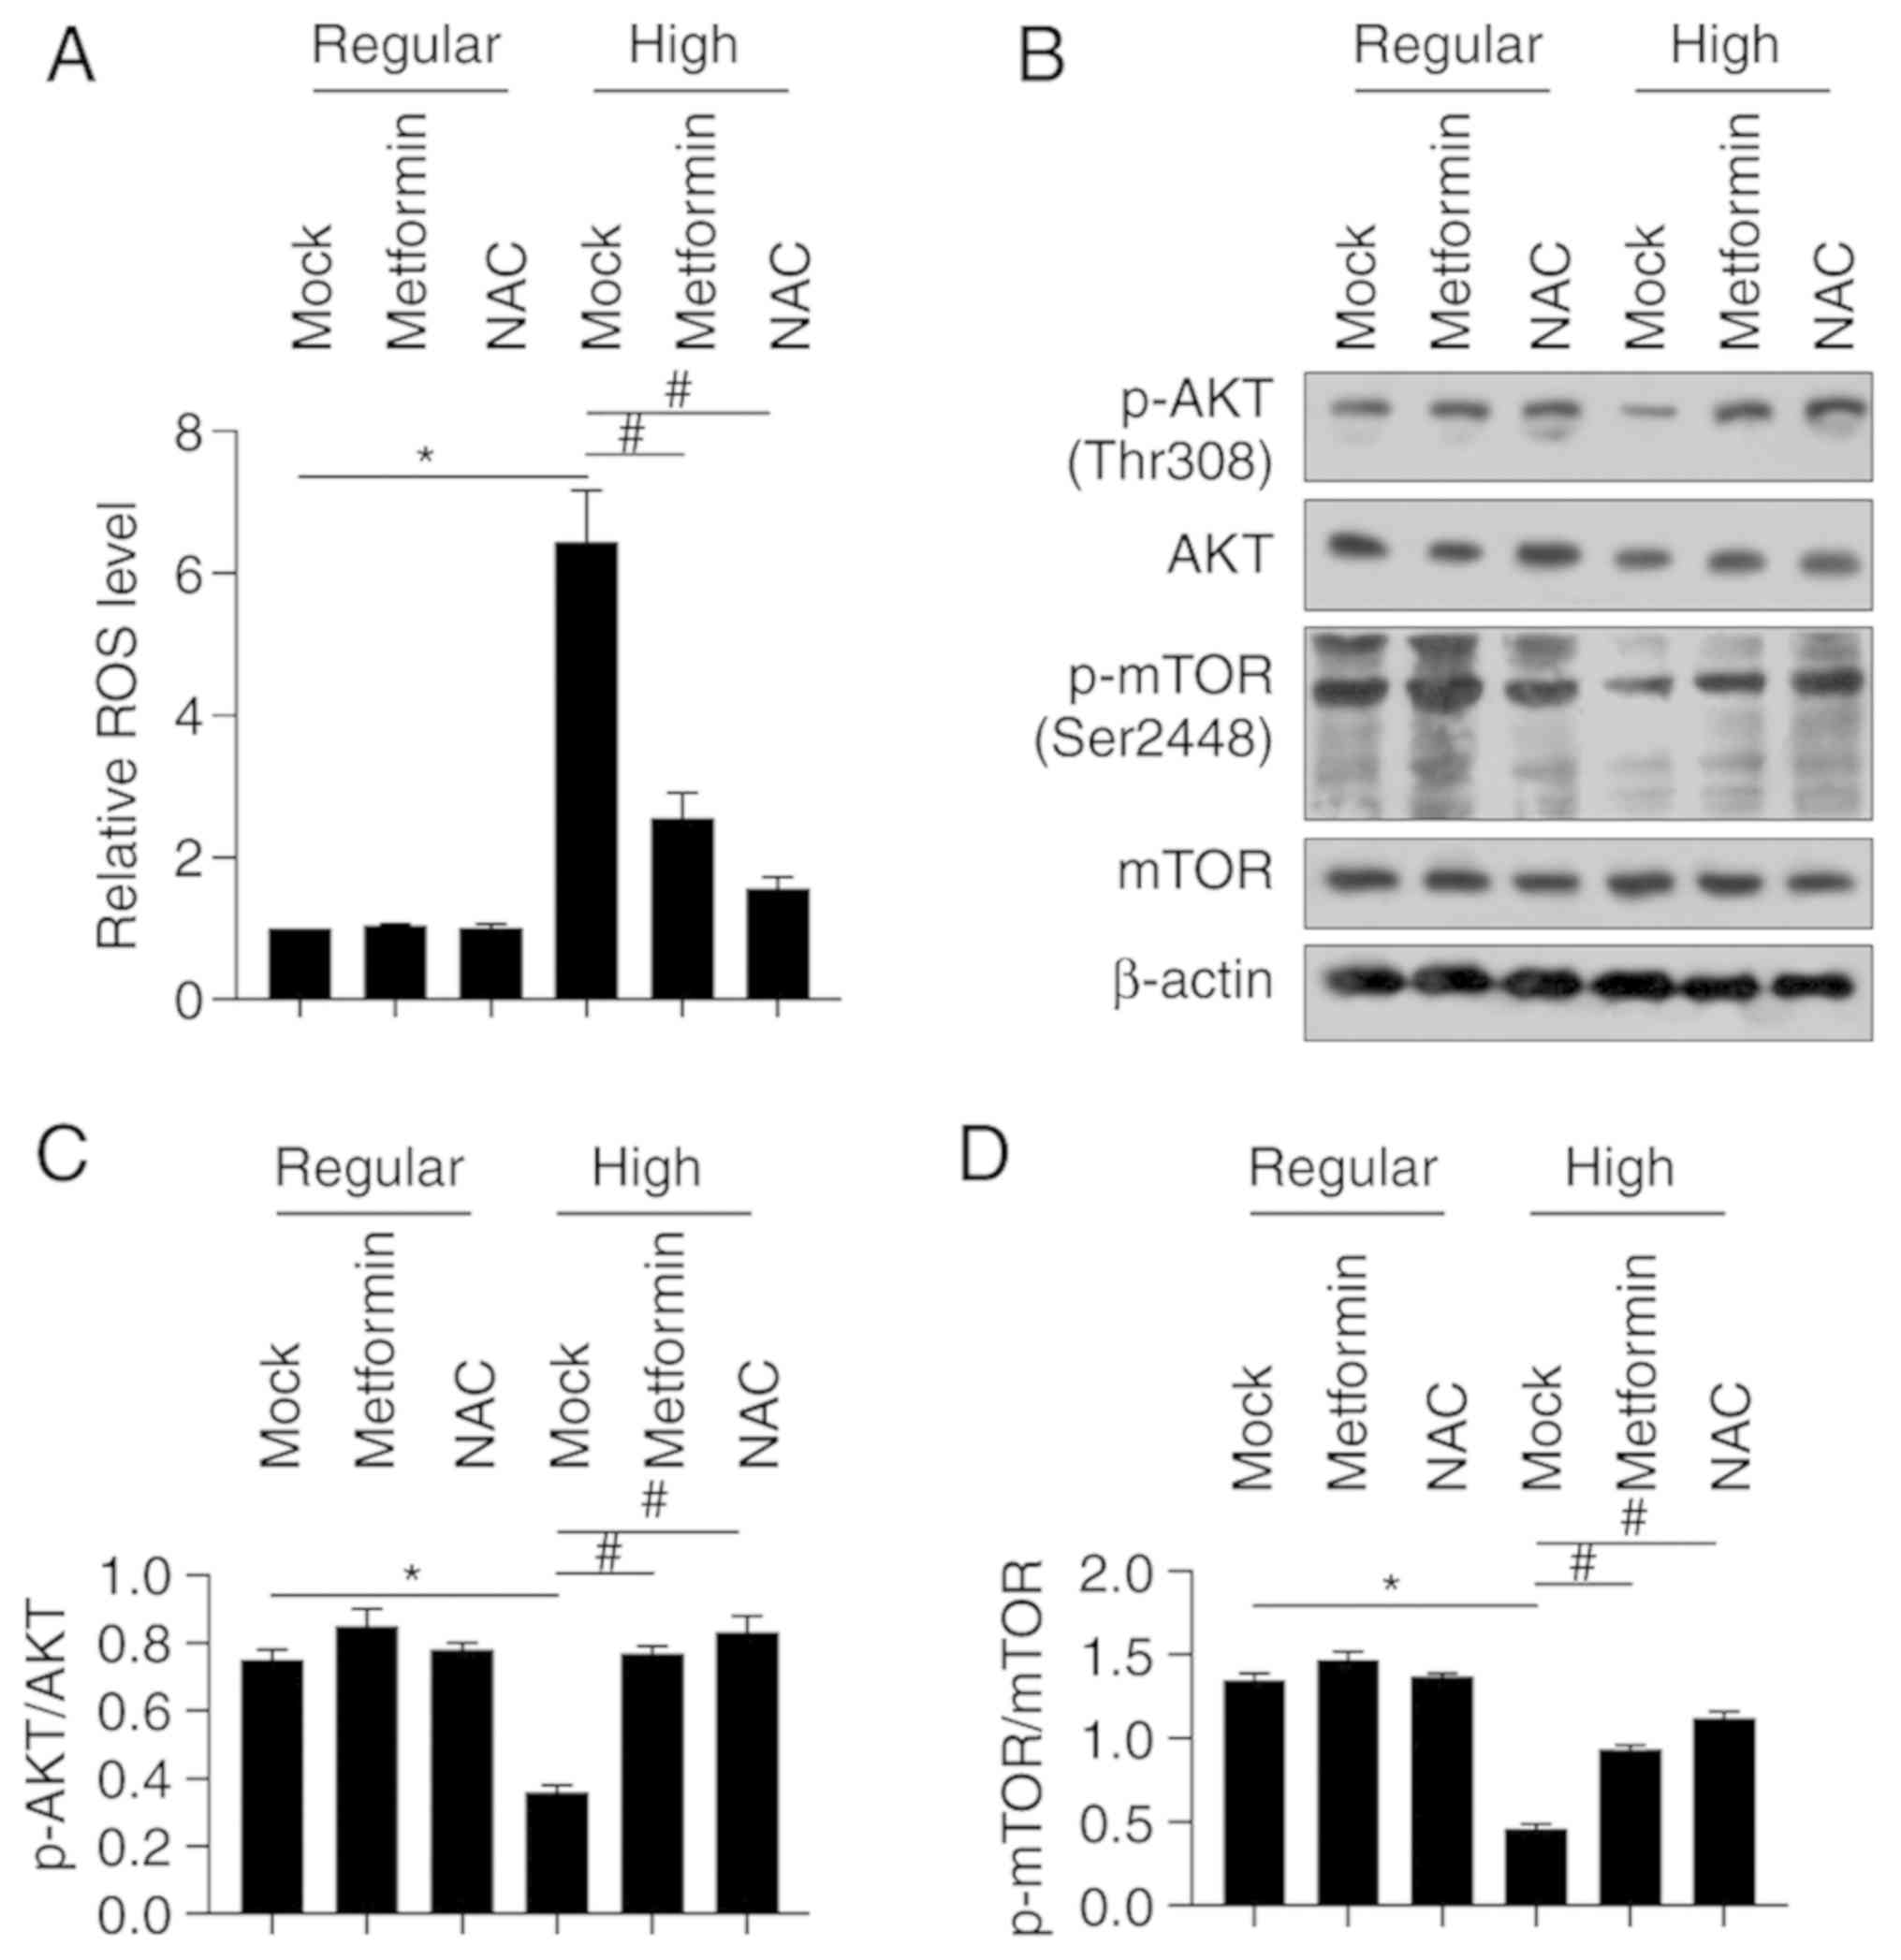
Metformin scavenges ROS induced by
high glucose and thus potentially regulates the ROS-AKT-mTOR
axis
In order to assess how high glucose affects ROS
accumulation in BMSCs cultured in differentiating medium, ROS
staining was performed using the DCFH-DA probe kit. The results
demonstrated that fluorescence intensity of BMSCs cultured in high
glucose condition increased compared to the mock group (Fig. 5A). However, fluorescence intensity
significantly decreased following treatment with metformin or
antioxidant NAC (Fig. 5A).
Considering that the ROS-AKT-mTOR axis plays a critical role in
physiological processes of several normal tissues, excluding
osteogenesis (19), the protein
levels of AKT and mTOR, and their phosphorylated forms were
detected. Western blot analysis demonstrated that the protein
levels of p-AKT (Thr308) and p-mTOR (Ser2448) significantly
decreased under high glucose condition, the effects of which were
significantly reversed following co-culture with metformin or NAC
(Fig. 5B-D). Collectively, these
results suggest that metformin may protect BMSCs from high
glucose-induced ROS accumulation, and thus stimulate the
ROS-AKT-mTOR axis.
Discussion
It is well known that diabetes mellitus remarkably
increases the risk of osteopathy, such as osteoporosis and
fragility fractures, via long-term exposure to high glucose
conditions (1,20). Metformin, as the most commonly used
antidiabetic drug, has been reported to exert protective effects
against bone loss, and thus decreases the risk of diabetic
osteopathy (21). Osteogenic cell
proliferation and differentiation are key elements affecting bone
health (22), and
diabetic-associated hyperglycemia negatively affects both
proliferation and differentiation of these cells (22). Bone marrow mesenchymal stem cells
are responsible for inducing bone damage repair and secreting a
large amount of extracellular matrix components to promote fracture
healing (23). They are also
extensively used for bone engineering and artificial bone
repairment (24). Thus, the
present study mimicked hyperglycemia by using high glucose
conditions to culture BMSCs, and assessed its effects on
proliferation and osteogenic differentiation. Specifically, the
effects of high glucose levels and metformin on osteogenesis of
BMSCs were investigated. Prospective studies will also focus on the
role of osteoblasts.
The effects of high glucose exposure on BMSCs
osteogenesis under differentiating medium were investigated. The
results of the present study were consistent with previous finding,
demonstrating that high glucose levels affect osteoblast
differentiation (25). The results
of the present study demonstrated that high glucose levels
inhibited cell proliferation and differentiation, respectively.
Notably, addition of metformin significantly reversed the
inhibitory effects induced by high glucose levels on cell
proliferation and differentiation. ALP is a plasma membrane-bound
glycoprotein, which is extensively expressed in the placenta,
intestine, liver, kidneys and bone (26). In the present study, it was used as
a marker to assess osteoblast activity. Furthermore,
osteogenic-related genes, including OCN, OPG and RUNX2 were also
used as osteogenic markers. A previous study reported that
metformin promotes osteoblast proliferation and differentiation
(14), suggesting that metformin
may exert similar effects on high glucose stress in different kinds
of cells. Notably, high glucose exposure slightly increased cell
viability from day 1 to day 3, and subsequently decreased cell
viability after day 4. This may because the high glucose levels
increased metabolism and increased enzymatic activity in BMSCs. To
investigate the promoting effect of high glucose on proliferation,
cell cycle distribution was assessed from day 3, instead of an
earlier time point. Notably, no obvious osteogenesis was observed
in the growth medium after 14 and 21-day culture, this may due to
the low processing rate in growth medium. This indicated the main
difference between growth medium and differentiating medium on
osteogenesis. A major limitation of the present study is the lack
of detection of the absorption of glucose into the cytoplasm
following addition of metformin; however, it is speculated that
metformin may not affect glucose absorption.
Long-term exposure to high glucose levels leads to
metabolic disturbance, causes oxidative stress and induces ROS
accumulation (16). A previous
study reported that glucose oxidative stress induced by high
glucose levels interferes with osteoblast differentiation and
mineralization (27). One of the
main causes of cell damage is accumulated ROS induced by high
glucose levels (27).
Mitochondrial biogenesis enhances cellular function, survival and
recovery from oxidative-induced cell damage (28). Targeting glucose-induced ROS and
protecting mitochondrial DNA from oxidative stress is considered a
promising therapeutic strategy for high glucose-induced inhibition
of cell proliferation and osteoblastic differentiation (27). Takanche et al reported that
gomisin A, a lignan isolated from the hexane of Schisandra
chinensis fruit extract, protects osteoblast from high
glucose-induced oxidative stress and promotes mitochondrial
function (27). The results of the
present study confirmed that high glucose levels induced ROS
accumulation, decreased MMP and caused mitochondrial dysfunction. A
reduction in mitochondrial mass or decrease in mitochondrial
membrane potential may be two main results of mitochondrial
dysfunction. Thus, prospective studies will focus on investigating
mitochondrial mass and MMP. Another major limitation of the present
study is the lack of confirmation as to how metformin decreases ROS
levels, by inhibiting ROS genesis or by scavenging ROS
accumulation.
Addition of metformin scavenged ROS induced by high
glucose levels, reversed the lack of ATP synthesis and
mitochondrial transcriptional activity by high glucose-induced
oxidative stress. The ROS-AKT-mTOR axis has been demonstrated to be
stimulated under high glucose levels, and affects physiological
process, such as proliferation and osteogenesis in osteoblasts
(16). The results of the present
study demonstrated that metformin decreased ROS levels and
activated AKT-mTOR signaling. However, whether metformin regulates
the ROS-AKT-mTOR axis directly or indirectly remains unclear.
Furthermore, the effect of metformin on osteogenesis without high
glucose stimulation remains unknown, and thus is worth
investigating in future studies.
The present study is not without limitations. The
exact regulatory mechanism of metformin on the ROS-AKT-mTOR axis,
and the effect of metformin on bone formation in vivo were
not investigated. Thus, prospective studies will focus on
investigating the effects of high glucose levels on proliferation
and osteogenic differentiation. Taken together, the results of the
present study suggest that metformin exerts a protective role on
BMSCs from relatively-high glucose-induced oxidative stress.
Acknowledgements
The authors of the present study would like to thank
Ms. Huimin Shi from Sichuan University (Chengdu, China) for helping
draft the initial manuscript.
Funding
No funding was received.
Availability of data and materials
The datasets used and/or analyzed during the current
study are available from the corresponding author on reasonable
request.
Authors' contributions
RZ and XZ contributed to conception and design. RZ,
YM and SQ contributed to acquisition of data. RZ and ZG contributed
to acquisition, analysis and interpretation of data. ZG and SQ
contributed to cell culture. All authors read and approved the
final manuscript.
Ethics approval and consent to
participate
All animal experiments were approved by the Ethics
Committee of the First Affiliated Hospital of China Medical
University.
Patient consent for publication
Not applicable.
Competing interests
The authors declare that they have no competing
interests.
References
|
1
|
Janghorbani M, Van Dam RM, Willett WC and
Hu FB: Systematic review of type 1 and type 2 diabetes mellitus and
risk of fracture. Am J Epidemiol. 166:3387–505. 2007. View Article : Google Scholar
|
|
2
|
Garmendia Madariaga A, Santos Palacios S,
Guillén-Grima F and Galofré JC: The incidence and prevalence of
thyroid dysfunction in Europe: A meta-analysis. J Clin Endocrinol
Metab. 99:923–931. 2014. View Article : Google Scholar : PubMed/NCBI
|
|
3
|
Dhaliwal R, Cibula D, Ghosh C, Weinstock
RS and Moses AM: Bone quality assessment in type 2 diabetes
mellitus. Osteoporos Int. 25:1969–1973. 2014. View Article : Google Scholar : PubMed/NCBI
|
|
4
|
Chen Y, Hu Y, Yang L, Zhou J, Tang Y,
Zheng L and Qin P: Runx2 alleviates high glucose-suppressed
osteogenic differentiation via PI3K/AKT/GSK3β/β-catenin pathway.
Cell Biol Int. 41:822–832. 2017. View Article : Google Scholar : PubMed/NCBI
|
|
5
|
Harvey NC, McCloskey EV, Mitchell PJ,
Dawson-Hughes B, Pierroz DD, Reginster JY, Rizzoli R, Cooper C and
Kanis JA: Mind the (treatment) gap: A global perspective on current
and future strategies for prevention of fragility fractures.
Osteoporos Int. 28:1507–1529. 2017. View Article : Google Scholar : PubMed/NCBI
|
|
6
|
Jackuliak P and Payer J: Osteoporosis,
fractures, and diabetes. Int J Endocrinol. 2014:8206152014.
View Article : Google Scholar : PubMed/NCBI
|
|
7
|
Wybier M, Mathieu P, Morvan G, Vuillemin
Bodaghi V and Guerini H: Muculoskeletal radiology: ankle and foot
in adults. J Radiol. 89:711–724, quis 735-736. 2008.(In French).
View Article : Google Scholar : PubMed/NCBI
|
|
8
|
Rosenbloom AL and Silverstein JH:
Connective tissue and joint disease in diabetes mellitus.
Endocrinol Metab Clin North Am. 25:473–483. 1996. View Article : Google Scholar : PubMed/NCBI
|
|
9
|
Smith DG, Barnes BC, Sands AK, Boyko EJ
and Ahroni JH: Prevalence of radiographic foot abnormalities in
patients with diabetes. Foot Ankle Int. 18:342–346. 1997.
View Article : Google Scholar : PubMed/NCBI
|
|
10
|
Markowicz Piasecka M, Sikora J, Szydlowska
A, Skupien A, Mikiciuk Olasik E and Huttunen KM: Metformin - a
future therapy for neurodegenerative diseases: Theme: Drug
discovery, development and delivery in Alzheimer's disease guest
editor: Davide Brambilla. Pharm Res. 34:2614–2627. 2017. View Article : Google Scholar : PubMed/NCBI
|
|
11
|
Cortizo AM, Sedlinsky C, McCarthy AD,
Blanco A and Schurman L: Osteogenic actions of the anti-diabetic
drug metformin on osteoblasts in culture. Eur J Pharmacol.
536:38–46. 2006. View Article : Google Scholar : PubMed/NCBI
|
|
12
|
Gao Y, Xue J, Li X, Jia Y and Hu J:
Metformin regulates osteoblast and adipocyte differentiation of rat
mesenchymal stem cells. J Pharm Pharmacol. 60:1695–1700. 2008.
View Article : Google Scholar : PubMed/NCBI
|
|
13
|
Zhen D, Chen Y and Tang X: Metformin
reverses the deleterious effects of high glucose on osteoblast
function. J Diabetes Complications. 24:334–344. 2010. View Article : Google Scholar : PubMed/NCBI
|
|
14
|
Shao X, Cao X, Song G, Zhao Y and Shi B:
Metformin rescues the MG63 osteoblasts against the effect of high
glucose on proliferation. J Diabetes Res. 2014:4539402014.
View Article : Google Scholar : PubMed/NCBI
|
|
15
|
Renner K, Seilbeck A, Kauer N, Ugele I,
Siska PJ, Brummer C, Bruss C, Decking SM, Fante M, Schmidt A, et
al: Combined Metabolic Targeting With Metformin and the NSAIDs
Diflunisal and Diclofenac Induces Apoptosis in Acute Myeloid
Leukemia Cells. Front Pharmacol. 9:12582018. View Article : Google Scholar : PubMed/NCBI
|
|
16
|
Wang X, Feng Z, Li J, Chen L and Tang W:
High glucose induces autophagy of MC3T3-E1 cells via ROS-AKT-mTOR
axis. Mol Cell Endocrinol. 429:62–72. 2016. View Article : Google Scholar : PubMed/NCBI
|
|
17
|
Park KR, Nam D, Yun HM, Lee SG, Jang HJ,
Sethi G, Cho SK and Ahn KS: β-Caryophyllene oxide inhibits growth
and induces apoptosis through the suppression of PI3K/AKT/mTOR/S6K1
pathways and ROS-mediated MAPKs activation. Cancer Lett.
312:178–188. 2011. View Article : Google Scholar : PubMed/NCBI
|
|
18
|
Livak KJ and Schmittgen TD: Analysis of
relative gene expression data using real-time quantitative PCR and
the 2(-Delta Delta C(T)) Method. Methods. 25:402–408. 2001.
View Article : Google Scholar : PubMed/NCBI
|
|
19
|
Fiorini C, Cordani M, Gotte G, Picone D
and Donadelli M: Onconase induces autophagy sensitizing pancreatic
cancer cells to gemcitabine and activates Akt/mTOR pathway in a
ROS-dependent manner. Biochim Biophys Acta. 1853:549–560. 2015.
View Article : Google Scholar : PubMed/NCBI
|
|
20
|
Botushanov NP and Orbetzova MM: Bone
mineral density and fracture risk in patients with type 1 and type
2 diabetes mellitus. Folia Med (Plovdiv). 51:12–17. 2009.PubMed/NCBI
|
|
21
|
Wang C, Li H, Chen SG, He JW, Sheng CJ,
Cheng XY, Qu S, Wang KS, Lu ML and Yu YC: The skeletal effects of
thiazolidinedione and metformin on insulin-resistant mice. J Bone
Miner Metab. 30:630–637. 2012. View Article : Google Scholar : PubMed/NCBI
|
|
22
|
Sun H, Dai K, Tang T and Zhang X:
Regulation of osteoblast differentiation by slit2 in osteoblastic
cells. Cells Tissues Organs. 190:69–80. 2009. View Article : Google Scholar : PubMed/NCBI
|
|
23
|
Granero-Moltó F, Weis JA, Miga MI, Landis
B, Myers TJ, O'Rear L, Longobardi L, Jansen ED, Mortlock DP and
Spagnoli A: Regenerative effects of transplanted mesenchymal stem
cells in fracture healing. Stem Cells. 27:1887–1898. 2009.
View Article : Google Scholar : PubMed/NCBI
|
|
24
|
Li C, Yang L, Ren X, Lin M, Jiang X, Shen
D, Xu T, Ren J, Huang L, Qing W, et al: Groove structure of porous
hydroxyapatite scaffolds (HAS) modulates immune environment via
regulating macrophages and subsequently enhances osteogenesis. J
Biol Inorg Chem. 24:733–745. 2019. View Article : Google Scholar : PubMed/NCBI
|
|
25
|
Yang J, Ma C and Zhang M: High glucose
inhibits osteogenic differentiation and proliferation of MC3T3 E1
cells by regulating P2X7. Mol Med Rep. 20:5084–5090.
2019.PubMed/NCBI
|
|
26
|
Sharma U, Pal D and Prasad R: Alkaline
phosphatase: An overview. Indian J Clin Biochem. 29:269–278. 2014.
View Article : Google Scholar : PubMed/NCBI
|
|
27
|
Takanche JS, Kim JE, Han SH and Yi HK:
Effect of gomisin A on osteoblast differentiation in high
glucose-mediated oxidative stress. Phytomedicine. 66:1531072020.
View Article : Google Scholar : PubMed/NCBI
|
|
28
|
Liu J, Shen W, Zhao B, Wang Y, Wertz K,
Weber P and Zhang P: Targeting mitochondrial biogenesis for
preventing and treating insulin resistance in diabetes and obesity:
Hope from natural mitochondrial nutrients. Adv Drug Deliv Rev.
61:1343–1352. 2009. View Article : Google Scholar : PubMed/NCBI
|