Introduction
Melatonin (MEL) is a hormone that is primarily
synthesized and secreted by the pineal gland, but also by other
organs, including the retina, testes, Harderian gland, bone marrow
and gastrointestinal tract (1–4).
Moreover, MEL has various functions, such as circadian rhythm
regulation, sleep promotion, neuroprotection, tumor suppression and
hormone release regulation (5).
With respect to bone metabolism, MEL promotes human mesenchymal
stem cell and preosteoblast cell differentiation, as well as
attenuates receptor activator of NF-κB ligand-induced bone
resorption (6–8). Our previous study revealed that MEL
was involved in osseointegration around titanium implants in rat
models (9). In addition, treatment
with a combination of fibroblast growth factor-2 and MEL
synergistically augments osteogenic activity and mineralization of
MC3T3-E1 mouse preosteoblast cells cultured with interconnected
porous hydroxyapatite ceramics (10). MEL treatment also enhances
osteoblastic differentiation and mineralization in MC3T3-E1 cells
via bone morphogenic protein (BMP)/ERK/Wnt signaling pathways
(11). These findings suggested
that MEL serves an important role in osteoblast differentiation and
mineralization.
The transforming growth factor-β (TGF-β)/Smad
signaling pathway serves an essential role in osteoblastic cell
differentiation and mineralization, as well as in skeletal
development (12). In addition,
TGF-β activation of the mitogen-activated protein kinase (MAPK)/ERK
pathway is suggested to be involved in the regulation of
osteoblastic cell differentiation (13). However, the relationship between
MEL-induced osteoblastic cell differentiation and TGF-β activation
of the MAPK/ERK signaling pathway remains unknown (10,13).
microRNAs (miRNAs/miRs) are small non-coding RNAs that play a vital
role in regulation of biological process, including osteoblastic
differentiation (14). However,
the role of MEL-induced miRNAs in osteogenic differentiation
remains to be elucidated. Therefore, the aim of the present study
was to evaluate the role of MEL in mineralization and the effect of
TGF-β on osteoblastic cell differentiation in human jawbone-derived
osteoblastic (hOB) cells. The association between MEL-induced miRNA
and RUNX family transcription factor 2 (Runx2) was also
examined.
Materials and methods
Cell culture
The present study protocol was approved by the
Institutional Review Board of Hiroshima University. Fragments of
mandibular ramus were obtained from a female patient in her 20s who
underwent mandibular osteotomy in August 2017 and provided written
informed consent for the use of the fragments in this study. hOB
cells were isolated from the mandibular bone fragments using the
following explant culture technique. Bone fragments were washed,
minced in PBS, then plated in 60-mm culture dishes containing
α-minimal essential medium (Sigma-Aldrich; Merck KGaA) supplemented
with 10% FBS (Biological Industries), and 1%
penicillin-streptomycin (Sigma-Aldrich; Merck KGaA) and incubated
at 37°C with 5% CO2. When cells had grown to
semi-confluence around the bone tissue, they were passaged with
0.025% trypsin (Gibco; Thermo Fisher Scientific, Inc.) and 0.02%
EDTA (Gibco; Thermo Fisher Scientific, Inc.) in PBS Cells from
passage 3–6 were used in the present study. Passaged hOB cells were
cultured in the aforementioned medium.
hOB cells were cultured under 5% CO2 in
air at 37°C. To enable differentiation of hOB cells, osteogenic
medium with 10 nM dexamethasone, 10 mM β-glycerophosphate and 50
µg/ml ascorbic acid (all from Sigma-Aldrich; Merck KGaA) was used.
hOB cells were cultured for 2 weeks under 5% CO2 in air
at 37°C. In a preliminary experiment, hOB cells were treated with
MEL (Sigma-Aldrich; Merck KGaA) at concentrations of 0.2, 1.0 and
2.0 µM for 2 weeks at 37°C to determine the optimal concentration
required. Recombinant human TGF-β1 (R&D Systems, Inc.) was used
at a final concentration of 5.0 ng/ml. 10 µM LY2157299 (Selleck
Chemicals) was used as a TGF-β receptor inhibitor. 1.0 µM LY3214996
(Selleck Chemicals) was used as a selective ERK1/2 inhibitor. hOB
cells were treated with TGF-β1, LY2157299 or LY3214996 for 48 h at
37°C.
Reverse transcription-quantitative PCR
(RT-qPCR)
Total RNA was extracted using an RNeasy micro kit
(Qiagen GmbH). Reverse transcription was performed using the Mir-X
miRNA First-Strand Synthesis kit (Clontech Laboratories, Inc.),
according to the manufacturer's instructions. The mixture was
incubated for 1 h at 37°C and then terminated at 85°C for 5 min.
RNA levels were quantified using a CFX Connect RT PCR detection
system (Bio-Rad Laboratories, Inc.) and SYBR Green PCR Master Mix
(Toyobo Life Science). The reaction mixture consisted of 1.0 µg
cDNA, 9 µl SYBR-Green Mix and 10 µmol each primer. GAPDH was used
as the reference mRNA control, while U6 was the reference miRNA
control. The thermocycling conditions consisted of an initial
denaturation at 95°C for 10 min, followed by 40 cycles at 95°C for
15 sec, 58°C for 30 sec and 72°C for 40 sec. The following PCR
primer sets were used: Alkaline phosphatase (ALP) sense,
5′-ACTGCAGACATTCTCAAAGC-3′ and antisense,
5′-GAGTGAGTGAGTGAGCAAGG-3′ (15);
Runx2 sense, 5′-ATGCTTCATTCGCCTCAC-3′ and antisense,
5′-ACTGCTTGCAGCCTTAAAT-3′ (16);
Notch2 sense, 5′-CCCTGGGCTACACTGGGAAAAACTG-3′ and antisense,
5′-GGCAGGGGTTGGACGCACACTCA-3′ (17); GAPDH sense,
5′-GTGAACCATGAGAAGTATGACAA-3′ and antisense,
5′-ATGAGTCCTTCCACGATACC-3′ (18);
miR-181c-5p sense, 5′-GGGAACATTCAACCTGTCG-3′ and antisense,
5′-GTGCGTGTCGTGGAGTCG-3′ (19);
and U6 sense, 5′-GCTTCGGCAGCACATATACTAAAAT-3′ and antisense,
5′-CGCTTCACGAATTTGCGTGTCAT-3′ (19). The quantification of mRNA
expression relative to an internal control, GAPDH, was performed by
the 2−ΔΔCq method (20). The results are expressed as the
mean ± SD of three independent experiments.
Western blotting
Mammalian Cell Lysis kit (Sigma-Aldrich; Merck KGaA)
was used to prepare protein extracts. Protein concentrations were
determined using a protein assay kit (Bio-Rad Laboratories, Inc.).
Protein (10 µg) samples were solubilized by boiling in sample
buffer, then separated by 10% SDS-PAGE and transferred to a
nitrocellulose membrane. The membrane was blocked with Blocking
One-P reagent (Nacalai Tesque, Inc.) for 1 h at room temperature.
After incubation with the primary antibody at room temperature
overnight, immunoblots were labeled with a horseradish
peroxidase-conjugated secondary antibody for 1 h at room
temperature Bands on western blots were detected using an enhanced
chemiluminescence western blotting reagent (Cytiva). Images were
captured with a cooled charge-coupled device (CCD) camera system
(LAS-4000; Fujifilm Wako Pure Chemical Corporation). Antibodies
used for western blotting were as follows: i) Anti-human Runx2
mouse monoclonal (1:1,000; cat. no. 8486; Cell Signaling
Technology); ii) anti-human ERK1/2 rabbit monoclonal (1:1,000; cat.
no. 4695; Cell Signaling Technology, Inc.); iii) anti-human
phosphorylated (p)-ERK1/2 rabbit monoclonal (1:1,000; cat. no.
9101; Cell Signaling Technology, Inc.); iv) anti-human Notch2
rabbit monoclonal (1:1,000; cat. no. 4530; Cell Signaling
Technology); v) anti-human GAPDH mouse monoclonal (1:1,000; cat.
no. MAB374; EMD Millipore Corporation); vi) horseradish
peroxidase-conjugated sheep anti-mouse antibody (1:1,000; cat. no.
NA931; Cytiva); vii) horseradish peroxidase-conjugated donkey
anti-rabbit antibody (1:1,000; cat. no. NA934; Cytiva). ImageJ
version 1.47 (National Institutes of Health) was used for
densitometric scanning of the protein bands. G3PDH expression was
used as an internal control. Protein expression levels were
normalized to GAPDH signals. Data are presented as the mean ± SD of
three independent experiments.
Immunofluorescence
Cells were fixed with 4% paraformaldehyde in PBS for
1 h at room temperature, permeabilized using 0.2% Triton X-100 in
PBS for 5 min at room temperature and then blocked with PBS + 5%
FBS (Biological Industries) for 1 h at room temperature. The
samples were incubated with Alexa Fluor® 488-conjugated
anti-Runx2 rabbit monoclonal antibody (Abcam; 1:1,000; cat. no.
ab215954 in PBS + 1% BSA [Sigma-Aldrich; Merck KGaA]) for 60 min at
room temperature. Then, Alexa Fluor® 568 phalloidin
(Thermo Fisher Scientific, Inc.; 1:500) was used to stain F-actin.
Slides were rinsed in PBS, mounted in DAPI Fluoromount-G
(SouthernBiotech) and examined using a Biorevo BZ-9000 fluorescence
microscope (Keyence Corporation), magnification, ×400.
Small interfering (si) RNA
knockdown
Stealth™ siRNA for Notch2 (si Notch2;
5′-GAGCACCUGUGAGAGGAAUAUUGAU-3′ and
5′-AUCAAUAUUCCUCUCACAGGUGCUC-3′) and negative control (si control;
cat. no. 12935112; both from Thermo Fisher Scientific, Inc.) were
used for Notch2 knockdown experiments. Cells were transfected with
siRNA (10 nM) using HiPerFect transfection reagent (Qiagen GmbH)
for 48 h according to the manufacturer's instructions. Subsequent
experiments were performed immediately after 48 h of siRNA
transfection.
Transfection of miRNA inhibitor and
miRNA mimics
Cells were transfected with miRNA inhibitor or miRNA
mimics for miR-181c-5p using Lipofectamine® RNAiMAX
Transfection reagent (Thermo Fisher Scientific, Inc.), in
accordance with the manufacturer's instructions. Cells were
transfected with miRNA inhibitor or miRNA mimics for 48 h. mirVana™
miRNA inhibitors (cat. no. 4464084), inhibitor negative controls
(cat. no. 4464076), mimics (cat. no. 4464066) and mimics negative
controls (cat. no. 4464058) were each used at a final concentration
of 10 nM. All transfection reagents and miRNAs were from Thermo
Fisher Scientific, Inc. Subsequent experiments were performed
immediately after 48 h of transfection.
ALP enzyme activity
ALP enzyme activity was examined using a TRACP and
ALP Assay kit (Takara Bio, Inc.; cat. no. MK301). After 7 days of
culture in osteoblastic differentiation medium, cells were
homogenized in the provided extraction solution and sonicated for 3
min. Cell lysates were collected and assayed in accordance with the
manufacturer's instructions. The absorbance at 405 nm was detected
using a microplate reader (Bio-Rad Laboratories, Inc.), as a
measure of ALP activity. The data are presented as the mean ± SD of
three independent experiments.
Alizarin Red staining and
quantification
Alizarin red staining was performed as described in
our previous study (10). The
cells were fixed in 10% neutral buffered formalin (Sigma-Aldrich;
Merck KGaA) at room temperature. After 30 min, formalin was
aspirated and the cells were washed with deionized distilled water.
Alizarin Red solution (1.0%) was added and incubated at room
temperature in the dark for 1 h. Light microscopy was used to
visualize the specimens (magnification, ×40). Quantitation of
Alizarin red staining was performed by measuring the absorbance of
dissolved alizarin red. Cell monolayers were submerged in 20%
methanol and 10% acetic acid solution in water. The
spectrophotometric absorbance of the samples was measured at 405 nm
using a microplate reader. The results are expressed as the mean ±
SD of three independent experiments.
Microarray analysis of miRNA
expression
The Affymetrix GeneChip miRNA 4.0 array was used for
miRNA expression analysis. Microarray analysis was performed using
1 µg total RNA labeled with the FlashTag™ Biotin HSR RNA Labeling
kit in accordance with the manufacturer's instructions.
Biotin-labeled samples were hybridized on the GeneChip miRNA
microarray, according to the manufacturer's instructions. The array
was then washed with GeneChip™ Wash Buffer and stained using the
Genechip Fluidics Station 450, and scanned using the GeneChip
Scanner. Raw data were extracted automatically with the Affymetrix
data extraction protocol, using the Transcriptome Analysis Console
Software version 4.0 (Thermo Fisher Scientific, Inc.). CEL file
importing, miRNA expression Robust Multi-array Average
(RMA)+Detected Above Background (DABG)-All analysis, and result
exporting were performed using Affymetrix Power Tools Software
version 2.11.2 For significant differentially expressed miRNAs
(DEmiRNA), hierarchical cluster analysis was conducted using
complete linkage and Euclidean distance as a measure of similarity
(21,22). All reagents, kits and software were
from Affymetrix (Thermo Fisher Scientific, Inc.).
Identification of potential targets
for miRNA
TargetScan v7.2 (http://www.targetscan.org) was used to identify
potential miRNA targets in the 3′-untranslated region (UTR) of
candidate genes. TargetScan can predict biological targets of
miRNAs by searching for the presence of conserved sites that match
the sequence of each miRNA (23).
Predictions are ranked based on the predicted efficacy of
targeting, as calculated using context scores of the sites in
mammals (24).
Statistical methods
Data were expressed as the mean ± SD. Data were
analyzed statistically using SPSS software (version 24; IBM Corp.).
Tukey's Honestly Significant Difference test was used for multiple
comparisons. Statistical analysis was otherwise performed using
unpaired Student's t-test. P<0.05 was considered to indicate a
statistically significant difference.
Results
MEL induces osteogenic differentiation
of hOB cells
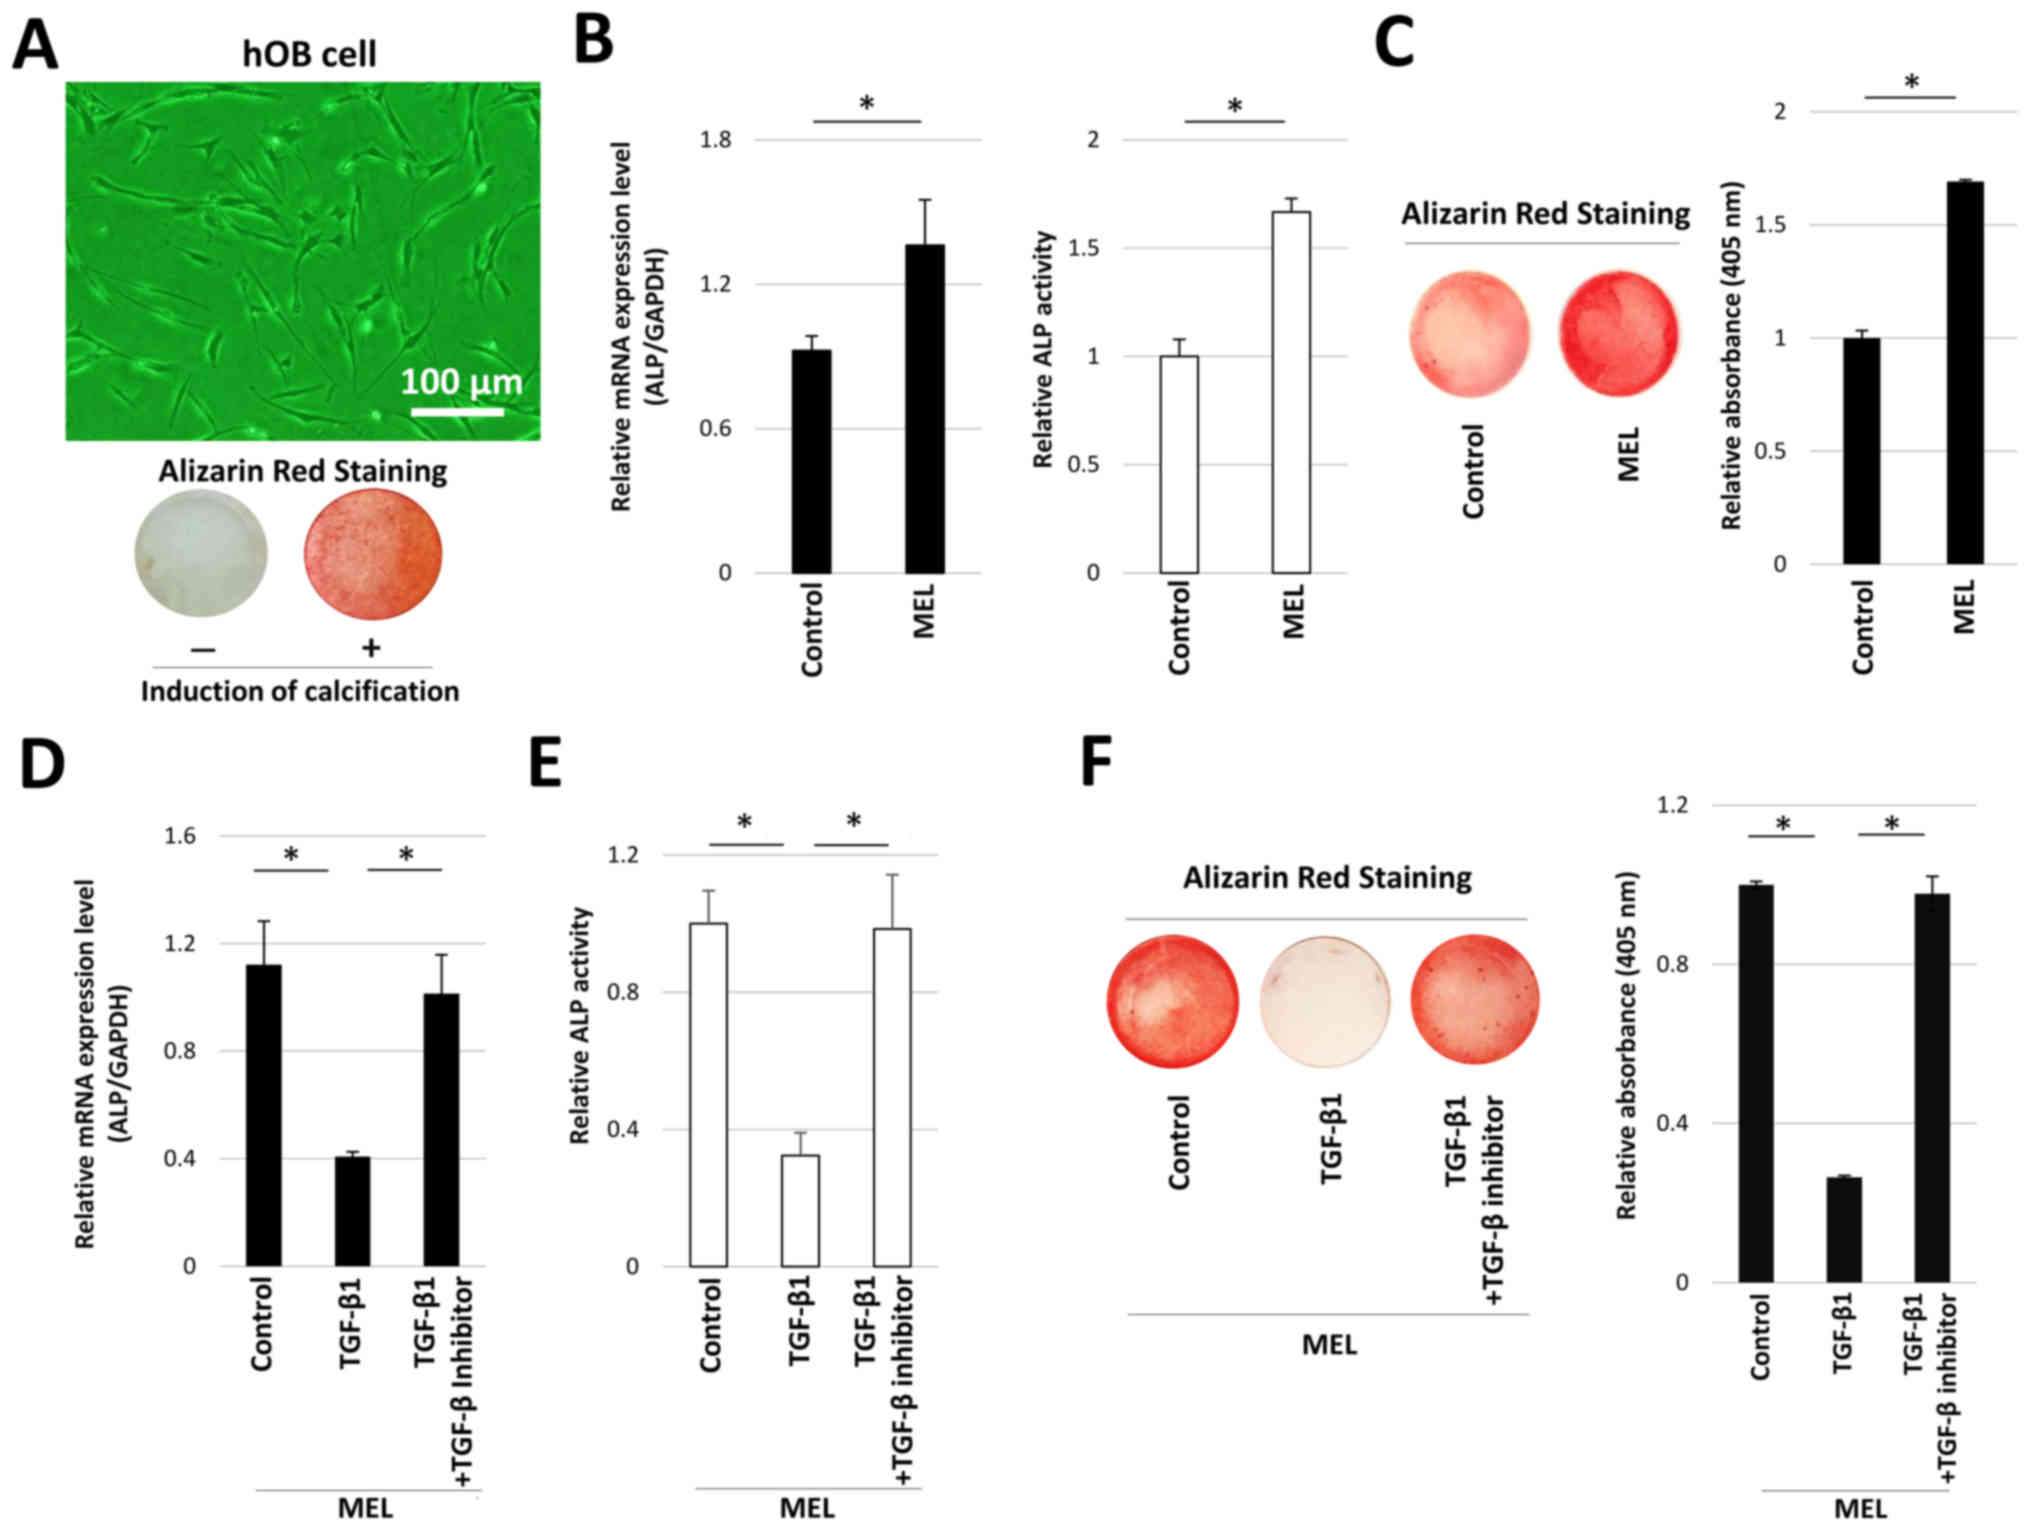
hOB cells displayed spindle-like morphology in the
absence of osteogenic induction medium. hOB cells exhibited
positive alizarin red staining after they had been cultured in
osteogenic induction medium (Fig.
1A). These observations suggested that primary hOB cells
derived from mandibular bone exhibited osteogenetic characteristics
in vitro. Therefore, the effect of MEL on osteogenetic
characteristics was investigated in hOB cells. The level of
mineralization staining was highest in the presence of 1.0 µM MEL.
Furthermore, mineralization staining in hOB cells was significantly
enhanced in the presence of 1.0 µM MEL, compared with untreated
controls (Fig. S1). Therefore,
1.0 µM MEL was used in the present study. MEL treatment
significantly enhanced ALP mRNA expression and enzyme activity,
compared with control cells (Fig.
1B). Alizarin red staining was also performed on hOB cells
treated with MEL for 14 days in osteogenic induction medium, and it
was identified that treatment with MEL resulted in significantly
greater mineralization staining, compared with control cells
(Fig. 1C). These results indicated
that MEL could promote calcification in hOB cells.
The effect of TGF-β1 on MEL-induced mineralization
was also investigated. Treatment with 5 ng/ml TGF-β1 significantly
inhibited MEL-induced ALP mRNA expression and activity (Fig. 1D and E). However, concomitant
treatment with TGF-β1 and TGF-β inhibitor restored ALP expression
and enzymatic activity, reaching similar levels to control cells.
MEL-induced mineralization was also attenuated by treatment with
TGF-β1, which was restored following co-treatment with TGF-β
inhibitor (Fig. 1F).
MEL-induced upregulation of Runx2
expression in hOB cells is reduced by treatment with TGF-β1
Runx2 mRNA and protein expression levels were
significantly increased in the presence of MEL alone (Fig. 2A-C). However, MEL-induced
upregulation of Runx2 expression was significantly inhibited by
TGF-β1 treatment, and this effect was reversed by treatment with
TGF-β inhibitor. Immunofluorescence staining identified that Runx2
protein was present in the nucleus cell. It was found that
treatment with TGF-β1 reduced the numbers of Runx2-positive cells,
but this reduction was reversed by treatment with a TGF-β inhibitor
(Fig. 2D).
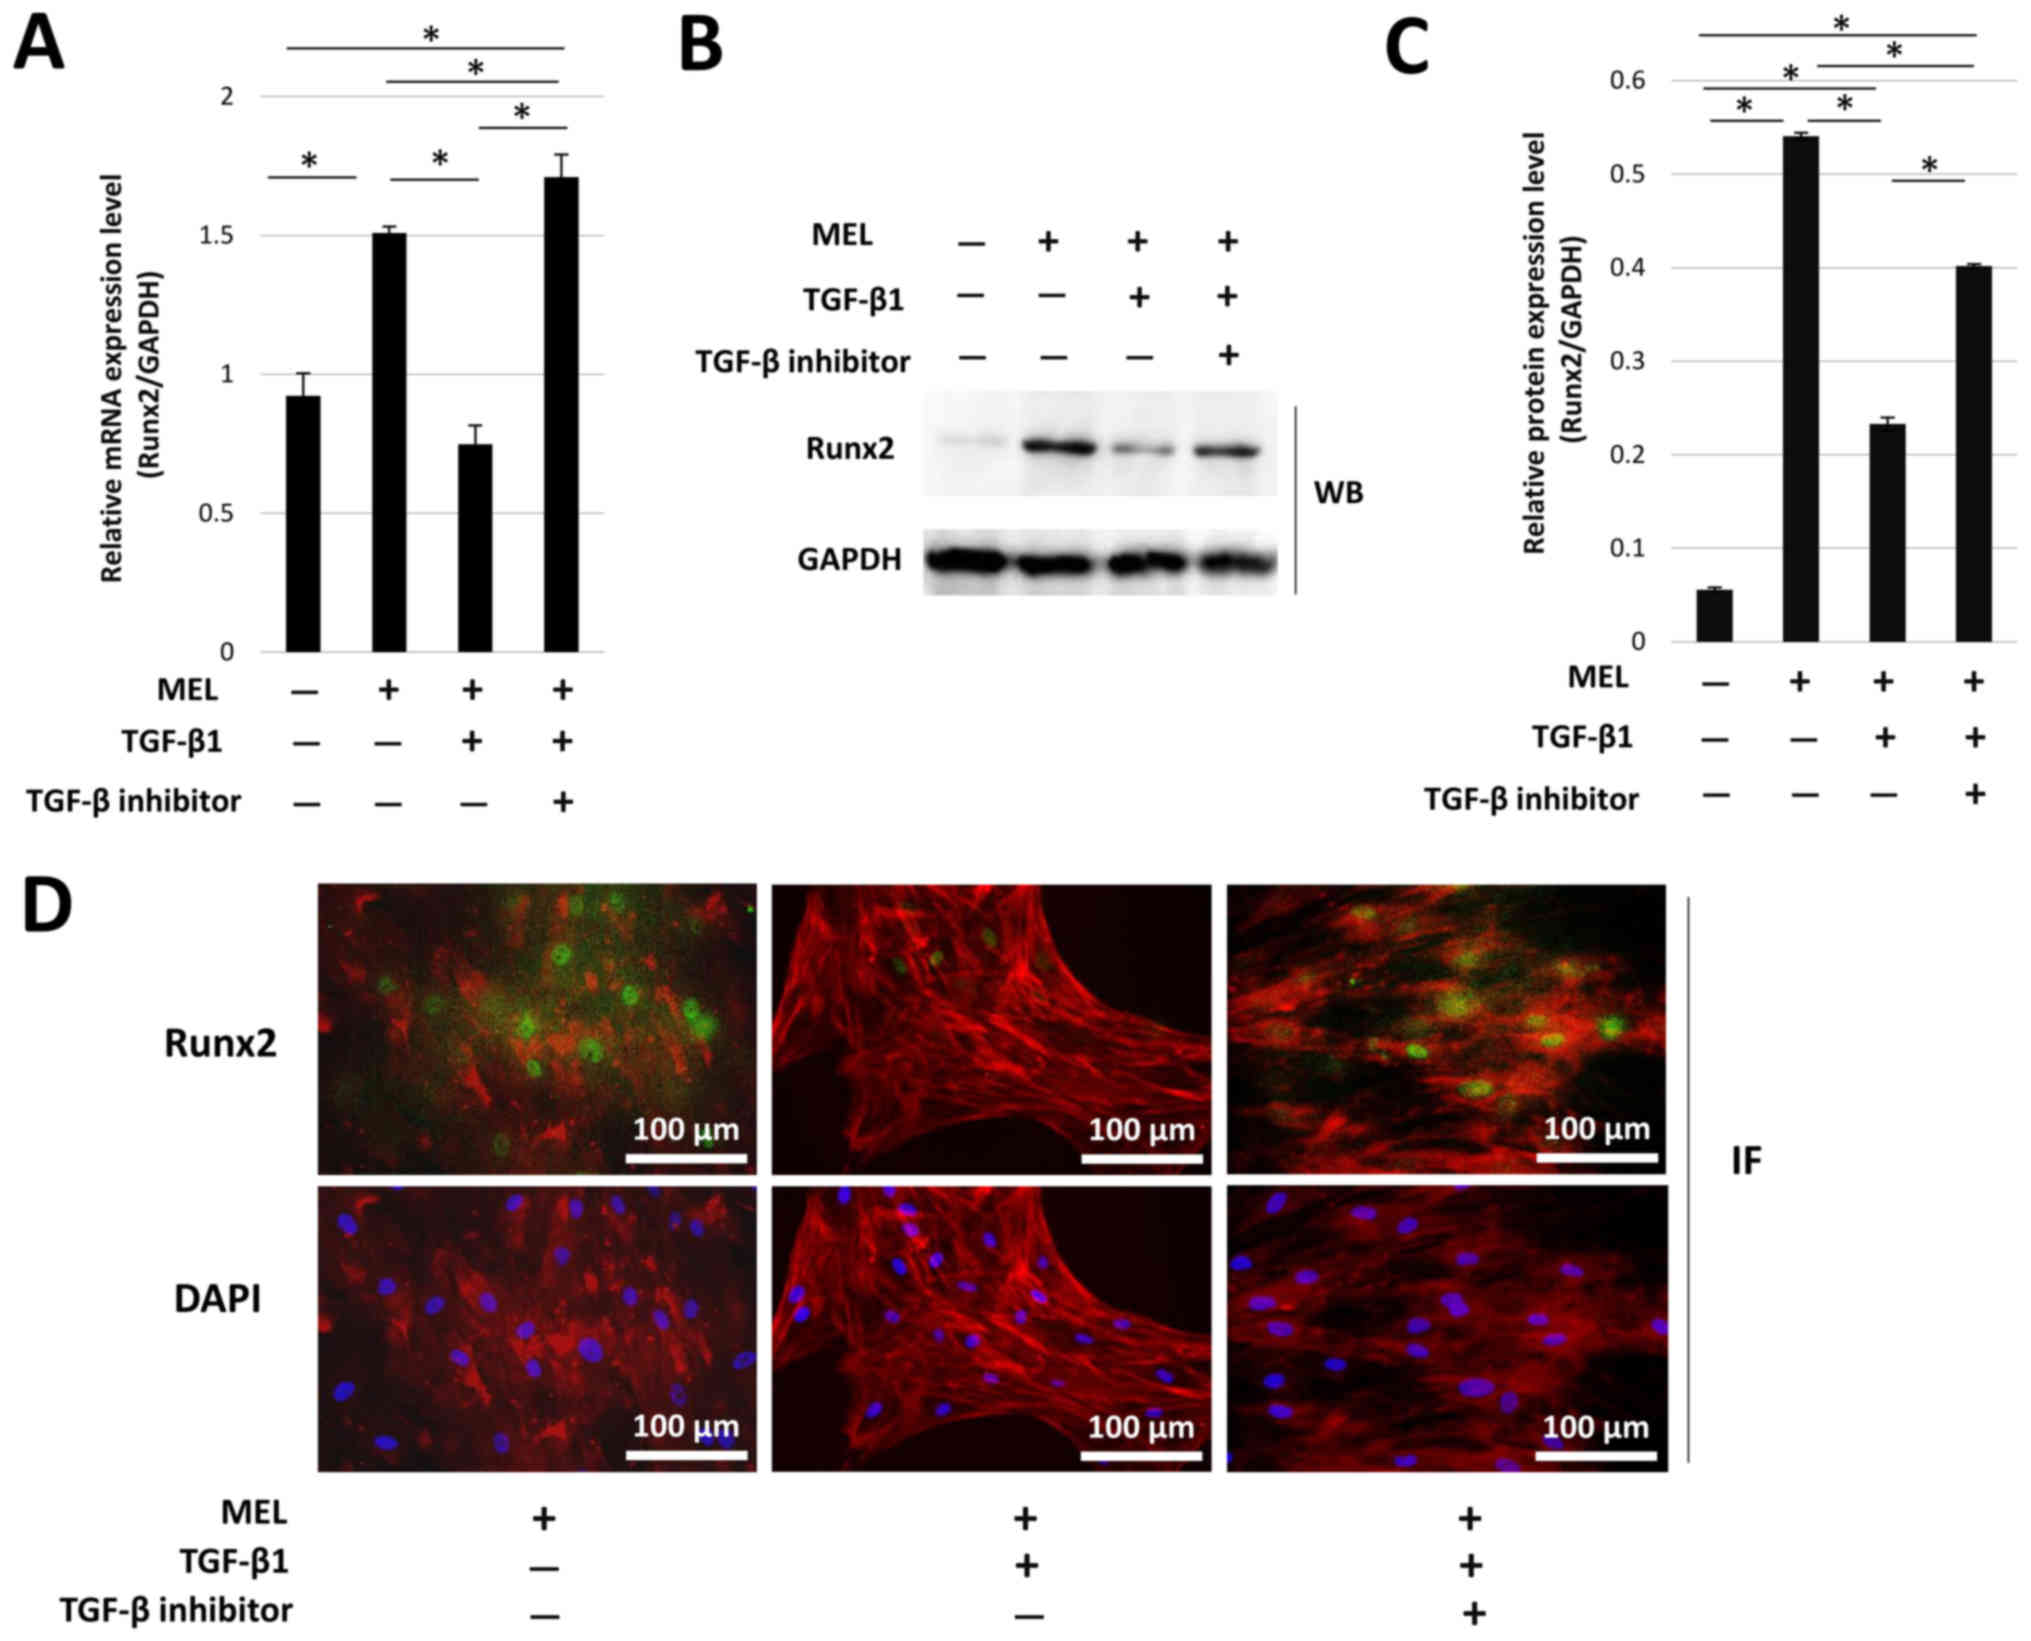 | Figure 2.MEL-induced Runx2 expression in hOB
cells is reduced by TGF-β1 treatment. Runx2 (A) mRNA expression,
(B) protein expression and (C) protein densitometry in hOB cells in
the presence of MEL. (D) Immunofluorescence of Runx2 (green),
F-actin (red) and DAPI nuclear staining (blue). Magnification,
×400. Scale bar, 100 µm. *P<0.05. MEL, melatonin; hOB, human
jawbone-derived osteoblast-like; TGF-β1, transforming growth
factor-β1; WB, western blotting; IF, immunofluorescence; Runx2,
RUNX family transcription factor 2. |
MEL-induced Runx2 expression is
reduced by ERK1/2 activation
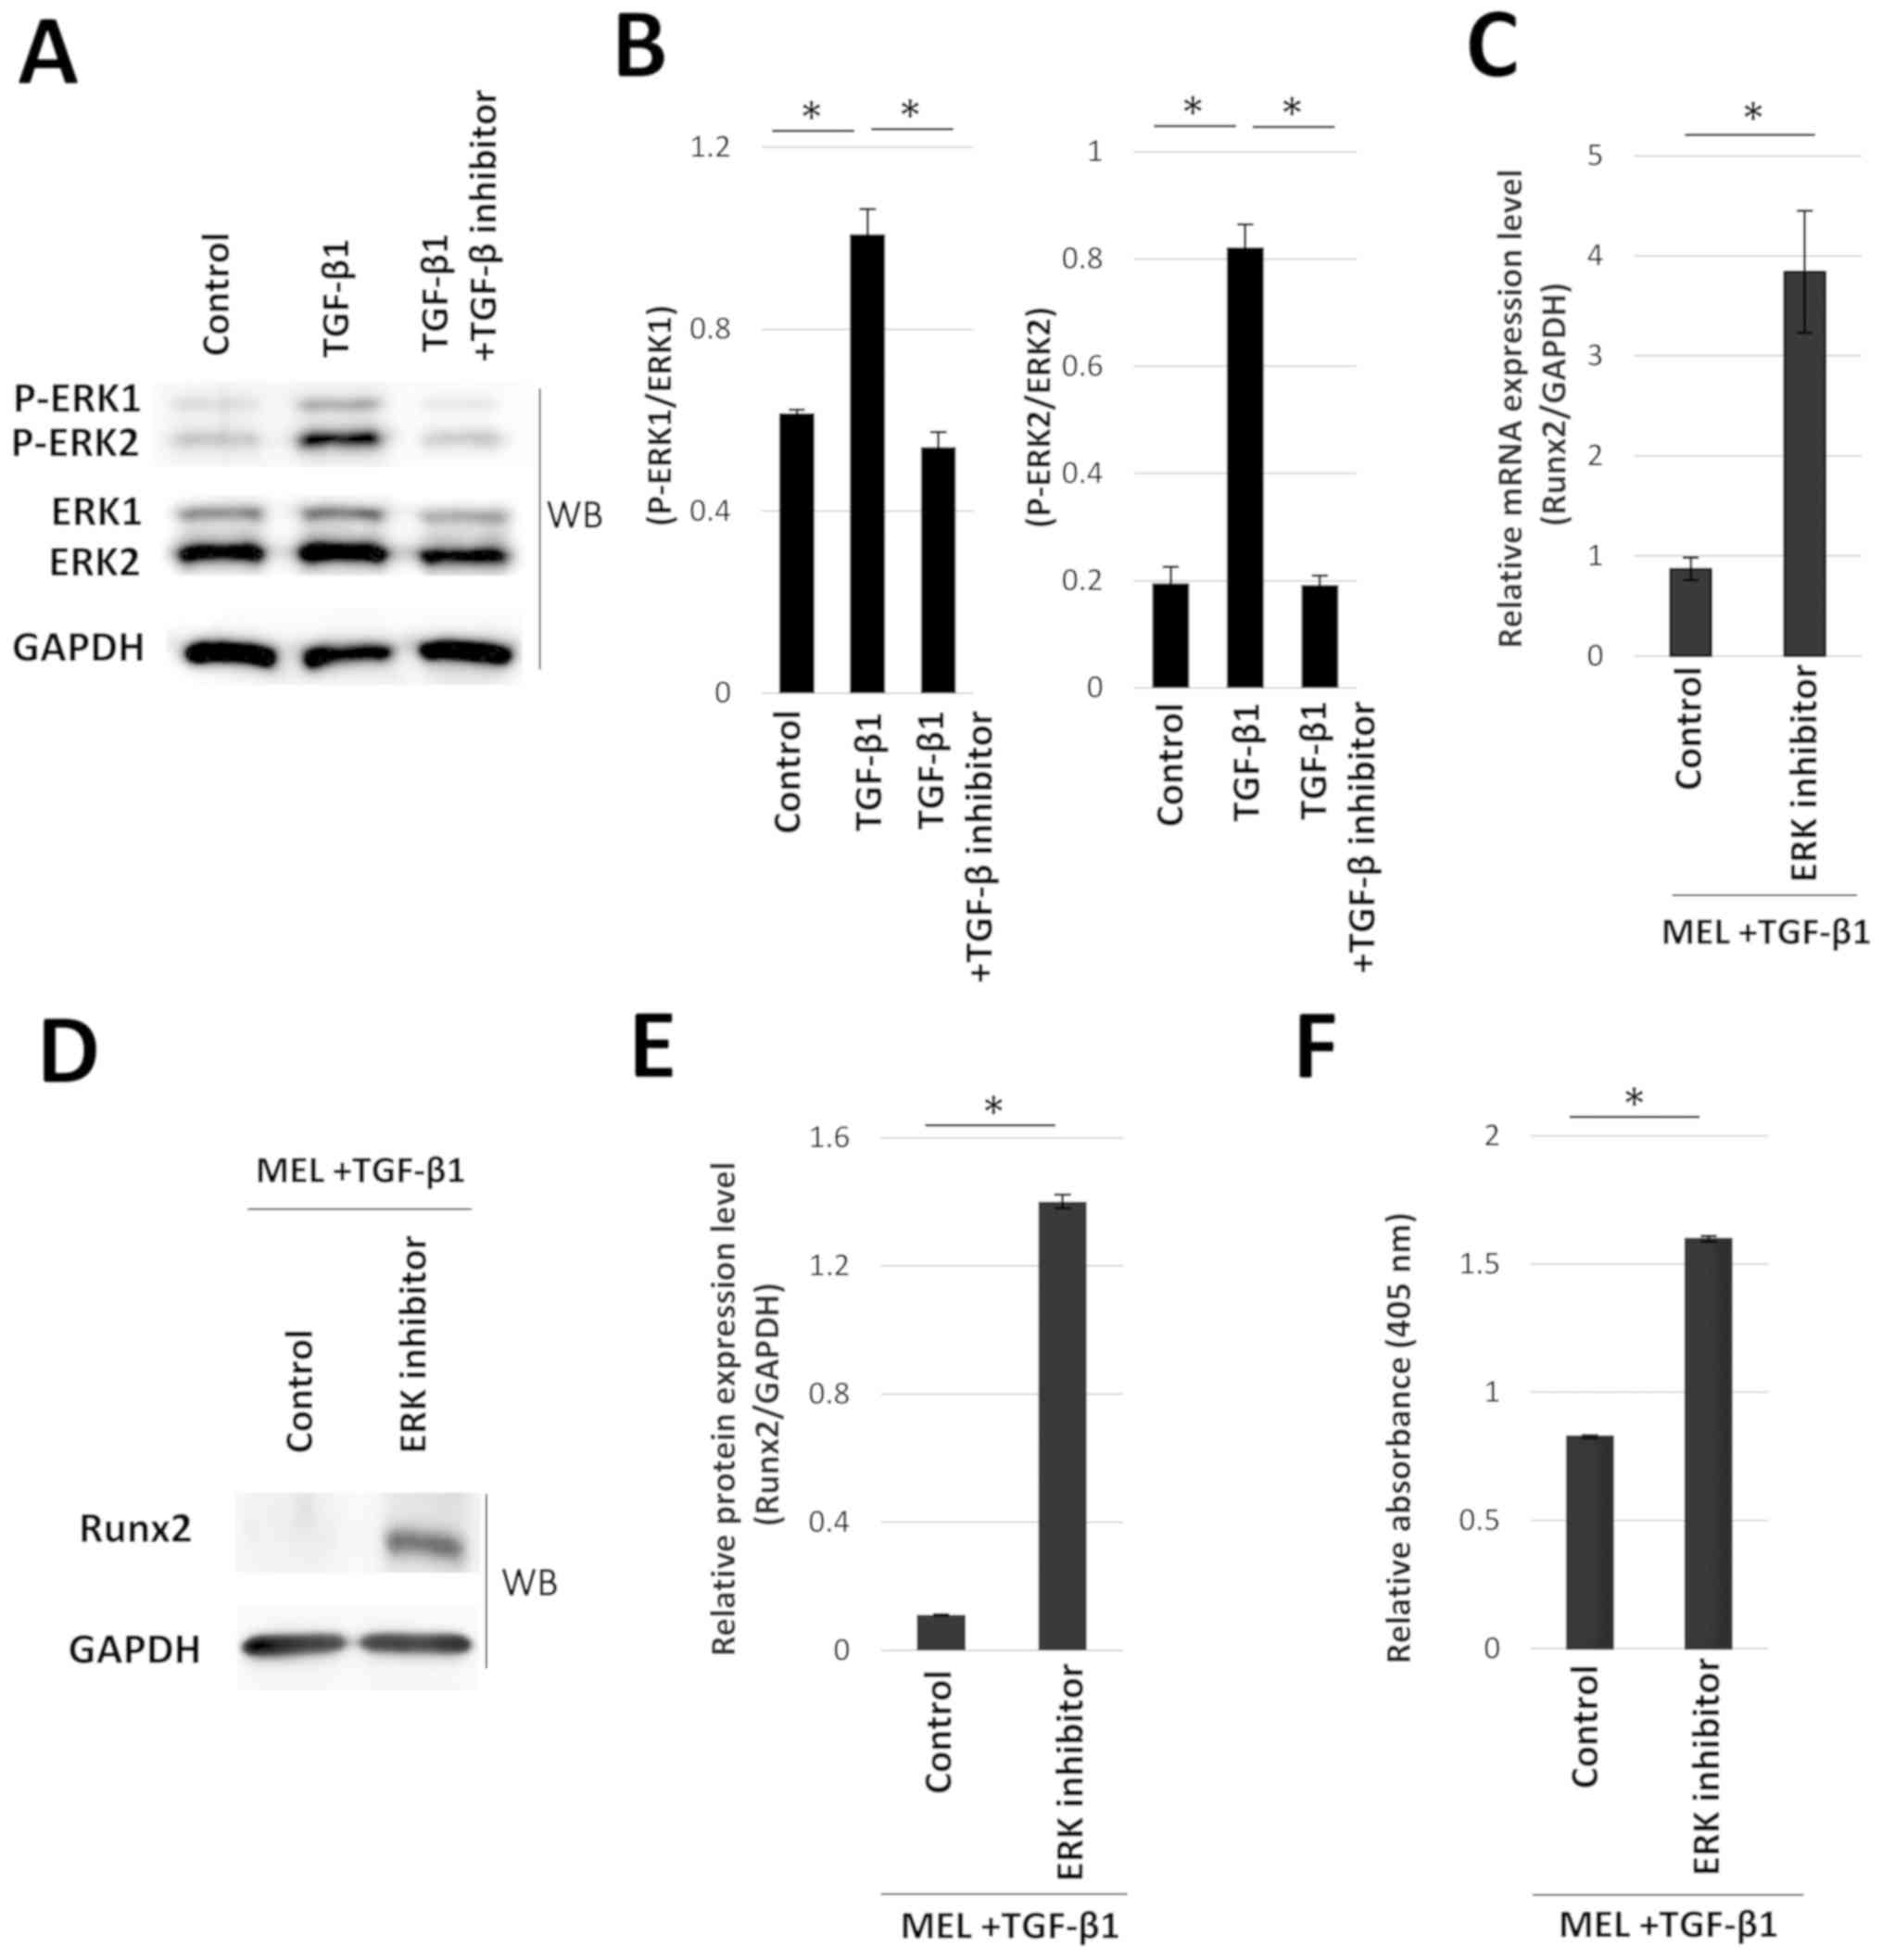
The effects of TGF-β1 treatment on the
phosphorylation levels of ERK1/2 were evaluated using western blot
analysis (Fig. 3A). The levels of
p-ERK1/2 were determined by normalizing the densities of p-ERK1/2
bands to total ERK1/2. Treatment with TGF-β1 significantly enhanced
the phosphorylation levels of ERK1/2 (Fig. 3B). Western blotting of p-ERK1/2 was
performed in the addition of ERK inhibitor to check whether ERK
inhibitor can block ERK1/2 pathway by inhibition of phosphorylation
levels of ERK1/2. ERK1/2 phosphorylation was significantly reduced
in TGF-β1-treated hOB cells following the addition of an ERK
inhibitor (Fig. S2A and B).
Furthermore, the effect of ERK inhibitor treatment on Runx2
expression was assessed following treatment with MEL and TGF-β1.
Compared with MEL and TGF-β1-treated cells, the addition of ERK
inhibitor significantly increased the TGF-β1-inhibited Runx2 mRNA
and protein expression, as well as the levels of mineralization
staining (Fig. 3C-F).
MEL-induced Runx2 upregulation and
calcification is mediated by miR-181c-5p
Microarray analysis was performed to investigate the
effect of MEL on miRNA expression in hOB cells. In total, 124
miRNAs were differentially expressed in MEL-treated hOB cells,
compared with untreated cells. Of these DEmiRNAs, 17 were
upregulated (>2-fold increase), while 13 were downregulated
(<0.5-fold reduction). The upregulated and downregulated miRNAs
are summarized in Tables I and
II, respectively. Of the
upregulated miRNAs, miR-181c-5p exhibited the greatest upregulation
and was therefore selected for subsequent experiments.
 | Table I.miRNAs upregulated in
melatonin-treated human jawbone-derived osteoblast-like cells. |
Table I.
miRNAs upregulated in
melatonin-treated human jawbone-derived osteoblast-like cells.
| miRNA | Fold change |
|---|
| miR-181c-5p | 4.57 |
| miR-1973 | 3.99 |
| miR-501-3p | 3.64 |
| miR-4788 | 3.25 |
| miR-654-3p | 2.92 |
| miR-642a-3p | 2.77 |
| miR-5195-3p | 2.68 |
| miR-4800-5p | 2.61 |
| miR-188-5p | 2.54 |
| miR-3195 | 2.39 |
| miR-8089 | 2.33 |
| miR-30a-3p | 2.30 |
| miR-4743-5p | 2.19 |
| miR-3135b | 2.12 |
| miR-3651 | 2.04 |
| miR-505-3p | 2.02 |
| miR-30d-5p | 2.01 |
| Table II.miRNAs downregulated in
melatonin-treated human jawbone-derived osteoblast-like cells. |
Table II.
miRNAs downregulated in
melatonin-treated human jawbone-derived osteoblast-like cells.
| miRNA | Fold change |
|---|
| miR-4663 | 0.235 |
| miR-3148 | 0.291 |
| miR-6740-5p | 0.308 |
| miR-5189-5p | 0.332 |
| miR-548×-3p | 0.363 |
| miR-181a-2-3p | 0.383 |
| miR-3180-3p | 0.401 |
| miR-16-2-3p | 0.415 |
| miR-21-3p | 0.465 |
| miR-1281 | 0.483 |
| miR-1247-3p | 0.489 |
| miR-212-3p | 0.499 |
| miR-6782-5p | 0.499 |
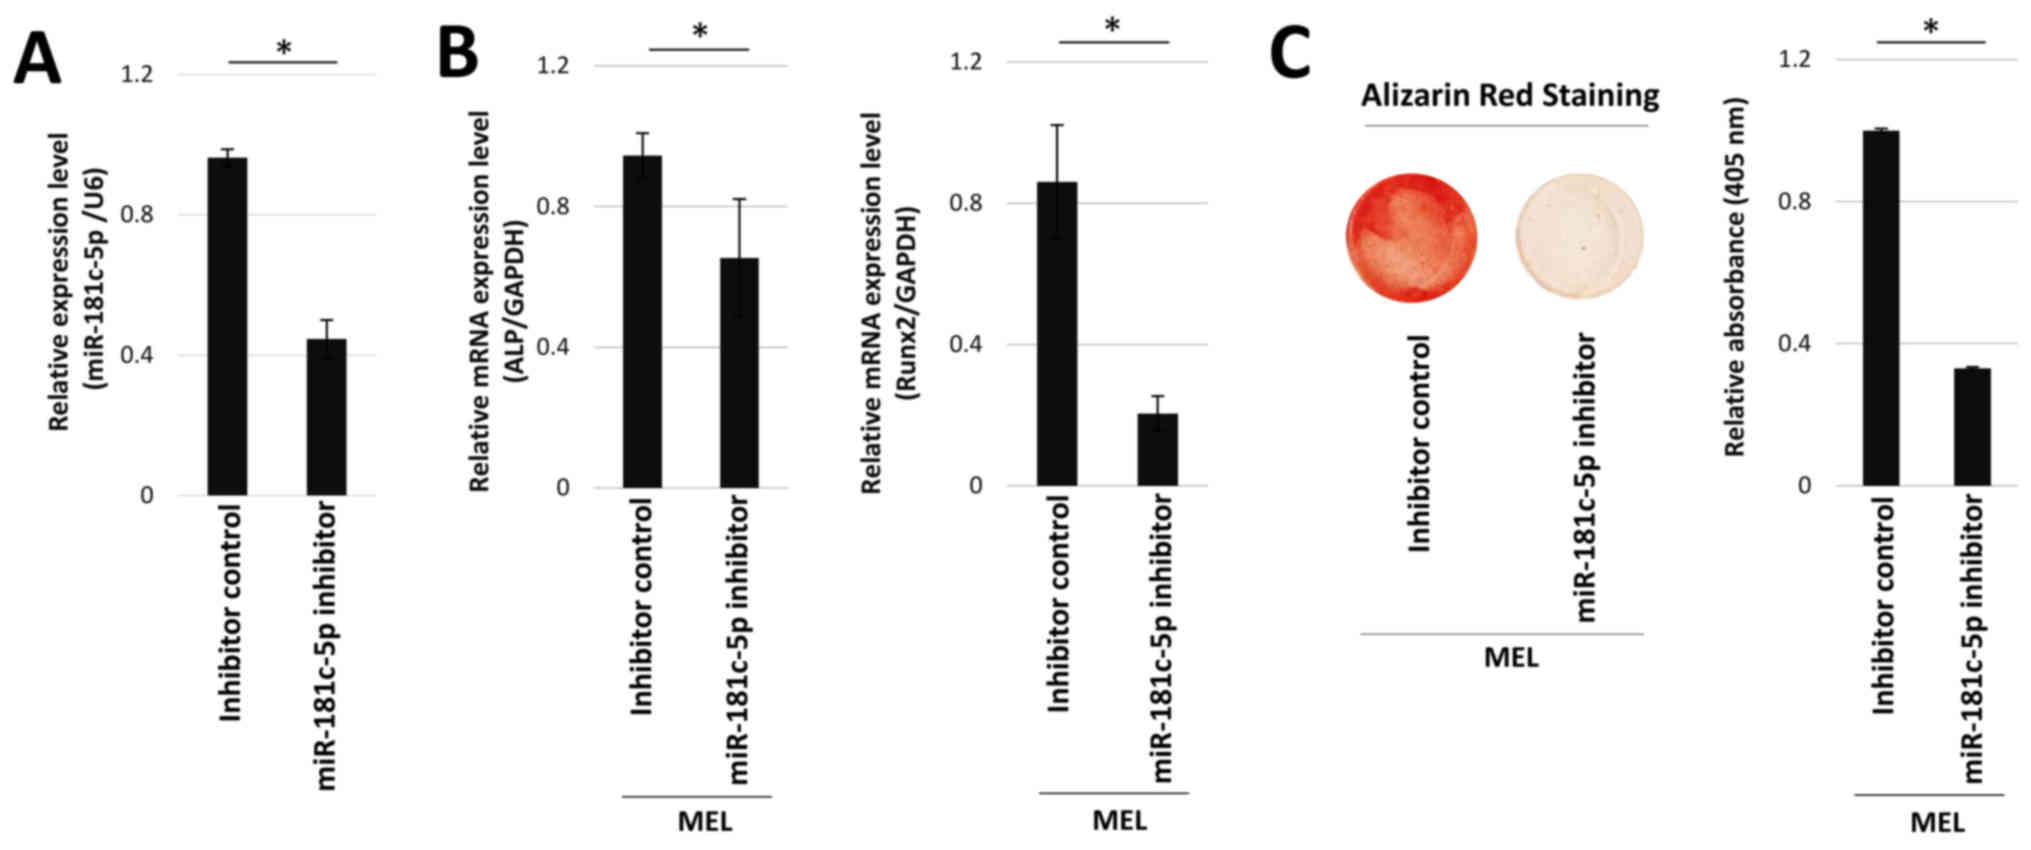
The effects of miR-181c-5p inhibition were
investigated. miR-181c-5p inhibitor-transfected hOB cells exhibited
significantly lower expression of miR-181c-5p, compared with cells
transfected with inhibitor control (Fig. 4A). ALP and Runx2 mRNA expression
levels were then determined in hOB cells transfected with
miR-181c-5p inhibitor in the presence of MEL. Transfection with
miR-181c-5p inhibitor significantly reduced Runx2 and ALP mRNA
expression levels (Fig. 4B), as
well as mineralization staining in the presence of MEL (Fig. 4C).
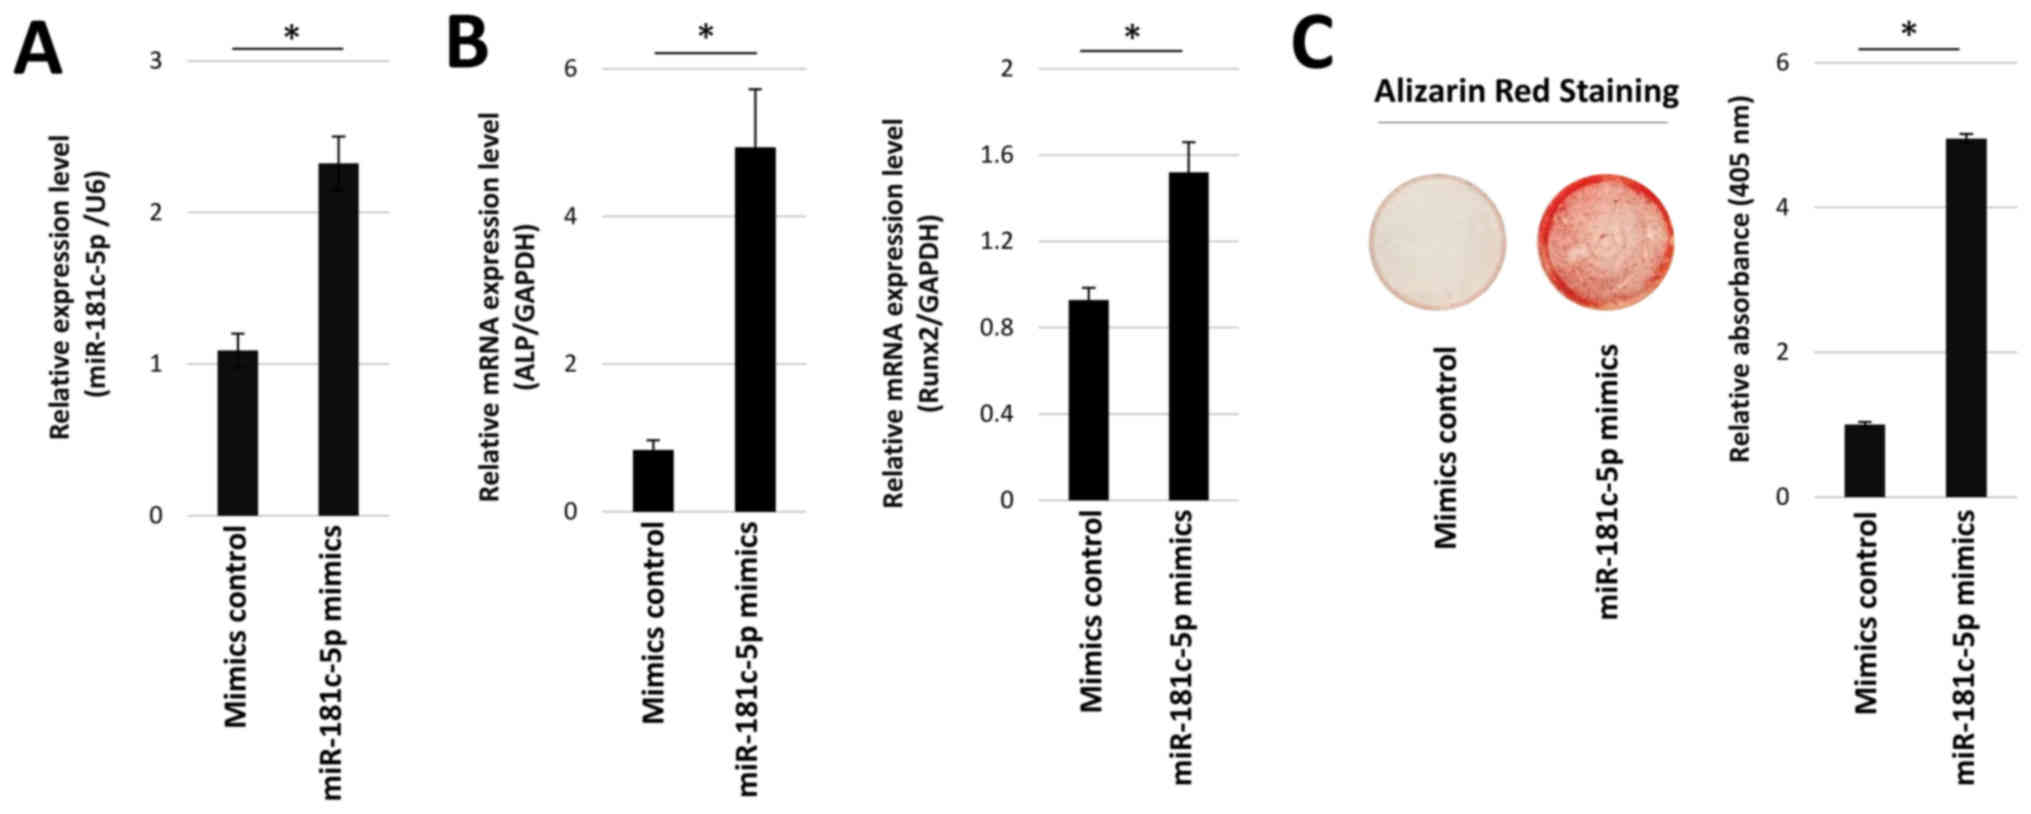
The effect of miR-181c-5p overexpression on ALP and
Runx2 mRNA expression levels was also examined using miR-181c-5p
mimic transfection. miR-181c-5p expression was significantly
increased in hOB cells transfected with miR-181c-5p mimics,
compared with mimics control (Fig.
5A). Transfection with miR-181c-5p mimics resulted in a
significant upregulation in Runx2 and ALP mRNA expression levels,
compared with mimics control (Fig.
5B). Similarly, mineralization staining was also significantly
enhanced (Fig. 5C). These results
suggested that Runx2 expression and mineralization were dependent
on miR-181c-5p expression.
Notch2 expression is reduced by
miR-181c-5p overexpression
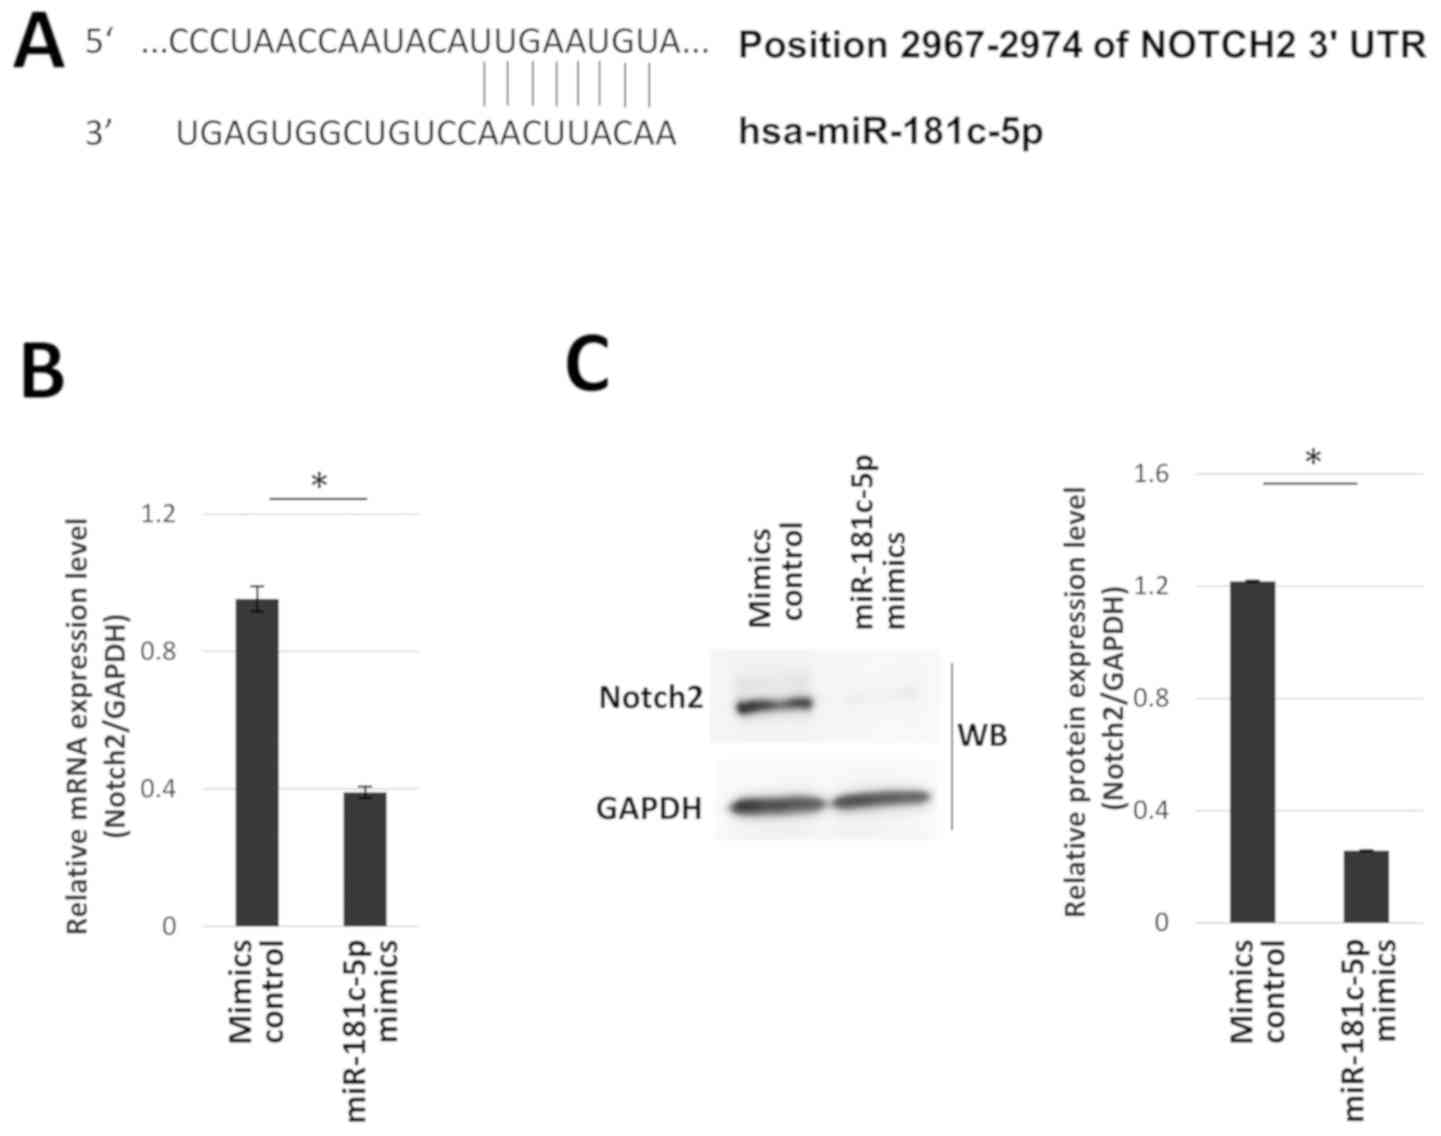
Using TargetScan, position 2,967-2,974 within the
3′-UTR of the Notch2 gene was identified as a putative binding site
for miR-181c-5p (Fig. 6A). Notch2
has been reported to serve a significant role in the regulation of
osteoblastic cell differentiation (25). Therefore, the role of miR-181c-5p
in regulation of Notch2 expression was examined. Notch2 mRNA and
protein expression levels were significantly reduced in hOB cells
transfected with miR-181c-5p mimics, compared with mimics control
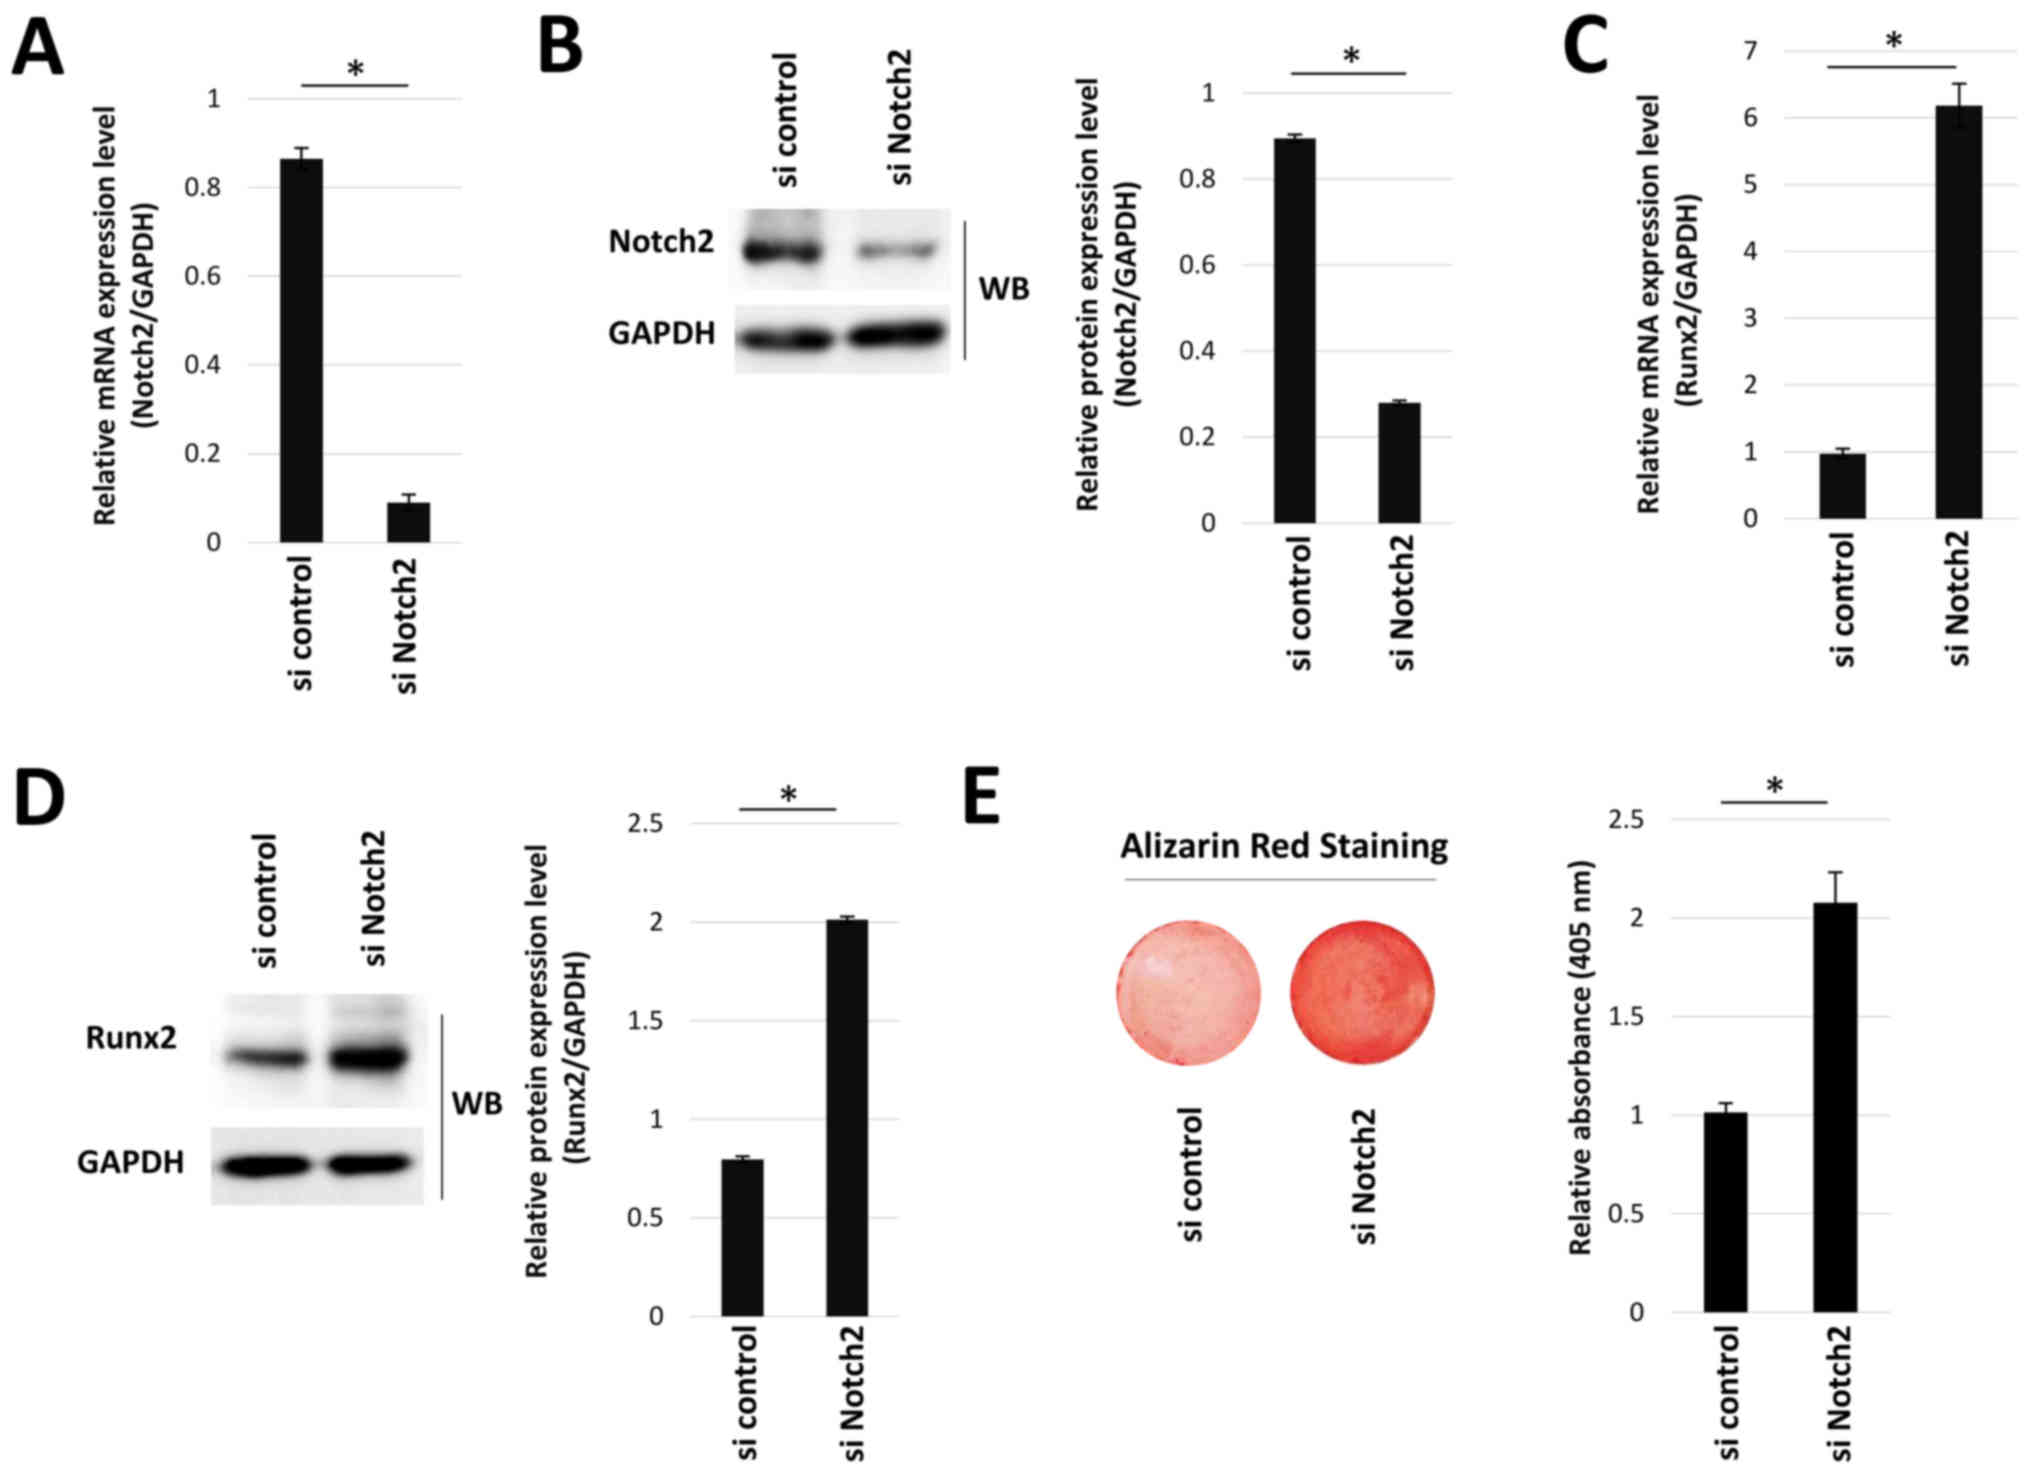
(Fig. 6B and C). The association
between Notch2 and Runx2 was then determined using Notch2 siRNA
silencing. Transfection with si Notch2 significantly reduced Notch2
mRNA and protein expression levels, compared with si control
(Fig. 7A and B). Moreover, Notch2
knockdown significantly increased Runx2 mRNA and protein expression
levels (Fig. 7C and D), as well as
mineralization staining (Fig.
7E).
Discussion
The object of the present study was to assess the
role of MEL in mineralization and the effect of TGF-β on
osteoblastic cell differentiation in human osteoblastic cells. It
has been reported that MEL induces the differentiation of
mesenchymal cells and preosteoblasts into mature osteoblastic cells
(6–8). MEL also induces mineralization of
mouse osteoblastic cells via the BMP/ERK/Wnt signaling pathway
(11) and promotes the
proliferation of human osteoblastic cells via ERK1/2 activation
(26). In the present study,
treatment with MEL enhanced the expression of Runx2, an important
regulatory factor for hOB cell differentiation and mineralization
(27). These results suggested
that MEL could serve as an important regulator of osteogenic
differentiation and mineralization in osteoblastic cells.
miRNAs are known to regulate key biological
processes, including cell proliferation, differentiation and death
(28–30). Additionally, miRNAs are likely to
serve positive or negative roles in osteoblast differentiation via
the regulation of target gene expression and modulation of cell
signaling pathways. For instance, some miRNAs are involved in the
regulation of osteogenic differentiation in osteoblastic cells via
direct or indirect targeting of Runx2 (31). Moreover, miR-590-5p enhances
osteogenic differentiation in mouse mesenchymal stem cells by
indirectly stabilizing Runx2 expression (32). In the present study, MEL-induced
expression of miR-181c-5p promoted Runx2 expression and
calcification in hOB cells. To the best of our knowledge, this is
the first report demonstrating a role for miR-181c-5p expression in
human osteoblastic cell differentiation.
In the current study, Notch2 was identified as a
potential target of miR-181c-5p in hOB cells. However, whether
Notch2 transcription is directly suppressed by miR-181c-5p activity
remains unknown. Thus, further studies are required to elucidate
the specific mechanism via which Notch2 expression is modulated by
miR-181c-5p. It has been reported that miR-758 regulates
bone-related gene expression and bone formation via the inhibition
of Notch2 in periodontal ligament stem cells (33). The results of the present study are
consistent with these findings and support the importance of miRNA
in the regulation of Notch2 expression, thus controlling bone
formation and mineralization. Furthermore, in the present study,
Notch2 silencing enhanced both Runx2 expression and calcification
in hOB cells. These results suggested that MEL-induced expression
of miR-181c-5p may promote human osteogenic differentiation via the
suppression of Notch2-dependent signaling. The Notch signaling
pathway is involved in osteoblast differentiation (25). Notably, Notch2 suppresses
osteoblastic cell differentiation and bone formation (34,35).
The Notch/recombination signal binding protein for immunoglobulin
κJ region/Hey signaling pathway is suggested to affect osteoblast
differentiation via the inhibition of Runx2 and nuclear factor of
activated T cells c1 in mice (34). Moreover, Notch3 attenuates Runx2
expression and osteogenic differentiation in bone marrow-derived
mesenchymal stem cells (36).
These findings suggest that Notch signaling negatively regulates
osteogenic differentiation via the suppression of Runx2
expression.
The effect of TGF-β on osteoblast differentiation
remains controversial. For instance, whether TGF-β facilitates or
inhibits osteoblast differentiation and bone formation it yet to be
elucidated. The concentration of TGF-β and stage of osteoblast
differentiation may influence osteogenic differentiation and bone
formation (37–39). In addition, cell proliferation,
chemotaxis and early differentiation of osteoprogenitor cells are
promoted by TGF-β/Smad signaling (12). In contrast, the TGF-β/Smad
signaling pathway also inhibits osteoblast maturation,
mineralization and transition to the osteocyte cell type (12).
TGF-β can activate the MAPK/ERK pathway and inhibit
osteogenesis in pluripotent mesenchymal cells (C3H10T1/2 cell
line), as well as in preosteoblastic cells (MC3T3 cell line)
(13). The MAPK/ERK signaling
pathway may also serve a predominant role in mouse osteogenic
differentiation (13). In the
present study, MEL-induced Runx2 expression and mineralization were
attenuated by TGF-β1-induced ERK1/2 activation in hOB cells. This
observation indicated that osteogenic differentiation could be
inhibited by TGF-β-induced ERK activation in human osteoblastic
cells.
In conclusion, MEL regulates the expression of
miR-181c-5p in hOB cells, which in turn may enhance both Runx2
expression and mineralization via Notch2 downregulation (Fig. 8). The present findings indicated
that MEL serves an important role in the modulation of miR-181c-5p
expression and supports the osteogenic differentiation of human
osteoblastic cells. However, it remains to be elucidated whether
miR-181c-5p can directly inhibit Notch2 transcription. Further
studies are required to elucidate the specific role of the
Notch2-dependent signaling pathway in Runx2 expression and
osteogenic differentiation.
Supplementary Material
Supporting Data
Acknowledgements
Not applicable.
Funding
The present work was supported by a Grant-in-aid for
Scientific Research (grant no. 18K09790) from the Ministry of
Education, Culture, Sports, Science and Technology of Japan.
Availability of data and materials
All data generated or analyzed in this study are
included in this published article.
Authors' contributions
HM performed experiments and analyzed and
interpreted the data. HS designed the study, analyzed and
interpreted the data, and wrote the paper. HK, SY and MS performed
experiments. MTad, SO and MZR discussed, analyzed and interpreted
the data. KO and MTak designed the study and aided in writing the
paper. All authors read and approved the final manuscript.
Ethics approval and consent to
participate
The present study was approved by the Ethical
Committee of Hiroshima University (approval no. E-930). Bone
fragments were obtained from a patient who underwent mandibular
osteotomy and had provided written informed consent for use of the
fragments in this study.
Patient consent for publication
Not applicable.
Competing interests
The authors declare that they have no competing
interests.
Glossary
Abbreviations
Abbreviations:
|
MEL
|
melatonin
|
|
ALP
|
alkaline phosphatase
|
|
miRNA/miR
|
microRNA
|
References
|
1
|
Singh M and Jadhav HR: Melatonin:
Functions and ligands. Drug Discov Today. 19:3549–1418. 2014.
View Article : Google Scholar
|
|
2
|
Reiter RJ, Tan DX, Rosales-Corral S and
Manchester LC: The universal nature, unequal distribution and
antioxidant functions of melatonin and its derivatives. Mini Rev
Med Chem. 13:373–384. 2013. View Article : Google Scholar : PubMed/NCBI
|
|
3
|
Conti A, Conconi S, Hertens E,
Skwarlo-Sonta K, Markowska M and Maestroni JM: Evidence for
melatonin synthesis in mouse and human bone marrow cells. J Pineal
Res. 28:193–202. 2000. View Article : Google Scholar : PubMed/NCBI
|
|
4
|
Liu C, Fukuhara C, Wessel JH III, Iuvone
PM and Tosini G: Localaization of Aa-nat mRNA in the rat retina:
Melatonin synthesis by florescence in situ hybridization and laser
capture microdissection. Cell Tissue Res. 315:197–201. 2004.
View Article : Google Scholar : PubMed/NCBI
|
|
5
|
Salehi B, Sharopov F, Fokou PVT,
Kobylinska A, Jonge L, Tadio K, Sharifi-Rad J, Posmyk MM, Martorell
M, Martins N, et al: Melatonin in medicinal and food plants:
Occurrence, bioavailability, and health potential for humans.
Cells. 8:E6812019. View Article : Google Scholar : PubMed/NCBI
|
|
6
|
Roth JA, Kim BG, Lin WL and Cho MI:
Melatonin promotes osteoblast differentiation and bone formation. J
Biol Chem. 274:22041–22047. 1999. View Article : Google Scholar : PubMed/NCBI
|
|
7
|
Ostrowska Z, Ziora K, Kos-Kudła B,
Swietochowska E, Oświecimska J, Dyduch A, Wołkowska-Pokrywa K and
Szapska B: Melatonin, the RANKL/RANK/OPG system, and bone
metabolism in girls with anorexia nervosa. Endokrynol Pol.
61:117–123. 2010.PubMed/NCBI
|
|
8
|
Sethi S, Radio NM, Kotlarczyk MP, Chen CT,
Wei YH, Jockers R and Witt-Enderby PA: Determination of the minimal
melatonin exposure required to induce osteoblast differentiation
from human mesenchymal stem cells and these effects on downstream
signaling pathways. J Pineal Res. 49:222–238. 2010. View Article : Google Scholar : PubMed/NCBI
|
|
9
|
Takechi M, Tatehara S, Satomura K,
Fujisawa K and Nagayama M: Effect of FGF-2 and melatonin on implant
bone healing: A histomorphometric study. J Mater Sci Mater Med.
19:2949–2952. 2008. View Article : Google Scholar : PubMed/NCBI
|
|
10
|
Rahman MZ, Shigeishi H, Sasaki K, Ota A,
Ohta K and Takechi M: Combined effects of melatonin and FGF-2 on
mouse preosteoblast behavior within interconnected porous
hydroxyapatite ceramics - in vitro analysis. J Appl Oral Sci.
24:153–161. 2016. View Article : Google Scholar : PubMed/NCBI
|
|
11
|
Park KH, Kang JW, Lee EM, Kim JS, Rhee YH,
Kim M, Jeong SJ, Park YG and Kim SH: Melatonin promotes
osteoblastic differentiation through the BMP/ERK/Wnt signaling
pathways. J Pineal Res. 51:187–194. 2011. View Article : Google Scholar : PubMed/NCBI
|
|
12
|
Wu M, Chen G and Li YP: TGF-β and BMP
signaling in osteoblast, skeletal development, and bone formation,
homeostasis and disease. Bone Res. 4:160092016. View Article : Google Scholar : PubMed/NCBI
|
|
13
|
Sun X, Xie Z, Ma Y, Pan X, Wang J, Chen Z
and Shi P: TGF-β inhibits osteogenesis by upregulating the
expression of ubiquitin ligase SMURF1 via MAPK-ERK signaling. J
Cell Physiol. 233:596–606. 2018. View Article : Google Scholar : PubMed/NCBI
|
|
14
|
Huang C, Geng J and Jiang S: MicroRNAs in
regulation of osteogenic differentiation of mesenchymal stem cells.
Cell Tissue Res. 368:229–238. 2017. View Article : Google Scholar : PubMed/NCBI
|
|
15
|
Nettelhoff L, Grimm S, Jacobs C, Walter C,
Pabst AM, Goldschmitt J and Wehrbein H: Influence of mechanical
compression on human periodontal ligament fibroblasts and
osteoblasts. Clin Oral Investig. 20:621–629. 2016. View Article : Google Scholar : PubMed/NCBI
|
|
16
|
Lu Z, Wang G, Roohani-Esfahani I, Dunstan
CR and Zreiqat H: Baghdadite ceramics modulate the cross talk
between human adipose stem cells and osteoblasts for bone
regeneration. Tissue Eng Part A. 20:992–1002. 2014. View Article : Google Scholar : PubMed/NCBI
|
|
17
|
Dallas DJ, Genever PG, Patton AJ,
Millichip MI, McKie N and Skerry TM: Localization of ADAM10 and
Notch receptors in bone. Bone. 25:9–15. 1999. View Article : Google Scholar : PubMed/NCBI
|
|
18
|
Hashikata M, Shigeishi H, Okui G, Yamamoto
K, Tobiume K, Seino S, Uetsuki R, Kato H, Ishioka Y, Ono S, et al:
Snail-induced CD44(high) cells in HNSCC with high ABC transporter
capacity exhibit potent resistance to cisplatin and docetaxel. Int
J Clin Exp Pathol. 9:7908–7918. 2016.
|
|
19
|
Gao ZQ, Wang JF, Chen DH, Ma XS, Yang W,
Zhe T and Dang XW: Long non-coding RNA GAS5 antagonizes the
chemoresistance of pancreatic cancer cells through down-regulation
of miR-181c-5p. Biomed Pharmacother. 97:809–817. 2018. View Article : Google Scholar : PubMed/NCBI
|
|
20
|
Livak KJ and Schmittgen TD: Analysis of
relative gene expression data using real-time quantitative PCR and
the 2(−ΔΔC(T)) method. Methods. 25:402–408. 2001. View Article : Google Scholar : PubMed/NCBI
|
|
21
|
Gerstein M and Jansen R: The current
excitement in bioinformatics-analysis of whole-genome expression
data: How does it relate to protein structure and function? Curr
Opin Struct Biol. 10:574–584. 2000. View Article : Google Scholar : PubMed/NCBI
|
|
22
|
Quackenbush J: Computational analysis of
microarray data. Nat Rev Genet. 2:418–427. 2001. View Article : Google Scholar : PubMed/NCBI
|
|
23
|
Lewis BP, Burge CB and Bartel DP:
Conserved seed pairing, often flanked by adenosines, indicates that
thousands of human genes are microRNA targets. Cell. 120:15–20.
2005. View Article : Google Scholar : PubMed/NCBI
|
|
24
|
Agarwal V, Bell GW, Nam JW and Bartel DP:
Predicting effective microRNA target sites in mammalian mRNAs.
eLife. 4:e050052015. View Article : Google Scholar
|
|
25
|
Regan J and Long F: Notch signaling and
bone remodeling. Curr Osteoporos Rep. 11:126–129. 2013. View Article : Google Scholar : PubMed/NCBI
|
|
26
|
Xiong XC, Zhu Y, Ge R, Liu LF and Yuan W:
Effect of melatonin on the extracellular-regulated kinase signal
pathway activation and human osteoblastic cell line hFOB 1.19
proliferation. Int J Mol Sci. 16:10337–10353. 2015. View Article : Google Scholar : PubMed/NCBI
|
|
27
|
Gomathi K, Akshaya N, Srinaath N, Moorthi
A and Selvamurugan N: Regulation of Runx2 by post-translational
modifications in osteoblast differentiation. Life Sci.
245:1173892020. View Article : Google Scholar : PubMed/NCBI
|
|
28
|
Zhao Y and Srivastava D: A developmental
view of microRNA function. Trends Biochem Sci. 32:189–197. 2007.
View Article : Google Scholar : PubMed/NCBI
|
|
29
|
Le MT, Xie H, Zhou B, Chia PH, Rizk P, Um
M, Udolph G, Yang H, Lim B and Lodish HF: MicroRNA-125b promotes
neuronal differentiation in human cells by repressing multiple
targets. Mol Cell Biol. 29:5290–5305. 2009. View Article : Google Scholar : PubMed/NCBI
|
|
30
|
Körner C, Keklikoglou I, Bender C, Wörner
A, Münstermann E and Wiemann S: MicroRNA-31 sensitizes human breast
cells to apoptosis by direct targeting of protein kinase C epsilon
(PKCepsilon). J Biol Chem. 288:8750–8761. 2013. View Article : Google Scholar : PubMed/NCBI
|
|
31
|
Narayanan A, Srinaath N, Rohini M and
Selvamurugan N: Regulation of Runx2 by MicroRNAs in osteoblast
differentiation. Life Sci. 232:1166762019. View Article : Google Scholar : PubMed/NCBI
|
|
32
|
Vishal M, Vimalraj S, Ajeetha R, Gokulnath
M, Keerthana R, He Z, Partridge NC and Selvamurugan N:
MicroRNA-590-5p stabilizes Runx2 by targeting Smad7 during
osteoblast differentiation. J Cell Physiol. 232:371–380. 2017.
View Article : Google Scholar : PubMed/NCBI
|
|
33
|
Peng W, Deng W, Zhang J, Pei G, Rong Q and
Zhu S: Long noncoding RNA ANCR suppresses bone formation of
periodontal ligament stem cells via sponging miRNA-758. Biochem
Biophys Res Commun. 503:815–821. 2018. View Article : Google Scholar : PubMed/NCBI
|
|
34
|
Tu X, Chen J, Lim J, Karner CM, Lee SY,
Heisig J, Wiese C, Surendran K, Kopan R, Gessler M, et al:
Physiological notch signaling maintains bone homeostasis via RBPjk
and Hey upstream of NFATc1. PLoS Genet. 8:e10025772012. View Article : Google Scholar : PubMed/NCBI
|
|
35
|
Yu W, Jiang D, Yu S, Fu J, Li Z, Wu Y and
Wang Y: SALL4 promotes osteoblast differentiation by deactivating
NOTCH2 signaling. Biomed Pharmacother. 98:9–17. 2018. View Article : Google Scholar : PubMed/NCBI
|
|
36
|
Wang H, Jiang Z, Zhang J, Xie Z, Wang Y
and Yang G: Enhanced osteogenic differentiation of rat bone marrow
mesenchymal stem cells on titanium substrates by inhibiting Notch3.
Arch Oral Biol. 80:34–40. 2017. View Article : Google Scholar : PubMed/NCBI
|
|
37
|
Zhang H, Ahmad M and Gronowicz G: Effects
of transforming growth factor-beta 1 (TGF-beta1) on in vitro
mineralization of human osteoblasts on implant materials.
Biomaterials. 24:2013–2020. 2003. View Article : Google Scholar : PubMed/NCBI
|
|
38
|
Alliston T, Choy L, Ducy P, Karsenty G and
Derynck R: TGF-beta-induced repression of CBFA1 by Smad3 decreases
cbfa1 and osteocalcin expression and inhibits osteoblast
differentiation. EMBO J. 20:2254–2272. 2001. View Article : Google Scholar : PubMed/NCBI
|
|
39
|
Kaji H, Naito J, Sowa H, Sugimoto T and
Chihara K: Smad3 differently affects osteoblast differentiation
depending upon its differentiation stage. Horm Metab Res.
38:740–745. 2006. View Article : Google Scholar : PubMed/NCBI
|