Introduction
Stroke, of which ~85% are ischemic, is a common
cerebrovascular disease that poses a major challenge to human
health worldwide (1,2). It is estimated that 16.9 million
individuals suffer a stroke every year, and ~6 million of these
culminate in death, whereas three out of four survivors suffer from
permanent disabilities, including motor and cognitive impairments
(1,2). The occurrence of these unfavorable
outcomes may be attributed to the delay in the diagnosis, and the
lack of effective treatments available. Thus, in addition to
conventional clinical examinations, imaging evaluation and
endovascular therapy (3,4), there is an urgent need to explore
novel targets for the diagnosis and treatment of acute ischemic
stroke (AIS).
Long non-coding RNAs (lncRNAs), are non-coding RNAs
of >200 nucleotides in length that serve important roles in
various diseases, such as coronary artery disease, diabetes and
cancer (5), and thus, they may
represent potential biomarkers for the diagnosis and treatment of
AIS. This hypothesis has been validated by numerous previous
studies; for example, Zhu et al (6) identified that the expression levels
of the lncRNA, myocardial infarction-associated transcript (MIAT),
were significantly upregulated in blood samples compared with
control samples, in addition to demonstrating that MIAT may serve
as a potential diagnostic and prognostic indicator for patients
with AIS [area under the curve (AUC), 0.842; sensitivity, 74.1%;
specificity, 80.4%] and prognostic (AUC, 0.791; sensitivity, 79.2%;
specificity, 72.9%). Feng et al (7) reported that plasma expression levels
of the lncRNA, antisense non-coding RNA in the INK4 locus (ANRIL),
were lower in patients with AIS compared with control samples, with
a prediction value for AIS risk of 0.759, and that ANRIL expression
also negatively correlated with the National Institutes of Health
Stroke Scale (NIHSS) score. In addition, using a lncRNA microarray,
Deng et al (8) screened a
three-lncRNA signature [long intergenic non-coding RNA
(linc)-DHFRL1-4, small nucleolar RNA host gene 15, and family with
sequence similarity 98, member A)], and discovered that this
lncRNA-based combination index distinguished patients with AIS from
healthy controls, with an AUC >0.84. However, circulating
AIS-related lncRNAs still require further investigation.
Accumulating evidence indicates that lncRNAs may be
involved in the development of diseases by acting as competing
endogenous RNAs (ceRNAs) for microRNA (miRNAs), which are
non-coding RNAs of ~20 nucleotides in length that negatively
regulate target gene expression at the post-transcriptional level
(9). Thus, investigating the
lncRNA-related ceRNA axis may provide novel biomarker candidates
for AIS; for example, the recent discoveries of ENST00000568297,
ENST00000568243, NR_046084, CCAAT/enhancer binding protein, a
antisense (AS) RNA 1, lincRNA 884, and matrilin-1-AS RNA 1
(10,11). However, the interacting miRNAs and
protein-coding mRNAs in these two studies are not differentially
expressed. Therefore, an additional differentially expressed
lncRNAs (DELs)/miRNAs (DEMs)/genes (DEGs) network should be
constructed to identify potential AIS-associated ceRNA axes. In the
present study, mRNA, lncRNA and miRNA expression profiles from AIS
samples and healthy samples were collected from the Gene Expression
Omnibus (GEO) repository, and were used to establish lncRNA-related
ceRNA networks in AIS. The interactions amongst lncRNAs, miRNAs,
and genes may provide a novel and valuable insight into
understanding the pathogenesis of AIS, and may present novel
biomarkers, or targets, for the diagnosis and treatment of AIS.
Materials and methods
Data collection
Five high-throughput datasets, including 4 miRNA
(GSE110993, GSE95204, GSE86291 and GSE55937) and 1 mRNA (GSE16561)
expression profile, of AIS were obtained from the GEO database
(http://www.ncbi.nlm.nih.gov/geo). Twenty
patients with AIS and 20 matched healthy controls were collected
from the GSE110993 dataset, and the circulating miRNAs were
examined by high-throughput sequencing using Illumina HiScanSQ
(Illumina, Inc.; platform, GPL15456) (12). Three patients with AIS and three
matched healthy controls were obtained from the GEO database
dataset, GSE95204, to detect plasma miRNA expression profiles using
the Exiqon miRCURY LNA™ microRNA array system (miRBase; condensed
Probe_ID version; version 18; Exiqon, Qiagen). Plasma samples from
seven patients with AIS and four matched healthy controls were
obtained from the GSE86291 dataset to screen for miRNA biomarkers
using the Agilent-046064 Unrestricted_Human_miRNA_V19.0_Microarray
(accession no. GPL18402) (13).
Using the GSE55937 dataset, miRNA expression was determined in the
peripheral blood of 24 patients with AIS and 24 controls using the
Affymetrix Multispecies miRNA-3 Array (Affymetrix; Thermo Fisher
Scientific, Inc.; accession no. GPL16384) (14). Using the GSE16561 dataset, mRNA and
lncRNA expression profiles were analyzed in the peripheral whole
blood of 39 patients with AIS and 24 matched healthy controls using
the Illumina HumanRef-8 version 3.0 expression beadchip (Illumina,
Inc.; platform, GPL6883).
Dataset preprocessing and differential
expression analysis
The raw data were downloaded from the GEO database.
For the microarray datasets, the data were quantile-normalized, and
the DEGs, DELs and DEMs were identified using the linear models for
microarray data (limma) software package (version 3.34.0;
http://www.bioconductor.org/packages/release/bioc/html/limma.html)
(15) in R Bioconductor (version
3.4.1; http://www.R-project.org). To sequence
the dataset, fastp software (version 1.0; http://github.com/OpenGene/fastp) was used to perform
the adapter trimming and quality control (16), and the DEMs were subsequently
screened using DESeq2 (version 1.16.1; http://bioconductor.org/packages/3.5/bioc/html/DESeq2.html)
(17). P<0.05 was defined as
the statistical threshold for DEMs to obtain overlap among
different datasets. P<0.05 and log2fold change (FC)
>0.33 were defined as the statistical cut-off values for DEGs
and DELs. A Venn diagram was created to determine DEMs shared
between any two datasets using Draw Venn Diagram online tool
(version 1.0; http://bioinformatics.psb.ugent.be/webtools/Venn).
Hierarchical clustering was performed using the pheatmap package
(version 1.0.8; http://cran.r-project.org/web/packages/pheatmap)
to determine the intersection between differentially expressed RNAs
in different samples.
Functional enrichment analysis
The clusterProfiler tool (version 3.2.11; http://www.bioconductor.org/packages/release/bioc/html/clusterProfiler.html)
was used to analyze the potential functions of DEGs, including Gene
Ontology (GO) and Kyoto Encyclopedia of Genes and Genomes (KEGG)
pathways. Adjusted P<0.05 was set as the criterion.
Protein-protein interaction (PPI)
network
PPI data of DEGs were collected from the Search Tool
for the Retrieval of Interacting Genes (STRING) database (version
10.0; http://string-db.org) (18). Interactions with a combined score
of >700 were used to construct the PPI network. Several
topological features of the nodes (proteins) in the PPI network
were calculated using the CytoNCA plugin (version 2.1.6; http://apps.cytoscape.org/apps/cytonca)
(19) in Cytoscape software
(version 3.0; http://cytoscape.org), to identify
hub genes, including degree, betweenness and closeness centrality.
The Molecular Complex Detection (MCODE; version 1.4.2; http://apps.cytoscape.org/apps/mcode)
plugin of the Cytoscape software was used to extract highly
interconnected sub-networks, with a MCODE score of >6 and number
of nodes >6 set as the threshold values (20).
Determining the overall ceRNA
regulatory network
The miRcode (version 1.0; http://www.mircode.org) (21), starBase (version 2.0; http://starbase.sysu.edu.cn/starbase2)
(22), DIANA-LncBase (version 2.0;
http://carolina.imis.athena-innovation.gr/diana_tools/web/index.php?r=lncbasev2/index-predicted)
(23), and miRwalk (version 2.0;
zmf.umm.uni-heidelberg.de/apps/zmf/mirwalk2) (24) databases were used to predict the
miRNAs interacting with DELs, which were subsequently intersected
with the DEMs shared between two datasets to obtain DEL/DEM
interaction pairs. The target genes of the crosstalk between the
DEMs and DEGs were predicted using the miRwalk database (24). The DEL/DEM and DEM/DEG interactors
were subsequently linked to construct the ceRNA network using the
Cytoscape software.
Determining potential AIS-relevant
ceRNA networks
The AIS-related KEGG pathways were downloaded from
the Comparative Toxicogenomics Database (CTD; version 1.0;
http://ctdbase.org) and were subsequently overlapped
with the pathways enriched by the DEGs in the overall ceRNA
network. The ceRNA network, including the pathway-related DEGs, was
extracted individually to define a potential AIS-related ceRNA
network. Known lncRNAs were collected from the LncRNADisease
database (version 2.0; http://www.cuilab.cn/lncrnadisease) to determine
whether the DELs identified in the AIS-related ceRNA network were
novel.
Results
DEGs and DELs analyses
Based on the microarray data analysis between
patients with AIS and healthy controls using the limma method,
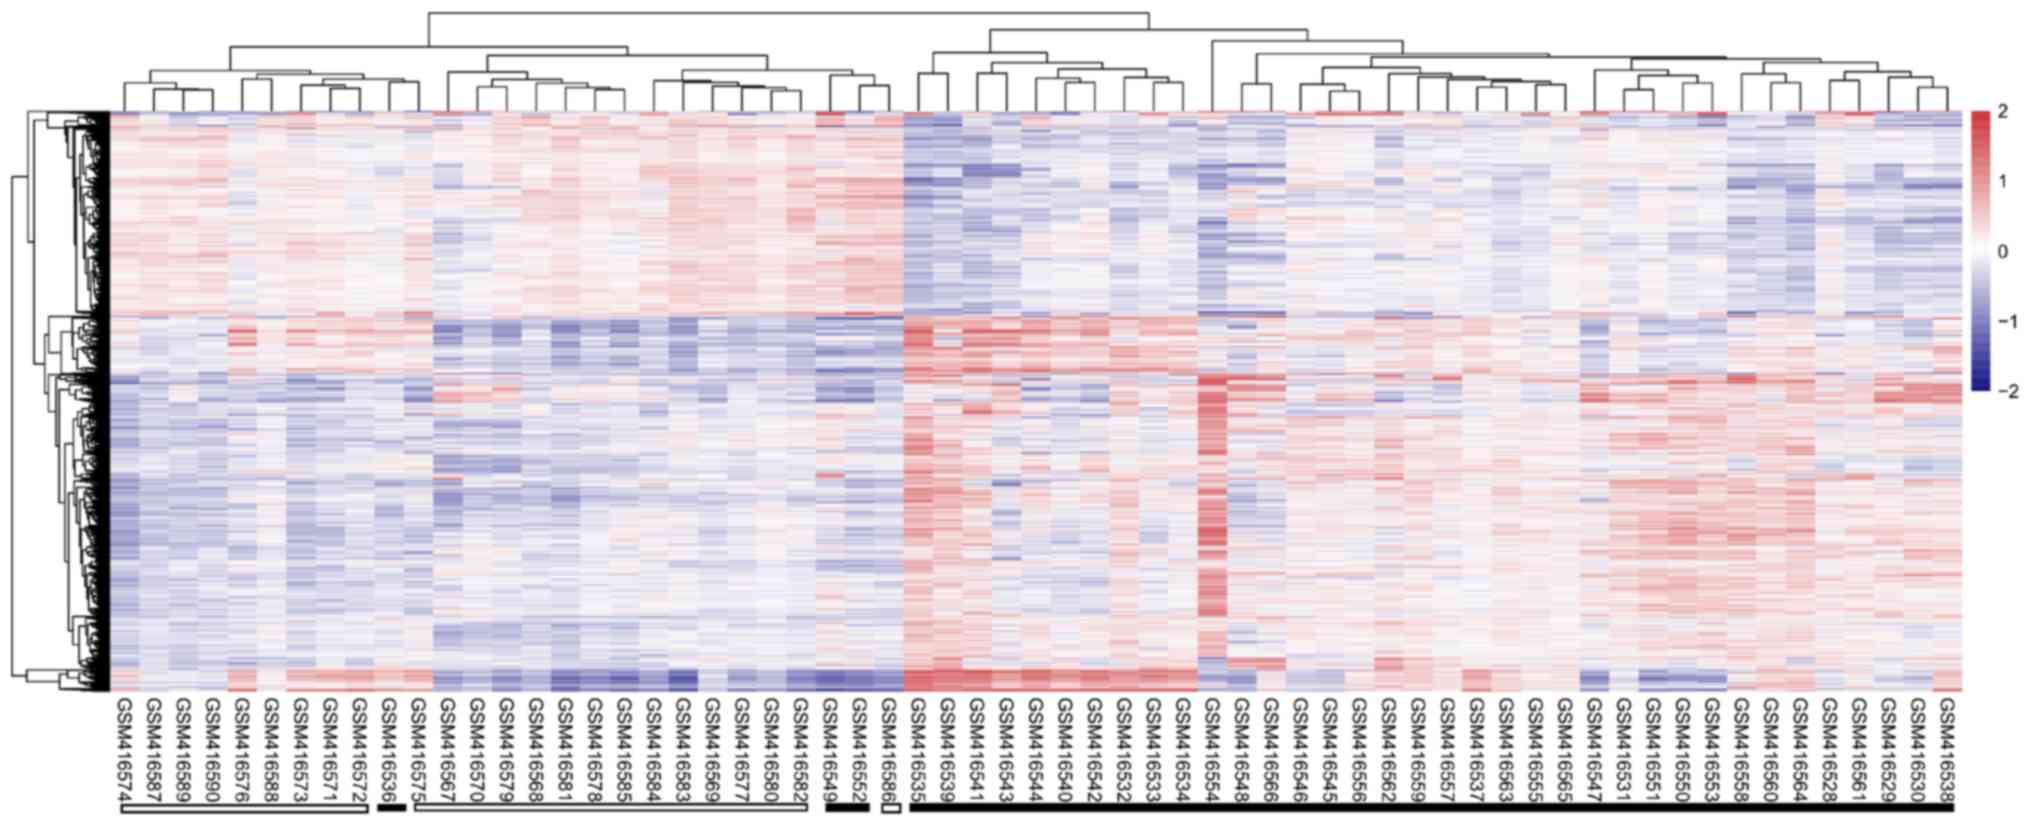
2,041 DEGs were screened from the GSE16561 dataset. A total of
1,337 DEGs were found to be upregulated, such as paxillin (PXN),
ras homolog family member A (RHOA), STAT1, and growth factor
receptor bound protein 2 (GRB2), and 704 downregulated, including
FYN proto-oncogene, Src family tyrosine kinase (FYN) (Table I). In addition, two upregulated
DELs [human leukocyte antigen complex group 27 (HCG27), and
inositol-tetrakisphosphate 1-kinase AS RNA 1 (ITPK1-AS1)] and three
downregulated DELs [minichromosome maintenance complex component 3
associated protein-antisense RNA 1 (MCM3AP-AS1), leucine rich
repeat containing 37 member A4 (LRRC37A4P), and lincRNA 1089
(LINC01089)] were identified (Table
I). The heatmap revealed that the differentially expressed RNAs
identified from this dataset could distinguish the AIS samples from
the healthy controls (Fig. 1).
 | Table I.Differentially expressed RNAs
identified in patients with acute ischemic stroke from datasets in
the Gene Omnibus database repository. |
Table I.
Differentially expressed RNAs
identified in patients with acute ischemic stroke from datasets in
the Gene Omnibus database repository.
|
|
Dataset
accession number |
|---|
|
|
|
|---|
|
| GSE110993 | GSE95204 | GSE86291 | GSE55937 | GSE16561 |
|---|
|
|
|
|
|
|
|
|---|
| RNA type |
Log2FC | P-value |
Log2FC | P-value |
Log2FC | P-value |
Log2FC | P-value |
Log2FC | P-value |
|---|
| MicroRNA |
|
|
|
|
|
|
|
|
|
|
|
hsa-miR-99b | 1.06 |
2.14×10⁻⁶ |
|
|
|
| 0.77 |
1.69×10⁻³ |
|
|
|
hsa-miR-551a |
|
| 0.43 |
3.40×10⁻² |
|
| 0.15 |
2.13×10⁻² |
|
|
|
hsa-miR-1263 |
|
| 1.84 |
3.57×10⁻³ |
|
| 0.42 |
3.95×10⁻² |
|
|
|
hsa-miR-125a | 1.30 |
8.51×10⁻⁸ |
|
|
|
| 0.38 |
4.60×10⁻² |
|
|
|
hsa-miR-1283 | 1.57 |
2.59×10⁻² | 3.38 |
3.94×10⁻³ |
|
|
|
|
|
|
|
hsa-miR-19a | −1.00 |
9.96×10⁻³ |
|
|
|
| −0.54 |
3.55×10⁻² |
|
|
|
hsa-let-7i | −1.05 |
4.97×10⁻⁴ |
|
|
|
| −0.54 |
3.96×10⁻² |
|
|
|
hsa-miR-345-5p | −0.67 |
2.53×10⁻² |
|
| −0.35 |
1.66×10⁻² |
|
|
|
|
|
hsa-miR-5100 |
|
| −0.85 |
3.54×10⁻² | −1.87 |
6.54×10⁻³ |
|
|
|
|
|
hsa-miR-4667-5p |
|
| −1.81 |
3.73×10⁻² | −0.41 |
2.74×10⁻² |
|
|
|
|
| Long non-coding
RNA |
|
|
|
|
|
|
|
|
|
|
|
HCG27 |
|
|
|
|
|
|
|
| 0.52 |
2.41×10⁻⁴ |
|
ITPK1-AS1 |
|
|
|
|
|
|
|
| 0.39 |
3.71×10⁻² |
|
MCM3AP-AS1 |
|
|
|
|
|
|
|
| −0.43 |
6.69×10⁻⁸ |
|
LRRC37A4P |
|
|
|
|
|
|
|
| −0.38 |
1.25×10⁻³ |
|
LINC01089 |
|
|
|
|
|
|
|
| −0.34 |
6.05×10⁻⁵ |
| mRNA |
|
|
|
|
|
|
|
|
|
|
|
PXN |
|
|
|
|
|
|
|
| 0.46 |
3.15×10⁻⁴ |
|
FYN |
|
|
|
|
|
|
|
| −0.53 |
1.19×10⁻⁵ |
|
RHOA |
|
|
|
|
|
|
|
| 0.47 |
2.66×10⁻⁶ |
|
STAT1 |
|
|
|
|
|
|
|
| 0.54 |
1.14×10⁻⁴ |
|
GRB2 |
|
|
|
|
|
|
|
| 0.38 |
6.20×10⁻³ |
DEMs analysis
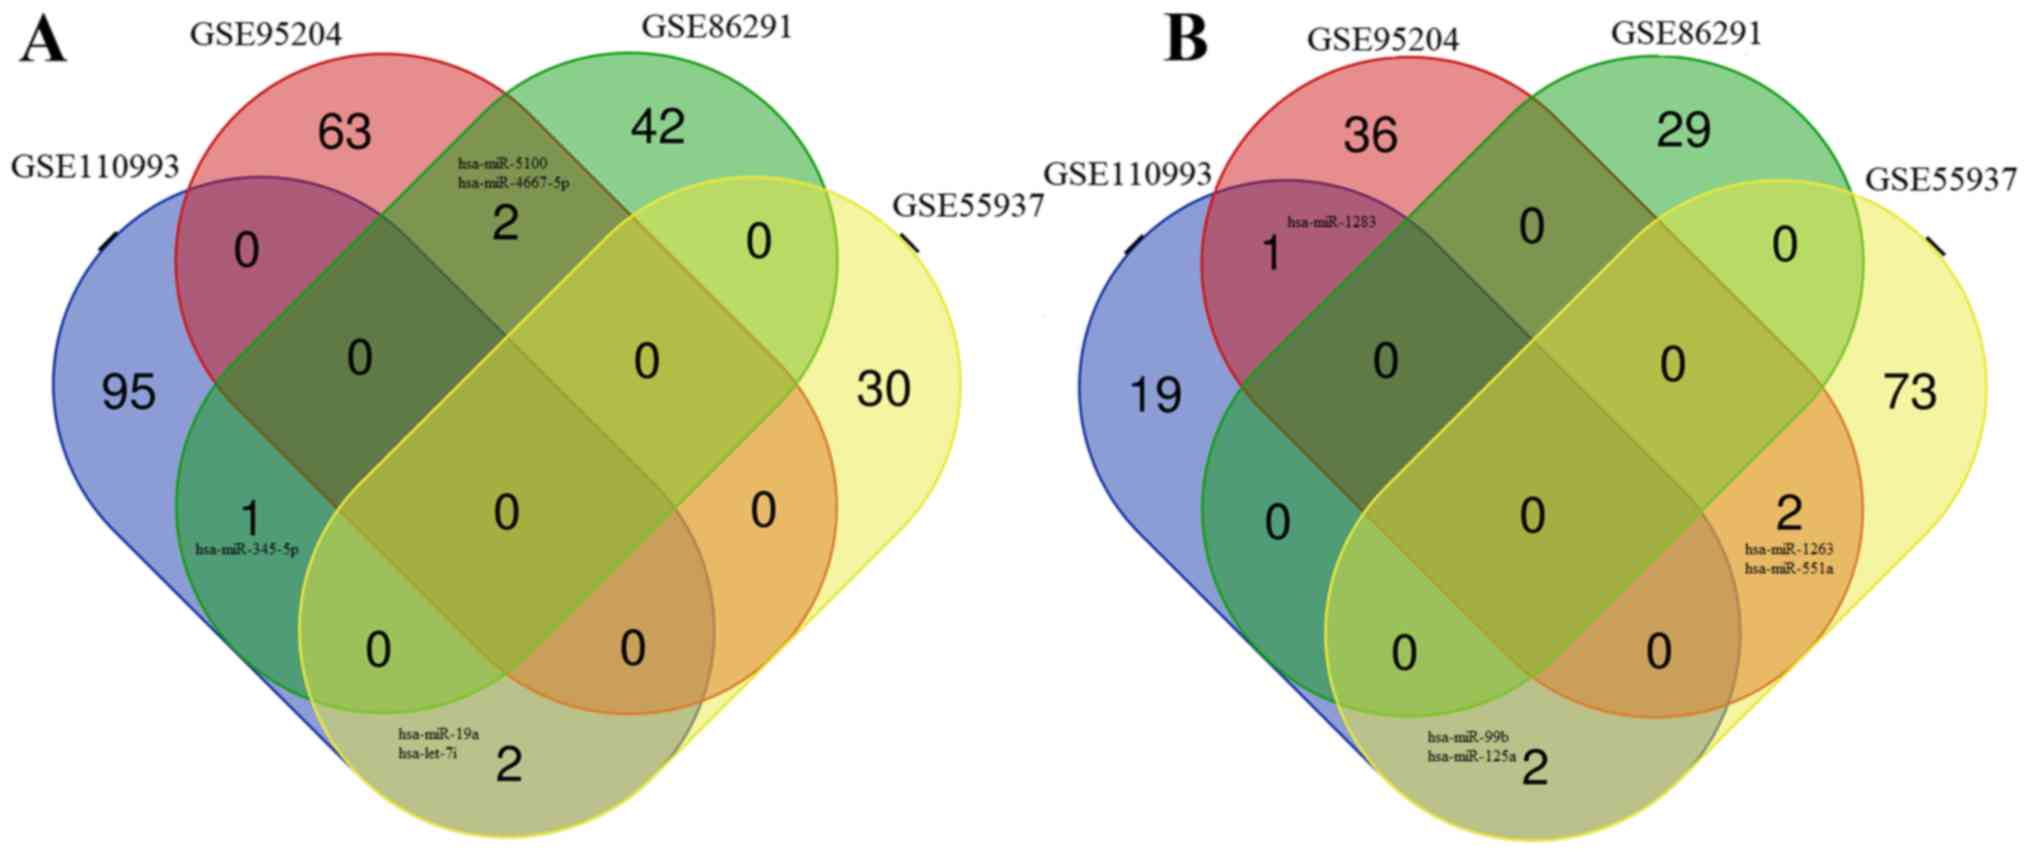
The microarray data analysis between AIS samples and
healthy controls revealed 104 DEMs in the GSE95204 dataset (39
upregulated; 65 downregulated), 74 DEMs in the GSE86291 dataset (29
upregulated; 45 downregulated), and 111 DEMs in the GSE55937
dataset (77 upregulated; 32 downregulated) (Table I). Sequence analysis between AIS
samples and healthy controls using the DESeq2 method identified 120
DEMs in the GSE110993 dataset, 22 that were upregulated, and 98
that were downregulated. Venn diagram analysis demonstrated that 10
DEMs were shared between at least two of the four miRNA expression
profile datasets (Table I),
including: Five downregulated miRNAs; hsa-miRNA (miR)-345-5p,
hsa-miR-19a, hsa-let-7i, hsa-miR-5100 and hsa-miR-4667-5p (Fig. 2A); and five upregulated miRNAs;
hsa-miR-1283, hsa-miR-99b, hsa-miR-125a, hsa-miR-1263 and
hsa-miR-551a (Fig. 2B).
Functional enrichment analysis of the
DEGs
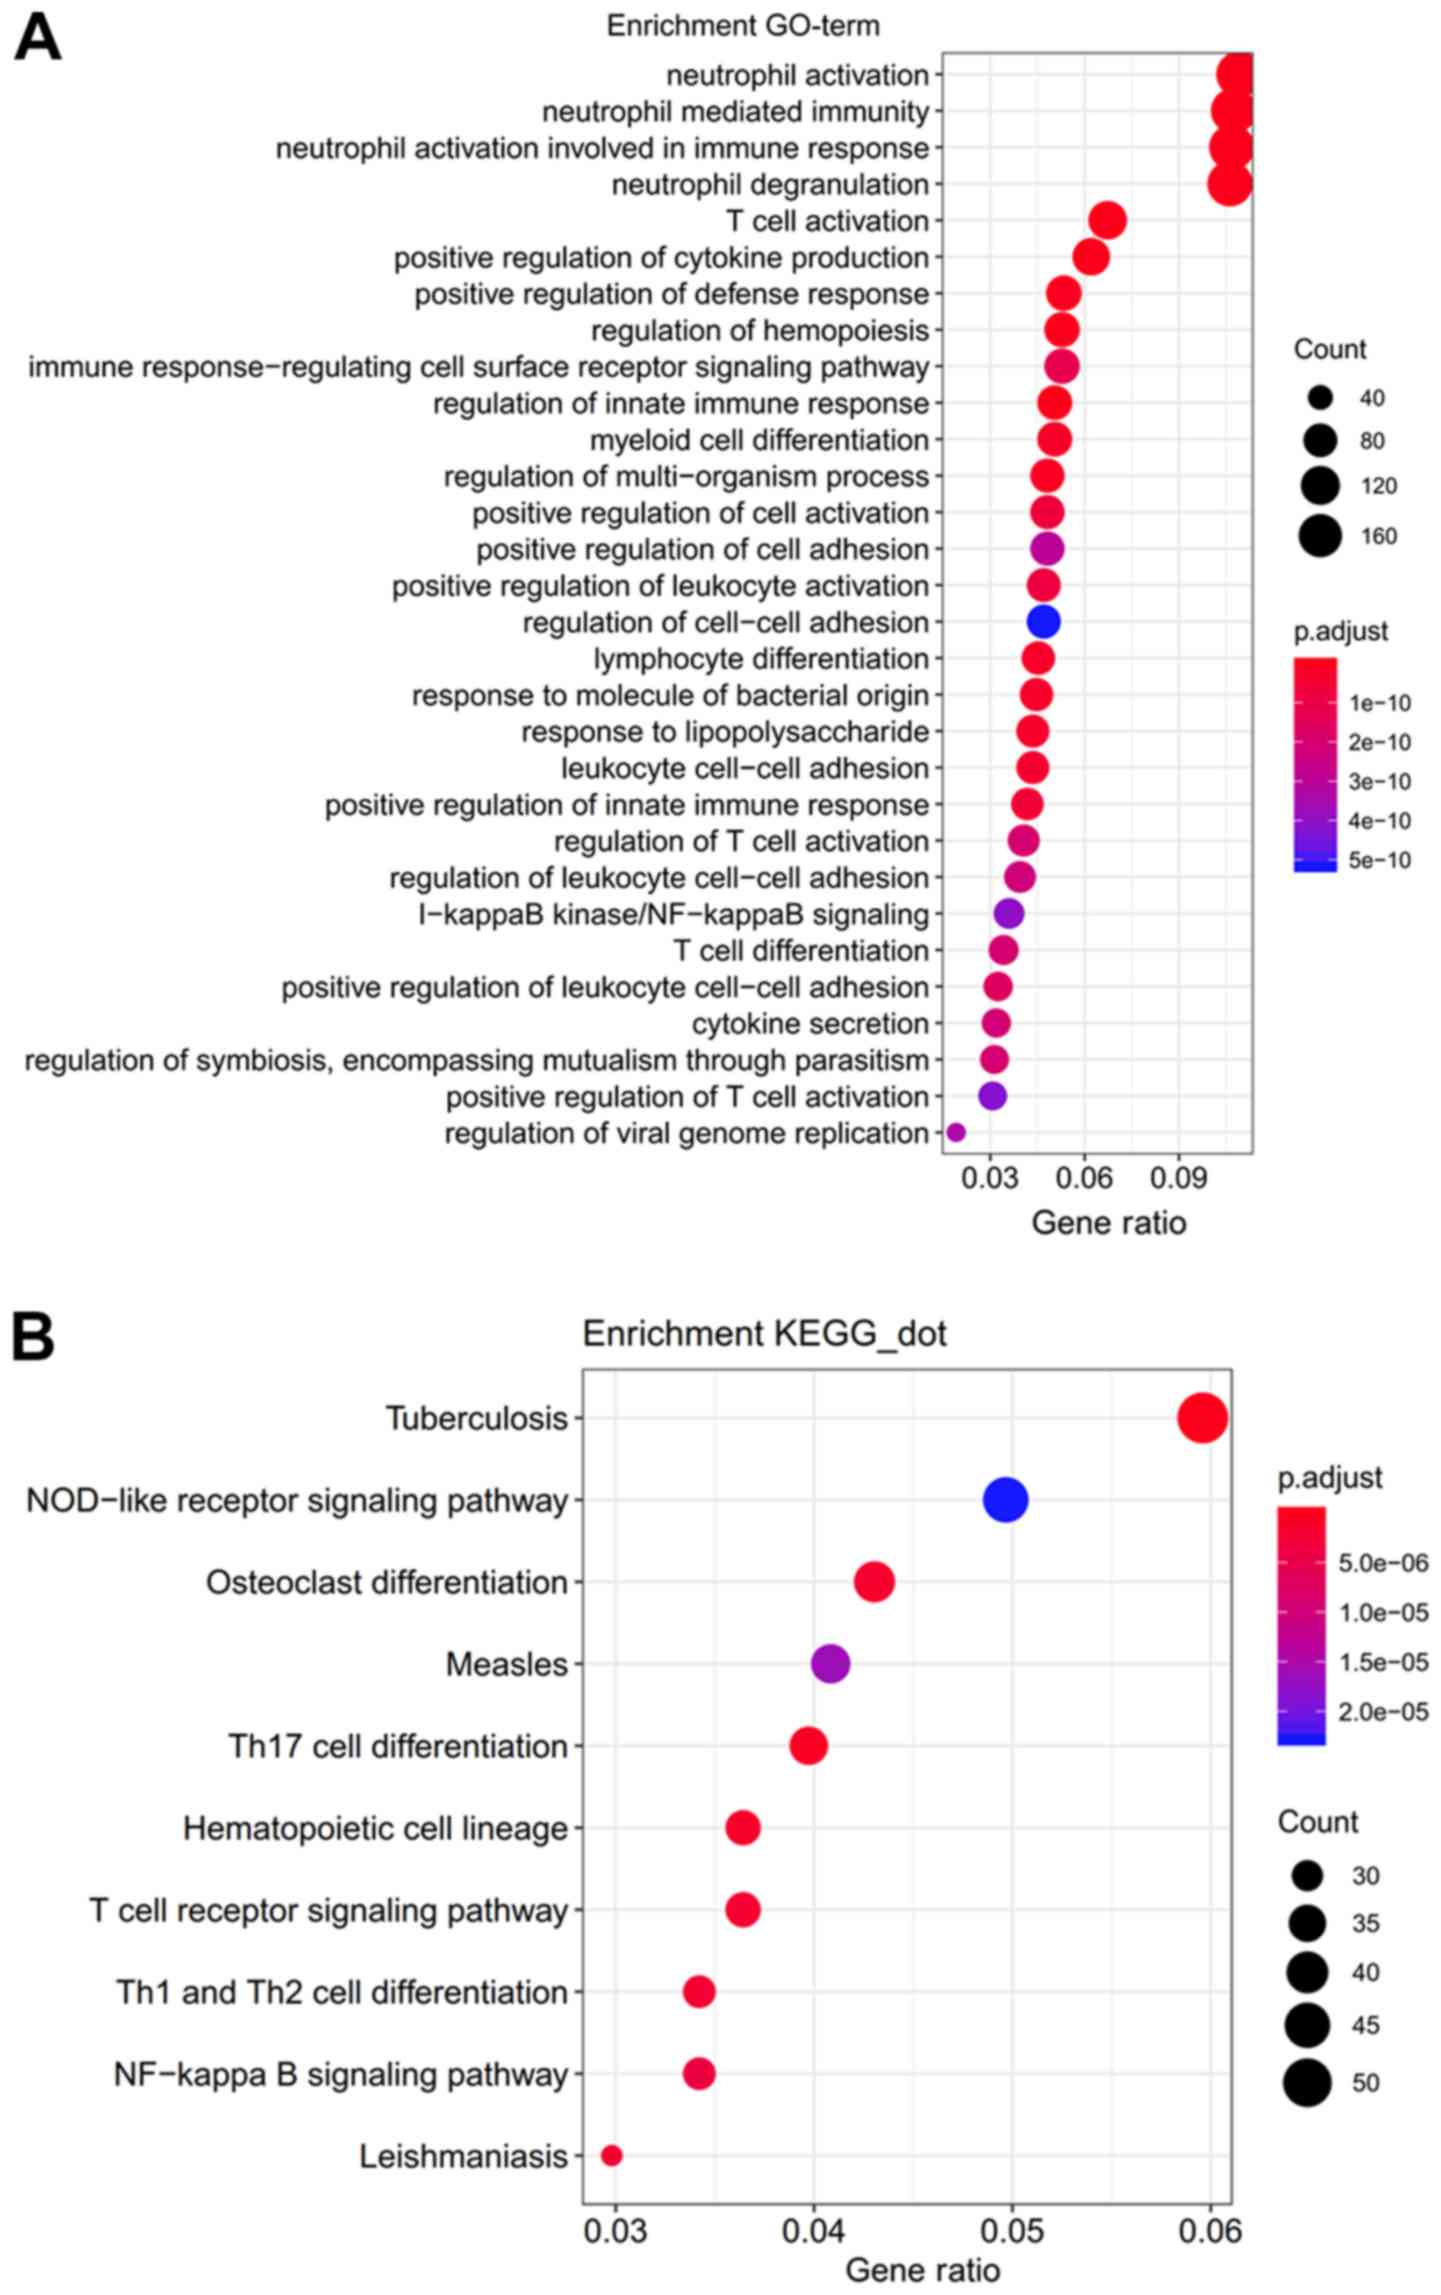
Functional enrichment analysis of all the DEGs
revealed that the DEGs were enriched in 921 GO biological processes
and 56 significant KEGG pathways. Among them, inflammatory-related
functions, such as ‘I-κB kinase/NF-κB signaling’/‘NF-κB signaling
pathway’, ‘T cell differentiation’/‘Th17 cell differentiation’/‘Th1
and Th2 cell differentiation’, ‘T cell activation’/‘T cell receptor
signaling pathway’, were the most significant, and were identified
by both GO and KEGG enrichment analyses (Fig. 3). Thus, this indicated that
inflammatory genes may be crucial for AIS development.
PPI network of DEGs
Using the STRING database, a total of 6,246 PPI
interaction pairs were predicted from the 1,235 DEGs used to
construct the PPI network (data not shown). Twenty genes were
identified as hub genes because they ranked in the top 60 (5% of
all DEGs), according to the ranking results of all three
topological features (Table II).
Furthermore, seven significant modules were extracted from the PPI
network, in which the hub genes, PXN, FYN, RHOA, STAT1 and GRB2
were enriched in module 7 (Fig. 4;
Table III). Functional analysis
revealed that the genes in module 7 may be involved in AIS by
participating in 78 significant KEGG pathways (Table IV), 61 of which included at least
one of these five hub genes; T cell receptor signaling pathway
(GRB2/FYN/RHOA), chemokine signaling pathway (PXN/GRB2/STAT1/RHOA),
focal adhesion (PXN/GRB2/FYN/RHOA) and Th17 cell differentiation
(STAT1). These findings suggested that these five inflammatory
genes may be important for AIS.
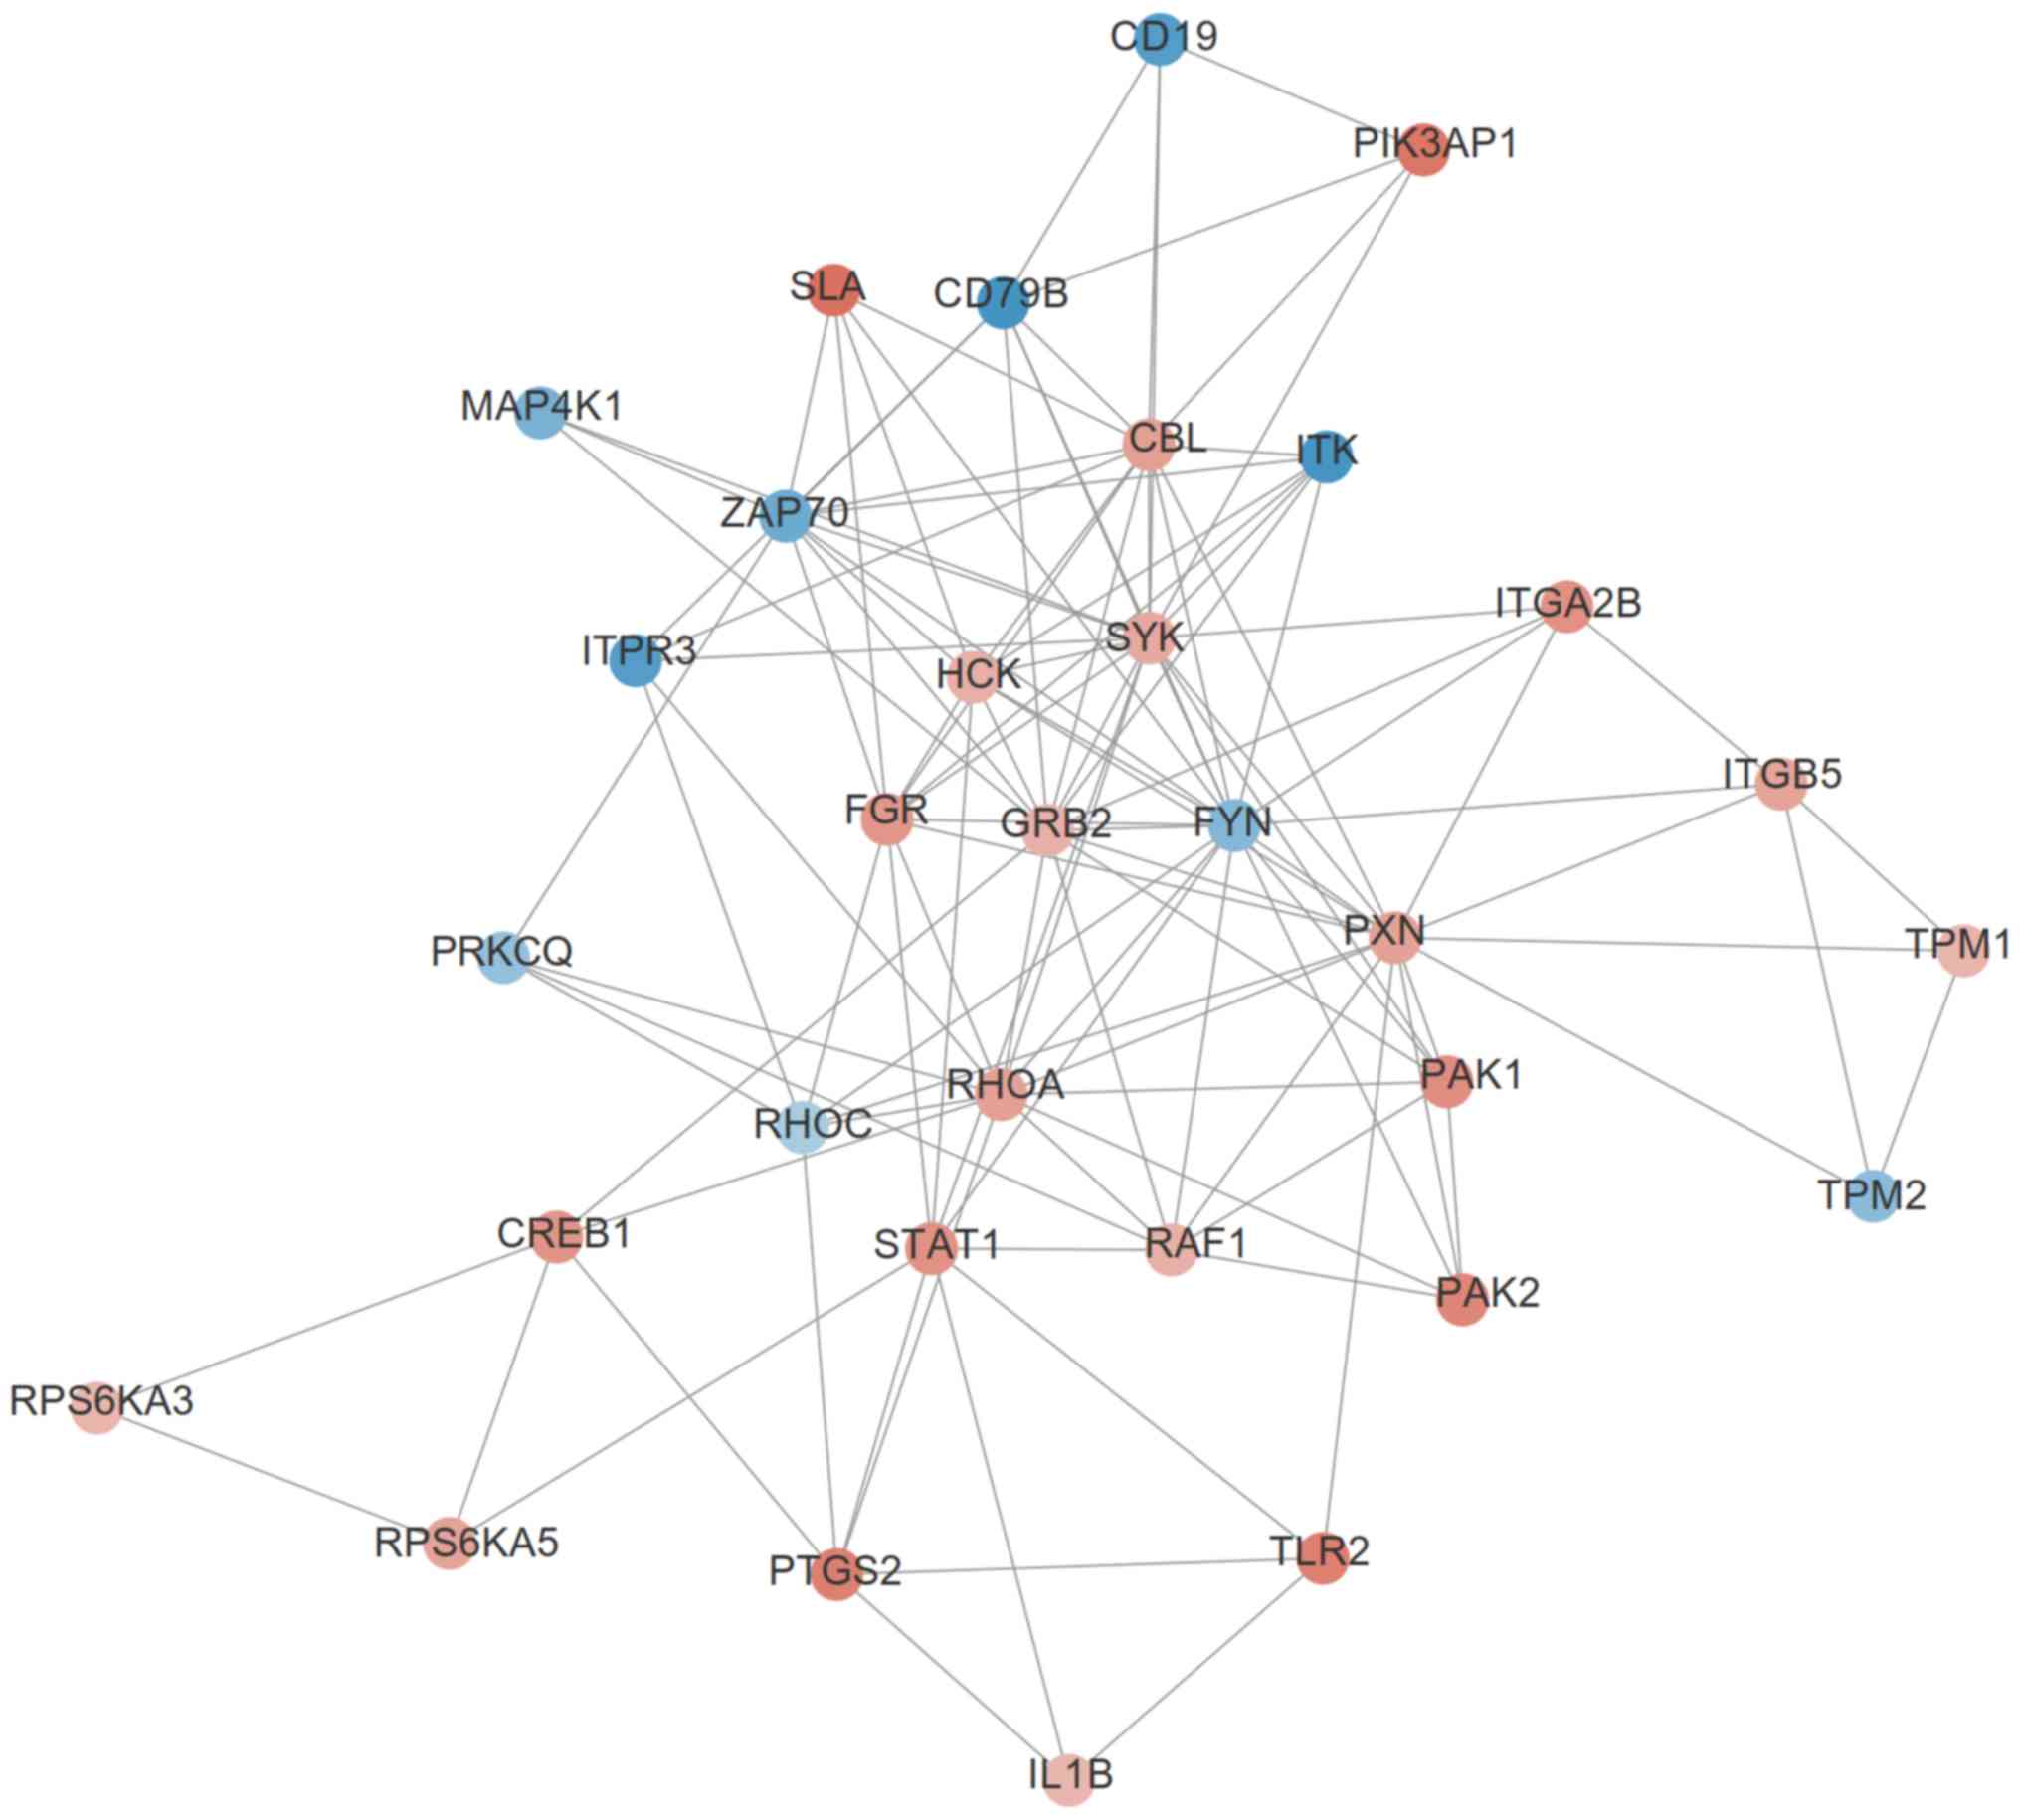 | Figure 4.A significant module that includes
hub genes identified in the protein and protein interaction network
for the differentially expressed genes in acute ischemic stroke.
Blue, downregulated; red, upregulated. PXN, paxillin; RAF1, Raf-1
proto-oncogene serine/threonine kinase; TLR2, toll-like receptor 2;
RPS6KA5, ribosomal protein S6 kinase A5; ITGA2B, integrin subunit α
2b; PRKCQ, protein kinase C θ; IL-1B, interleukin 1β; CBL, Cbl
proto-oncogene; ZAP70, ζ chain of T cell receptor-associated
protein kinase 70; TPM1, tropomyosin 1; PAK1, p21 (RAC1) activated
kinase 1; RHOC, ras homolog family member C; ITGB5, integrin
subunit β5; PAK2, p21 (RAC1) activated kinase 2; GRB2, growth
factor receptor bound protein 2; PIK3AP1, phosphoinositide-3-kinase
adaptor protein 1; FYN, FYN Proto-oncogene tyrosine-protein kinase;
TPM2, tropomyosin 2; STAT1, signal transducer and activator of
transcription 1; PTGS2, prostaglandin-endoperoxide synthase 2; FGR,
FGR proto-oncogene Src family tyrosine kinase; ITPR3, inositol
1,4,5-trisphosphate receptor type 3; SYK, spleen-associated
tyrosine kinase; HCK, HCK proto-oncogene Src family tyrosine
kinase; RPS6KA3, ribosomal protein S6 kinase A3; CD79B, CD79b
molecule; MAP4K1, mitogen-activated protein kinase kinase kinase
kinase 1; CREB1, cAMP responsive element binding protein 1; SLA,
Src-like adaptor; ITK, IL2 inducible T cell kinase; RHOA, Ras
homolog family member A. |
| Table II.Centralities analysis of the top 20
hub genes identified in the protein-protein interaction network
from differentially expressed genes in acute ischemic stress. |
Table II.
Centralities analysis of the top 20
hub genes identified in the protein-protein interaction network
from differentially expressed genes in acute ischemic stress.
| Gene | Degree
centrality | Gene | Betweenness
centrality | Gene | Closeness
centrality |
|---|
| STAT3 | 96 | HDAC1 | 0.066077 | STAT3 | 0.39361 |
| RHOA | 89 | BCL2 | 0.065222 | MAPK14 | 0.384987 |
| FYN | 85 | STAT3 | 0.062793 | BCL2 | 0.383381 |
| MAPK14 | 80 | RHOA | 0.056532 | CREBBP | 0.38289 |
| CREBBP | 79 | ACTB | 0.050714 | FOS | 0.381667 |
| BCL2 | 72 | CREBBP | 0.049029 | RHOA | 0.380331 |
| CDC42 | 71 | CDC42 | 0.047746 | MAPK1 | 0.377329 |
| HDAC1 | 71 | MAPK14 | 0.041837 | STAT1 | 0.376734 |
| STAT1 | 71 | FYN | 0.040107 | MAPK3 | 0.375196 |
| MAPK1 | 71 | STAT1 | 0.036472 | FYN | 0.369855 |
| FOS | 71 | NOTCH1 | 0.035509 | NOTCH1 | 0.36724 |
| MAPK3 | 66 | FOS | 0.034142 | ACTB | 0.366564 |
| GRB2 | 61 | HIF1A | 0.033411 | HDAC1 | 0.363443 |
| ACTB | 58 | GRB2 | 0.030588 | PTEN | 0.363332 |
| NOTCH1 | 53 | MAPK1 | 0.029564 | CDC42 | 0.362891 |
| TLR4 | 49 | GSK3B | 0.023502 | GSK3B | 0.362891 |
| PXN | 49 | PTEN | 0.023476 | PXN | 0.362121 |
| GSK3B | 47 | MAPK3 | 0.020408 | TLR4 | 0.360265 |
| HIF1A | 47 | TLR4 | 0.019773 | GRB2 | 0.360048 |
| PTEN | 47 | PXN | 0.013521 | HIF1A | 0.35929 |
| Table III.Significant modules extracted from
the protein-protein interaction network of differentially expressed
genes in acute ischemic stress. |
Table III.
Significant modules extracted from
the protein-protein interaction network of differentially expressed
genes in acute ischemic stress.
| Module | Molecular complex
detection score | Number of
nodes | Number of
edges | Genes |
|---|
| 1 | 31.632 | 39 | 601 | RPS5, EIF3D, SSR1,
RPL36, EIF3G, EIF4B, RPL8, CASC3, SRP14, SSR2, RPS23, RNPS1, RPS9,
RPL13, MRPS12, MRPL11, EIF3F, RPL4, RPS15A, IMP3, RPLP0, RPS2,
RPL3, RPL9, RPSA, RPL22, UPF2, ETF1, MRPL24, RPL12, EIF3A, RPS4X,
RPL10A, UPF3A, RPL13A, SRPRB, RPS3, RPL17, RPS15 |
| 2 | 26.000 | 26 | 325 | HEBP1, CCR7, ANXA1,
APP, CXCR5, CCL5, CXCL16, CXCR1, PPBP, CCR1, PNOC, C3AR1, FPR1,
S1PR1, CXCR2, P2RY13, LPAR5, S1PR5, FPR2, GPR18, C5AR1, S1PR3,
RGS18, GNAI3, LPAR2, ADRA2C |
| 3 | 12.308 | 14 | 80 | OASL, IFI27, STAT2,
EEF1G, MX2, RNASEL, ADAR, GBP2, IFIT1, IFIT3, IFIT2, MX1, IFITM3,
OAS1 |
| 4 | 10.000 | 10 | 45 | NDUFB7, NDUFB3,
NDUFB2, NDUFB11, NDUFB8, NDUFS8, NDUFV1, NDUFA12, NDUFS5,
NDUFA11 |
| 5 | 8.286 | 36 | 145 | P2RY10, RGS2,
TBL1X, MED10, CDK4, VWF, SMARCD3, F13A1, GPR65, SERPING1, MED13L,
CD8A, PROK2, F2RL1, CD3D, PTAFR, CEBPB, LTB4R, CD36, VEGFB, NCOA1,
CD8B, SERPINA1, HLA-DRB1, CD3E, CD247, F5, CDK19, NCOA3, KLF4,
PROS1, ACTN1, CEBPD, HELZ2, CEBPA, CD3G |
| 6 | 8.000 | 8 | 28 | STAG2, B9D2, TAOK1,
RAD21, CLIP1, NDEL1, AHCTF1, MIS12 |
| 7 | 7.677 | 32 | 119 | PXN, RAF1, TLR2,
RPS6KA5, ITGA2B, PRKCQ, IL1B, CBL, ZAP70, TPM1, PAK1, RHOC, ITGB5,
PAK2, GRB2, PIK3AP1, FYN, TPM2, STAT1, PTGS2, FGR, ITPR3, SYK, HCK,
RPS6KA3, CD79B, MAP4K1, CREB1, SLA, ITK, RHOA, CD19 |
| Table IV.KEGG pathway enrichment analysis for
module 7 identified from the protein-protein interaction networks
of differentially expressed genes in acute ischemic stroke. |
Table IV.
KEGG pathway enrichment analysis for
module 7 identified from the protein-protein interaction networks
of differentially expressed genes in acute ischemic stroke.
| KEGG ID | Description | P-value
adjusted | Gene |
|---|
| hsa04660 | T cell receptor
signaling pathway |
1.29×10⁻⁸ |
RAF1/PRKCQ/ZAP70/PAK1/PAK2/GRB2/FYN/ITK/RHOA |
| hsa04625 | C-type lectin
receptor signaling pathway |
2.78×10⁻⁷ |
RAF1/IL1B/PAK1/STAT1/PTGS2/ITPR3/SYK/RHOA |
| hsa04062 | Chemokine signaling
pathway |
1.19×10⁻⁶ |
PXN/RAF1/PAK1/GRB2/STAT1/FGR/HCK/ITK/RHOA |
| hsa04510 | Focal adhesion |
1.19×10⁻⁶ |
PXN/RAF1/ITGA2B/PAK1/ITGB5/PAK2/GRB2/FYN/RHOA |
| hsa05205 | Proteoglycans in
cancer |
1.19×10⁻⁶ |
PXN/RAF1/TLR2/CBL/PAK1/ITGB5/GRB2/ITPR3/RHOA |
| hsa04662 | B cell receptor
signaling pathway |
6.14×10⁻⁶ |
RAF1/GRB2/PIK3AP1/SYK/CD79B/CD19 |
| hsa05163 | Human
cytomegalovirus infection |
3.26×10⁻⁵ |
PXN/RAF1/IL1B/GRB2/PTGS2/ITPR3/CREB1/RHOA |
| hsa05152 | Tuberculosis |
7.77×10⁻⁵ |
RAF1/TLR2/IL1B/STAT1/SYK/CREB1/RHOA |
| hsa04151 | PI3K-AKT signaling
pathway |
7.98×10⁻⁵ |
RAF1/TLR2/ITGA2B/ITGB5/GRB2/PIK3AP1/SYK/CREB1/CD19 |
| hsa05167 | Kaposi
sarcoma-associated herpes virus infection |
8.02×10⁻⁵ |
RAF1/STAT1/PTGS2/ITPR3/SYK/HCK/CREB1 |
| hsa04380 | Osteoclast
differentiation |
1.09×10⁻⁴ |
IL1B/GRB2/FYN/STAT1/SYK/CREB1 |
| hsa04650 | Natural killer cell
mediated cytotoxicity |
1.14×10⁻⁴ |
RAF1/ZAP70/PAK1/GRB2/FYN/SYK |
| hsa04010 | Mitogen activated
protein kinase signaling pathway |
1.32×10⁻⁴ |
RAF1/RPS6KA5/IL1B/PAK1/PAK2/GRB2/RPS6KA3/MAP4K1 |
| hsa04810 | Regulation of actin
cytoskeleton |
1.44×10⁻⁴ |
PXN/RAF1/ITGA2B/PAK1/ITGB5/PAK2/RHOA |
| hsa04012 | ErbB signaling
pathway |
1.69×10⁻⁴ |
RAF1/CBL/PAK1/PAK2/GRB2 |
| hsa05165 | Human
papillomavirus infection |
2.43×10⁻⁴ |
PXN/RAF1/ITGA2B/ITGB5/GRB2/STAT1/PTGS2/CREB1 |
| hsa04722 | Neurotrophin
signaling pathway |
7.17×10⁻⁴ |
RAF1/RPS6KA5/GRB2/RPS6KA3/RHOA |
| hsa04611 | Platelet
activation |
8.26×10⁻⁴ |
ITGA2B/FYN/ITPR3/SYK/RHOA |
| hsa04664 | Fc ε RI signaling
pathway |
9.55×10⁻⁴ |
RAF1/GRB2/FYN/SYK |
| hsa05170 | Human
immunodeficiency virus 1 infection |
9.55×10⁻⁴ |
PXN/RAF1/TLR2/PAK1/PAK2/ITPR3 |
| hsa05211 | Renal cell
carcinoma |
9.55×10⁻⁴ |
RAF1/PAK1/PAK2/GRB2 |
| hsa05140 | Leishmaniasis |
1.20×10⁻³ |
TLR2/IL1B/STAT1/PTGS2 |
| hsa04014 | Ras signaling
pathway |
1.42×10⁻³ |
RAF1/ZAP70/PAK1/PAK2/GRB2/RHOA |
| hsa04072 | Phospholipase D
signaling pathway |
1.45×10⁻³ |
RAF1/GRB2/FYN/SYK/RHOA |
| hsa05161 | Hepatitis B |
2.10×10⁻³ |
RAF1/TLR2/GRB2/STAT1/CREB1 |
| hsa04360 | Axon guidance |
3.06×10⁻³ |
RAF1/PAK1/PAK2/FYN/RHOA |
| hsa04928 | Parathyroid hormone
synthesis, secretion and action |
3.53×10⁻³ |
RAF1/ITPR3/CREB1/RHOA |
| hsa04659 | Type 17 T helper 7
cell differentiation |
3.54×10⁻³ |
PRKCQ/IL1B/ZAP70/STAT1 |
| hsa05206 | MicroRNAs in
cancer |
3.90×10⁻³ |
RAF1/RPS6KA5/TPM1/GRB2/PTGS2/RHOA |
| hsa05203 | Viral
carcinogenesis |
4.22×10⁻³ |
PXN/GRB2/SYK/CREB1/RHOA |
| hsa04370 | Vascular
endothelial growth factor signaling pathway |
6.55×10⁻³ | PXN/RAF1/PTGS2 |
| hsa04270 | Vascular smooth
muscle contraction |
6.71×10⁻³ |
RAF1/PRKCQ/ITPR3/RHOA |
| hsa04915 | Estrogen signaling
pathway |
7.70×10⁻³ |
RAF1/GRB2/ITPR3/CREB1 |
| hsa05321 | Inflammatory bowel
disease |
8.00×10⁻³ |
TLR2/IL1B/STAT1 |
| hsa04917 | Prolactin signaling
pathway |
9.19×10⁻³ |
RAF1/GRB2/STAT1 |
| hsa04150 | mTOR signaling
pathway |
9.73×10⁻³ |
RAF1/GRB2/RPS6KA3/RHOA |
| hsa04921 | Oxytocin signaling
pathway |
9.73×10⁻³ |
RAF1/PTGS2/ITPR3/RHOA |
| hsa05100 | Bacterial invasion
of epithelial cells |
4.16×10⁻² | PXN/CBL/RHOA |
| hsa05220 | Chronic myeloid
leukemia |
1.06×10⁻² | RAF1/CBL/GRB2 |
| hsa04022 | Cyclic GMP-Protein
kinase G signaling pathway |
1.22×10⁻² |
RAF1/ITPR3/CREB1/RHOA |
| hsa05210 | Colorectal
cancer |
1.44×10⁻² | RAF1/GRB2/RHOA |
| hsa04621 | Nucleotide-binding
oligomerization domain-like receptor signaling pathway |
1.48×10⁻² |
IL1B/STAT1/ITPR3/RHOA |
| hsa04540 | Gap junction |
1.48×10⁻² |
RAF1/GRB2/ITPR3 |
| hsa04658 | Type 1 and 2 T
helper cell differentiation |
1.64×10⁻² |
PRKCQ/ZAP70/STAT1 |
| hsa04912 |
Gonadotropin-releasing hormone signaling
pathway |
1.66×10⁻² |
RAF1/GRB2/ITPR3 |
| hsa05215 | Prostate
cancer |
1.76×10⁻² |
RAF1/GRB2/CREB1 |
| hsa05169 | Epstein-Barr virus
infection |
1.98×10⁻² |
TLR2/STAT1/SYK/CD19 |
| hsa04620 | Toll-like receptor
signaling pathway |
2.03×10⁻² |
TLR2/IL1B/STAT1 |
| hsa05020 | Prion diseases |
2.18×10⁻² | IL1B/FYN |
| hsa04024 | Cyclic AMP
signaling pathway |
2.23×10⁻² |
RAF1/PAK1/CREB1/RHOA |
| hsa04670 | Leukocyte
transendothelial migration |
2.26×10⁻² | PXN/ITK/RHOA |
| hsa04725 | Cholinergic
synapse |
2.26×10⁻² |
FYN/ITPR3/CREB1 |
| hsa04071 | Sphingolipid
signaling pathway |
2.58×10⁻² | RAF1/FYN/RHOA |
| hsa04926 | Relaxin signaling
pathway |
3.18×10⁻² |
RAF1/GRB2/CREB1 |
| hsa04910 | Insulin signaling
pathway |
3.56×10⁻² | RAF1/CBL/GRB2 |
| hsa05162 | Measles |
3.58×10⁻² |
TLR2/IL1B/STAT1 |
| hsa05418 | Fluid shear stress
and atherosclerosis |
3.59×10⁻² |
ITGA2B/IL1B/RHOA |
| hsa05130 | Pathogenic
Escherichia coli infection |
4.16×10⁻² | FYN/RHOA |
| hsa05213 | Endometrial
cancer |
4.53×10⁻² | RAF1/GRB2 |
| hsa05160 | Hepatitis C |
4.54×10⁻² |
RAF1/GRB2/STAT1 |
| hsa04630 | Janus kinase-STAT
signaling pathway |
4.97×10⁻² |
RAF1/GRB2/STAT1 |
Construction and functional analysis
of the ceRNA network
Based on four miRNA databases (miRcode, starBase,
DIANA-LncBase and miRwalk), 9 DEMs (hsa-let-7i, hsa-miR-125a,
hsa-miR-1283, hsa-miR-19a, hsa-miR-345-5p, hsa-miR-4667-5p,
hsa-miR-5100, hsa-miR-551a and hsa-miR-99b), were predicted to
interact with 4 DELs (ITPK1-AS1, LINC01089, MCM3AP-AS1 and HCG27),
which constituted 29 interaction pairs. Subsequently, 7,995
regulatory pairs between 9 DEMs, and 712 DEGs were detected in the
miRwalk database, which was used for constructing the ceRNA network
following integration with the DEM-DEL interacting relationships
(data not shown).
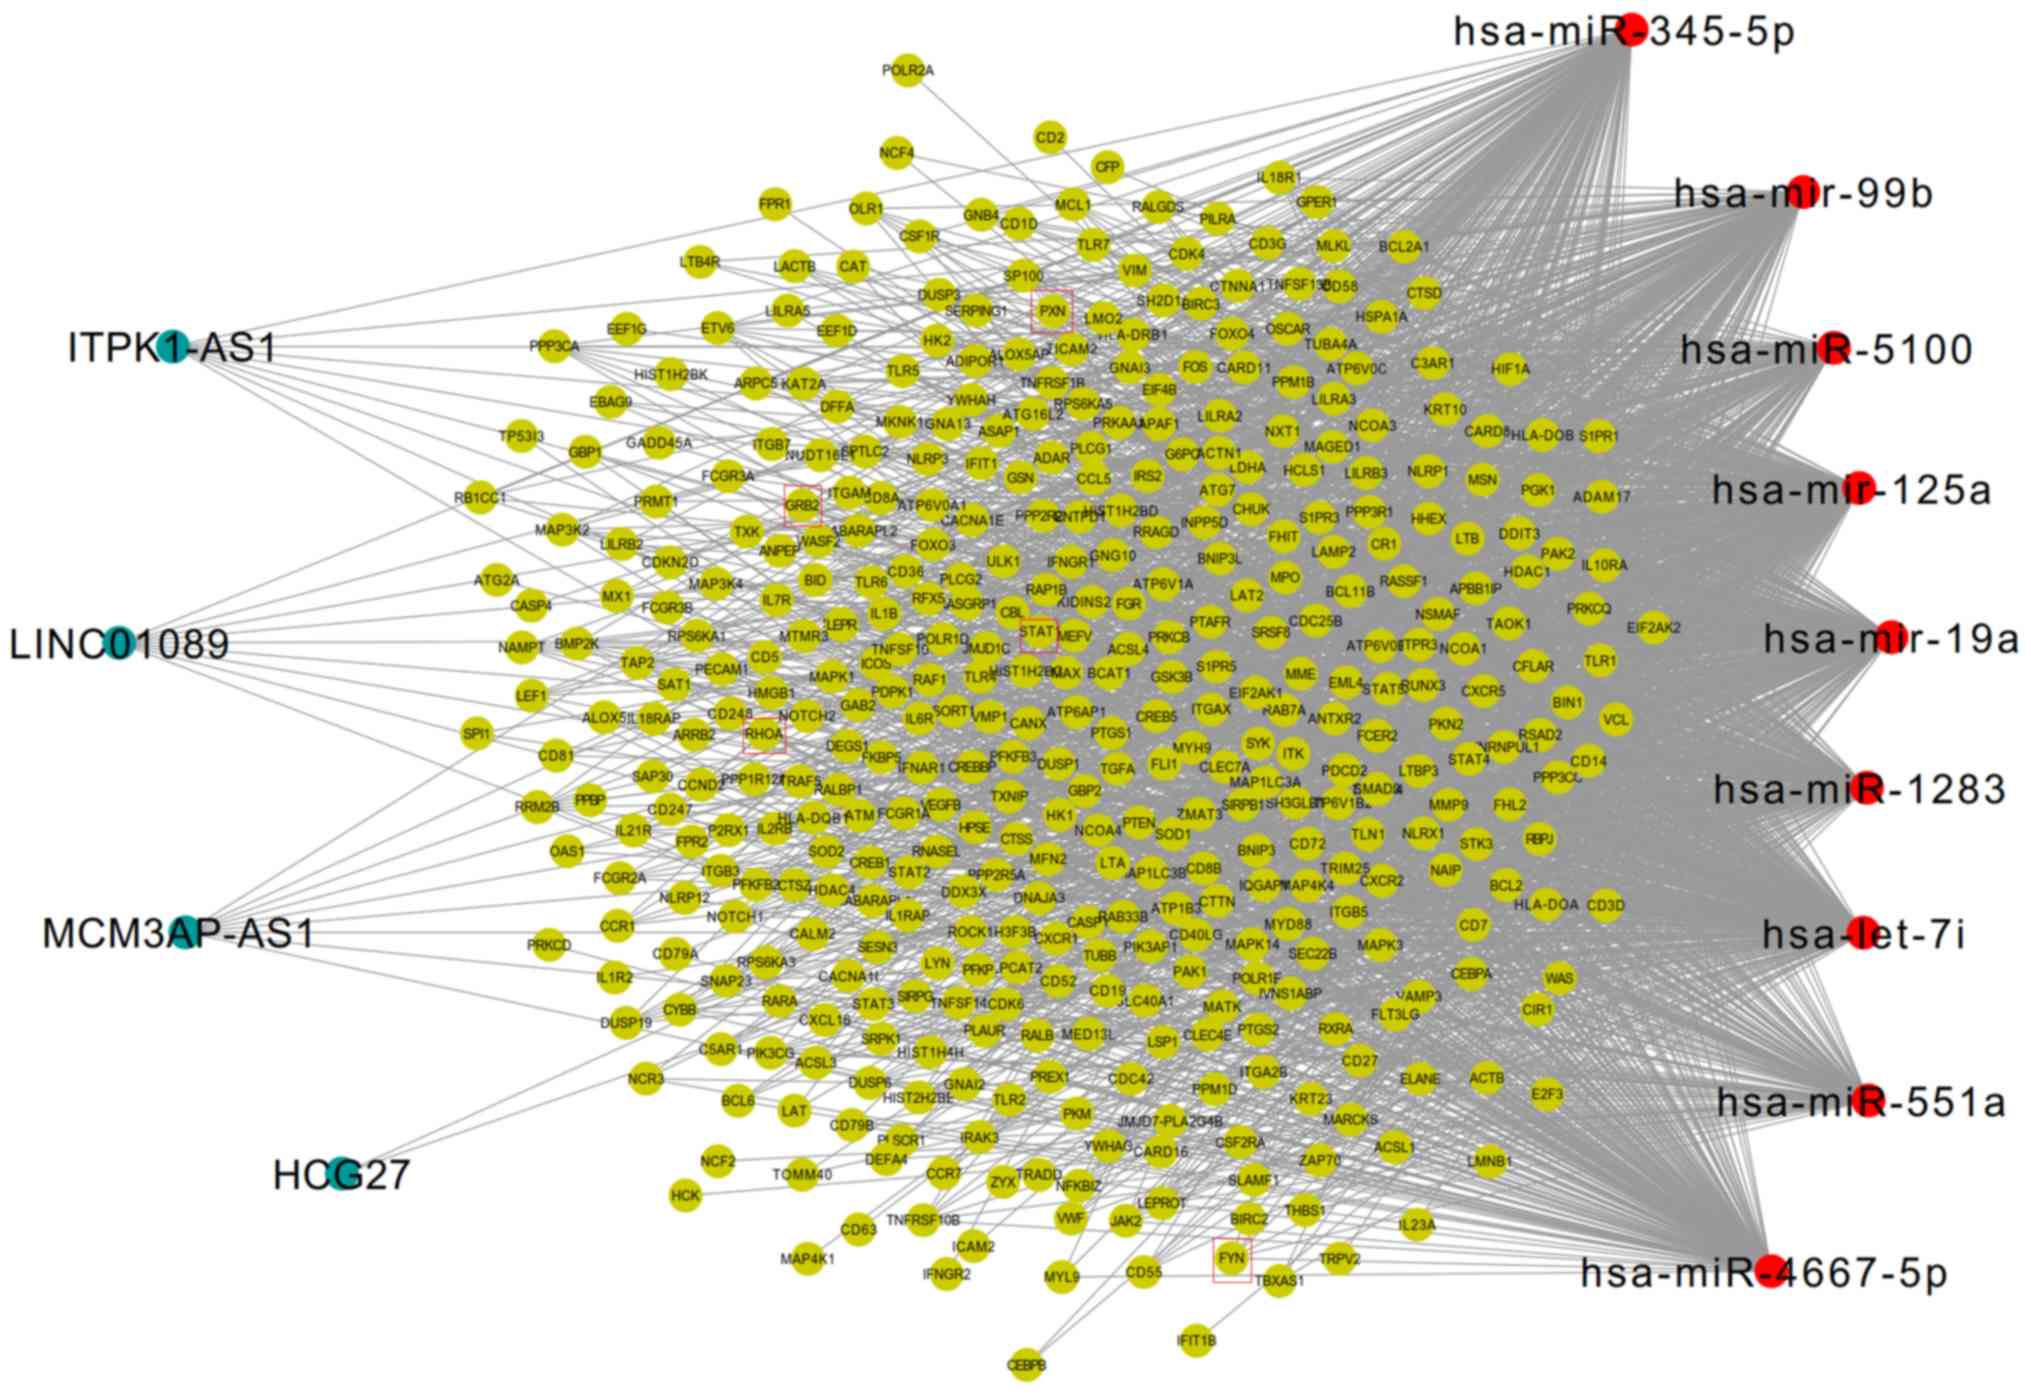
Furthermore, the mRNAs in the ceRNA regulatory
network were enriched in 66 KEGG signaling pathways, and 53
overlapped with the 191 AIS-associated KEGG pathways collected from
the CTD database. The 436 genes enriched in these 53 KEGG pathways
were subsequently extracted to construct a potential AIS-related
ceRNA network (Fig. 5). In this
network, the five inflammatory genes (PXN, FYN, STAT1, RHOA, GRB2)
were included. Downregulated FYN was predicted to be regulated by
upregulated hsa-miR-125a, whereas downregulated MCM3AP-AS1 and
LINC01089 could also interact with hsa-miR-125a, thus forming the
MCM3AP-AS1/LINC01089/hsa-miR-125a/FYN ceRNA axis (Fig. 6). Furthermore, the upregulated
expression of RHOA, GRB2 and STAT1 was predicted to be regulated by
the downregulated expression of hsa-let-7i, and this miRNA could
also interact with the upregulated lncRNA, ITPK1-AS1. Accordingly,
the ITPK1-AS1/hsa-let-7i/RHOA/GRB2/STAT1 ceRNA axes may also be
important for AIS. Additionally, the upregulated expressions of PXN
and HCG27 could interact with hsa-miR-19a to establish the
HCG27/hsa-miR-19a/PXN ceRNA axis for AIS (Fig. 6). Notably, to the best of our
knowledge this is the first time that the LncRNADisease database
has shown that the lncRNAs involved in these ceRNA networks are
associated with AIS, which suggested that they may be newly
identified targets for the diagnosis and treatment of AIS. These
five genes participated in 34 significant KEGG pathways (Table V), 26 of which were similar to the
results of module 7, including Th17 cell differentiation (STAT1), T
cell receptor signaling pathway (FYN/GRB2/RHOA), chemokine
signaling pathway (GRB2/RHOA/STAT1/PXN), and focal adhesion
(FYN/GRB2/RHOA/PXN). Therefore, the lncRNA ceRNA axes associated
with these five inflammatory DEGs may be of interest.
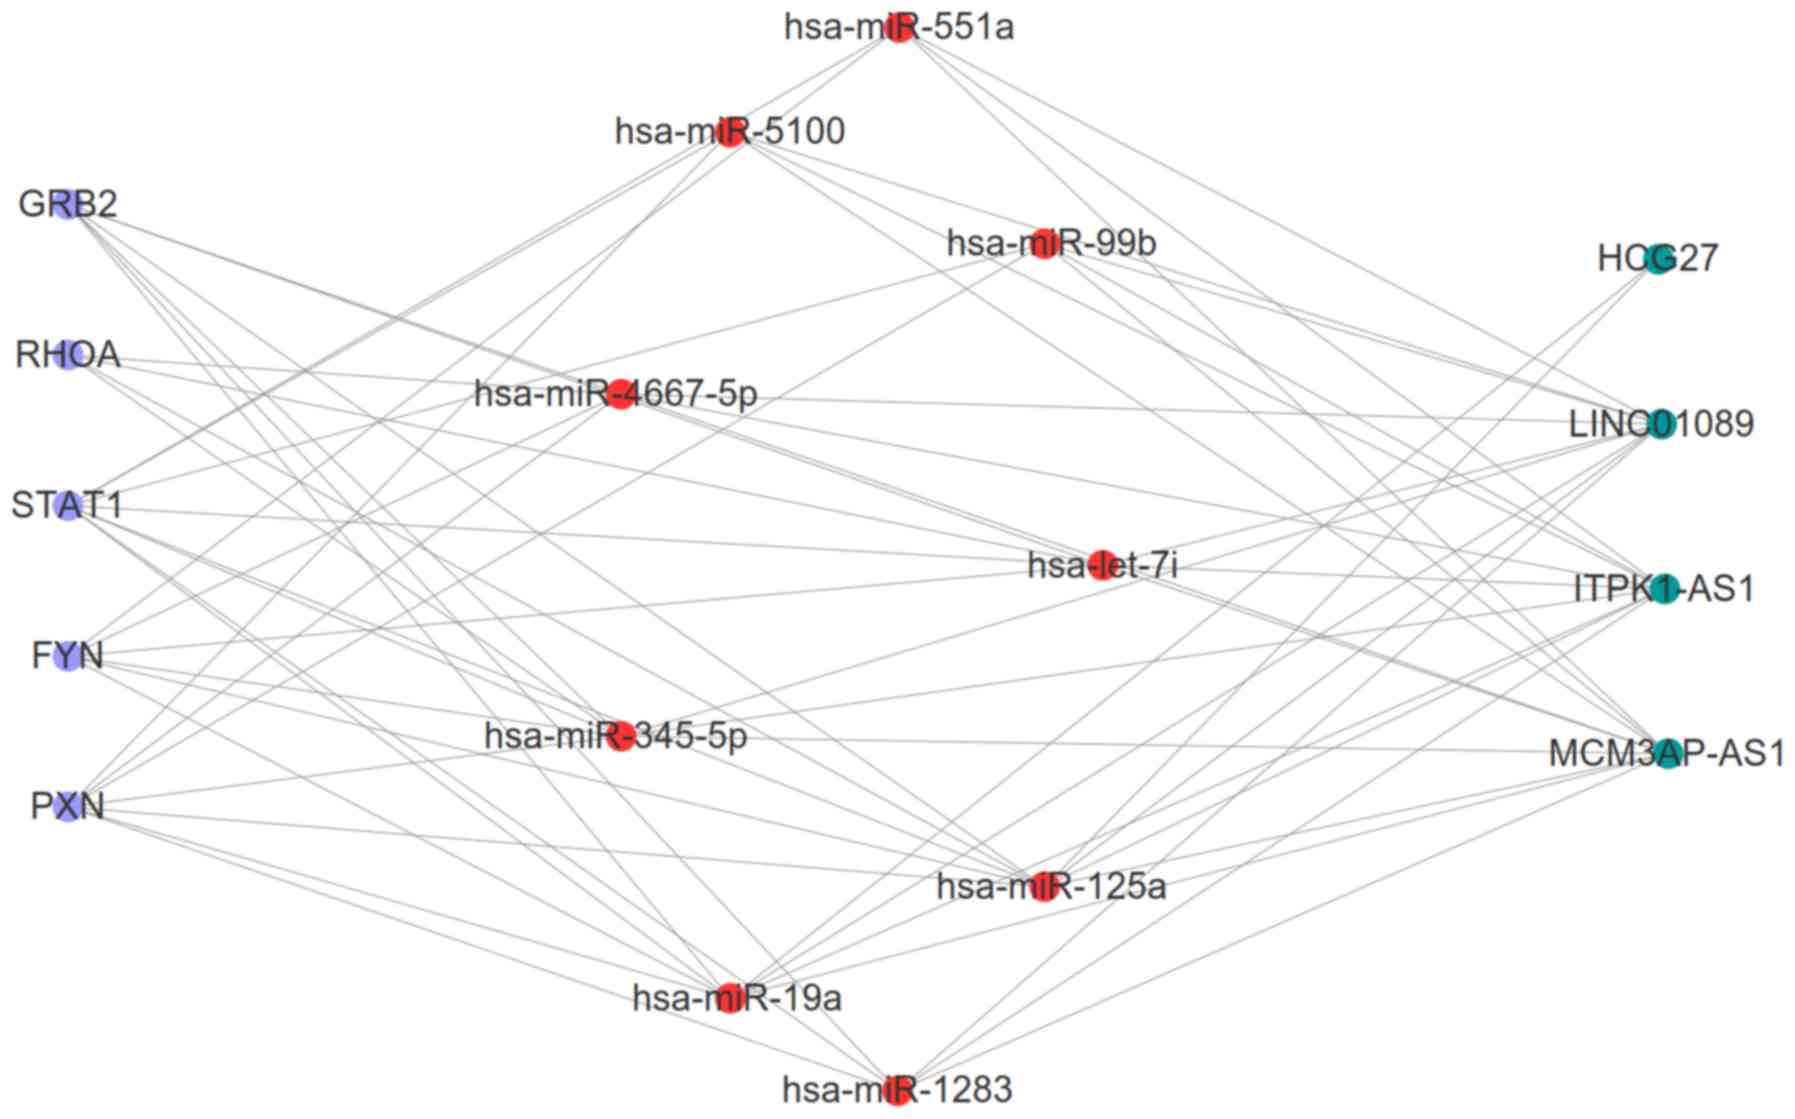 | Figure 6.Competing endogenous RNA interaction
network between five inflammatory differentially expressed hub
genes, and their related long noncoding RNA/miRNA axes in AIS.
Purple, hub genes; red, microRNAs; green, long non-coding RNAs.
miR/miRNA, microRNA; PXN, paxillin; GRB2, growth factor receptor
bound protein 2; FYN, FYN Proto-oncogene tyrosine-protein kinase;
STAT1, signal transducer and activator of transcription 1; RHOA,
Ras homolog family member A. |
| Table V.KEGG pathways enriched with potential
crucial genes in the AIS-relevant ceRNA network. |
Table V.
KEGG pathways enriched with potential
crucial genes in the AIS-relevant ceRNA network.
| KEGG ID | Description | P-value
adjusted | Gene |
|---|
| hsa05152 | Tuberculosis |
2.15×10⁻⁹ | RHOA/STAT1 |
| hsa04659 | Th17 cell
differentiation |
6.91×10⁻⁸ | STAT1 |
| hsa04380 | Osteoclast
differentiation |
6.91×10⁻⁸ | FYN/GRB2/STAT1 |
| hsa05140 | Leishmaniasis |
2.94×10⁻⁷ | STAT1 |
| hsa04660 | T cell receptor
signaling pathway |
4.90×10⁻⁷ | FYN/GRB2/RHOA |
| hsa04658 | Type 1 and 2 T
helper cell differentiation |
4.90×10⁻⁷ | STAT1 |
| hsa05164 | Influenza A |
3.10×10⁻⁶ | STAT1 |
| hsa04662 | B cell receptor
signaling pathway |
1.84×10⁻⁵ | GRB2 |
| hsa04621 | Nucleotide-binding
oligomerization domain-like receptor signaling pathway |
3.66×10⁻⁵ | RHOA/STAT1 |
| hsa05223 | Non-small cell lung
cancer |
2.35×10⁻⁴ | GRB2 |
| hsa05169 | Epstein-Barr virus
infection |
5.75×10⁻⁴ | STAT1 |
| hsa04611 | Platelet
activation |
5.87×10⁻⁴ | FYN/RHOA |
| hsa05145 | Toxoplasmosis |
6.37×10⁻⁴ | STAT1 |
| hsa04062 | Chemokine signaling
pathway |
6.37×10⁻⁴ |
GRB2/RHOA/STAT1/PXN |
| hsa05162 | Measles |
6.37×10⁻⁴ | STAT1 |
| hsa04068 | FoxO signaling
pathway |
6.38×10⁻⁴ | GRB2 |
| hsa05321 | Inflammatory bowel
disease |
1.32×10⁻³ | STAT1 |
| hsa05221 | Acute myeloid
leukemia |
1.58×10⁻³ | GRB2 |
| hsa04670 | Leukocyte
transendothelial migration |
2.76×10⁻³ | RHOA/PXN |
| hsa04071 | Sphingolipid
signaling pathway |
2.91×10⁻³ | FYN/RHOA |
| hsa04919 | Thyroid hormone
signaling pathway |
4.31×10⁻³ | STAT1 |
| hsa04650 | Natural killer cell
mediated cytotoxicity |
5.16×10⁻³ | FYN/GRB2 |
| hsa04664 | Fc e RI signaling
pathway |
5.21×10⁻³ | FYN/GRB2 |
| hsa05133 | Pertussis |
7.11×10⁻³ | RHOA |
| hsa05160 | Hepatitis C |
7.12×10⁻³ | GRB2/STAT1 |
| hsa05203 | Viral
carcinogenesis |
9.56×10⁻³ | GRB2/RHOA/PXN |
| hsa04722 | Neurotrophin
signaling pathway |
1.11×10⁻² | GRB2/RHOA |
| hsa04010 | Mitogen activated
protein kinase signaling pathway |
1.32×10⁻² | GRB2 |
| hsa05161 | Hepatitis B |
1.35×10⁻² | GRB2/STAT1 |
| hsa05205 | Proteoglycans in
cancer |
1.56×10⁻² | GRB2/RHOA |
| hsa04370 | Vascular
endothelial growth factor signaling pathway |
1.85×10⁻² | PXN |
| hsa04510 | Focal adhesion |
2.22×10⁻² |
FYN/GRB2/RHOA/PXN |
| hsa05212 | Pancreatic
cancer |
2.82×10⁻² | STAT1 |
| hsa04915 | Estrogen signaling
pathway |
3.12×10⁻² | GRB2 |
Discussion
Extensive evidence indicates that AIS is commonly
associated with the activation of immune-inflammatory responses,
which leads to the increased expression of various pro-inflammatory
cytokines, such as interleukin (IL)-6, IL-1 and C-reactive protein,
and, subsequently, neuronal cell death (25,26).
It has been revealed through several in vitro and in
vivo studies that lncRNAs involved in the inflammatory process
may be potential targets for the diagnosis and treatment of AIS
(27–31). For example, Zhang et al
(28) discovered that
lncRNA-1810034E14Rik is significantly decreased in oxygen-glucose
deprivation-induced microglial cells and in transient middle
cerebral artery occlusion (MCAO) mice, and that 1810034E14Rik
overexpression decreases the infarct volume and alleviates the
neuronal damage by reducing the expression of pro-inflammatory
cytokines IL-1β, tumor necrosis factor (TNF)-α and IL-6. Wang et
al (29) reported that levels
of the lncRNA H19, increased in the plasma, white blood cells and
brain of MCAO mice. Consequently, intracerebroventricular injection
of H19 small interfering RNA reduced the infarct volume and brain
edema through the suppressed release of pro-inflammatory IL-1β,
TNF-α, and increased anti-inflammatory IL-10 secretion (29). Similarly, in vitro
experiments demonstrated that H19 knockdown attenuated brain tissue
loss and neurological deficits by blocking M1 microglial
polarization, and the production of TNF-α. Genetic knockdown of the
lncRNAs metastasis-associated lung adenocarcinoma transcript 1
(MALAT1) and Maclpil, attenuated inflammatory injuries attained in
MCAO mice (30,31), and rare lncRNAs (ANRIL and H19) are
associated with inflammation in patients with AIS (7,29,32).
In the present study, high-throughput datasets of patients with AIS
were used to identify four crucial lncRNAs (MCM3AP-AS1, LINC01089,
ITPK1-AS1 and HCG27) that may regulate T cell receptor signaling
pathway genes (FYN, GRB2 and RHOA), and inflammatory chemokine
signaling pathway genes (GRB2, RHOA, STAT1 and PXN) by functioning
as ceRNAs that competitively bind with miRNAs. Previous studies
have cited cancer-related functions for MCM3AP-AS1, LINC01089 and
ITPK1-AS1 (33–36), but none has associated them with
the pathogenesis of AIS, indicating that they may serve as novel,
non-invasive biomarkers for the diagnosis and treatment of AIS.
However, although HCG27 has been reported to be downregulated in IS
(11), the present study found it
to be upregulated, which may be attributed to the difference in the
sample selection (chronic vs. acute) and the number of patients (3
vs. 39). Thus, the results presented in this study may be more
realistic for AIS.
Although no direct evidence was provided in this
study to demonstrate that these lncRNAs are involved in AIS, the
association with AIS of their interactive miRNA-mRNA pairs
indirectly suggests their role. For example, it had been reported
that the expression of RhoA is increased in cerebral IS model mice
(37), and the use of RhoA
inhibitors reduced neuronal cell apoptosis and improved
neurobehavioral outcomes (37,38).
In patients with stroke, T cells exhibit high RhoA activity, which
may mediate the secretion of interferon γ and IL-18 (39). There is also a significant
correlation between the amount of inflammation, as indicated by the
number of CD11b+/Iba+ cells, and the amount
of RhoA activation in nerves from in vivo rat stroke models
(40). Microarray analysis reveals
an enhanced expression of GRB2 24 at 72 h following ischemia, which
has been confirmed by ELISA (41,42).
In addition, IS induces STAT1 expression, which is an important
mediator of pro-inflammatory cytokines, such as IL-1β and TNF-α,
and STAT1 inhibition by silymarin ameliorated inflammation-mediated
brain tissue injury (43).
Hsa-let-7i is decreased in patients with AIS (14,38),
and inversely correlated with NIHSS score at admission and infarct
volume (44,45). In vitro functional analysis
demonstrated that hsa-let-7i might be involved in AIS by negatively
regulating inflammatory cluster of differentiation (CD)86 signaling
in T helper cells, and IL-8 signaling pathways (45). Thus, ITPK1-ASI may be upregulated
in AIS to further sequester hsa-let-7i and prevent it from
inhibiting the expression of RHOA/GRB2/STAT-1, ultimately resulting
in the upregulation of RHOA/GRB2/STAT1 in AIS.
Using a MCAO AIS model, Franciska et al
(46) revealed that PXN expression
is upregulated, especially following 1 h of ischemia (46), and jasminoidin and ursodeoxycholic
acid may be effective treatments of focal cerebral
ischemia-reperfusion injury through downregulating PXN (47). Hsa-miR-19a is decreased in patients
with AIS compared with control samples (14), especially within small vessel
stroke (48), and this
downregulated expression is hypothesized to serve a crucial role in
the pathogenesis of stroke by triggering the increased expression
of CD46, an important transmembrane protein that induces
inflammation (49). Thus, HCG27
may also be upregulated to sponge hsa-miR-19a, thus facilitating
the upregulation of PXN by reducing the expression of hsa-miR-19a,
and subsequently promoting inflammation, and the development of
AIS.
Experimental studies have demonstrated that the
genetic knockdown of FYN kinases may have a potential
neuroprotective effect for IS by decreasing neuronal apoptosis,
cerebral edema, and enhancing the rate of neurological recovery
(50,51). These findings suggest that FYN may
be upregulated during the inflammatory processes of AIS. However,
the microarray meta-analysis in the present study revealed that FYN
was significantly downregulated in the blood of patients with AIS.
This inconsistent conclusion may be attributed to the dual function
of FYN in the inflammatory process, as FYN knockout mice have
displayed significantly worse colitis compared with wild-type mice,
which correlated with decreased IL-10 and increased IL-17
expression in splenocytes and the gut (52).
Previously, circulating hsa-miR-125a was reported to
be upregulated in patients with IS compared with healthy controls
(12). A set of circulating miRNAs
(hsa-miR-125a-5p, hsa-miR-125b-5p and hsa-miR-143-3p) was
demonstrated to have a high accuracy (90.0%), sensitivity (85.6%)
and specificity (76.3%) in the diagnosis of patients with IS
compared with healthy controls (12). Maitrias et al (53) detected that hsa-miR-125a was
significantly overexpressed in stroke patients compared with
patients with asymptomatic atherosclerotic carotid plaques.
Moreover, Kumar and Nerurkar (54)
demonstrated that miR-125a-3p targets genes involved in modulating
immune responses, including cyclooxygenase-2, interleukin 1
receptor type 1, IL-10 and C-C motif chemokine ligand 4, in mouse
brains (54). Accordingly, it was
hypothesized that MCM3AP-AS1 and LINC01089, may be downregulated in
AIS, and thus, are unable to sequester hsa-miR-125a and to suppress
its inhibitory effects over PXN that contribute to its
downregulation. Thus, triggering neuroinflammation in patients'
brains and AIS.
The present study has several limitations. Firstly,
the sample size of each dataset was small, and additional
high-throughput sequencing experiments with larger samples are
required to confirm the conclusions. Secondly, the present study
only preliminarily screened crucial lncRNA biomarkers for the
diagnosis and treatment of AIS. Further clinical experiments, such
as quantitative-PCR analysis, correlation analysis, and receiver
operating characteristic analysis should be used to prove the
diagnostic and prognostic values of the lncRNAs. Finally, the ceRNA
mechanisms of DELs should be verified by dual-luciferase reporter
assays, and knockout or overexpression in vitro and in
vivo.
In conclusion, to the best of our knowledge, the
present study is the first to identify several inflammatory related
DELs, MCM3AP-AS1, LINC01089, ITPK1-AS1 and HCG27, that may serve as
underlying biomarkers for the diagnosis and treatment of AIS. These
DELs may function as a ceRNA network
(MCM3AP-AS1/LINC01089/hsa-miR-125a/FYN,
ITPK1-AS1/hsa-let-7i/RHOA/GRB2/STAT1 and HCG27/hsa-miR-19a/PXN) to
induce the development of AIS.
Acknowledgements
Not applicable.
Funding
No funding was received.
Availability of data and materials
The original sequencing data, GSE16561, GSE95204,
GSE86291, GSE55937 and GSE110993, were downloaded from the GEO
database (https://www.ncbi.nlm.nih.gov/geo). The datasets used
and/or analyzed during the current study are available from the
corresponding author on reasonable request.
Authors' contributions
LZ, BHL and LH conceived and designed the study. LZ
and BHL conducted the statistical analysis. JHH and TTW were
involved in the interpretation of the data. LZ and BHL drafted the
manuscript. LH participated in critically revising the manuscript.
All authors read and approved the final manuscript.
Ethics approval and consent to
participate
Not applicable.
Patient consent for publication
Not applicable.
Competing interests
The authors declare that they have no competing
interests.
References
|
1
|
Feigin VL, Forouzanfar MH, Krishnamurthi
R, Mensah GA, Connor M, Bennett DA, Moran AE, Sacco RL, Anderson L,
Truelsen T, et al: Global and regional burden of stroke during
1990–2010: Findings from the Global Burden of disease study 2010.
Lancet. 383:3081–255. 2014. View Article : Google Scholar
|
|
2
|
Boldsen JK, Engedal TS, Pedraza S, Cho TH,
Thomalla G, Nighoghossian N, Baron JC, Fiehler J, Østergaard L and
Mouridsen K: Better diffusion segmentation in acute ischemic stroke
through automatic tree learning anomaly segmentation. Front
Neuroinform. 12:212018. View Article : Google Scholar : PubMed/NCBI
|
|
3
|
Cassella CR and Jagoda A: Ischemic Stroke:
Advances in diagnosis and management. Emerg Med Clin North Am.
35:911–930. 2017. View Article : Google Scholar : PubMed/NCBI
|
|
4
|
Hasan TF, Rabinstein AA, Middlebrooks EH,
Haranhalli N, Silliman SL, Meschia JF and Tawk RG: Diagnosis and
management of acute ischemic stroke. Mayo Clin Proc. 93:523–538.
2018. View Article : Google Scholar : PubMed/NCBI
|
|
5
|
Adams BD, Parsons C, Walker L, Zhang WC
and Slack FJ: Targeting noncoding RNAs in disease. J Clin Invest.
127:761–771. 2017. View
Article : Google Scholar : PubMed/NCBI
|
|
6
|
Zhu M, Li N, Luo P, Jing W, Wen X, Liang C
and Tu J: Peripheral blood leukocyte expression of lncRNA MIAT and
its diagnostic and prognostic value in ischemic stroke. J Stroke
Cerebrovasc Dis. 27:326–337. 2017. View Article : Google Scholar : PubMed/NCBI
|
|
7
|
Feng L, Guo J and Ai F: Circulating long
noncoding RNA ANRIL downregulation correlates with increased risk,
higher disease severity and elevated pro-inflammatory cytokines in
patients with acute ischemic stroke. J Clin Lab Anal.
33:e226292019. View Article : Google Scholar : PubMed/NCBI
|
|
8
|
Deng QW, Li S, Wang H, Sun HL, Zuo L, Gu
ZT, Lu G, Sun CZ, Zhang HQ and Yan FL: Differential long noncoding
RNA expressions in peripheral blood mononuclear cells for detection
of acute ischemic stroke. Clin Sci. 132:1597–1614. 2018. View Article : Google Scholar : PubMed/NCBI
|
|
9
|
Sheng Y, Ma J, Zhao J, Qi S, Hu R and Yang
Q: Differential expression patterns of specific long noncoding RNAs
and competing endogenous RNA network in alopecia areata. J Cell
Biochem. 120:10737–10747. 2019. View Article : Google Scholar : PubMed/NCBI
|
|
10
|
Guo X, Yang J, Liang B, Shen T, Yan Y,
Huang S, Zhou J, Huang J, Gu L and Su L: Identification of novel
LncRNA biomarkers and construction of LncRNA-related networks in
Han Chinese patients with ischemic stroke. Cell Physiol Biochem.
50:2157–2175. 2018. View Article : Google Scholar : PubMed/NCBI
|
|
11
|
He W, Wei D, Chen S, Li S and Chen W:
Altered long non-coding RNA transcriptomic profiles in ischemic
stroke. Hum Gene Ther. 29:719–732. 2017. View Article : Google Scholar
|
|
12
|
Tiedt S, Prestel M, Malik R,
Schieferdecker N, Duering M, Kautzky V, Stoycheva I, Böck J,
Northoff BH, Klein M, et al: RNA-Seq identifies circulating
miR-125a-5p, miR-125b-5p and miR-143-3p as potential biomarkers for
acute ischemic stroke. Circ Res. 121:970–980. 2017. View Article : Google Scholar : PubMed/NCBI
|
|
13
|
Tian C, Li Z, Yang Z, Huang Q, Liu J and
Hong B: Plasma MicroRNA-16 is a biomarker for diagnosis,
stratification, and prognosis of hyperacute cerebral infarction.
PLoS One. 11:e01666882016. View Article : Google Scholar : PubMed/NCBI
|
|
14
|
Jickling GC, Ander BP, Xinhua Z, Dylan N,
Boryana S and Dazhi L: microRNA expression in peripheral blood
cells following acute ischemic stroke and their predicted gene
targets. PLoS One. 9:e992832014. View Article : Google Scholar : PubMed/NCBI
|
|
15
|
Ritchie ME, Phipson B, Wu D, Hu Y, Law CW,
Shi W and Smyth GK: Limma powers differential expression analyses
for RNA-sequencing and microarray studies. Nucleic Acids Res.
43:e472015. View Article : Google Scholar : PubMed/NCBI
|
|
16
|
Chen S, Yanqing Z, Yaru C and Jia G:
Fastp: An ultra-fast all-in-one FASTQ preprocessor. Bioinformatics.
34:i884–i890. 2018. View Article : Google Scholar : PubMed/NCBI
|
|
17
|
Li B and Dewey CN: RSEM: Accurate
transcript quantification from RNA-Seq data with or without a
reference genome. BMC Bioinformatics. 12:3232011. View Article : Google Scholar : PubMed/NCBI
|
|
18
|
Szklarczyk D, Franceschini A, Wyder S,
Forslund K, Heller D, Huerta-Cepas J, Simonovic M, Roth A, Santos
A, Tsafou KP, et al: STRING v10: Protein-protein interaction
networks, integrated over the tree of life. Nucleic Acids Res.
43((Database Issue)): D447–D452. 2015. View Article : Google Scholar : PubMed/NCBI
|
|
19
|
Tang Y, Li M, Wang J, Pan Y and Wu FX:
CytoNCA: A cytoscape plugin for centrality analysis and evaluation
of protein interaction networks. Biosystems. 127:67–72. 2015.
View Article : Google Scholar : PubMed/NCBI
|
|
20
|
Bader GD and Hogue CW: An automated method
for finding molecular complexes in large protein interaction
networks. BMC Bioinformatics. 4:22003. View Article : Google Scholar : PubMed/NCBI
|
|
21
|
Ashwini J, Marks DS and Erik L: miRcode: A
map of putative microRNA target sites in the long non-coding
transcriptome. Bioinformatics. 28:2062–2063. 2012. View Article : Google Scholar : PubMed/NCBI
|
|
22
|
Li JH, Liu S, Zhou H, Qu LH and Yang JH:
starBase v2.0: Decoding miRNA-ceRNA, miRNA-ncRNA and protein-RNA
interaction networks from large-scale CLIP-Seq data. Nucleic Acids
Res. 42((Database Issue)): D92–D97. 2014. View Article : Google Scholar : PubMed/NCBI
|
|
23
|
Paraskevopoulou MD, Georgakilas G,
Kostoulas N, Reczko M, Maragkakis M, Dalamagas TM and Hatzigeorgiou
AG: DIANA-LncBase: Experimentally verified and computationally
predicted microRNA targets on long non-coding RNAs. Nucleic Acids
Res. 41((Database Issue)): D239–D245. 2013. View Article : Google Scholar : PubMed/NCBI
|
|
24
|
Dweep H and Gretz N: miRWalk2. 0: A
comprehensive atlas of microRNA-target interactions. Nat Methods.
12:6972015. View Article : Google Scholar : PubMed/NCBI
|
|
25
|
Jin R, Liu L, Zhang S, Nanda A and Li G:
Role of inflammation and its mediators in acute ischemic stroke. J
Cardiovasc Transl Res. 6:834–851. 2013. View Article : Google Scholar : PubMed/NCBI
|
|
26
|
Dziedzic T: Systemic inflammation as a
therapeutic target in acute ischemic stroke. Expert Rev Neurother.
15:523–531. 2015. View Article : Google Scholar : PubMed/NCBI
|
|
27
|
Akella A, Bhattarai S and Dharap A: Long
noncoding RNAs in the pathophysiology of ischemic stroke.
Neuromolecular Med. 21:474–483. 2019. View Article : Google Scholar : PubMed/NCBI
|
|
28
|
Zhang X, Zhu XL, Ji BY, Cao X, Yu LJ,
Zhang Y, Bao XY, Xu Y and Jin JL: LncRNA-1810034E14Rik reduces
microglia activation in experimental ischemic stroke. J
Neuroinflammation. 16:752019. View Article : Google Scholar : PubMed/NCBI
|
|
29
|
Wang J, Zhao H, Fan Z, Li G, Ma Q, Tao Z,
Wang R, Feng J and Luo Y: Long noncoding RNA H19 promotes
neuroinflammation in ischemic stroke by driving histone deacetylase
1-Dependent M1 microglial polarization. Stroke. 48:2211–2221. 2017.
View Article : Google Scholar : PubMed/NCBI
|
|
30
|
Cao DW, Liu MM, Duan R, Tao YF, Zhou JS,
Fang WR, Zhu JR, Niu L and Sun JG: The lncRNA Malat1 functions as a
ceRNA to contribute to berberine-mediated inhibition of HMGB1 by
sponging miR-181c-5p in poststroke inflammation. Acta Pharmacol
Sin. 41:22–33. 2020. View Article : Google Scholar : PubMed/NCBI
|
|
31
|
Wang Y, Luo Y, Yao Y, Ji Y, Feng L, Du F,
Zheng X, Tao T, Zhai X, Li Y, et al: Silencing the lncRNA Maclpil
in pro-inflammatory macrophages attenuates acute experimental
ischemic stroke via LCP1 in mice. J Cereb Blood Flow Metab.
40:747–759. 2020. View Article : Google Scholar : PubMed/NCBI
|
|
32
|
Zhang K, Qi M, Yang Y, Xu P, Zhua Y and
Zhang J: Circulating lncRNA ANRIL in the serum of patients with
ischemic stroke. Clin Lab. 652019.doi:
10.7754/Clin.Lab.2019.190143.
|
|
33
|
Wang Y, Yang L, Chen T, Liu X, Guo Y, Zhu
Q, Tong X, Yang W, Xu Q, Huang D and Tu K: A novel lncRNA
MCM3AP-AS1 promotes the growth of hepatocellular carcinoma by
targeting miR-194-5p/FOXA1 axis. Mol Cancer Res. 18:282019.
View Article : Google Scholar
|
|
34
|
Sas-Chen A, Aure MR, Leibovich L, Carvalho
S, Enuka Y, Körner C, Polycarpou-Schwarz M, Lavi S, Nevo N,
Kuznetsov Y, et al: LIMT is a novel metastasis inhibiting lncRNA
suppressed by EGF and downregulated in aggressive breast cancer.
EMBO Mol Med. 8:1052–1064. 2016. View Article : Google Scholar : PubMed/NCBI
|
|
35
|
Hu Z, Yang D, Tang Y, Zhang X, Wei Z, Fu
H, Xu J, Zhu Z and Cai Q: Five-long non-coding RNA risk score
system for the effective prediction of gastric cancer patient
survival. Oncol Lett. 17:4474–4486. 2019.PubMed/NCBI
|
|
36
|
Yang C, Zheng J, Xue Y, Yu H, Liu X, Ma J,
Liu L, Wang P, Li Z, Cai H and Liu Y: The Effect of
MCM3AP-AS1/miR-211/KLF5/AGGF1 axis regulating glioblastoma
angiogenesis. Front Mol Neurosci. 10:4372017. View Article : Google Scholar : PubMed/NCBI
|
|
37
|
Ding H, Gao S, Wang L, Wei Y and Zhang M:
Overexpression of miR-582-5p inhibits the apoptosis of neuronal
cells after cerebral ischemic stroke through regulating
PAR-1/Rho/Rho Axis. J Stroke Cerebrovasc Dis. 28:149–155. 2019.
View Article : Google Scholar : PubMed/NCBI
|
|
38
|
Vesterinen HM, Currie GL, Carter S, Mee S,
Watzlawick R, Egan KJ, Macleod MR and Sena ES: Systematic review
and stratified meta-analysis of the efficacy of RhoA and Rho kinase
inhibitors in animal models of ischaemic stroke. Syst Rev.
2:332013. View Article : Google Scholar : PubMed/NCBI
|
|
39
|
Schultz NEØ, Hasseldam H, Rasmussen RS,
Vindegaard N, Mcwilliam O, Iversen HK and Johansen FF: Statin
treatment before stroke reduces pro-inflammatory cytokine levels
after stroke. Neurol Res. 41:289–297. 2019. View Article : Google Scholar : PubMed/NCBI
|
|
40
|
Fard MA, Ebrahimi KB and Miller NR: RhoA
activity and post-ischemic inflammation in an experimental model of
adult rodent anterior ischemic optic neuropathy. Brain Res.
1534:76–86. 2013. View Article : Google Scholar : PubMed/NCBI
|
|
41
|
Jin K, Mao X, Mw, Nagayama T, Minami M,
Simon R and Greenberg D: Microarray analysis of hippocampal gene
expression in global cerebral ischemia. Ann Neurol. 50:93–103.
2010. View Article : Google Scholar
|
|
42
|
He D, Zhuo Z, Lao J, Meng H, Han L, Fan C,
Dan Y, He Z and Yun X: Proteomic analysis of the Peri-infarct area
after human umbilical cord mesenchymal stem cell transplantation in
experimental stroke. Aging Dis. 7:623–634. 2016. View Article : Google Scholar : PubMed/NCBI
|
|
43
|
Hou YC, Liou KT, Chern CM, Wang YH, Liao
JF, Chang S, Chou YH and Shen YC: Preventive effect of silymarin in
cerebral ischemia-reperfusion-induced brain injury in rats possibly
through impairing NF-κB and STAT-1 activation. Phytomedicine.
17:963–973. 2010. View Article : Google Scholar : PubMed/NCBI
|
|
44
|
Xiang W, Tian C, Lin J, Wu X, Pang G, Zhou
L, Pan S and Deng Z: Plasma let-7i and miR-15a expression are
associated with the effect of recombinant tissue plasminogen
activator treatment in acute ischemic stroke patients. Thromb Res.
158:121–125. 2017. View Article : Google Scholar : PubMed/NCBI
|
|
45
|
Jickling GC, Ander BP, Shroff N, Orantia
M, Stamova B, Dykstra-Aiello C, Hull H, Zhan X, Liu D and Sharp FR:
Leukocyte response is regulated by microRNA let7i in patients with
acute ischemic stroke. Neurology. 87:2198–2205. 2016. View Article : Google Scholar : PubMed/NCBI
|
|
46
|
Franciska E, Thorsten T, Günter M and
Konstantin-A H: Immunohistochemical analysis of protein expression
after middle cerebral artery occlusion in mice. Acta Neuropathol.
107:127–136. 2004. View Article : Google Scholar : PubMed/NCBI
|
|
47
|
Liu J, Zhou CX, Zhang ZJ, Wang LY, Jing ZW
and Wang Z: Synergistic mechanism of gene expression and pathways
between jasminoidin and ursodeoxycholic acid in treating focal
cerebral ischemia-reperfusion injury. CNS Neurosci Ther.
18:674–682. 2012. View Article : Google Scholar : PubMed/NCBI
|
|
48
|
Tan JR, Tan KS, Yong FL, Armugam A, Wang
CW, Jeyaseelan K and Wong PT: MicroRNAs regulating cluster of
differentiation 46 (CD46) in cardioembolic and non-cardioembolic
stroke. PLoS One. 12:e01721312017. View Article : Google Scholar : PubMed/NCBI
|
|
49
|
Marie JC, Astier AL, Rivailler P,
Rabourdin-Combe C, Wild TF and Horvat B: Linking innate and
acquired immunity: Divergent role of CD46 cytoplasmic domains in T
cell induced inflammation. Nat Immunol. 3:659–666. 2002. View Article : Google Scholar : PubMed/NCBI
|
|
50
|
Du CP, Tan R and Hou XY: Fyn kinases play
a critical role in neuronal apoptosis induced by oxygen and glucose
deprivation or amyloid-β peptide treatment. CNS Neurosci Ther.
18:754–761. 2012. View Article : Google Scholar : PubMed/NCBI
|
|
51
|
Holmes A, Zhou N, Donahue DL, Balsara R
and Castellino FJ: A deficiency of the GluN2C subunit of the
N-methyl-D-aspartate receptor is neuroprotective in a mouse model
of ischemic stroke. Biochem Biophys Res Commun. 495:136–144. 2018.
View Article : Google Scholar : PubMed/NCBI
|
|
52
|
Lopes F, Wang A, Smyth D, Reyes JL,
Doering A, Schenck LP, Beck P, Waterhouse C and McKay DM: The Src
kinase Fyn is protective in acute chemical-induced colitis and
promotes recovery from disease. J Leukoc Biol. 97:1089–1099. 2015.
View Article : Google Scholar : PubMed/NCBI
|
|
53
|
Maitrias P, Metzinger-Le Meuth V, Massy
ZA, M'Baya-Moutoula E, Reix T, Caus T and Metzinger L: MicroRNA
deregulation in symptomatic carotid plaque. J Vasc Surg.
62:1245–1250.e1. 2015. View Article : Google Scholar : PubMed/NCBI
|
|
54
|
Kumar M and Nerurkar VR: Integrated
analysis of microRNAs and their disease related targets in the
brain of mice infected with West Nile virus. Virology.
452-453:143–151. 2014. View Article : Google Scholar : PubMed/NCBI
|