Introduction
Glioma is a malignant brain cancer that exhibits
high invasiveness, is typically dispersed throughout the brain,
blood vessels and their basement membranes, which are rich in
extracellular matrix (1–3). The DNA alkylating agent temozolomide,
when used in combination with radiation therapy, improves the
survival rate in patients with glioma (4). However, previous studies have
reported that only ~10% of patients undergoing this therapy can
survive for 5 years (5,6). Therefore, it is important to discover
novel biomarkers that may be clinically useful in the field of
neuro-oncology.
MicroRNAs (miRNAs) are small, non-coding RNAs that
are 19–24 nucleotides in length, and when combined with target
mRNAs, they can function to post-transcriptionally regulate gene
expression (7,8). miRNAs have become a hotspot for
research in the field of biology, and an increasing number of
studies have identified the underlying mechanism of action for
numerous miRNAs (miRs) (9,10). miR-181d is a member of the miR-181
family, which includes miR-181a, miR-181b, miR-181c and miR-181d
(11,12). miR-181d is strongly expressed in a
wide range of cancer tissues, and it plays an important role in the
regulation of tumorigenesis, metastasis and apoptosis (13,14).
For example, miR-181d can regulate KRAS proto-oncogene to reduce
migration, apoptosis and cell cycle transition in glioma cells
(15). In addition, miR-181d
downregulates methylguanine-methyltransferase to inhibit cancer
migration, and it serves as a common biomarker for human
glioblastoma (16). However, it
has been suggested that miR-181d is upregulated in gliomas and is
an indicator of poor prognosis (17). Based on the evidence that miR-181d
acts as a prognostic factor and plays a major role in glioma, the
present study performed a number of experiments to further assess
the expression and function of miR-181d in glioma.
Insulin like growth factor 1 (IGF1) is a member of a
family of proteins involved in the regulation of growth and
development, and this protein is structurally and functionally
similar to insulin (18,19). IGF1 is a cyclic polypeptide
consisting of 70 amino acids and it plays vital roles in cellular
proliferation and metabolism (20). In colorectal cancer, IGF1 can
modulate cell proliferation and migration (21). Moreover, Wang et al
(22) revealed that exposure to an
IGF1 inhibitor abrogated cellular proliferation and invasion in
glioma.
As an important signal transduction pathway, the
PI3K/AKT/mTOR signaling pathway plays an important role in cellular
proliferation, apoptosis and other processes (23). AKT phosphorylates Bcl2 to initiate
apoptosis, inhibits the activity of the proteolytic enzyme
Caspase-9 and activates the apoptotic cascade (24). mTOR is a downstream target gene of
PI3K/AKT and this protein is indispensable for tumorigenesis
(25). Moreover, brusatol
regulates cell proliferation or apoptosis via the PI3K/AKT/mTOR
signaling pathway in clear cell renal cell carcinoma and
hepatocellular carcinoma (26,27).
In glioma, oxymatrine induces cell cycle arrest and apoptosis via
the PI3K/AKT/mTOR pathway (28).
In the present study, a miR-181d mimic, IGF1 inhibitor, PI3K/AKT
inhibitor and miR-181d inhibitor were used to treat cells, and the
effects of these treatments on cellular proliferation, cell cycle
progression and apoptosis were assessed. It was demonstrated that
miR-181d promotes cellular proliferation via the PI3K/AKT/mTOR
pathway.
Materials and methods
Cell lines and cell culture
The glioma cell line U251 was obtained from the
American Type Culture Collection and cultured in a 37°C incubator
until the confluence was ~80%. The cells were maintained in DMEM
(Gibco; Thermo Fisher Scientific, Inc.) supplemented with 10% FBS
(cat. no. 10270-106; Gibco; Thermo Fisher Scientific, Inc.), 100
U/ml penicillin and 100 mg/ml streptomycin at 37°C in a humidified
atmosphere containing 5% CO2.
Cell transfection and selection
To detect the functions of miR-181d in glioma cells,
the miR-181d mimic, miR-181d inhibitor and a negative control were
synthesized from Shanghai GenePharma Co., Ltd. The miR-181d mimic
was a double strand that was formed using a mature miR-181d
sequence and the complementary sequence
(5′-AACAUUCAUUGUUGUCGGUGGGU-3′), while the miR-181d inhibitor was a
single strand consisting of the complementary sequence of the
mature miR-181d sequence (5′-UUGUAAGUAACAACAGCCACCCA-3′). The
transfection was performed using 5 µl Lipofectamine®
2000 reagent (Invitrogen; Thermo Fisher Scientific, Inc.) and 30 nM
miR-181d mimic, 50 nM miR-181d inhibitor or 30 nM negative control
that was diluted into 250 µl Opti-MEM/Reduced serum medium (Thermo
Fisher Scientific, Inc.). At 48 h post-transfection, the cells were
maintained in 400 µg/ml Geneticin (cat. no. G418; Thermo Fisher
Scientific, Inc.) to select the cell lines that were stably
expressing the miR-181d mimic or miR-181d inhibitor.
Western blot analysis
U251 cells at a density of 70% were washed twice
with 100 ml pre-cooled 1X PBS, and RIPA buffer (Beyotime Institute
of Biotechnology) containing phosphatase inhibitor was then added.
The cells were lysed on ice, centrifuged at 12,000 × g for 10 min
at 4°C and the supernatant containing the desired protein was
obtained. The xenograft tissues were also lysed using RIPA to
obtain total proteins. Total proteins were quantified using the
bicinchoninic acid method and the absorbance was measured at 562
nm. A total of 20 µg per lane of total protein were separated by
120 V electrophoresis on a 12% SDS-PAGE for 50 min. The blots were
then transferred to PVDF membranes (EMD Millipore) at 90 V for 50
min. After blocking with 5% skimmed milk at room temperature for 1
h, the membranes were incubated with the primary antibodies
overnight at 4°C with GAPDH as the internal reference. After
washing three times with TBS-Tween 20 (0.05%), the membranes were
incubated with horseradish peroxidase-conjugated goat anti-rabbit
IgG at room temperature for 1 h. Equal amounts (500 µl) of
Electrochemical Luminescence Kit (ECL) illuminating liquids A and B
(Pierce; Thermo Fisher Scientific, Inc.) were mixed and used to
visualize the signal on a Molecular Imager ChemiDoc XRS System
(Bio-Rad Laboratories, Inc.) using Tanon MP v1.0.2.0 software
(Tanon Science and Technology Co.). The primary antibodies and the
secondary antibody are presented in Table I.
 | Table I.Details of the antibodies used in the
present study. |
Table I.
Details of the antibodies used in the
present study.
| Antibodies | Species | Company | Cat. no. | Dilution |
|---|
| IGF1 | Rabbit | Abcam | Ab9572 | 1:10,000 |
| PI3K | Rabbit | Abcam | Ab191606 | 1:1,000 |
| p-PI3K | Rabbit | Abcam | Ab182651 | 1:1,000 |
| AKT | Rabbit | Abcam | Ab8805 | 1:500 |
| p-AKT | Rabbit | Abcam | Ab38449 | 1:1,000 |
| mTOR | Rabbit | Abcam | Ab2732 | 1:2,000 |
| p-mTOR | Rabbit | Abcam | Ab109268 | 1:5,000 |
| Bcl2 | Rabbit | Abcam | Ab182858 | 1:2,000 |
| Caspase-3 | Rabbit | Abcam | Ab13847 | 1:500 |
| Caspase-8 | Rabbit | Abcam | Ab25901 | 1:1,000 |
| Caspase-9 | Rabbit | Abcam | Ab202068 | 1:2,000 |
| Cyclin D | Rabbit | Abcam | Ab16663 | 1:200 |
| Cyclin E | Rabbit | Abcam | Ab33911 | 1:2,000 |
| Ki67 | Rabbit | Abcam | Ab92742 | 1:5,000 |
| IDH-1R | Rabbit | Abcam | Ab94571 | 1:1,000 |
| IGFB2 | Rabbit | Abcam | Ab91404 | 1:500 |
| PTEN | Rabbit | Abcam | Ab32199 | 1:10,000 |
| TERT | Rabbit | Abcam | Ab191523 | 1:1,000 |
| GAPDH | Rabbit | CST | 2118 | 1:1,000 |
| Goat anti rabbit
IgG | Goat | Bio-swamp life
science | PAB150011 | 1:10,000 |
Cell Counting Kit-8 (CCK-8) assay
CCK-8 (Bioswamp Life Science Lab) was used to
determine cell proliferation according to the manufacturer's
instructions. A total of 3×10³ U251 cells were seeded
into 96-well plates and cultured for 24 h at 37°C in a humidified
atmosphere containing 5% CO2. Subsequently, the IGF1
inhibitor (Linsitinib; OSI-906, SelleckChemicals) or the PI3K/AKT
inhibitor (LY294002, Sigma-Aldrich; Merck KGaA) were added to the
cells and incubated for 24 h at room temperature. The CCK-8
solution (10 µl) was added to the cells, which were then cultured
for 4 h at 37°C. The absorbance at 450 nm was subsequently measured
using an ELISA plate reader (BioTek Instruments, Inc.).
Cell cycle
Cell cycle progression was detected by flow
cytometry. The cells transfected with mir-181d mimic, IGF1
inhibitor, PI3K/AKT inhibitor or mir-181d inhibitor were suspended
in a PBS solution containing 10% FBS, and then the cells were fixed
in absolute ethyl ethanol at room temperature for 24 h. Next, the
samples were centrifuged at 3,000 × g for 30 sec at room
temperature and the supernatant was discarded. Subsequently, the
cell pellet was suspended in 100 µl RNase A solution (1 mg/ml) and
digested at 37°C for 10 min. Cells were then stained at room
temperature for 10 min using 400 µl propidium iodide (PI, 50 µg/ml,
Nanjing KeyGen Biotech Co., Ltd.) in the dark and analyzed by a
FC500 MCL flow cytometer (Beckman Coulter) using MODFIT LT 2.0
(Verity Software House, Inc.). The proportion of cells in
G0/G1, S and G2/M stages was
evaluated, and all procedures were performed in triplicate.
Cell apoptosis
Cellular apoptosis was detected using the
Annexin-V/PI detection kit (Nanjing KeyGen Biotech Co., Ltd.)
according to the manufacturer's protocol. The transfected cells
were suspended and centrifuged at 1,000 × g for 5 min at room
temperature. The supernatant was then removed, and the cells were
resuspended in 200 µl binding buffer. The cells were stained with
10 µl Annexin V-FITC and 10 µl PI and then incubated for 30 min at
4°C in the dark. Cellular apoptosis was detected under a FC500 MCL
flow cytometer (Beckman Coulter, Inc.) and analyzed using CXP
Analysis 2.0 software (Beckman Coulter, Inc.). The apoptotic rate
was calculated by the percentage of early and late apoptotic
cells.
Animal study
Thirty male BALB/C nude mice (age, 4–6 weeks,
weight, 20 g) were purchased from the Experimental Animal Center of
the Chinese Academy of Sciences and were prepared for this
experiment. All mice were housed at 22±2°C, 45–60% humidity and a
12 h light/day cycle. All mice received food and water ad
libitum. For the xenograft tumor model, 5×10⁶ U251
cells were injected subcutaneously into the axilla of the nude
mice. After the cells were cultured to the size of ~3 mm, the nude
mice were randomly divided into five groups for drug treatment
three times a week for a total of three weeks. The five groups
included the control, overexpression (10 µg miR-181d-mimic by
injection), interference (10 µg miR-181d-inhibitor by injection),
IGF-1 inhibitor (20 mg/kg/day Linsitinib, by gavage)and PI3K/AKT
inhibitor (100 mg/kg LY294002, by gavage) groups.
After the xenograft model was established, the
length (L) and width (W) of the subcutaneous tumors were measured
every 2 days using a vernier caliper. Tumor volume was calculated
using the formula (L × W2)/2. On the 28th day after
seeding the cells, the mice were sacrificed to obtain tumor
specimens. The experiment was performed according to the revised
guidelines for the Care and Use of Experimental Animals (National
Institutes of Health) (29). The
experimental program has been approved by the Ethics Committee of
Renmin Hospital of Wuhan University (Hubei, China).
Statistical analysis
The data were analyzed using SPSS 16.0 software (IBM
Corp.) and GraphPad Prism software (version 6; GraphPad Software,
Inc.) and are presented as the mean ± SD. Unpaired Student's t-test
and one-way ANOVA followed by Bonferroni post-hoc test were applied
to determine the significance of differences among the various
groups. P<0.05 was considered to indicate a statistically
significant difference. All experiments were performed in
triplicate.
Results
miR-181d promotes cellular
proliferation via the PI3K/AKT/mTOR signaling pathway in U251
cells
To investigate the functions of miR-181d in glioma
cells, a miR-181d mimic, a miR-181d inhibitor and a negative
control were synthesized. In addition, IGF1 and PI3K/AKT inhibitors
were used to examine whether miR-181d regulated cell proliferation
via the PI3K/AKT/mTOR pathway. U251 cells were transfected or
treated with miR-181d mimic, IGF1 inhibitor, PI3K/AKT inhibitor or
miR-181d inhibitor (Fig. S1).
After evaluating the expression of IGF1, it was identified that
miR-181d mimic significantly increased (P=0.0039) its expression,
while the IGF1, PI3K/AKT and miR-181d inhibitors significantly
reduced (P=0.0001, P=0.0002 and P=0.0003, respectively) the
expression of IGF1 (Fig. 1A).
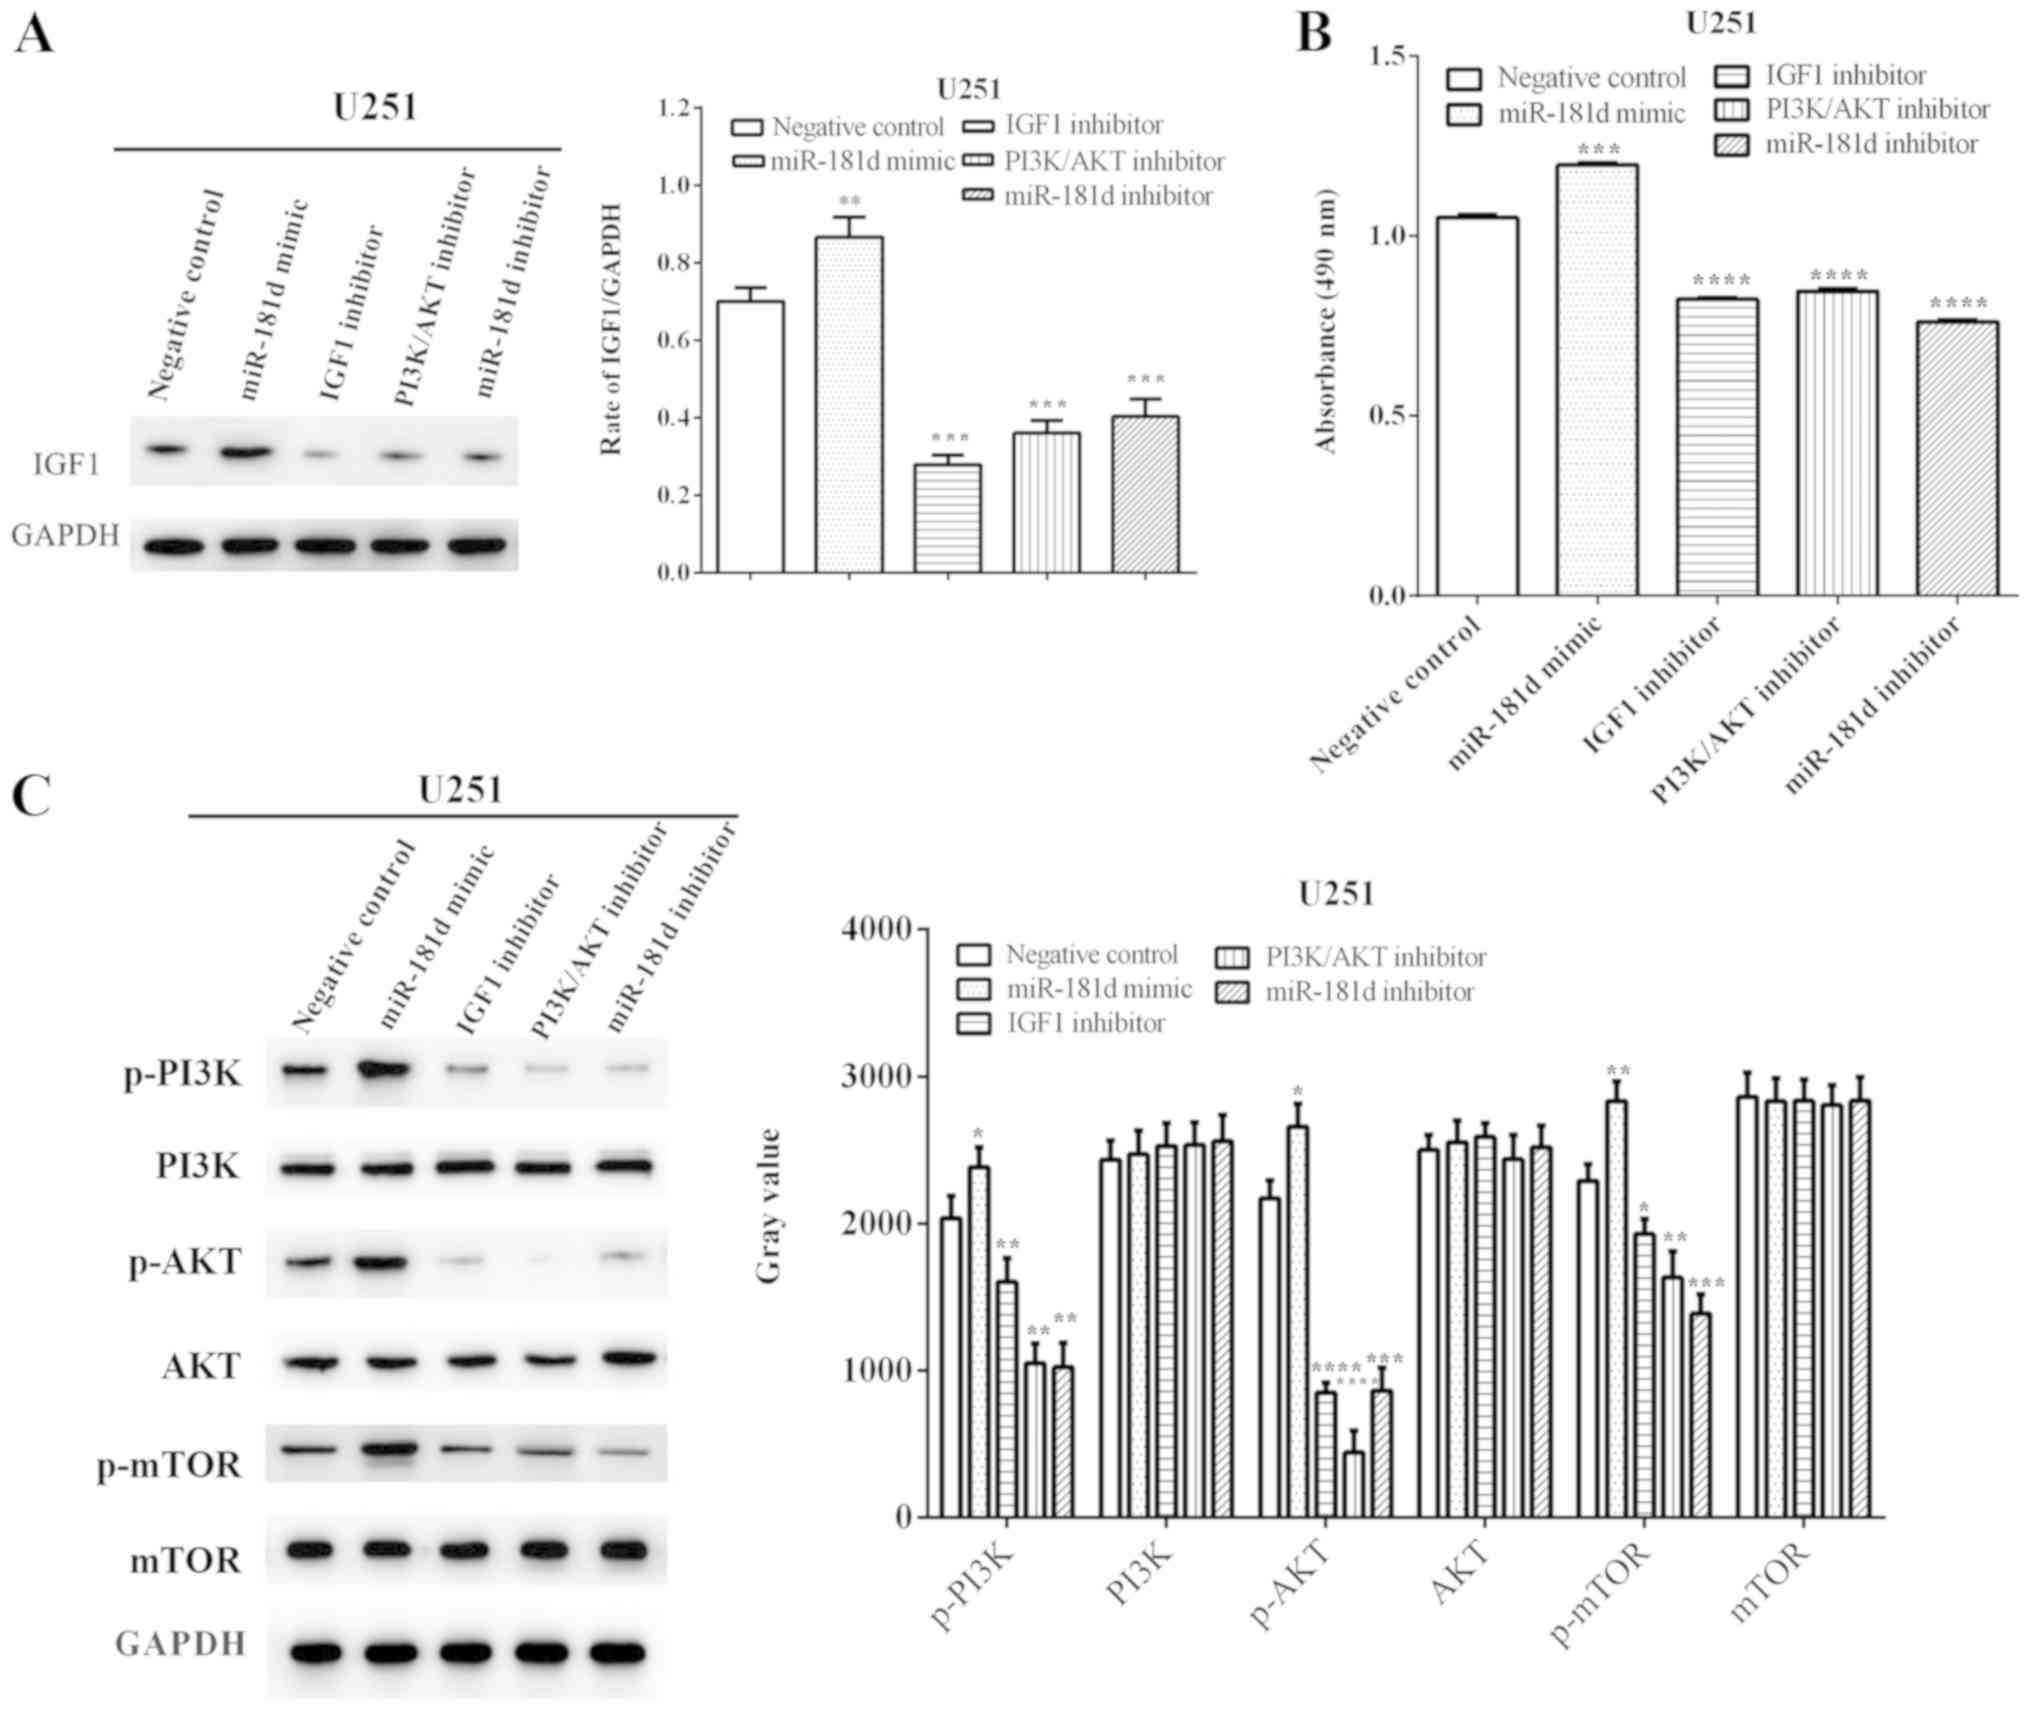 | Figure 1.miR-181d promotes proliferation via
the PI3K/AKT/mTOR signal pathway in U251 cells. (A) miR-181d
enhanced the expression of IGF1, and treatment with the IGF1
inhibitor, PI3K/AKT inhibitor and miR-181d inhibitor reduced the
expression of IGF1. (B) miR-181d mimic increased cellular
proliferation, while treatment with the IGF1, PI3K/AKT or miR-181d
inhibitors decreased proliferation. (C) miR-181d regulated cellular
proliferation via the PI3K/AKT/mTOR pathway. *P<0.05,
**P<0.01, ***P<0.001, ****P<0.0001 vs. negative control.
miR, microRNA; IGF1, insulin like growth factor 1; p-,
phosphorylated. |
The proliferative abilities of the cells were
calculated, and it was demonstrated that proliferation was
increased after exposure to the miR-181d mimic (P=0.0001), but was
inhibited by treatment with the IGF1, PI3K/AKT and miR-181d
inhibitors (P<0.0001; Fig.
1B).
In addition, western blot analysis indicated that
the miR-181d mimic promoted the expression levels of phosphorylated
(p)-PI3K, p-AKT and p-mTOR (P=0.042, P=0.0127 and P=0.0058), while
the expression levels of PI3K, AKT and mTOR were unchanged in U251
cells. However, treatment with the IGF1 inhibitor (P=0.0028,
P<0.0001 and P=0.0147, respectively), the PI3K/AKT inhibitor
(P=0.0011, P<0.0001 and P=0.0055, respectively) and the miR-181d
inhibitor (P=0.0014, P=0.0003 and P=0.0009, respectively)
suppressed the expression levels of p-PI3K, p-AKT and p-mTOR
(Fig. 1C), thus suggesting that
miR-181d regulates cellular proliferation via the PI3K/AKT/mTOR
pathway.
miR-181d promotes cell cycle
progression via the IGF1/PI3K/AKT axis in U251 cells
The cell cycle profile of U251 cells was detected
using a flow cytometry-based assay. The proportions of cells in the
G0/G1 phase after treatment with negative
control, miR-181d mimic, IGF1 inhibitor, PI3K/AKT inhibitor and
miR-181d inhibitor were 43.04±1.43, 39.57±0.97, 64.92±1.85,
60.16±2.47 and 66.65±3.46%, respectively. Under these same
conditions, the proportions in S phase were 40.21±1.50, 43.61±1.03,
25.38±2.37, 28.49±1.64 and 24.79±2.32%, while the proportions in
G2/M phase were 16.75±1.55, 16.82±1.45, 9.70±1.05,
11.35±1.42 and 8.56±0.92%, respectively (Fig. 2A). Compared with the negative
control, the proportion of G0/G1 phase cells
in the miR-181d mimic group was decreased significant (P=0.0254),
while the proportions in the groups treated with the IGF1, PI3K/AKT
and miR-181d inhibitors were significantly increased (P<0.0001,
P=0.0005 and P=0.0004, respectively). In S phase, compared with the
negative control, the proportion of cells was significantly
increased in the miR-181d mimic group (P=0.0318), while the
proportions in the groups treated with the IGF1, PI3K/AKT and
miR-181d inhibitors were significantly reduced (P=0.0008 for all;
Fig. 2B).
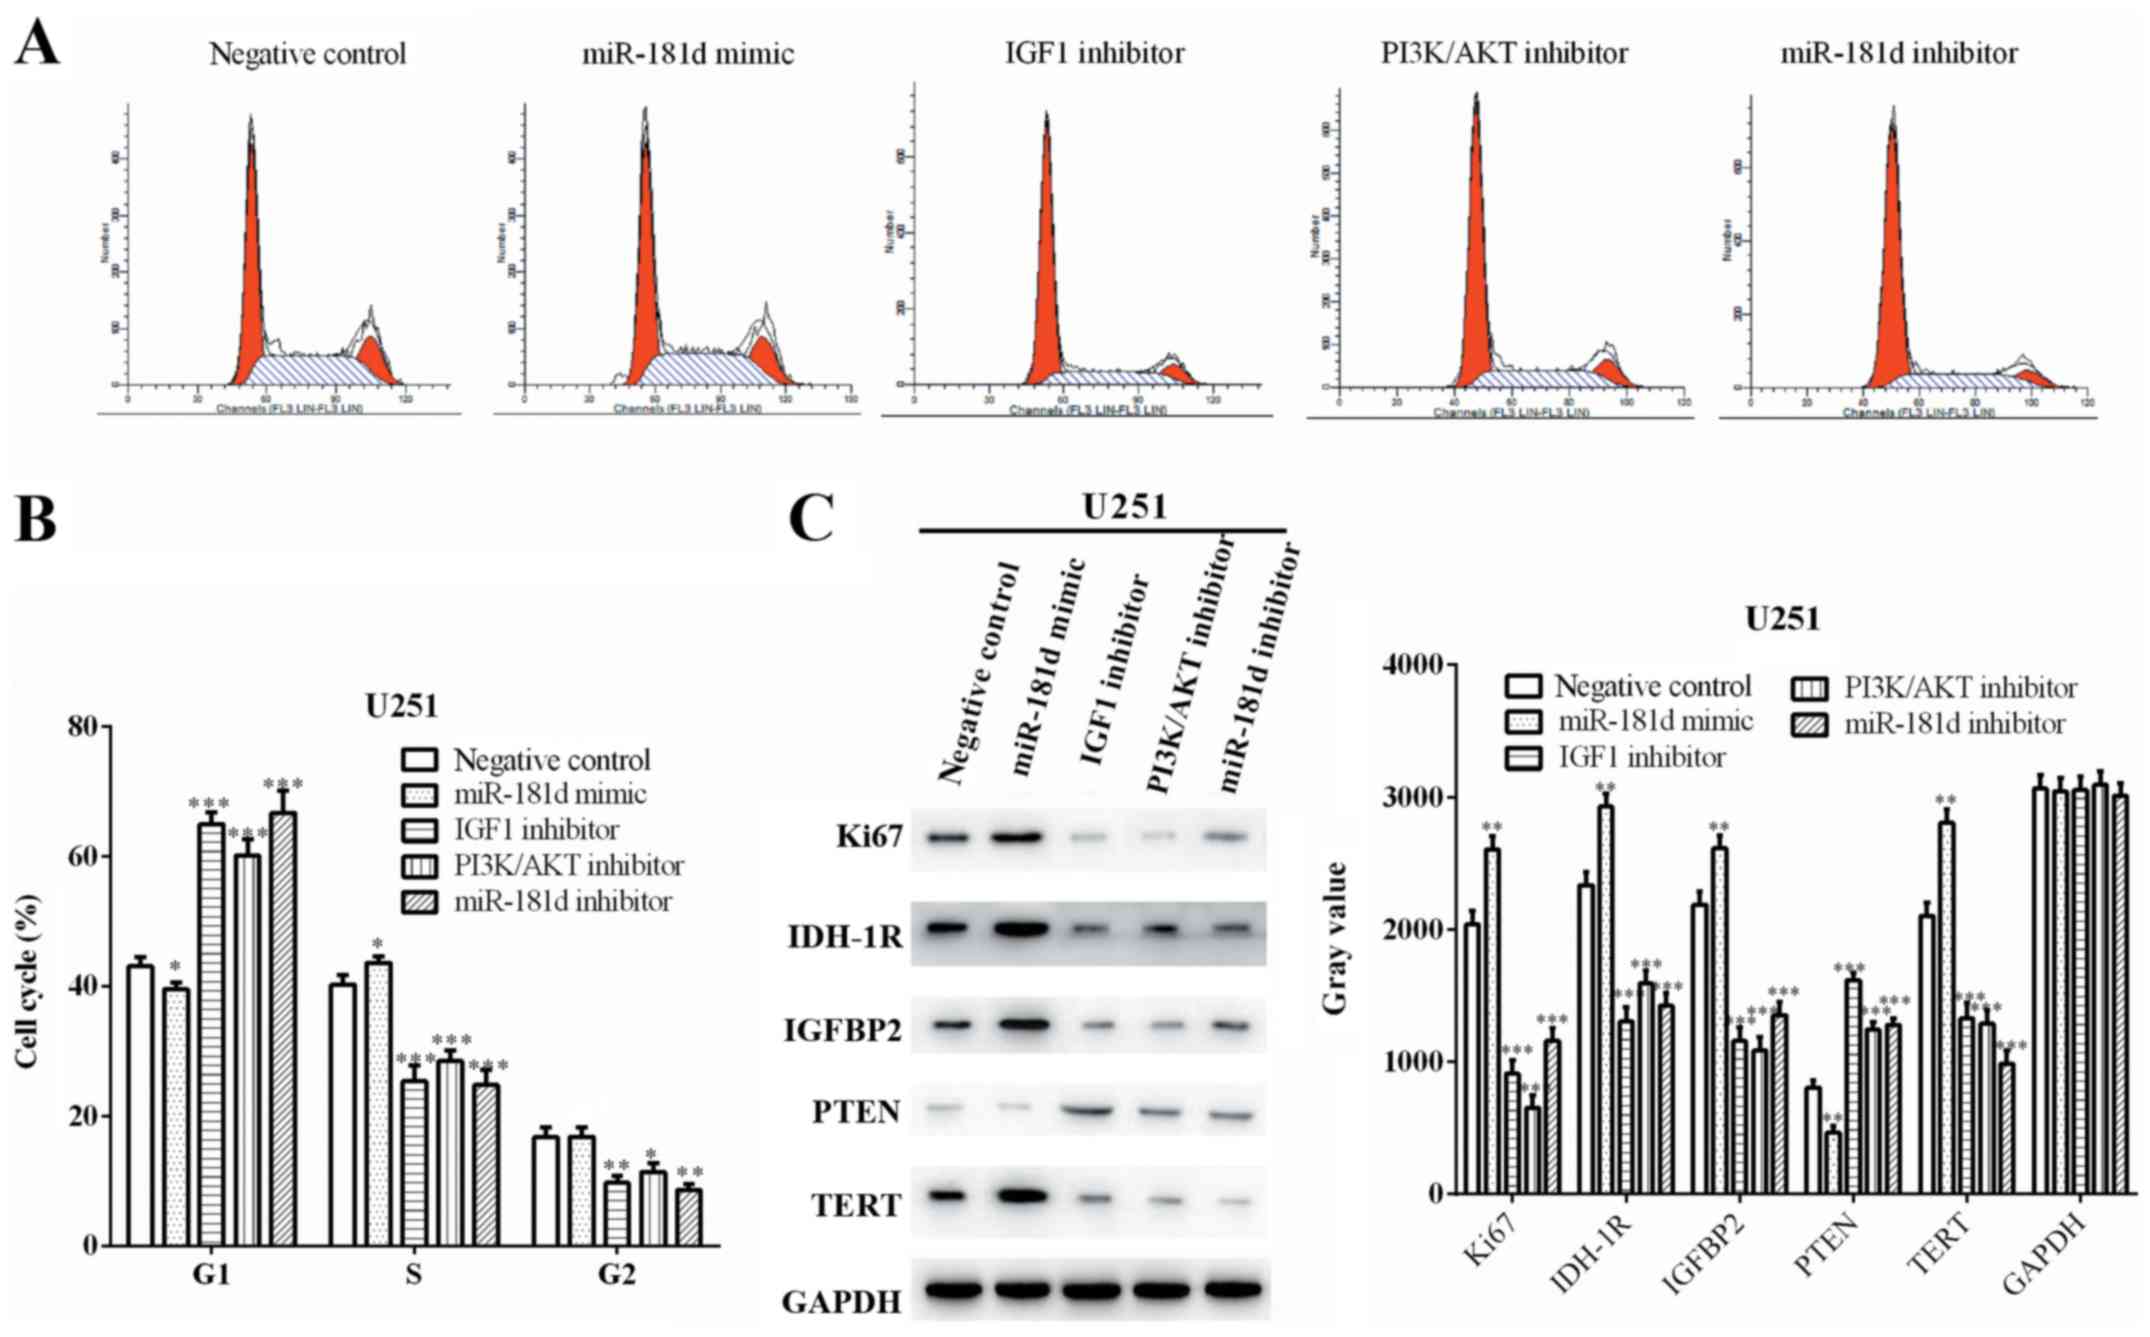 | Figure 2.miR-181d promotes cell cycle
progression via the IGF1/PI3K/AKT axis in U251 cells (A)
Distribution of cells within the stages of the cell cycle was
determined. (B) Cell distribution ratio for each period. (C)
miR-181d mimic, IGF1 inhibitor, PI3K/AKT inhibitor and miR-181d
inhibitor regulated the expression levels of Ki67, IDH-1R, IGFBP2,
TERT and PTEN. *P<0.05, **P<0.01, ***P<0.001 vs. negative
control. miR, microRNA; IGF1, insulin like growth factor 1; TERT,
telomerase reverse transcriptase; IDH-1R, isocitrate dehydrogenase
1 receptor; IGFBP2, insulin like growth factor binding protein
2. |
Proteins associated with cell cycle, including Ki67,
isocitrate dehydrogenase 1 receptor (IDH-1R), insulin like growth
factor binding protein 2 (IGFBP2), PTEN and telomerase reverse
transcriptase (TERT), were assessed by western blotting. The
expression levels of Ki67 (P=0.0023), IDH-1R (P=0.0019), IGFBP2
(P=0.0065) and TERT (P=0.0010) were enhanced by miR-181d mimic,
while the expression of PTEN was inhibited (P=0.0015). However, the
expression levels of Ki67 (P=0.0002, P<0.0001 and P=0.0004,
respectively), IDH-1R (P=0.0003, P=0.0008 and P=0.0004,
respectively), IGFBP2 (P=0.0002, P=0.0002 and P=0.0005,
respectively) and TERT (P=0.0007, P=0.0006 and P=0.0002,
respectively) were suppressed, but PTEN expression (P<0.0001,
P=0.0006 and P=0.0004, respectively) was increased by treatment
with the IGF1 inhibitor, PI3K/AKT inhibitor and miR-181d inhibitor
(Fig. 2C). Collectively, these
results suggested that the cell cycle was promoted by miR-181d via
the IGF1/PI3K/AKT pathway in U251 cells.
miR-181d inhibits cellular apoptosis
via the IGF1/PI3K/AKT axis in U251 cells
Flow cytometry was performed to investigate the
influence of miR-181d on apoptosis in U251 cells. The apoptotic
rates for the negative control, miR-181d mimic, IGF1 inhibitor,
PI3K/AKT inhibitor and miR-181d inhibitor groups were 7.08±0.56,
4.90±0.43, 22.22±0.74, 19.07±0.58 and 28.18±0.65, respectively
(Fig. 3A). Compared with the
negative control, the apoptotic rate was reduced (P=0.0059) by the
miR-181d mimic, but was increased by treatment with the IGF1,
PI3K/AKT and miR-181d inhibitors (P<0.0001 for all; Fig. 3B).
 | Figure 3.miR-181d inhibits cell apoptosis via
the IGF1/PI3K/AKT axis in U251 cells. (A) PI and Annexin-V double
staining and flow cytometric analysis was used to detect apoptosis
in U251 cells. (B) Compared with the negative control, the
apoptotic rate was reduced by miR-181d, but was increased by
treatment with the IGF1, PI3K/AKT and miR-181d inhibitors. (C)
miR-181d mimic, IGF1 inhibitor, PI3K/AKT inhibitor and miR-181d
inhibitor mediated the expression levels of Bcl2, Cyclin D, Cyclin
E, Caspase-3, Caspase-8 and Caspase-9 in U251 cells. *P<0.05,
**P<0.01, ***P<0.001. PI, propidium iodide; miR, microRNA;
IGF1, insulin like growth factor 1. |
Apoptotic-related proteins were assessed by western
blotting in U251 cells. It was indicated that the miR-181d mimic
increased the expression levels of Bcl2, Cyclin D and Cyclin E
(P=0.0011, P=0.0013 and P=0.0003, respectively), while it inhibited
the expression levels of Caspase-3, Caspase-8 and Caspase-9
(P=0.0073, P<0.0001 and P<0.0001, respectively) in U251
cells. However, cells transfected or treated with IGF1 inhibitor
(P=0.0002, P=0.0002 and P=0.0002; and P=0.0354, P=0.0038 and
P<0.0001, respectively), PI3K/AKT inhibitor (P=0.0004, P=0.0003
and P=0.0010; and P=0.0067, P=0.0030 and P<0.0001, respectively)
and miR-181d inhibitor (P=0.0001, P=0.0002 and P=0.0014; and
P=0.0016, P=0.0013 and P<0.0001, respectively) exhibited the
opposite trend (Fig. 3C). Thus,
the results suggested that miR-181d inhibited cellular apoptosis
via the IGF1/PI3K/AKT axis in U251 cells.
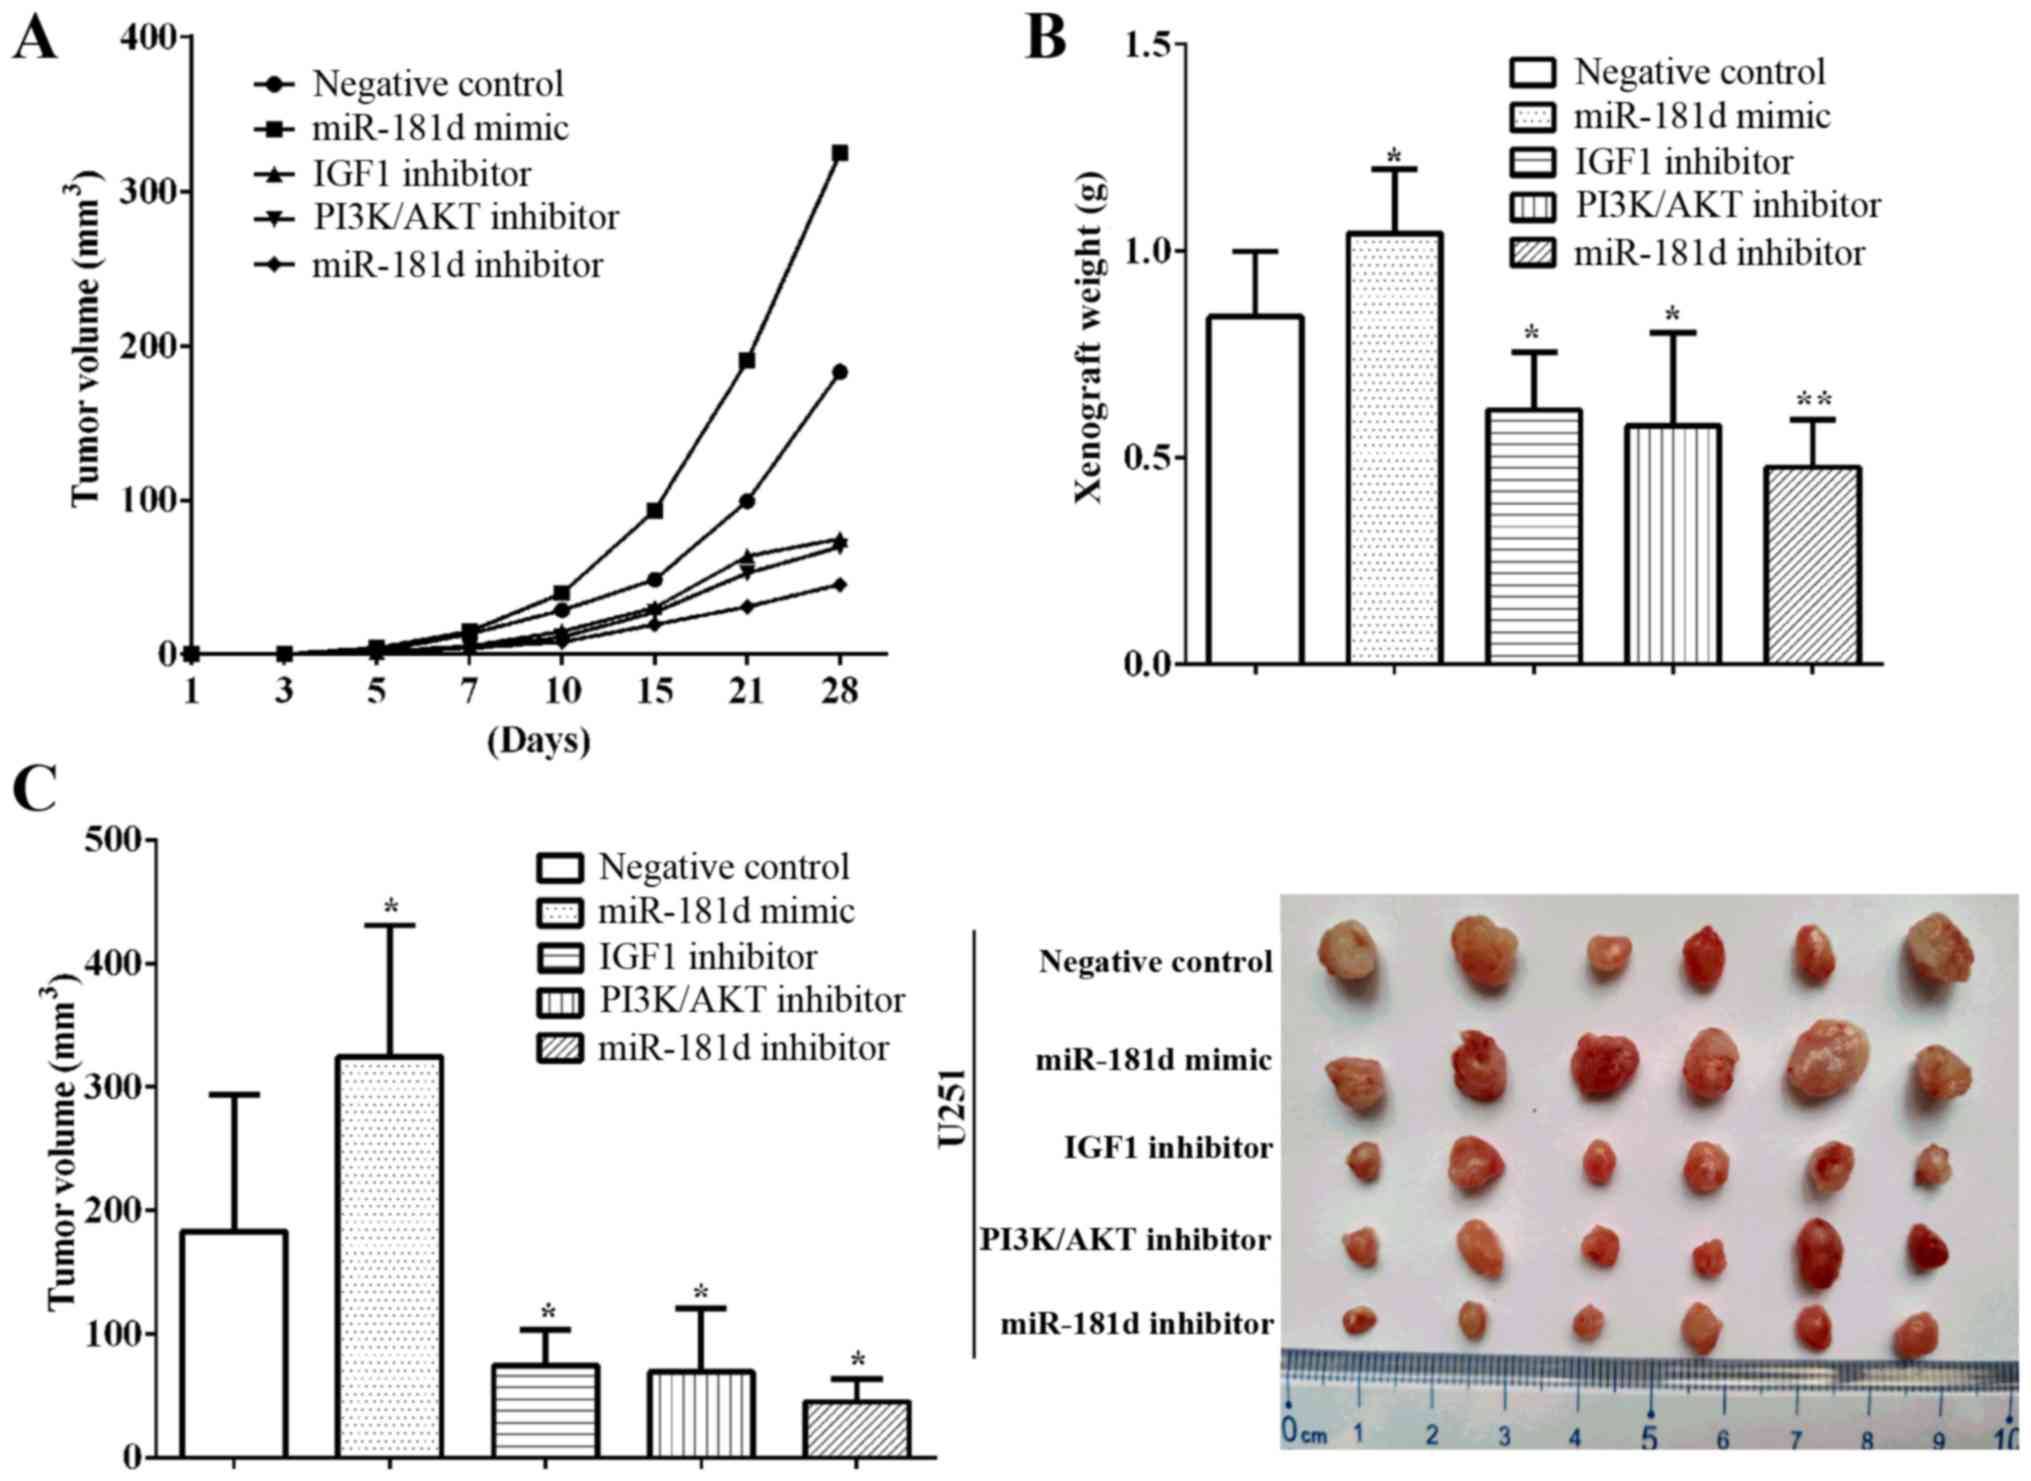
miR-181d enhances glioma xenograft
growth in vivo
To determine if miR-181d regulated the growth of
glioma xenografts via the IGF1/PI3K/AKT axis, U251 cells were
subcutaneously injected into nude mice. Xenograft growth was
promoted by the miR-181d mimic, but was inhibited by treatment with
the IGF1, PI3K/AKT and miR-181d inhibitors (Fig. 4A). Moreover, xenograft weights were
calculated, and it was observed that the weights in the miR-181d
mimic group were higher compared with the negative control
(P=0.0471). The xenograft weights were also decreased in the IGF1
inhibitor (P=0.0430), PI3K/AKT inhibitor (P=0.0459) and miR-181d
inhibitor (P=0.0232) groups (Fig.
4B). In addition, the xenograft volumes was significantly
increased in the miR-181d mimic group (P=0.0479), but significantly
decreased in the IGF1 inhibitor (P=0.0267), PI3K/AKT inhibitor
(P=0.0411) and miR-181d inhibitor groups (P=0.0011) compared with
the negative group (Fig. 4C). The
maximum diameter of the tumors in the miR-181d mimic group was
higher compared with the negative control group, while those in the
IGF1 inhibitor and miR-181d inhibitor groups were lower (Fig. S2).
miR-181d promotes cell cycle
progression and suppresses cellular apoptosis in glioma xenograft
tissues
To assess whether miR-181d mediated cell cycle
progression via the IGF1/PI3K/AKT axis, the xenograft tissues were
lysed using RIPA to obtain total proteins. Similar to the in
vitro experiments, the miR-181d mimic enhanced the expression
of IGF1 (P=0.0002), while treatment with the IGF1 inhibitor
(P=0.0012), PI3K/AKT inhibitor (P=0.0021) and miR-181d inhibitor
(P=0.0002) reduced the expression of IGF1 (Fig. 5A).
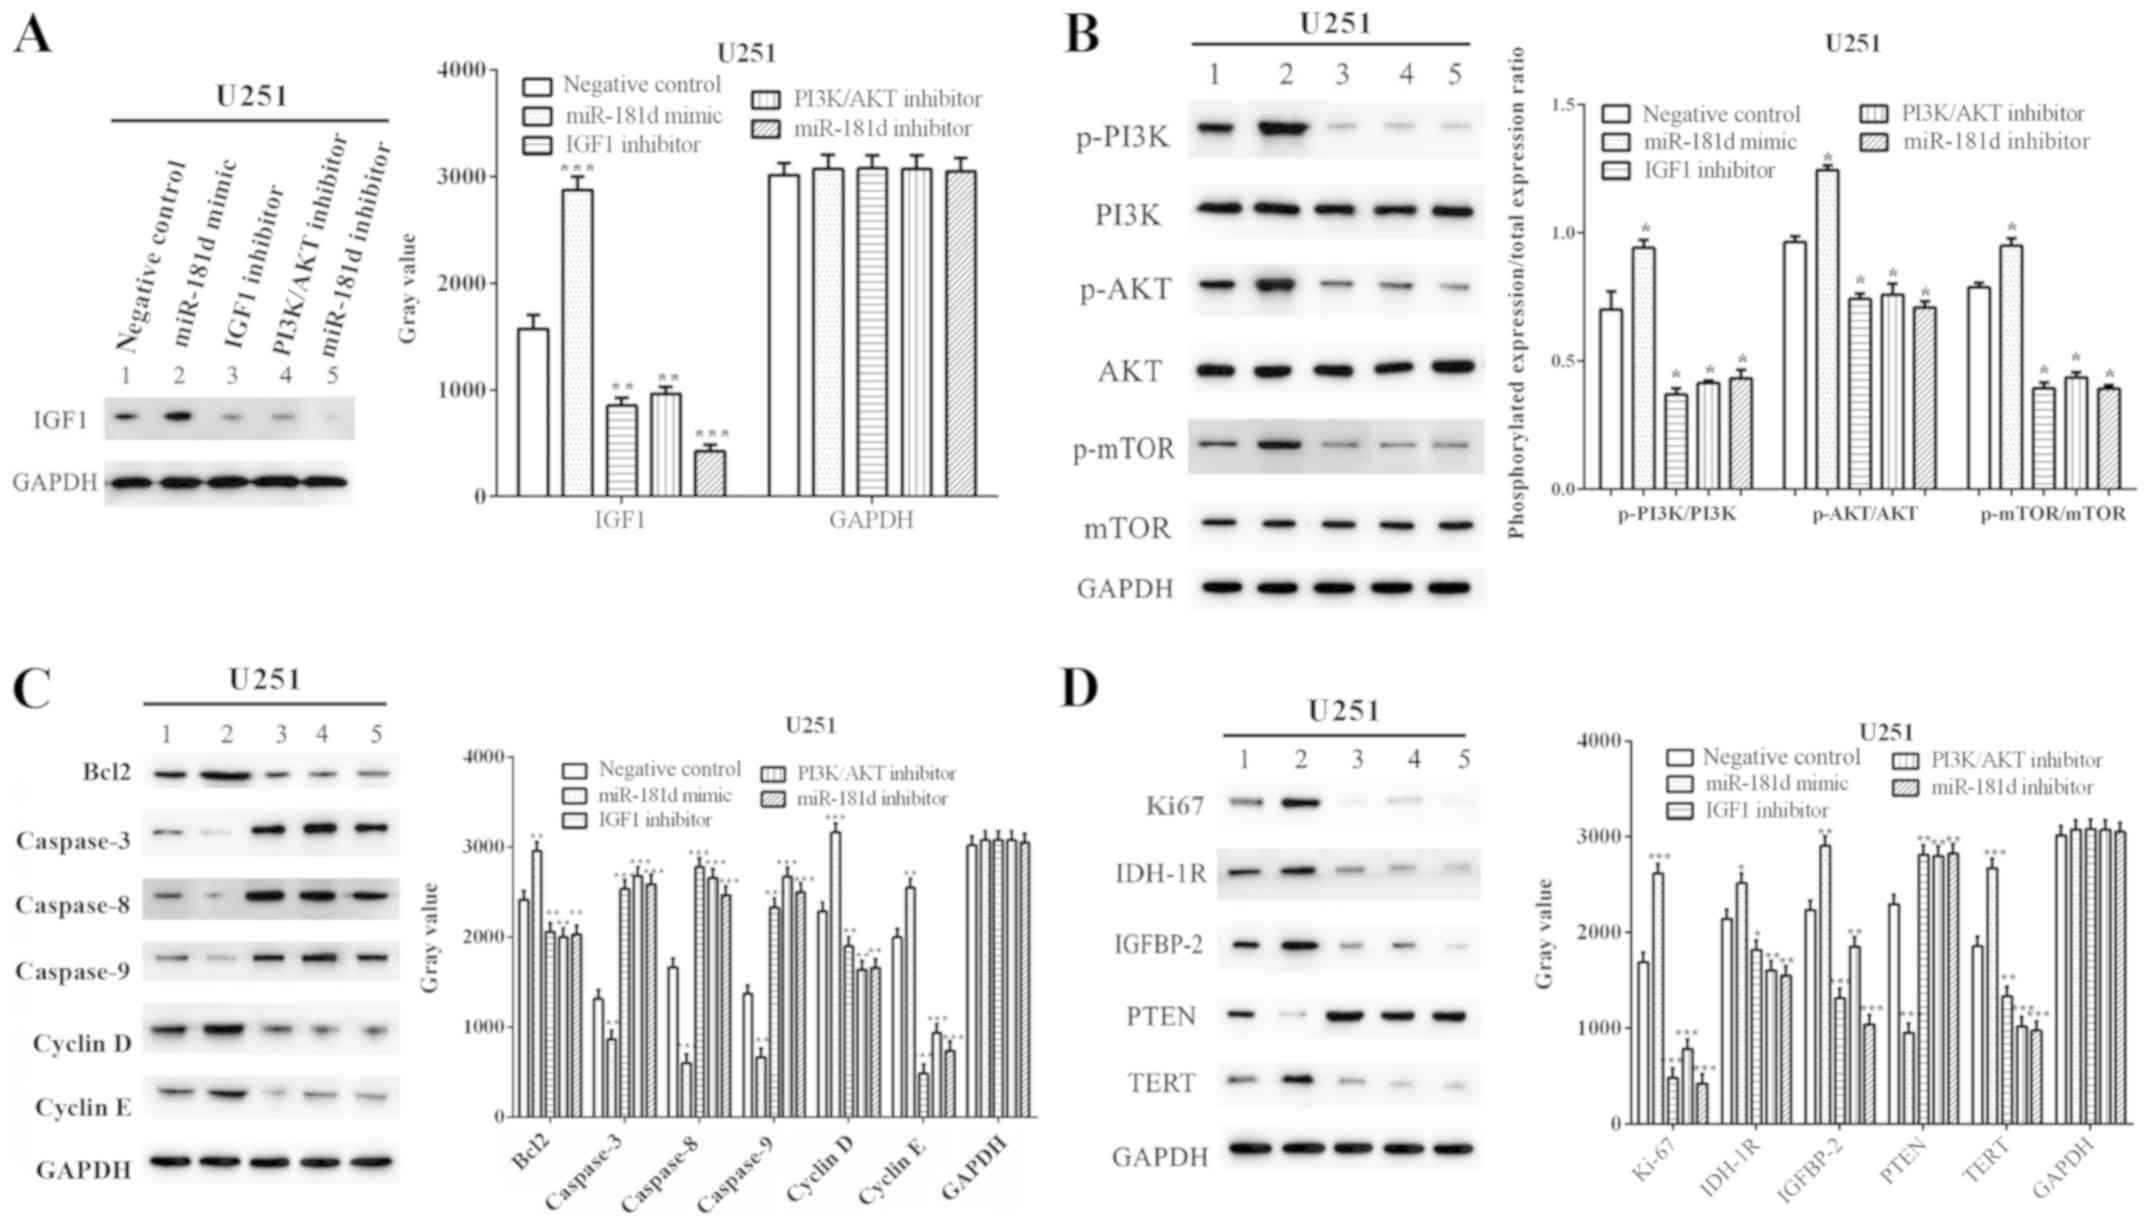 | Figure 5.miR-181d promotes cell cycle
progression and suppresses cellular apoptosis in glioma xenograft
tissues. (A) miR-181d mimic enhanced the expression of IGF1, while
treatment with the IGF1, PI3K/AKT and miR-181d inhibitors reduced
the expression of IGF1. (B) miR-181d mimic enhanced the
PI3K/AKT/mTOR pathway, while this pathway was inhibited by
treatment with the IGF1 inhibitor, PI3K/AKT inhibitor and miR-181d
inhibitor. (C) miR-181d decreased cellular apoptosis in glioma
xenograft tissues via the IGF1/PI3K/AKT axis. (D) miR-181d promoted
cell cycle progression in glioma xenograft tissues via the
IGF1/PI3K/AKT axis. *P<0.05, **P<0.01, ***P<0.001 vs.
negative control. miR, microRNA; IGF1, insulin like growth factor
1; p-, phosphorylated; TERT, telomerase reverse transcriptase;
IDH-1R, isocitrate dehydrogenase 1 receptor; IGFBP2, insulin like
growth factor binding protein 2. |
With regards to the proteins in the PI3K/AKT/mTOR
signaling pathway, the expression levels of p-PI3K, p-AKT and
p-mTOR were increased by treatment with the miR-181d mimic
(P=0.0041, P=0.0025 and P=0.0224, respectively). However, these
were reduced by treatment with the IGF1 inhibitor (P=0.0001,
P=0.0042 and P=0.0003), PI3K/AKT inhibitor (P=0.0001, P=0.0061 and
P=0.0005) and miR-181d inhibitor (P=0.0001, P=0.0020 and P=0.00032;
Fig. 5B).
The proteins associated with apoptosis were
evaluated by western blotting. The expression levels of Bcl2,
Cyclin D and Cyclin E were increased (P=0.0026, P=0.0004 and
P=0.0025), while Caspase-3, Caspase-8 and Caspase-9 expression
levels were decreased (P=0.0054, P=0.0002 and P=0.0010) in U251
cells transfected with miR-181d mimic. In contrast, treatment with
the IGF1, PI3K/AKT and miR-181d inhibitors reduced the expression
levels of Bcl2 (P=0.0090, P=0.0072 and P=0.0095, respectively),
Cyclin D (P=0.0092, P=0.0014 and P=0.0016) and Cyclin E
(P<0.0001, P=0.0002 and P=0.0001), while treatment increased the
expression levels of Caspase-3 (P=0.0001, P<0.0001 and
P<0.0001), Caspase-8 (P=0.0002, P=0.0003 and P=0.0006) and
Caspase-9 (P=0.0003, P<0.0001 and P=0.0002) in U251 cells
(Fig. 5C). Therefore, the results
suggested that miR-181d inhibited cell apoptosis via the
IGF1/PI3K/AKT axis.
For the cell cycle-related proteins, the miR-181d
mimic increased the expression levels of Ki67, IDH-1R, IGFBP2 and
TERT (P=0.0003, 0.0103, 0.0012 and 0.0006, respectively), but
decreased the expression of PTEN (P<0.0001). However, the
expression levels of Ki67 (P=0.0001, P=0.0004 and P=0.0001,
respectively), IDH-1R (P=0.0161, P=0.0027 and P=0.0019,
respectively), IGFBP2 (P=0.0003, P=0.0092 and P=0.0001,
respectively) and TERT (P=0.0030, P=0.0005 and P=0.0004,
respectively) were reduced by treatment with the IGF1, PI3K/AKT and
miR-181d inhibitors, while PTEN expression was increased (P=0.0033,
P=0.0036 and P=0.0030, respectively; Fig. 5D).
Discussion
Glioma is a common brain tumor, most commonly caused
by genetic abnormalities, with an incidence rate of 3–8 cases per
100,000 worldwide (2). Thus, it is
important to investigate novel biomarkers that could be useful for
the early diagnosis and treatment of glioma. miRNAs regulate gene
expression and protein degradation by binding to the complementary
DNA sequences on the 3′untranslated regions of the target mRNAs
(7,8). A previous study reported that
miR-181d mediated the proliferation, as well as promoted the
maturation of dendritic cells (30). Moreover, the present results
indicated that miR-181d promoted the expression of IGF1, cellular
proliferation and the growth of glioma xenografts.
Ho et al (31) revealed that miR-181d was negatively
correlated with the expression of IGF1 in glioma cells. In
addition, Chen et al (32)
demonstrated that the IGF1/PI3K/AKT pathway was involved in
drug-induced cell progression in breast cancer. To investigate
whether miR-181d regulated cellular progression via the
IGF1/PI3K/AKT axis, the present study assessed cell proliferation,
cell cycle progression and cellular apoptosis after treatment with
IGF1, PI3K/AKT andmiR-181d inhibitors. Consistent with previous
findings (31,32), treatment with the IGF1 and PI3K/AKT
inhibitors suppressed the proliferative ability and inhibited the
PI3K/AKT/mTOR pathway in U251 cells. Zhang et al (33) reported that miR-181d promoted cell
cycle progression in uveal melanoma. In line with this finding, the
present results suggested that miR-181d promoted cell cycle
progression, while treatment with IGF1 or PI3K/AKT inhibitors
suppressed cell cycle progression in U251 cells. In addition,
miR-181d mimic inhibited apoptosis while treatment with an IGF1
inhibitor and a PI3K/AKT inhibitor promoted apoptosis in U251
cells. A xenograft model was constructed to assess these results
in vivo, and it was observed that the growth of glioma
xenografts was improved by miR-181d mimic, while it was suppressed
by treatment with IGF1 or PI3K/AKT inhibitors.
In conclusion, the present results indicated that
miR-181d promoted cellular proliferation via the PI3K/AKT/mTOR
signaling pathway in both U251 cells and xenograft tissues.
Furthermore, miR-181d promoted cell cycle progression and
suppressed apoptosis via the IGF1/PI3K/AKT axis in xenograft
tissues derived from U251 cells. It was also demonstrated that
miR-181d enhanced the growth of glioma xenografts in
vivo.
Supplementary Material
Supporting Data
Acknowledgements
Not applicable.
Funding
The current study was supported by grants from the
National Natural Science Foundation of China (grant nos. 81572489
and 81372683) and the Hubei Province Health and Family Planning
Scientific Research Project (grant no. WJ2007Q008).
Availability of data and materials
The datasets used and/or analyzed during the current
study are available from the corresponding author on reasonable
request.
Authors' contributions
QC and BL contributed to the conception of the study
and analyzed the data. DT performed the experiments and wrote the
manuscript. WG, JY and JL analyzed the data and wrote the
manuscript. JZ and JG analyzed the data and provided constructive
criticism. All authors read and approved the final manuscript.
Ethics approval and consent to
participate
All animal experiments were approved by the Renmin
Hospital of Wuhan University Animal Care and Use Committee
(approval no. 20180908).
Patient consent for publication
Not applicable.
Competing interests
The authors declare that they have no competing
interests.
References
|
1
|
Furnari FB, Fenton T, Bachoo RM, Mukasa A,
Stommel JM, Stegh A, Hahn WC, Ligon KL, Louis DN, Brennan C, et al:
Malignant astrocytic glioma: Genetics, biology, and paths to
treatment. Genes Dev. 21:2683–2710. 2007. View Article : Google Scholar : PubMed/NCBI
|
|
2
|
Sayegh ET, Kaur G, Bloch O and Parsa AT:
Systematic review of protein biomarkers of invasive behavior in
glioblastoma. Mol Neurobiol. 49:1212–1244. 2014. View Article : Google Scholar : PubMed/NCBI
|
|
3
|
Jemal A, Bray F, Center MM, Ferlay J, Ward
E and Forman D: Global cancer statistics. CA Cancer J Clin.
61:69–90. 2011. View Article : Google Scholar : PubMed/NCBI
|
|
4
|
Kim GW, Lee DH, Yeon SK, Jeon YH, Yoo J,
Lee SW and Kwon SH: Temozolomide-resistant glioblastoma depends on
HDAC6 activity through regulation of DNA mismatch repair.
Anticancer Res. 39:6731–6741. 2019. View Article : Google Scholar : PubMed/NCBI
|
|
5
|
Linz U: Commentary on effects of
radiotherapy with concomitant and adjuvant temozolomide versus
radiotherapy alone on survival in glioblastoma in a randomised
phase III study: 5-year analysis of the EORTC-NCIC trial (Lancet
Oncol. 2009; 10: 459–466). 2009; 10: 459–466). Cancer.
116:1844–1846. 2010. View Article : Google Scholar : PubMed/NCBI
|
|
6
|
Stupp R, Mason WP, van den Bent MJ, Weller
M, Fisher B, Taphoorn MJB, Belanger K, Brandes AA, Marosi C,
Bogdahn U, et al: Radiotherapy plus concomitant and adjuvant
temozolomide for glioblastoma. N Engl J Med. 352:987–996. 2005.
View Article : Google Scholar : PubMed/NCBI
|
|
7
|
Lai EC: Micro RNAs are complementary to
3′UTR sequence motifs that mediate negative post-transcriptional
regulation. Nat Genet. 30:363–364. 2002. View Article : Google Scholar : PubMed/NCBI
|
|
8
|
Bartel DP: MicroRNAs: Genomics,
biogenesis, mechanism, and function. Cell. 116:281–297. 2004.
View Article : Google Scholar : PubMed/NCBI
|
|
9
|
Adams BD, Kasinski A and Slack FJ:
Aberrant regulation and function of microRNAs in cancer. Curr Biol.
24:R762–R776. 2014. View Article : Google Scholar : PubMed/NCBI
|
|
10
|
Cowland JB, Hother C and Grønbaek K:
MicroRNAs and cancer. APMIS. 115:1090–1106. 2007. View Article : Google Scholar : PubMed/NCBI
|
|
11
|
Chen H, Liu T, Liu J, Feng Y, Wang B, Wang
J, Bai J, Zhao W, Shen Y, Wang X, et al: Circ-ANAPC7 is upregulated
in acute myeloid leukemia and appears to target the MiR-181 family.
Cell Physiol Biochem. 47:1998–2007. 2018. View Article : Google Scholar : PubMed/NCBI
|
|
12
|
Xia S, Tian H, Fan L and Zheng J:
Peripheral blood miR-181-5p serves as a marker for screening
patients with osteoarthritis by targeting TNFα. Clin Lab.
63:1819–1825. 2017. View Article : Google Scholar : PubMed/NCBI
|
|
13
|
Zhu W, Shan X, Wang T, Shu Y and Liu P:
miR-181b modulates multidrug resistance by targeting BCL2 in human
cancer cell lines. Int J Cancer. 127:2520–2529. 2010. View Article : Google Scholar : PubMed/NCBI
|
|
14
|
Guo X, Zhu Y and Hong X, Zhang M, Qiu X,
Wang Z, Qi Z and Hong X: miR-181d and c-myc-mediated inhibition of
CRY2 and FBXL3 reprograms metabolism in colorectal cancer. Cell
Death Dis. 8:e29582017. View Article : Google Scholar : PubMed/NCBI
|
|
15
|
Wang XF, Shi ZM, Wang XR, Cao L, Wang YY,
Zhang JX, Yin Y, Luo H, Kang CS, Liu N, et al: MiR-181d acts as a
tumor suppressor in glioma by targeting K-ras and Bcl-2. J Cancer
Res Clin Oncol. 138:573–584. 2012. View Article : Google Scholar : PubMed/NCBI
|
|
16
|
Zhang W, Zhang J, Hoadley K, Kushwaha D,
Ramakrishnan V, Li S, Kang C, You Y, Jiang C, Song SW, et al:
miR-181d: A predictive glioblastoma biomarker that downregulates
MGMT expression. Neuro Oncol. 14:712–719. 2012. View Article : Google Scholar : PubMed/NCBI
|
|
17
|
Chen YY, Ho HL, Lin SC, Ho TDH and Hsu CY:
Upregulation of miR-125b, miR-181d, and miR-221 predicts poor
prognosis in MGMT promoter-unmethylated glioblastoma patients. Am J
Clin Pathol. 149:412–417. 2018. View Article : Google Scholar : PubMed/NCBI
|
|
18
|
Allard JB and Duan C: IGF-binding
proteins: Why do they exist and why are there so many? Front
Endocrinol (Lausanne). 9:1172018. View Article : Google Scholar : PubMed/NCBI
|
|
19
|
Duan C, Ren H and Gao S: Insulin-like
growth factors (IGFs), IGF receptors, and IGF-binding proteins:
Roles in skeletal muscle growth and differentiation. Gen Comp
Endocrinol. 167:344–351. 2010. View Article : Google Scholar : PubMed/NCBI
|
|
20
|
Nielsen EM, Hansen L, Lajer M, Andersen
KL, Echwald SM, Urhammer SA, Hansen T and Pedersen O: A common
polymorphism in the promoter of the IGF-I gene associates with
increased fasting serum triglyceride levels in glucose-tolerant
subjects. Clin Biochem. 37:660–665. 2004. View Article : Google Scholar : PubMed/NCBI
|
|
21
|
Li Z, Pan W, Shen Y, Chen Z, Zhang L,
Zhang Y, Luo Q and Ying X: IGF1/IGF1R and microRNA let-7e
down-regulate each other and modulate proliferation and migration
of colorectal cancer cells. Cell Cycle. 17:1212–1219. 2018.
View Article : Google Scholar : PubMed/NCBI
|
|
22
|
Wang H, Tang C, Na M, Ma W, Jiang Z, Gu Y,
Ma G, Ge H, Shen H and Lin Z: miR-422a inhibits glioma
proliferation and invasion by targeting IGF1 and IGF1R. Oncol Res.
25:187–194. 2017. View Article : Google Scholar : PubMed/NCBI
|
|
23
|
LoRusso PM: Inhibition of the
PI3K/AKT/mTOR pathway in solid tumors. J Clin Oncol. 34:3803–3815.
2016. View Article : Google Scholar : PubMed/NCBI
|
|
24
|
Chen B, Xue Z, Yang G, Shi B, Yang B, Yan
Y, Wang X, Han D, Huang Y and Dong W: Akt-signal integration is
involved in the differentiation of embryonal carcinoma cells. PLoS
One. 8:e648772013. View Article : Google Scholar : PubMed/NCBI
|
|
25
|
Saiki S, Sasazawa Y, Imamichi Y, Kawajiri
S, Fujimaki T, Tanida I, Kobayashi H, Sato F, Sato S, Ishikawa KI,
et al: Caffeine induces apoptosis by enhancement of autophagy via
PI3K/Akt/mTOR/p70S6K inhibition. Autophagy. 7:176–187. 2011.
View Article : Google Scholar : PubMed/NCBI
|
|
26
|
Liu G, Zhao X, Zhou J, Cheng X, Ye Z and
Ji Z: LncRNA TP73-AS1 promotes cell proliferation and inhibits cell
apoptosis in clear cell renal cell carcinoma through repressing
KISS1 expression and inactivation of PI3K/Akt/mTOR signaling
pathway. Cell Physiol Biochem. 48:371–384. 2018. View Article : Google Scholar : PubMed/NCBI
|
|
27
|
Ye R, Dai N, He Q, Guo P, Xiang Y and
Zhang Q, Hong Z and Zhang Q: Comprehensive anti-tumor effect of
Brusatol through inhibition of cell viability and promotion of
apoptosis caused by autophagy via the PI3K/Akt/mTOR pathway in
hepatocellular carcinoma. Biomed Pharmacother. 105:962–973. 2018.
View Article : Google Scholar : PubMed/NCBI
|
|
28
|
Dai Z, Wang L, Wang X, Zhao B, Zhao W,
Bhardwaj SS, Ye J, Yin Z, Zhang J and Zhao S: Oxymatrine induces
cell cycle arrest and apoptosis and suppresses the invasion of
human glioblastoma cells through the EGFR/PI3K/Akt/mTOR signaling
pathway and STAT3. Oncol Rep. 40:867–876. 2018.PubMed/NCBI
|
|
29
|
National Research Council (US) Committee
on Recognition and Alleviation of Pain in Laboratory Animals, .
Recognition and alleviation of pain in laboratory animals.
Washington (DC): National Academies Press (US); 2009
|
|
30
|
Su XW, Lu G, Leung CK, Liu Q, Li Y, Tsang
KS, Zhao SD, Chan DTM, Kung HF and Poon WS: miR-181d regulates
human dendritic cell maturation through NF-κB pathway. Cell Prolif.
50:e123582017. View Article : Google Scholar
|
|
31
|
Ho KH, Chen PH, His E, Shih CM, Chang WC,
Cheng CH, Lin CW and Chen KC: Identification of IGF-1-enhanced
cytokine expressions targeted by miR-181d in glioblastomas via an
integrative miRNA/mRNA regulatory network analysis. Sci Rep.
7:7322017. View Article : Google Scholar : PubMed/NCBI
|
|
32
|
Chen J, Zeng J, Xin M, Huang W and Chen X:
Formononetin induces cell cycle arrest of human breast cancer cells
via IGF1/PI3K/Akt pathways in vitro and in vivo. Horm Metab Res.
43:681–686. 2011. View Article : Google Scholar : PubMed/NCBI
|
|
33
|
Zhang L, He X, Li F, Pan H, Huang X, Wen
X, Zhang H, Li B, Ge S, Xu X, et al: The miR-181 family promotes
cell cycle by targeting CTDSPL, a phosphatase-like tumor suppressor
in uveal melanoma. J Exp Clin Cancer Res. 37:152018. View Article : Google Scholar : PubMed/NCBI
|