Introduction
Preeclampsia (PE), characterized by hypertension and
proteinuria, is a pregnancy-specific disease that can cause foetal
intrauterine growth restriction and premature birth (1). PE can be accompanied by eclampsia,
uncontrolled hypertension or systemic inflammation (2) and has become the leading cause of
maternal mortality in the United States (3). PE is closely associated with genetic
background, and the only cure for PE is delivering the foetus and
placenta (4). Early-onset PE
(EOPE) is PE diagnosed before 34 weeks of gestation (5). Compared with late-onset PE (LOPE),
EOPE has a higher mortality rate (6) and more often leads to foetal growth
restriction (7).
MicroRNAs (miRNAs/miRs) are small non-coding
single-stranded RNAs that play important roles in a number of
diseases, such as malignant tumours (8) and cardiovascular diseases (9). miRNAs can bind to target genes and
thereby inhibit the translation of target genes or promote the
degradation of mRNAs. The analysis of miRNA-mRNA regulatory
networks has provided novel insights into the pathogenesis of
various diseases. For instance, Wang et al (10) discovered that miR-223-3p can
relieve spinal cord injury via negatively regulating the expression
of receptor-interacting protein 3.
Microarray technology is useful for detecting the
expression of genes and non-coding RNAs in a high-throughput manner
(11). Microarray technology has
been widely employed in studying transcriptional alterations in
various diseases. For example, Huang et al (12) studied traumatic brain
injury-related genes with gene expression microarray analysis. Tan
et al (13) utilized a
miRNA expression microarray assay to identify miR-302b-3p as
regulator of skin fibroblast senescence.
Given the large amounts of data generated by
microarray experiments, integrated analyses yield information of
greater confidence and content than each experiment individually
(14). In the current study, a
comprehensive strategy was employed to analyse gene and miRNA
expression microarray data concerning EOPE. The aim of the present
study was to discover novel biomarkers for EOPE diagnosis and new
targets for EOPE treatment, and to reveal a potential miRNA-mRNA
regulatory network contributing to the pathogenesis of EOPE.
Materials and methods
Microarray data collection
‘Early onset preeclampsia’ was used as key word to
search the Gene Expression Omnibus (GEO, http://www.ncbi.nlm.nih.gov/geo/) database (15). The inclusion criterion for a GEO
series was the inclusion of microarray data of placenta tissues
from patients with EOPE and healthy controls. Normalized expression
matrixes of GSE103542, GSE74341 and GSE44711 (presented in Table I) were downloaded for further
study.
 | Table I.Details of the microarrays used. |
Table I.
Details of the microarrays used.
| GEO series
number | Healthy controls,
n | Patients with EOPE,
n | Tissue | Platform |
|---|
| GSE103542 | 8 | 11 | Placenta | GPL23980, miRLink
microRNA Arrays v. 16 |
| GSE74341 | 5 | 7 | Placenta | GPL16699,
Agilent-039494 SurePrint G3 Human |
|
|
|
|
| GE v2 8×60K
Microarray 039381 (Feature number version) |
| GSE44711 | 8 | 8 | Placenta | GPL10558, Illumina
HumanHT-12 v4.0 Expression Beadchip |
Identification of differentially
expressed genes (DEGs)
The expression matrixes of GSE74341 and GSE44711
were annotated with official gene symbols and then merged by common
gene symbols. RankProd (v3.12.0) (16) is an R package that employs the rank
product method to identify DEGs with application in microarray data
meta-analysis. The R package metaMA (v3.1.2) (17) combines either P-values or modified
effect sizes across different platforms to identify DEGs. The
merged expression matrix was entered into each of the RankProd and
metaMA pipelines. The criteria for identifying a gene as a DEG was
|[fold-change (FC)]|>2 and percentage of false prediction
(pfp)<0.05 (RankProd method) or false discovery rate
(FDR)<0.05 (metaMA method). A Venn diagram of DEGs identified by
RankProd and metaMA was then plotted with using InteractiVenn
(http://www.interactivenn.net/) (18). Genes identified as DEGs by both
RankProd and metaMA were deemed DEGs for the purposes of the
present study. The clustering heat maps of DEGs were plotted using
the pheatmap R package (v1.0.12) (19).
Functional annotation of DEGs
The online Database for Annotation, Visualization
and Integrated Discovery (DAVID, v6.8, http://david.ncifcrf.gov/) (20,21)
was used for Gene Ontology (GO) (22,23)
and Kyoto Encyclopedia of Genes and Genomes (KEGG) (24) pathway enrichment analyses of the
DEGs.
Construction of a protein-protein
interaction (PPI) network
The list of DEGs was uploaded to the Search Tool for
the Retrieval of Interacting Genes/Proteins (STRING, v11.0,
http://string-db.org/) (25) database to construct the PPI network
with the minimum required interaction score set as medium
confidence (0.400). The PPI network was visualized and analysed
using Cytoscape (v3.7.1) (26),
and important gene modules were identified with the Cytoscape
plugin MCODE (27).
Identification of differentially
expressed miRNAs (DEMs)
The expression matrix of GSE103542 was processed
with the R package limma (v3.44.3) (28), according to the developer's manual.
DEMs were defined according to |log2FC|>2 and P<0.05. A
volcano plot of the log2(FC) and P-value of miRNAs was
plotted using the ggplot2 R package (v3.3.2) (29).
Construction of a DEM-target DEG
connection network
Target genes of DEMs were predicted using the
miRNAtap R package (v1.22.0) (30), which integrates data from the
PicTar, DIANA, TargetScan, miRanda and miRDB databases as
previously described (31). Common
genes between upregulated DEGs and target genes of downregulated
DEMs were deemed predicted target DEGs of downregulated DEMs.
Similarly, overlapping genes between downregulated DEGs and target
genes of upregulated DEMs were deemed predicted target DEGs of
upregulated DEMs. The DEM-target DEG network was constructed using
the software Cytoscape (v3.7.1).
Sample collection
All samples were collected from pregnant women who
gave birth in The Women's Hospital of Nanjing Medical University
from January 2019 to December 2019. The criteria for EOPE
designation were hypertension (blood pressure (>140/90 mmHg),
proteinuria (≥300 mg/d) and being diagnosed prior to 34 weeks of
gestation (1,32). The exclusion criteria included
diabetes, gestational diabetes, pre-existing hypertension,
congenital anomalies, infection and alcohol/drug use. Healthy
matched women with no complications were recruited as controls.
Clinical information of patients with EOPE and healthy controls is
listed in Table II. All women
participating in the study signed informed consent for the
collection of placenta tissues and clinical information. This
research was approved by Human Research Ethics Committee of The
Women's Hospital of Nanjing Medical University (Nanjing, China;
approval no. KY-024).
| Table II.Clinical information of the patients
with EOPE (n=30) and NCs (n=29). |
Table II.
Clinical information of the patients
with EOPE (n=30) and NCs (n=29).
| Clinical
characteristics | NC | EOPE |
|---|
| Maternal age,
years | 28.0±1.8 | 27.3±2.1 |
| Pregestational BMI,
kg/m2 | 21.3±2.1 | 22.6±1.3 |
| SBP, mmHg | 122.5±5.2 |
161.0±3.6a |
| DBP, mmHg | 76.0±5.1 |
112.7±3.2a |
| Proteinuria, mg/24
h | Not tested | 3,065.3±387.3 |
| Gestational age at
diagnosis, weeks | N/A | 31.0±1.0 |
| Gestational age at
delivery, weeks | 36.0±1.4 | 35.0±1.0 |
| Neonate birth
weight, g | 3,007.5±216.3 | 2,677.0±147.5 |
Reverse transcription-quantitative
polymerase chain reaction (RT-qPCR)
Placenta tissues were dissolved in
TRIzol® reagent (cat. no. 93289; Sigma-Aldrich; Merck
KGaA), and then RNA was extracted using the RNAprep pure Tissue Kit
(cat. no. DP431; Tiangen Biotech Co., Ltd.) according to the
manufacturer's instructions. Reverse transcription was performed
using a PrimeScript™ RT Reagent Kit with gDNA Eraser (cat. no.
RR047A; Takara Bio, Inc.), according to the manufacturer's
instructions. gDNA was removed by incubating the samples at 42°C
for 2 min; cDNA was then synthesized at 37°C for 15 min and 85°C
for 5 sec. RT-qPCR of the DEGs was conducted using a CellAmp™
Direct TB Green® RT-qPCR Kit (cat. no. 3735A; Takara
Bio, Inc.) and an ABI ViiA™ 7 System (cat. no. 4453536; Thermo
Fisher Scientific, Inc.). The thermocycling conditions consisted of
an initial denaturation at 95°C for 30 sec, followed by 40 cycles
at 95°C for 3 sec and 60°C for 30 sec. The primers (Table III) for collagen α-2(I) chain
(COL1A2), leptin (LEP), plasminogen activator inhibitor 1
(SERPINE1) and GAPDH were synthesized by Generay Biotech Co.,
Ltd.
| Table III.Primer sequences. |
Table III.
Primer sequences.
| Gene | Primer sequences
(5′→3′) |
|---|
| COL1A2 | F:
GTTGCTGCTTGCAGTAACCTT |
|
| R:
AGGGCCAAGTCCAACTCCTT |
| LEP | F:
TGCCTTCCAGAAACGTGATCC |
|
| R:
CTCTGTGGAGTAGCCTGAAGC |
| SERPINE1 | F:
ACCGCAACGTGGTTTTCTCA |
|
| R:
TTGAATCCCATAGCTGCTTGAAT |
| GAPDH | F:
GGAGCGAGATCCCTCCAAAAT |
|
| R:
GGCTGTTGTCATACTTCTCATGG |
|
hsa-miR-937-loop |
GTCGTATCCAGTGCGTGTCGTGGAGTCGGCAATTGCACTGGATACGACGGCAGA |
| hsa-miR-937 | F:
GGGATCCGCGCTCTGACTC |
|
hsa-miR-148b*-loop |
GTCGTATCCAGTGCGTGTCGTGGAGTCGGCAATTGCACTGGATACGACGCCTGA |
| hsa-miR-148b* | F:
GGGAAGTTCTGTTATACAC |
|
hsa-miR-3907-loop |
GTCGTATCCAGTGCGTGTCGTGGAGTCGGCAATTGCACTGGATACGACTGTGAG |
| hsa-miR-3907 | F:
GGGAGGTGCTCCAGGCTGG |
|
hsa-miR-367*-loop |
GTCGTATCCAGTGCGTGTCGTGGAGTCGGCAATTGCACTGGATACGACAGAGTT |
| hsa-miR-367* | F:
GGGACTGTTGCTAATATGC |
| Universal reverse
primer |
AGTGCAGGGTCCGAGGTATT |
| U6 | F:
CGCTTCGGCAGCACATATACTAR: CGCTTCACGAATTTGCGTGTCA |
For the miRNAs, RT-qPCR were performed using the
miRNA 1st Strand cDNA Synthesis Kit (Vazyme Biotech Co., Ltd.) and
miRNA Universal SYBR qPCR Master Mix (Vazyme Biotech Co., Ltd.),
according to the manufacturer's instructions. gDNA was removed by
incubating the samples at 42°C for 2 min, then cDNA was synthesized
at 25°C for 5 min, 50°C for 15 min and 85°C for 5 min.
Thermocycling conditions for RT-qPCR consisted of an initial
denaturation at 95°C for 5 min, followed by 40 cycles at 95°C for
10 sec and 60°C for 30 sec. Specific stem-loop primers and forward
primers for hsa-miR-937, hsa-miR-1486*, hsa-miR-3907 and
hsa-miR-367* are listed in Table
III. All samples were analysed in triplicate, and gene
expression values were normalized to the values of β-actin using
the 2−ΔΔCq method (33).
Statistical analysis
SPSS 16.0 software (SPSS, Inc.) was used for
statistical analysis, and GraphPad Prism 5 software (GraphPad
Software, Inc.) was used to produce figures. Quantitative data are
presented as the mean ± SD. For comparisons between two groups, an
independent sample t-test was used. P<0.05 was considered to
indicate a statistically significant difference.
Results
Identification of EOPE-associated
DEGs
After annotation with official gene symbols, 32,078
genes were found in GSE74341, and 20,929 genes were found in
GSE44711. The expression matrixes of GSE74341 and GSE44711 were
merged based on their 17,834 common genes. The merged expression
matrix was processed with the R packages RankProd and metaMA
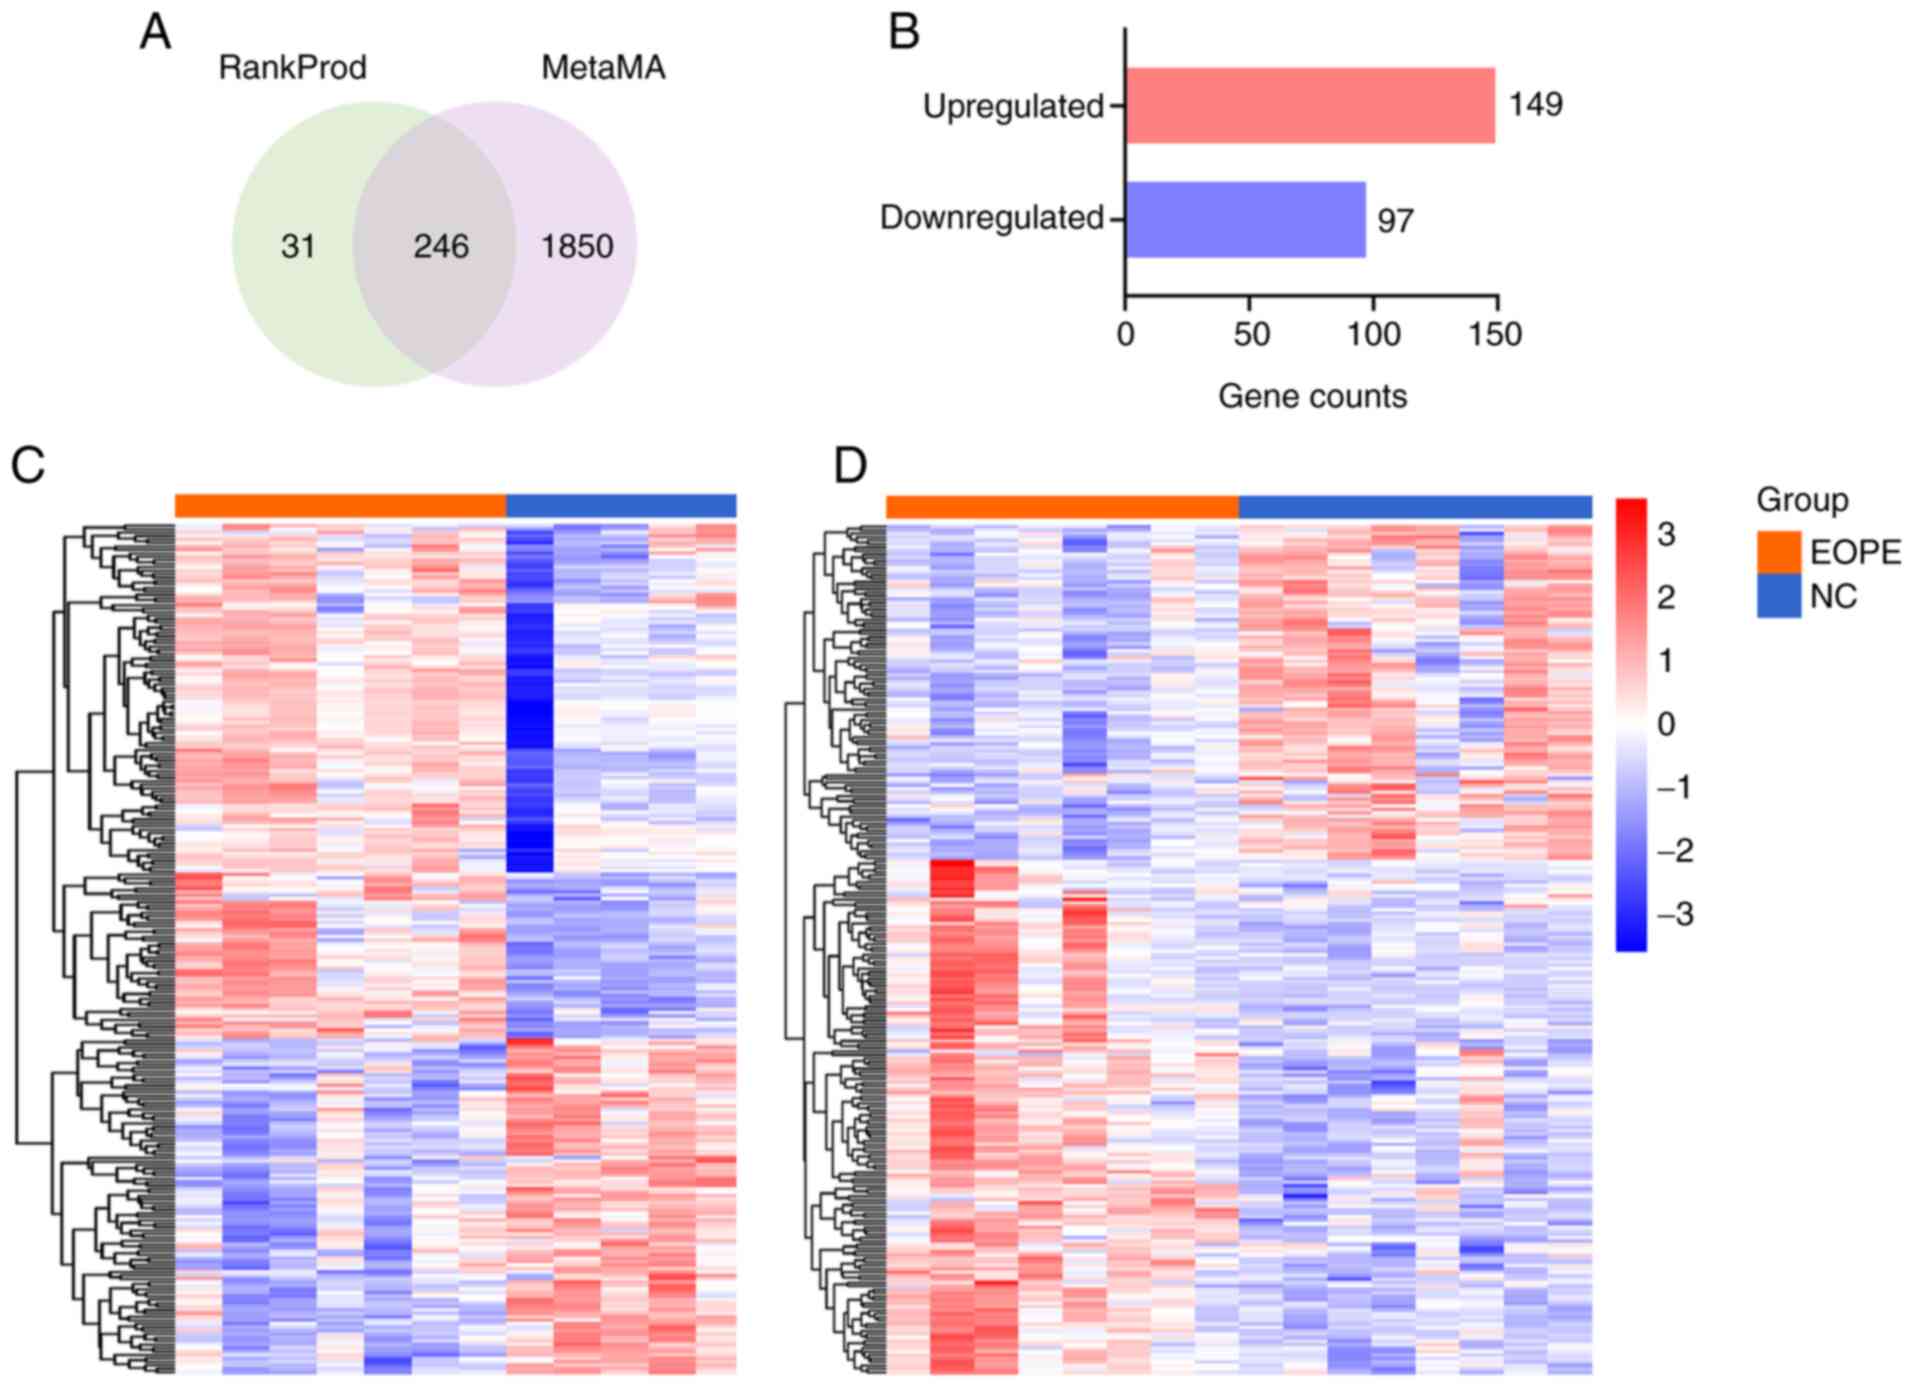
separately. A total of 276 genes were outputted by RankProd, and
2,096 were outputted by metaMA; 246 genes were shared between the
analyses and identified as DEGs (Fig.
1A). A total of 149 upregulated and 97 downregulated DEGs were
identified in patients with EOPE compared with healthy controls
(Fig. 1B). The top 30 upregulated
and top 30 downregulated DEGs are shown in Tables IV and V, respectively. To visualize the
expression patterns of these DEGs in the EOPE and normal control
(NC) groups, clustering heat maps of DEGs were constructed for
GSE74341 (Fig. 1C) and GSE44711
(Fig. 1D).
| Table IV.Top 30 upregulated DEGs. |
Table IV.
Top 30 upregulated DEGs.
| Upregulated
genes | Log2FC | pfp |
|---|
| CRH | 4.14 |
1.19×10⁻²³ |
| HTRA4 | 3.64 |
9.71×10⁻²² |
| PSG9 | 3.59 |
4.80×10⁻¹⁸ |
| EBI3 | 2.94 |
4.73×10⁻¹⁸ |
| ADAM12 | 2.61 |
3.03×10⁻¹⁶ |
| LHB | 2.94 |
5.70×10⁻¹⁶ |
| PRG2 | 2.14 |
1.32×10⁻¹⁵ |
| PAPPA2 | 3.02 |
2.90×10⁻¹⁵ |
| SLCO2A1 | 2.50 |
7.08×10⁻¹⁵ |
| COL17A1 | 2.20 |
1.19×10⁻¹⁴ |
| LEP | 2.82 |
2.16×10⁻¹³ |
| SIGLEC6 | 2.28 |
3.42×10⁻¹³ |
| PAPPA | 2.22 |
1.14×10⁻¹² |
| PSG6 | 2.22 |
1.18×10⁻¹² |
| GDF15 | 2.40 |
2.22×10⁻¹² |
| GPIHBP1 | 2.14 |
3.93×10⁻¹² |
| INHA | 2.18 |
3.77×10⁻¹² |
| PSG5 | 2.15 |
4.34×10⁻¹² |
| FSTL3 | 2.41 |
4.71×10⁻¹² |
| CA4 | 1.80 |
1.05×10⁻¹¹ |
| PSG1 | 2.18 |
1.15×10⁻¹¹ |
| LIMCH1 | 2.05 |
1.21×10⁻¹¹ |
| ANKRD37 | 1.99 |
1.51×10⁻¹¹ |
| HTRA1 | 2.46 |
1.82×10⁻¹¹ |
| PSG3 | 2.17 |
1.90×10⁻¹¹ |
| QPCT | 2.13 |
2.81×10⁻¹¹ |
| ARMS2 | 2.07 |
4.86×10⁻¹¹ |
| PSG11 | 1.91 |
5.98×10⁻¹¹ |
| MMP11 | 1.96 |
6.26×10⁻¹¹ |
| CYP11A1 | 1.88 |
1.09×10⁻¹⁰ |
| Table V.Top 30 downregulated DEGs. |
Table V.
Top 30 downregulated DEGs.
| Downregulated
genes | Log2FC | pfp |
|---|
| CADM3 | −2.04 |
1.09×10⁻¹² |
| SPP1 | −1.86 |
1.76×10⁻¹¹ |
| BHLHE41 | −1.67 |
4.77×10⁻¹⁰ |
| SPON1 | −1.68 |
4.86×10⁻¹⁰ |
| PDPN | −1.55 |
6.06×10⁻¹⁰ |
| OLFML3 | −1.64 |
6.87×10⁻¹⁰ |
| CCL13 | −1.56 |
9.12×10⁻¹⁰ |
| VTN | −1.43 |
1.39×10⁻⁹ |
| ALDH1A1 | −1.50 |
1.70×10⁻⁹ |
| SRPX | −1.54 |
1.66×10⁻⁹ |
| CXCL14 | −1.58 |
2.75×10⁻⁹ |
| DKK1 | −1.28 |
3.67×10⁻⁹ |
| SLC16A10 | −1.43 |
4.04×10⁻⁹ |
| PCOLCE | −1.46 |
4.38×10⁻⁹ |
| CFD | −1.55 |
4.82×10⁻⁹ |
| SLIT2 | −1.53 |
4.81×10⁻⁹ |
| ENPP1 | −1.47 |
1.01×10⁻⁸ |
| CPXM1 | −1.37 |
1.13×10⁻⁸ |
| THY1 | −1.36 |
1.40×10⁻⁸ |
| COL6A2 | −1.34 |
1.57×10⁻⁸ |
| PRRX1 | −1.54 |
2.76×10⁻⁸ |
| METTL7B | −1.34 |
4.18×10⁻⁸ |
| WNT2 | −1.38 |
4.01×10⁻⁸ |
| COL1A1 | −1.37 |
5.74×10⁻⁸ |
| DPT | −1.17 |
6.29×10⁻⁸ |
| CES1 | −1.24 |
7.55×10⁻⁸ |
| SCUBE2 | −1.33 |
1.09×10⁻⁷ |
| FST | −1.18 |
1.83×10⁻⁷ |
| COL6A1 | −1.30 |
2.43×10⁻⁷ |
| GPR34 | −1.21 |
2.36×10⁻⁷ |
Functional annotation of DEGs
To explore the biological functions of the DEGs, the
list of DEGs was uploaded to the DAVID database for GO and KEGG
enrichment analysis. GO is organized into three ontologies:
‘Cellular Component’ (CC), ‘Molecular Function’ (MF) and
‘Biological Process’ (BP). In the CC ontology (Fig. 2A), DEGs were primarily enriched in
the GO terms ‘extracellular region’, ‘extracellular exosome’,
‘extracellular space’ and ‘integral component of plasma membrane’.
In the MF ontology (Fig. 2B), DEGs
were mainly enriched in the terms ‘calcium ion binding’, ‘receptor
binding’, ‘heparin binding’ and ‘hormone binding’. In the BP
ontology (Fig. 2C), DEGs were
mainly enriched in the terms ‘cell adhesion’, ‘female pregnancy’,
‘extracellular matrix organization’ and ‘response to hypoxia’. KEGG
pathway analysis (Fig. 2D)
indicated that the DEGs were primarily enriched in the KEGG
pathways ‘focal adhesion’, ‘ECM-receptor interaction’, ‘PI3K-Akt
signaling’ and ‘ovarian steroidogenesis’. The GO and KEGG results
suggested that these DEGs were closely related to the occurrence
and development of EOPE.
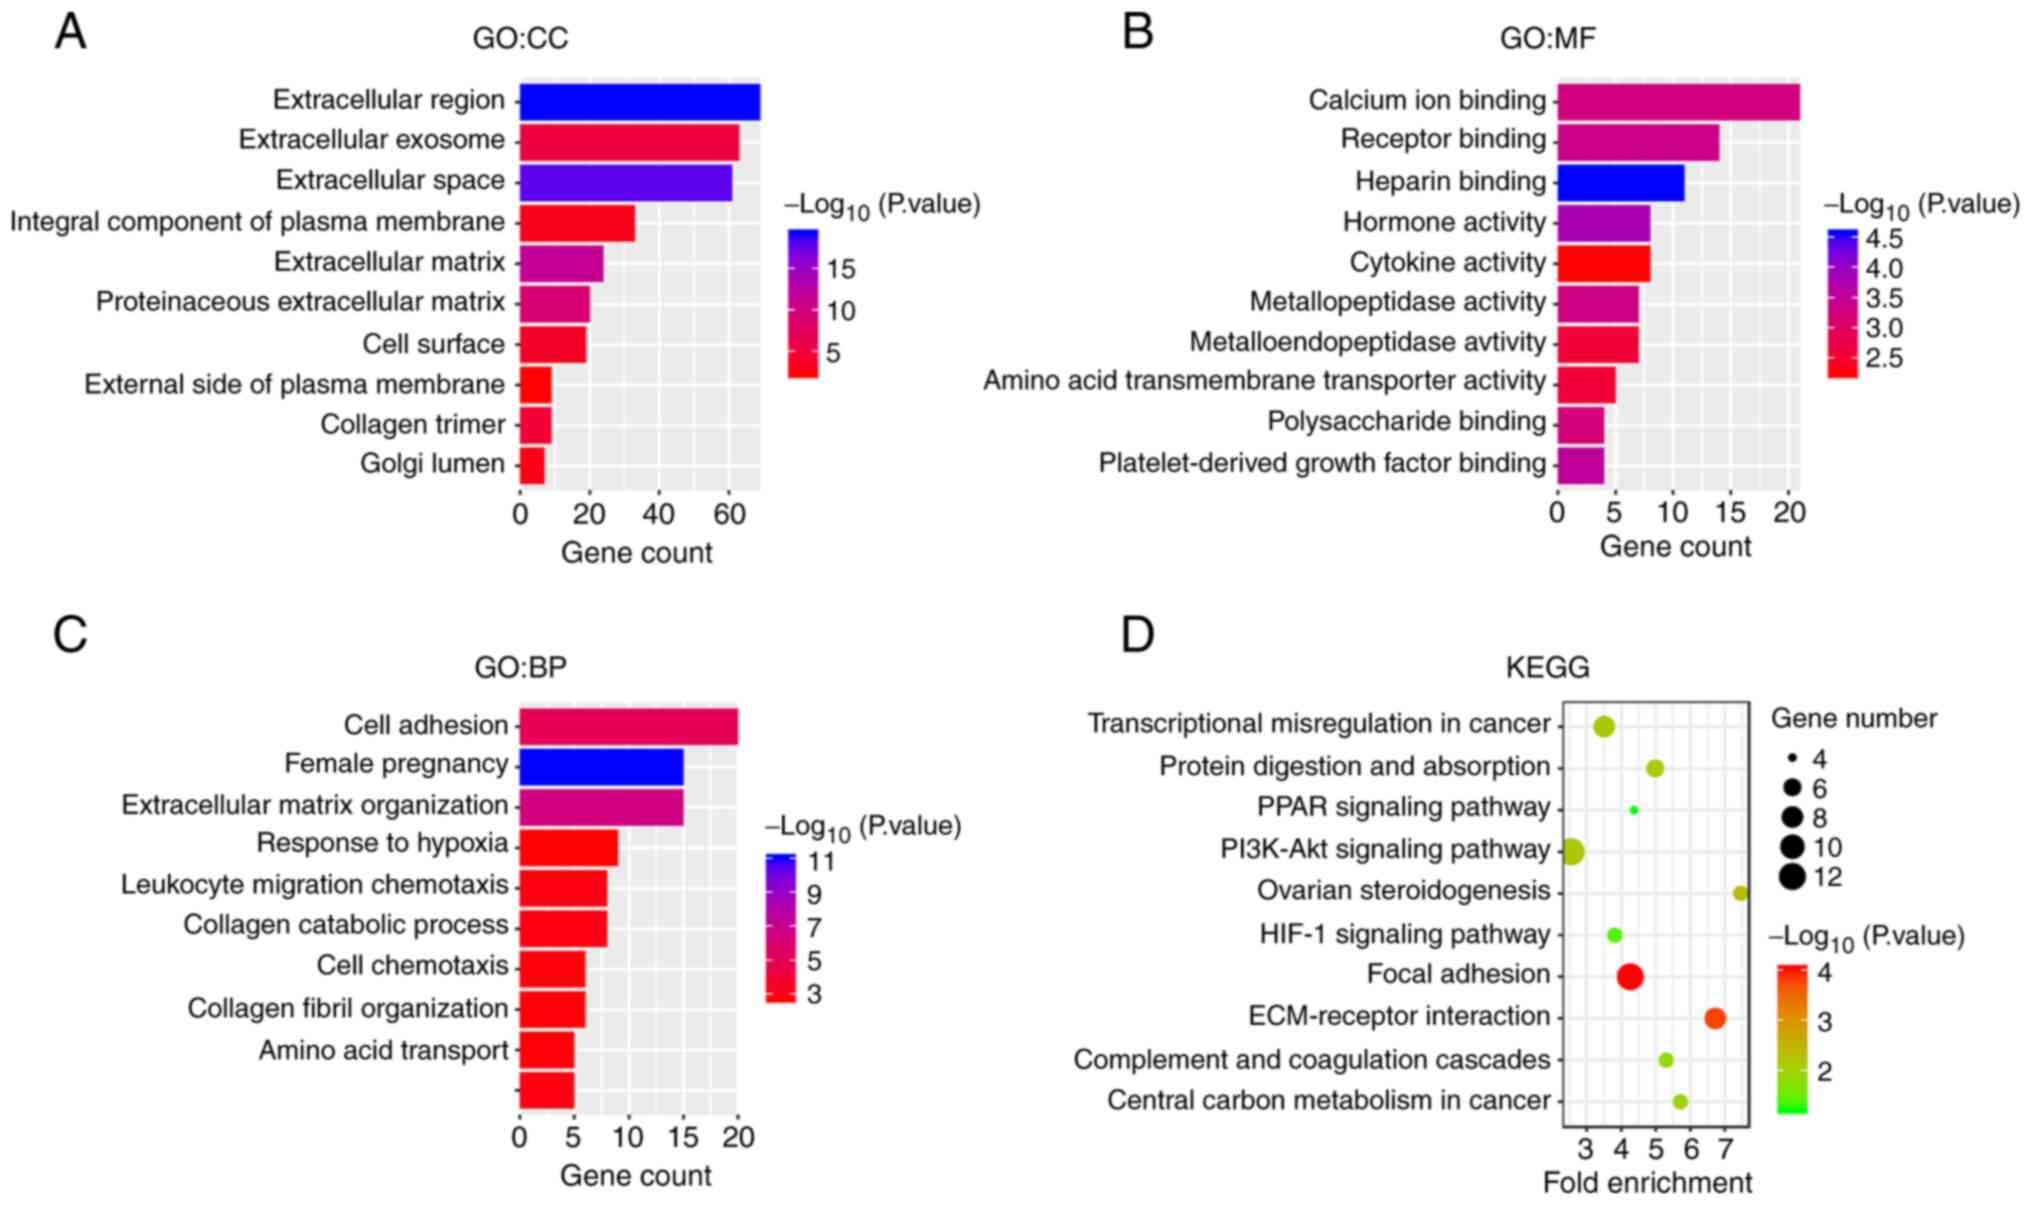 | Figure 2.Functional annotation of DEGs. GO
analysis of DEGs in the categories of (A) CC, (B) MF and (C) BP.
The ordinate displays the GO terms, and the abscissa presents the
numbers of DEGs enriched in the GO terms. The-log10 (P-value) is
reflected by the colour of the bar. (D) KEGG pathway enrichment of
DEGs. The ordinate presents the names of the enriched pathways, and
the abscissa presents the fold-enrichment. The number of DEGs
enriched in a pathway is denoted by bubble size, and the-log10
(P-value) is reflected by the bubble's colour. DEGs, differentially
expressed genes; GO, Gene Ontology; CC, cellular component; MF,
molecular function; BP, biological process; KEGG, Kyoto
Encyclopedia of Genes and Genomes. |
PPI network analysis of DEGs
To explore the interactions among the DEGs, the list
of DEGs was uploaded to the STRING database to construct the PPI
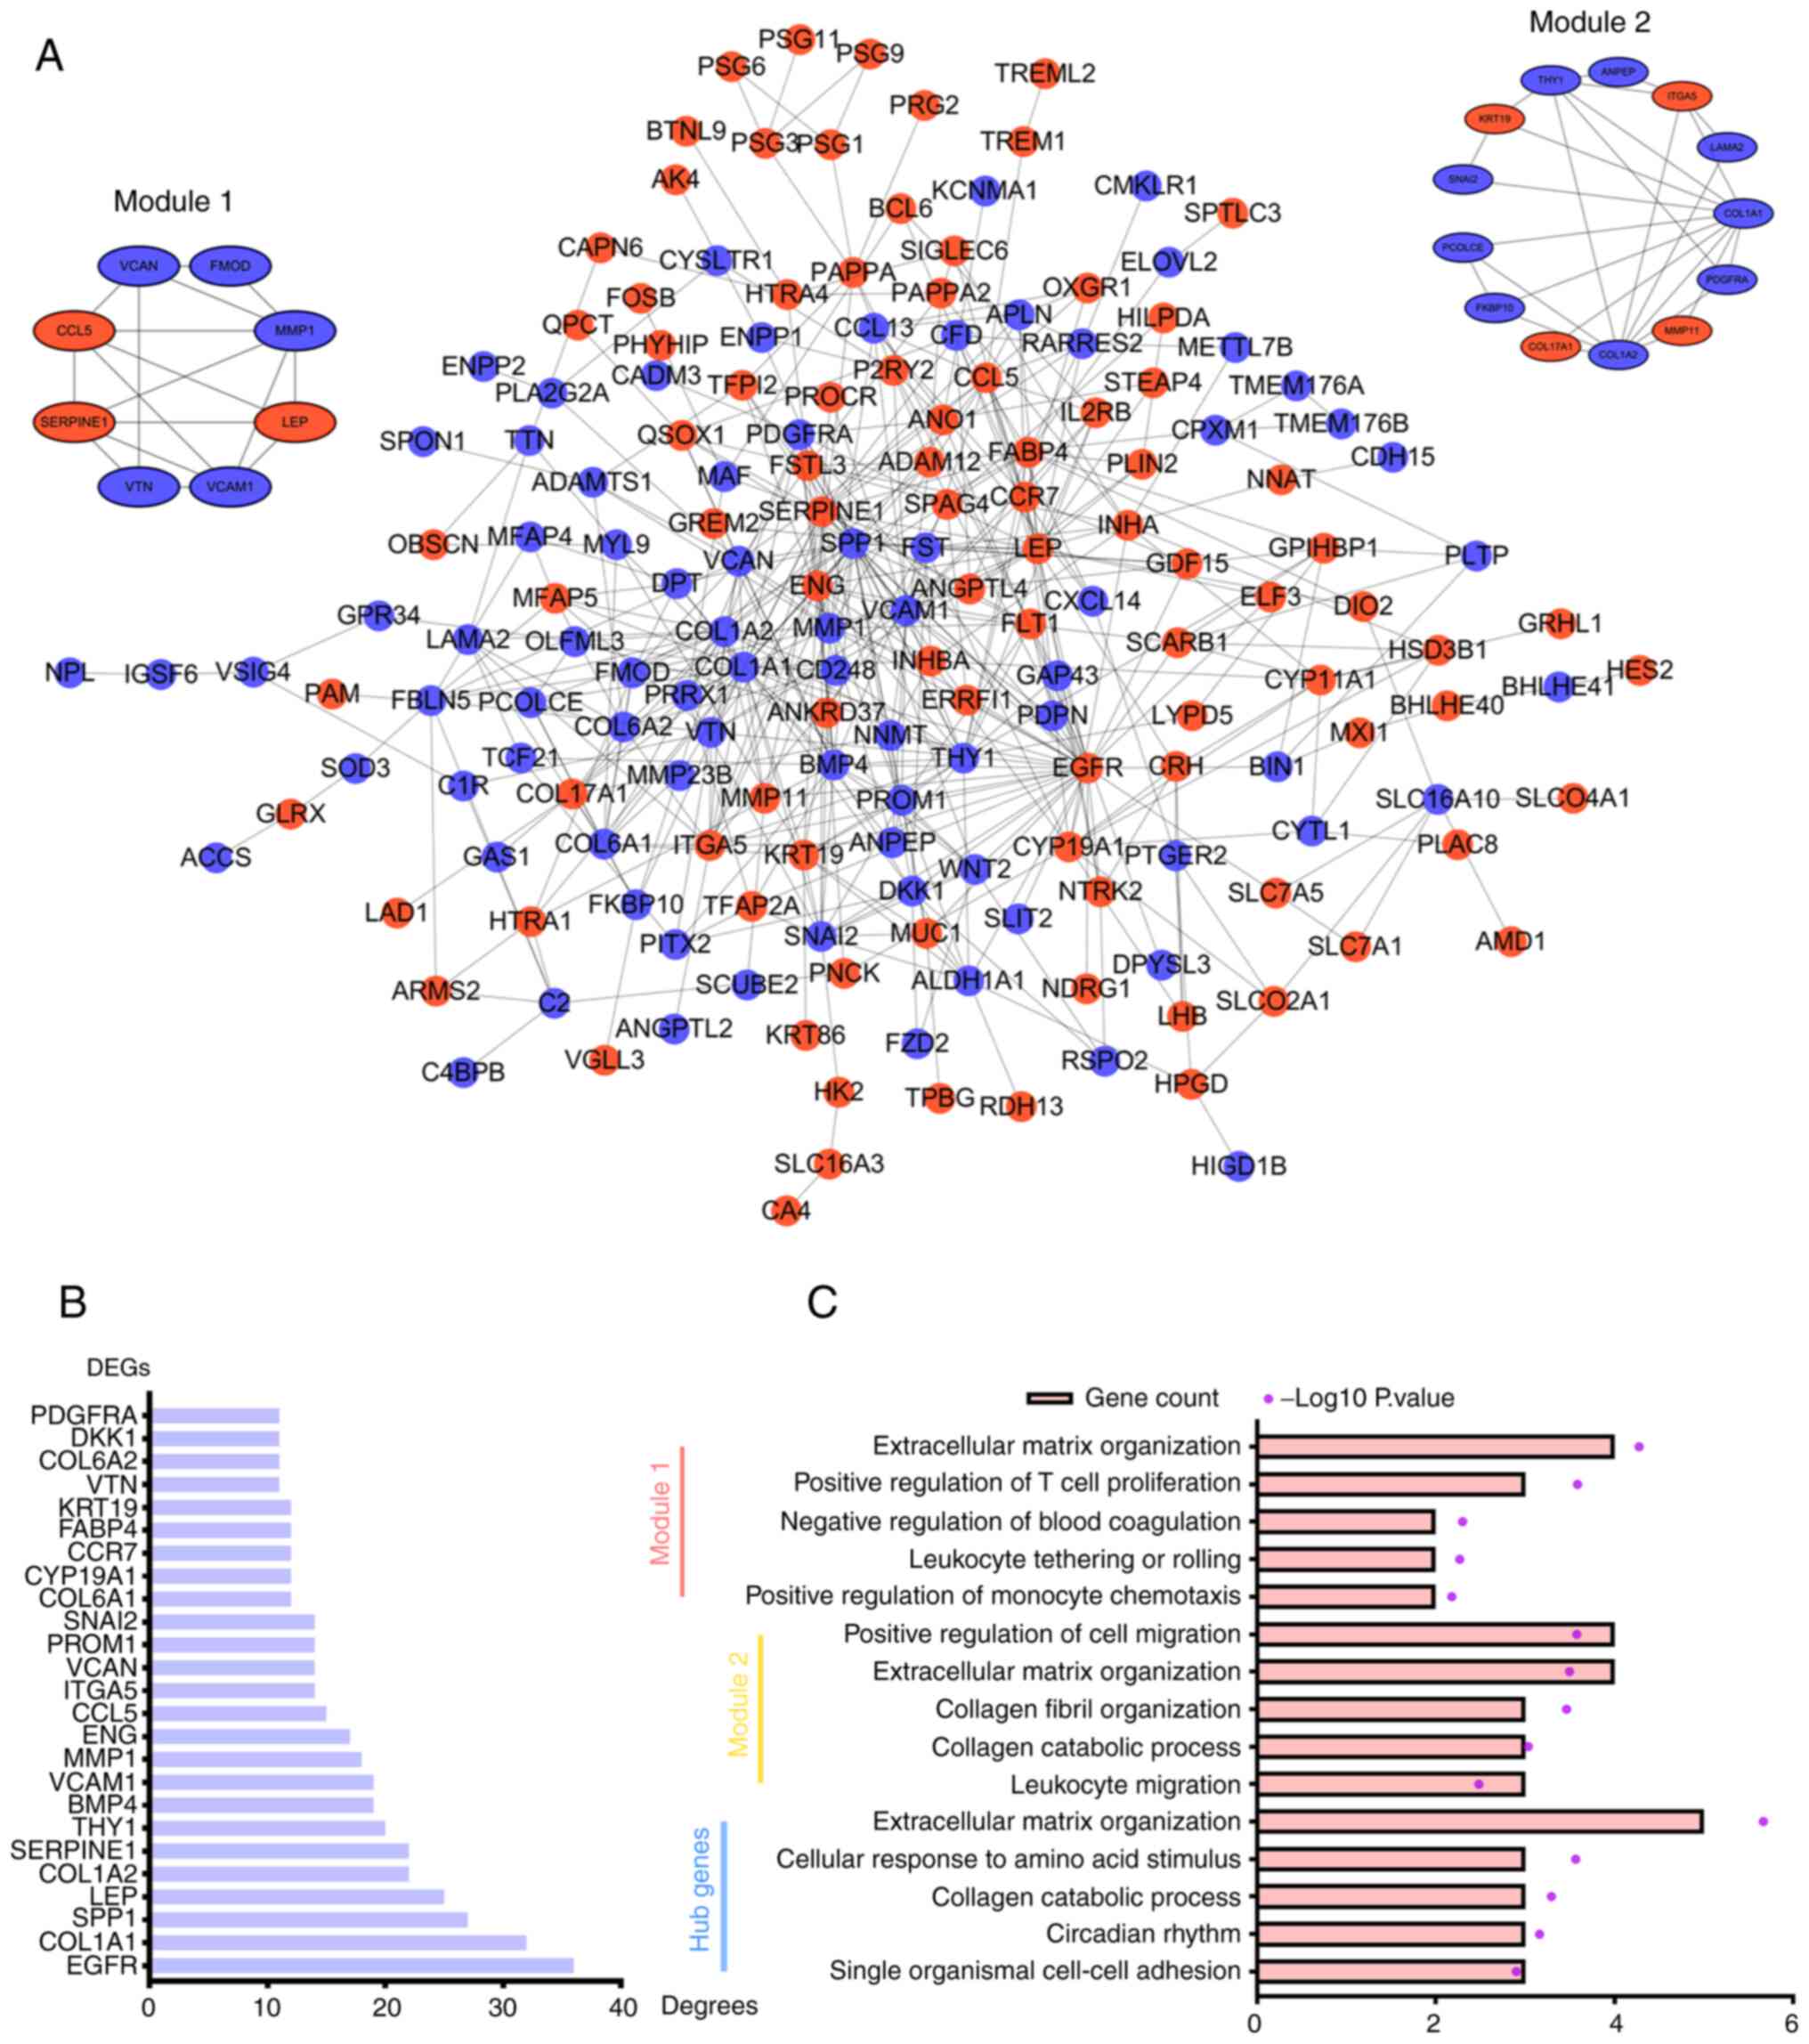
network. The PPI network contained 174 nodes representing 93
upregulated DEGs and 81 downregulated DEGs and 488 edges.
Significant gene modules of the PPI network were identified using
the Cytoscape plugin MCODE, and the first and second ranked modules
are shown (Fig. 3A). Degree is a
parameter that reflects the number of connected nodes with an
individual node. The larger a node's ‘Degree value’ is, the more
likely it is that the node is a hub gene. DEGs were ranked
according to their ‘Degree values’, and top 10 DEGs were considered
hub genes (Fig. 3B). The hub genes
included epidermal growth factor receptor (EGFR), collagen α-1(I)
chain (COL1A1), secreted phosphoprotein 1 (SPP1), LEP, COL1A2,
SERPINE1, Thy-1 membrane glycoprotein (THY1), bone morphogenetic
protein 4 (BMP4), vascular cell adhesion protein 1 (VCAM1) and
matrix metallopeptidase 1 (MMP1).
GO analysis was performed to explore the BPs
associated with module 1, module 2 and hub genes (Fig. 3C). Module 1 was primarily enriched
in the GO terms ‘extracellular matrix organization’, ‘positive
regulation of T cell proliferation’ and ‘negative regulation of
blood coagulation’. Module 2 was mainly enriched in the terms
‘positive regulation of cell migration’, ‘extracellular matrix
organization’ and ‘collagen fibril organization’. Hub genes were
mainly enriched in the terms ‘extracellular matrix organization’,
‘cellular response to amino acid stimulus’ and ‘collagen catabolic
process’. Of note, module 1, module 2 and hub genes were all
enriched in the term ‘extracellular matrix organization’, which
indicated that extracellular matrix organization may play important
roles in EOPE.
Identification of DEMs and
construction of the DEM-target DEG interaction network
The expression matrix of GSE103542 was analysed
using the R package limma, and |logFC|>2 and P<0.05 were
applied to define DEMs. A total of 28 miRNAs were differentially
expressed between patients with EOPE and healthy controls, among
which 20 miRNAs were downregulated and 8 miRNAs were upregulated in
patients with EOPE compared with controls (Fig. 4A and Table VI). A clustering heat map of the
DEMs was constructed to visualize the differences in the expression
patterns of miRNAs between the EOPE and NC groups (Fig. 4B).
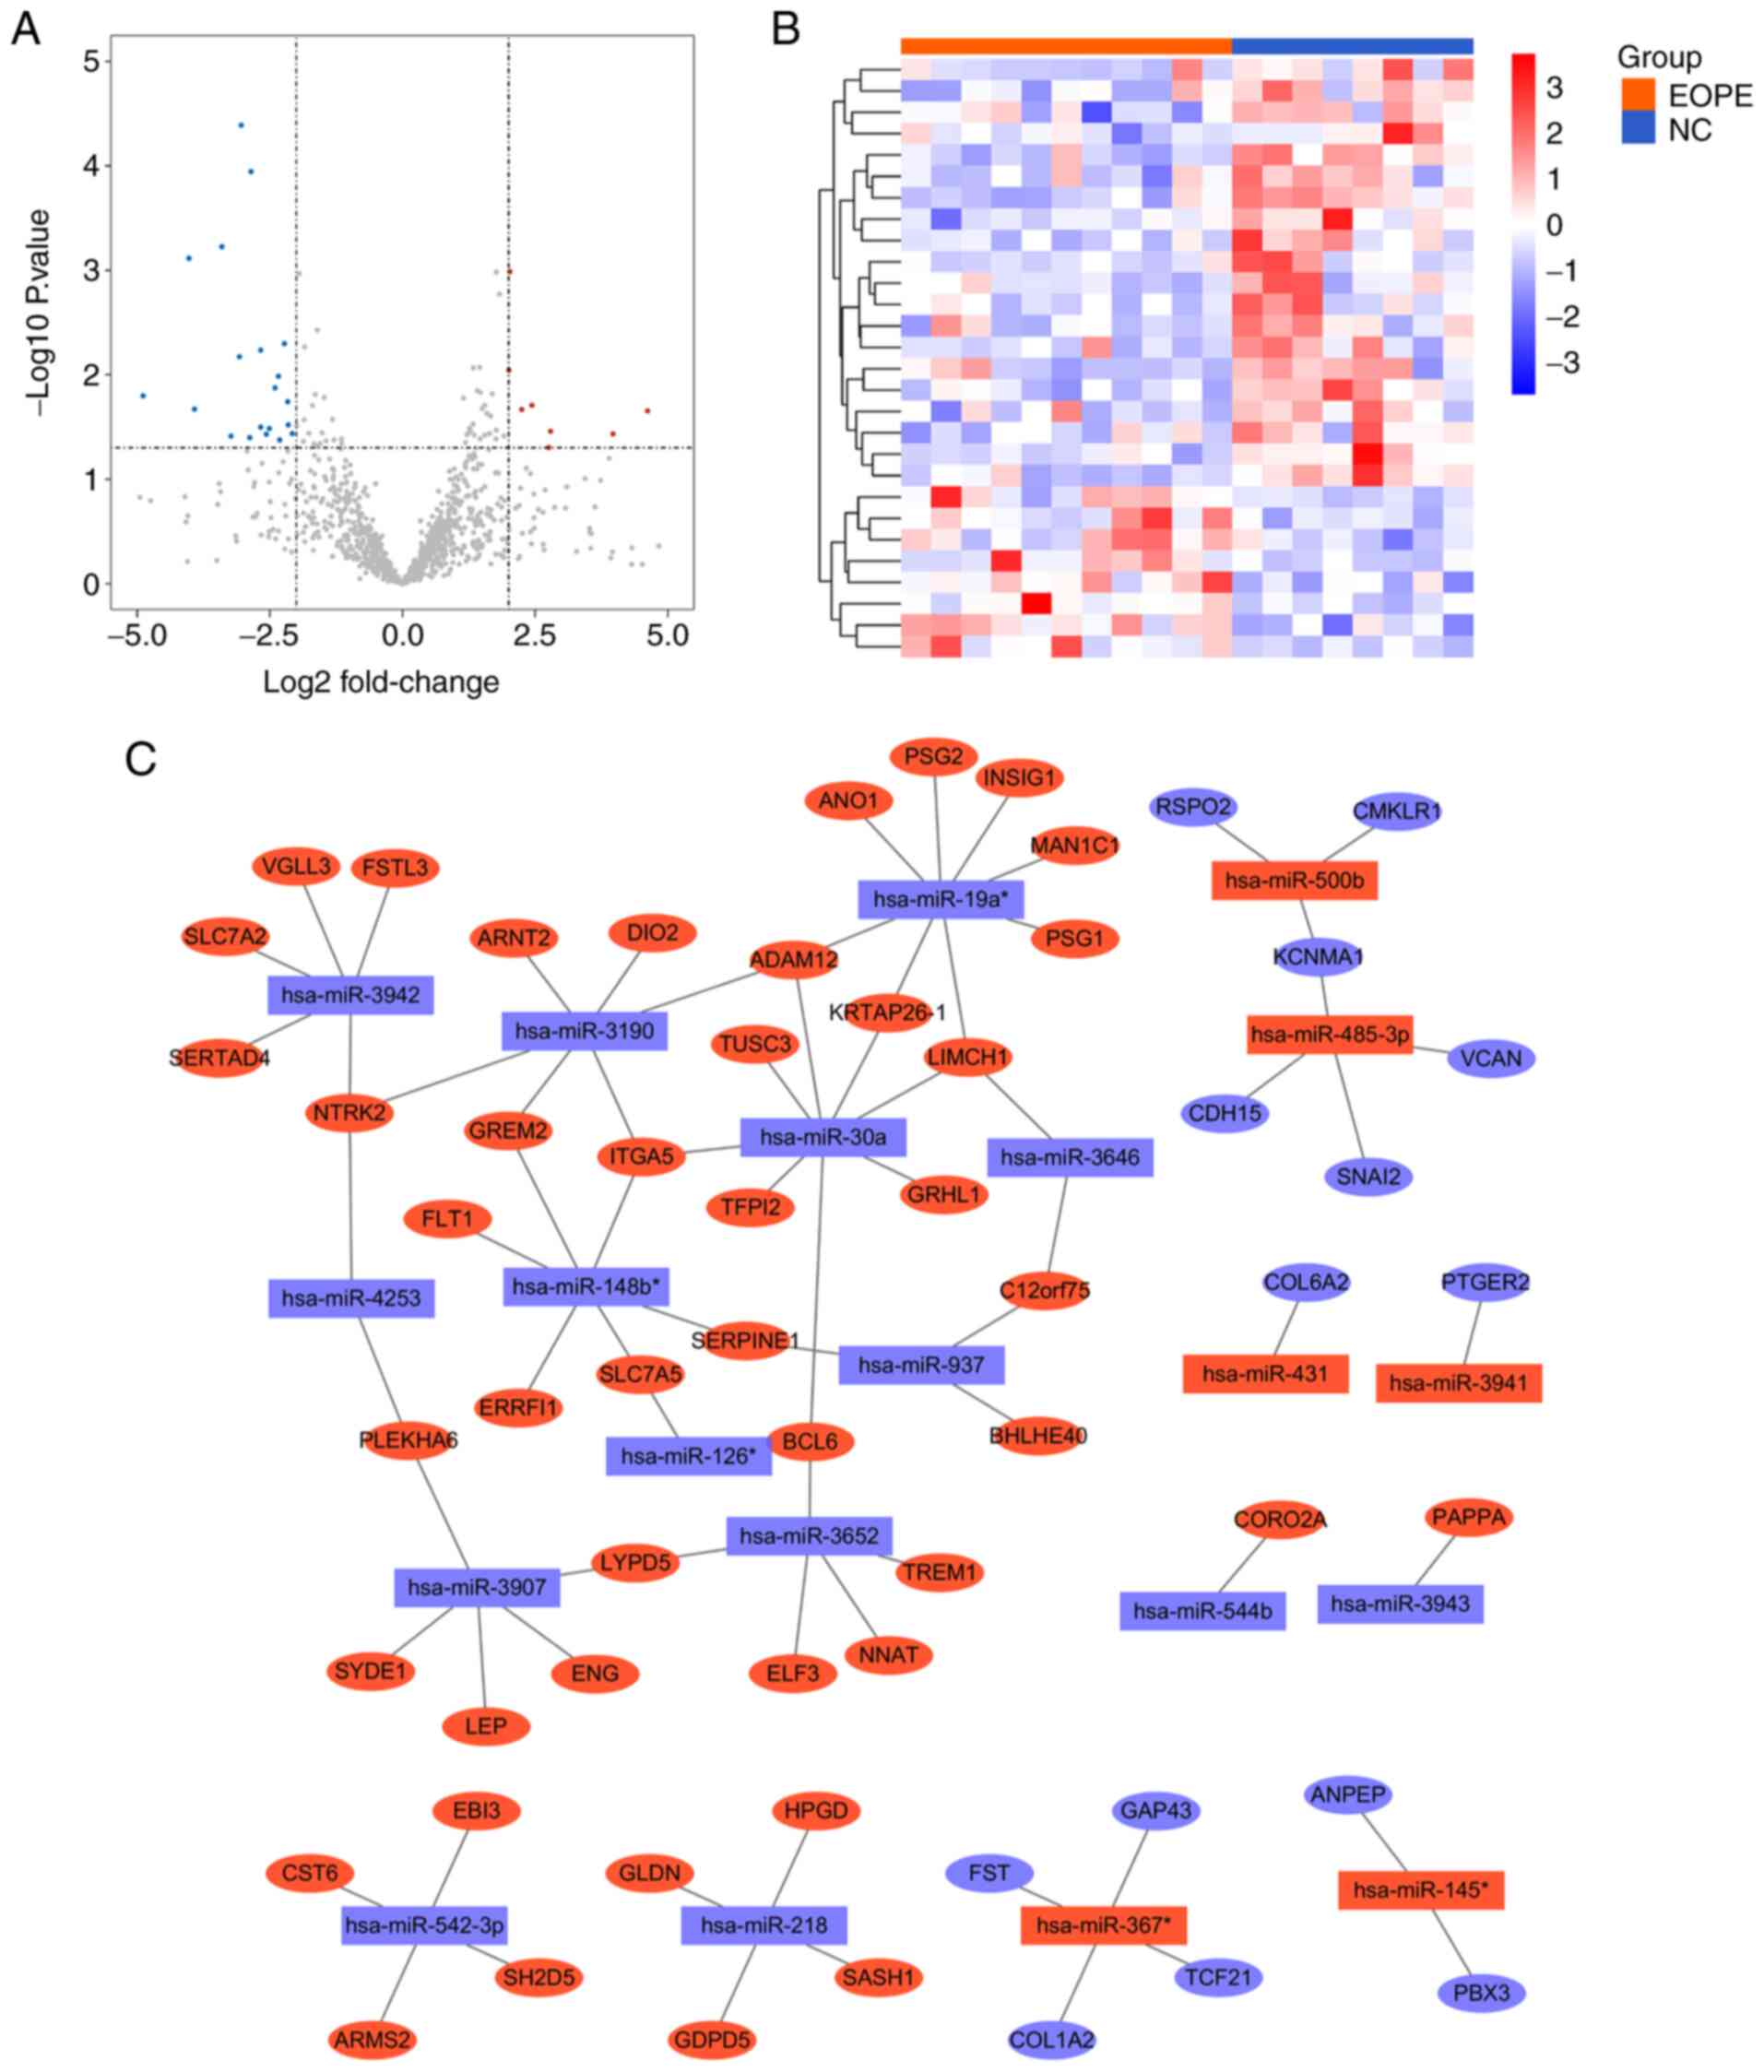 | Figure 4.Identification of DEMs and
construction of the DEM-target DEG interaction network. (A) A
volcano plot of miRNAs in GSE103542, with criteria of P<0.05 and
|log2FC|=2 applied to identify DEMs. (B) Clustering heat map of
DEMs in GSE103542. The ordinate displays the names of the DEMs, and
the abscissa presents the sample names. Samples labelled with
orange bars are from patients with EOPE, whereas those labelled
blue are from healthy controls. Red represents high expression, and
blue represents low expression. (C) Interaction network of DEMs and
their target DEGs. Rectangular nodes represent DEMs, and oval nodes
represent DEGs. Red nodes represent upregulated DEMs, and blue
nodes represent downregulated DEMs. Edges between nodes represent
interactions between DEMs and DEGs. miRNA, microRNA; FC,
fold-change; DEMs, differentially expressed miRNAs; EOPE, early
onset preeclampsia; NC, normal control; DEGs, differentially
expressed genes. |
| Table VI.List of DEMs. |
Table VI.
List of DEMs.
| DEMs | logFC | P-value |
|---|
| hsa-miR-1914 | 2.03 |
1.03×10⁻³ |
| hsa-miR-431 | 2.01 |
9.02×10⁻³ |
| hsa-miR-485-3p | 2.44 |
1.95×10⁻² |
| hsa-miR-500b | 2.25 |
2.15×10⁻² |
| hsa-miR-145* | 4.62 |
2.21×10⁻² |
| hsa-miR-3941 | 2.79 |
3.46×10⁻² |
| hsa-miR-367* | 3.97 |
3.67×10⁻² |
| hsa-miR-875-3p | 2.76 |
4.95×10⁻² |
| hsa-miR-542-3p | −3.04 |
4.07×10⁻⁵ |
| hsa-miR-126* | −2.85 |
1.13×10⁻⁴ |
| hsa-miR-544b | −3.40 |
5.93×10⁻⁴ |
| hsa-miR-3652 | −4.02 |
7.67×10⁻⁴ |
| hsa-miR-2276 | −2.22 |
5.02×10⁻³ |
| hsa-miR-937 | −2.67 |
5.80×10⁻³ |
| hsa-miR-3907 | −3.07 |
6.70×10⁻³ |
| hsa-miR-3190 | −2.33 |
1.03×10⁻² |
| hsa-miR-4253 | −2.40 |
1.33×10⁻² |
| hsa-miR-1274a | −4.89 |
1.59×10⁻² |
| hsa-miR-3942 | −2.16 |
1.80×10⁻² |
| hsa-miR-1471 | −3.92 |
2.13×10⁻² |
| hsa-miR-148b* | −2.15 |
3.01×10⁻² |
| hsa-miR-218 | −2.67 |
3.16×10⁻² |
| hsa-miR-1537 | −2.51 |
3.26×10⁻² |
| hsa-miR-3943 | −2.07 |
3.64×10⁻² |
| hsa-miR-19a* | −2.56 |
3.69×10⁻² |
| hsa-miR-3646 | −3.23 |
3.85×10⁻² |
| hsa-miR-302a | −2.88 |
3.99×10⁻² |
| hsa-miR-30a | −2.31 |
4.19×10⁻² |
The target genes of the DEMs were predicted using
miRNAtap, an R package that integrates sources from the PicTar,
DIANA, TargetScan, miranda and mirdb databases to increase the
confidence of prediction. The target DEGs were considered DEGs that
overlapped with the target genes of DEMs. A DEM-target DEG
interaction network was constructed to illustrate the connections
between the DEMs and DEGs (Fig.
4C). There were 80 nodes in the network, comprising 59 DEGs (45
upregulated, 14 downregulated) and 21 DEMs (6 upregulated, 15
downregulated). These nodes were connected by 76 edges. The nodes
with the largest ‘Degree values’ were has-miR-19a* and has-miR-30a,
which were predicted to regulate the expression of 8 DEGs each.
Local cohort validation of DEM-target
DEG patterns
Placenta tissue samples from 30 patients with EOPE
and 29 matched healthy controls were collected for RNA extraction.
Given that COL1A2, LEP and SERPINE1 were identified as hub genes
and predicted to be targets of DEMs, the expression of the DEMs
hsa-miR-937, hsa-miR-148b*, hsa-miR-3907 and hsa-miR-367*, and the
target DEGs COL1A2, LEP and SERPINE1 were validated using RT-qPCR
(Fig. 5). Compared with the
corresponding expression in the NC group, the expression levels of
hsa-miR-367*, SERPINE1 and LEP were increased significantly in the
EOPE group, whereas that of hsa-miR-937, hsa-miR-148b*,
hsa-miR-3907 and COL1A2 were decreased significantly in the EOPE
group, consistent with the microarray results.
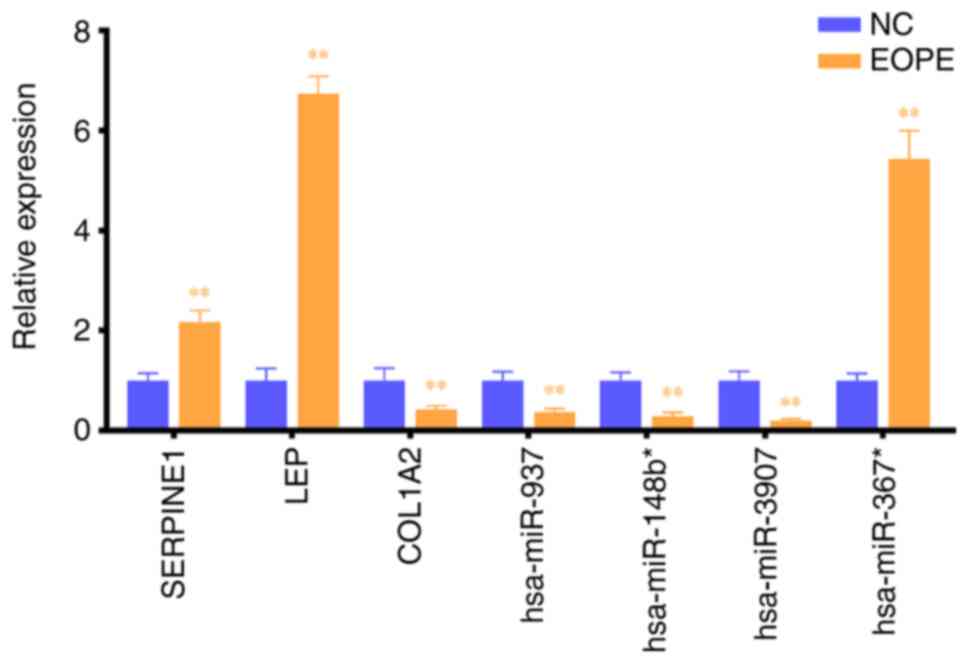 | Figure 5.Local cohort validation. Expression
of hsa-miR-937, hsa-miR-148b*, hsa-miR-3907, hsa-miR-367*, COL1A2,
LEP and SERPINE1 in placenta tissues from NC and EOPE groups as
determined via RT-qPCR. Expression levels of GAPDH and U6 snoRNA
were used as internal references. **P<0.01 vs. NC. miRNA,
microRNA; COL1A2, collagen α-2(I) chain; LEP, leptin; SERPINE1,
plasminogen activator inhibitor 1; NC, normal controls; EOPE, early
onset preeclampsia; RT-qPCR, reverse transcription-quantitative
polymerase chain reaction. |
Discussion
EOPE is a threat to maternal and foetal health
worldwide, especially in developing countries (34). The present research employed an
integrated approach to investigate alterations of miRNAs and genes
in EOPE. In addition, the connections between the altered miRNAs
and genes were explored, which may help to explain the pathogenesis
of EOPE. In the current study, a total of 246 DEGs and 28 DEMs were
identified, among which 59 DEGs and 21 DEMs may have regulatory
relationships.
The identified DEGs were primarily associated with
BPs, such as ‘cell adhesion’, ‘female pregnancy’, ‘extracellular
matrix organization’ and ‘response to hypoxia’. It has been
reported that an imbalance of MMPs plays a vital role in the
formation of PE (35). In
addition, it has been well-established that placenta ischaemia and
hypoxia contribute to the development of PE (36). The DEGs were mainly enriched in the
following KEGG pathways: ‘Focal adhesion’, ‘ECM-receptor
interaction’, ‘PI3K-Akt signaling’ and ‘ovarian steroidogenesis’.
The PI3K-Akt signalling pathway is a pro-survival pathway that
regulates cell proliferation, differentiation and apoptosis
(37). PI3K-Akt signalling is
typically dysregulated in numerous types of cancer and thus has
become an important target for anticancer treatment (38). A role of the PI3K-Akt signalling
pathway in PE has also been reported. Cudmore et al
(39) proposed that inhibition of
the PI3K-Akt signalling pathway increased circulating soluble
endoglin release and relieved endothelial dysfunction in PE.
In the present study, using STRING database and
Cytoscape, 10 genes (EGFR, COL1A1, SPP1, LEP, COL1A2, SERPINE1,
THY1, BMP4, VCAM1 and MMP1) were identified as hub genes that play
important roles in EOPE. EGFR signalling has been reported to be
overactive in PE and to promote the secretion of soluble FMS-like
tyrosine kinase-1, which has been implicated in the pathogenesis of
PE (40). The expression of COL1A1
was found to be closely associated with PE (P=0.0011) in a
large-scale study (PE=394, NC=631) (41). SPP1 was found to play a role in
cytotrophoblast invasion of the maternal vasculature/extracellular
matrix during non-preeclamptic placentation (42) and was downregulated in the placenta
of patients with PE (43). In the
present research, SPP1 was ranked second in the list of
downregulated genes, which indicated that SPP1 could serve as
biomarker of EOPE and that the role of SPP1 in PE deserves further
investigation. LEP in serum has been found to be significantly
higher in patients with PE than in NCs (PE=430, NC=316) (44). Additionally, serum LEP was found to
be higher in patients with EOPE than patients with LOPE (45). Genetic variants of SERPINE1 have
been found to be associated with PE (46). MMP-1 serves as a mediator of
vasoconstriction and vascular dysfunction in PE (47). However, the roles of COL1A2, THY1,
BMP4 and VCAM1 in PE remain unclear.
Increasing evidence has indicated that miRNA
dysregulation is responsible for the pathogenesis of EOPE. In the
present study, 28 placental miRNAs were identified as dysregulated.
Previous data demonstrated that hsa-miR-431 inhibited the migration
and invasion of trophoblastic cells, which might contribute to the
onset of PE (48), whereas
hsa-miR-145* played the opposite role (49). Furthermore, Brkić et al
(50) revealed that hsa-miR-218
promotes endovascular trophoblast differentiation and spiral artery
remodelling, which implies that downregulation of hsa-miR-218 in
placenta may contribute to PE development. Additionally,
hsa-miR-126* in placenta has been reported to be downregulated in
patients with PE, which is consistent with the microarray results
of the present study, and the expression of hsa-miR-126* has been
identified as correlated with vascular endothelial growth factor
levels (51). Furthermore, a
previous study indicated that hsa-miR-126* is essential for the
angiogenic properties of endothelial progenitor cells in
vitro and for placental vasculogenesis in vivo (52). In the current study, four DEM-hub
gene pairs were predicted. Using local samples, the expression
changes of hsa-miR-937, hsa-miR-148b*, hsa-miR-3907, hsa-miR-367*,
COL1A2, LEP and SERPINE1 were validated in the placenta of patients
with PE compared with controls.
With the rapid development of high-throughput
technologies, numerous studies have been performed to investigate
the molecular mechanisms of EOPE by examining transcriptional
changes. He et al (53), Ma
et al (54) and Song et
al (55) analysed microarray
data from GSE44711 to identify candidate markers and pathways in
EOPE. Owing to the different bioinformatics approaches among the
studies, the results of the three studies varied. Gunel et
al (56) and Betoni et
al (57) investigated miRNA
profiles in the placentas of patients with PE without
distinguishing EOPE from LOPE, whereas Lykoudi et al
(58) analysed dysregulated
placental miRNAs in patients with EOPE. However, the aforementioned
studies did not explore the regulatory relationships between mRNAs
and miRNAs; such relationships may contribute to the pathogenesis
of EOPE. Yang-Dong et al (59) constructed a miRNA-mRNA regulatory
network for EOPE by analysing microarray data from GSE103542 and
GSE74341. In contrast to this previous study, the present study
analysed two microarrays comprehensively to identify DEGs, thus
increasing the strength and validity of the results of this study.
Furthermore, in the present study, hub genes among the DEGs were
identified and partially validated using RT-qPCR, which may provide
insight into the molecular mechanisms of EOPE. Nevertheless, there
are a few limitations of the current study. This study failed to
demonstrate the exact functions of these hub genes and the
associated mechanisms, an important topic that requires further
research.
The present research identified DEGs and DEMs
associated with EOPE, and provided insight into the relationships
between them. EGFR, COL1A1, SPP1, LEP, COL1A2, SERPINE1, THY1,
BMP4, VCAM1 and MMP1 could serve as potential biomarkers of EOPE
and treatment targets. Furthermore, hsa-miR-937, hsa-miR-148b*,
hsa-miR-3907 and hsa-miR-367* could serve as regulators of COL1A2,
LEP and SERPINE1, a possibility that warrants further
investigation.
Acknowledgements
Not applicable.
Funding
The present study was supported by the National
Science Foundation of China (grant nos. 81771604, 81601300 and
81901490).
Availability of data and materials
All data generated or analyzed during this study are
included in this published article.
Authors' contributions
HZ, LX, ZM and HD designed the present study, which
was performed by HZ, LX YL and XY. LX, YL and XY made substantial
contributions to acquisition and analysis of data. HZ and YZ also
made contributions to interpretation of data. LX wrote the initial
draft of the manuscript. HZ revised it critically for important
intellectual content. ZM and HD gave final approval of the version
to be published. All authors read and approved the final
manuscript.
Ethics approval and consent to
participate
This research was approved by The Human Research
Ethics Committee of Women's Hospital of Nanjing Medical University
(approval no. KY-024). All women participating in the study signed
informed consent for the collection of placenta tissues and
clinical information.
Patient consent for publication
Not applicable.
Competing interests
The authors declare that they have no competing
interests.
References
|
1
|
Steegers EA, von Dadelszen P, Duvekot JJ
and Pijnenborg R: Pre-eclampsia. Lancet. 376:631–644. 2010.
View Article : Google Scholar : PubMed/NCBI
|
|
2
|
Ghulmiyyah L and Sibai B: Maternal
mortality from preeclampsia/eclampsia. Semin Perinatol. 36:56–59.
2012. View Article : Google Scholar : PubMed/NCBI
|
|
3
|
Clark SL, Belfort MA, Dildy GA, Herbst MA,
Meyers JA and Hankins GD: Maternal death in the 21st century:
Causes, prevention, and relationship to cesarean delivery. Am J
Obstet Gynecol. 199:36.e1–e5, 91-2. e7-e11. 2008. View Article : Google Scholar
|
|
4
|
Roberts JM and Cooper DW: Pathogenesis and
genetics of pre-eclampsia. Lancet. 357:53–56. 2001. View Article : Google Scholar : PubMed/NCBI
|
|
5
|
von Dadelszen P, Magee LA and Roberts JM:
Subclassification of preeclampsia. Hypertens Pregnancy. 22:143–148.
2003. View Article : Google Scholar : PubMed/NCBI
|
|
6
|
Lisonkova S, Sabr Y, Mayer C, Young C,
Skoll A and Joseph KS: Maternal morbidity associated with
early-onset and late-onset preeclampsia. Obstet Gynecol.
124:771–781. 2014. View Article : Google Scholar : PubMed/NCBI
|
|
7
|
Brosens I, Pijnenborg R, Vercruysse L and
Romero R: The ‘Great Obstetrical Syndromes’ are associated with
disorders of deep placentation. Am J Obstet Gynecol. 204:193–201.
2011. View Article : Google Scholar : PubMed/NCBI
|
|
8
|
Rupaimoole R and Slack FJ: MicroRNA
therapeutics: Towards a new era for the management of cancer and
other diseases. Nat Rev Drug Discov. 16:203–222. 2017. View Article : Google Scholar : PubMed/NCBI
|
|
9
|
Hata A: Functions of microRNAs in
cardiovascular biology and disease. Annu Rev Physiol. 75:69–93.
2013. View Article : Google Scholar : PubMed/NCBI
|
|
10
|
Wang Y, Jiao J, Ren P and Wu M:
Upregulation of miRNA-223-3p ameliorates RIP3-mediated necroptosis
and inflammatory responses via targeting RIP3 after spinal cord
injury. J Cell Biochem. Feb 28–2019.(Epub ahead of print).
|
|
11
|
Ranz JM and Machado CA: Uncovering
evolutionary patterns of gene expression using microarrays. Trends
Ecol Evol. 21:29–37. 2006. View Article : Google Scholar : PubMed/NCBI
|
|
12
|
Huang GH, Cao XY, Li YY, Zhou CC, Li L,
Wang K, Li H, Yu P, Jin Y and Gao L: Gene expression profile of the
hippocampus of rats subjected to traumatic brain injury. J Cell
Biochem. 120:15776–15789. 2019. View Article : Google Scholar : PubMed/NCBI
|
|
13
|
Tan J, Hu L, Yang X, Zhang X, Wei C, Lu Q,
Chen Z and Li J: miRNA expression profiling uncovers a role of
miR-302b-3p in regulating skin fibroblasts senescence. J Cell
Biochem. 121:70–80. 2020. View Article : Google Scholar : PubMed/NCBI
|
|
14
|
Liu Z, Xie M, Yao Z, Niu Y, Bu Y and Gao
C: Three meta-analyses define a set of commonly overexpressed genes
from microarray datasets on astrocytomas. Mol Neurobiol.
47:325–336. 2013. View Article : Google Scholar : PubMed/NCBI
|
|
15
|
Barrett T, Wilhite SE, Ledoux P,
Evangelista C, Kim IF, Tomashevsky M, Marshall KA, Phillippy KH,
Sherman PM, Holko M, et al: NCBI GEO: Archive for functional
genomics data sets-update. Nucleic Acids Res. 41:D991–D995. 2013.
View Article : Google Scholar : PubMed/NCBI
|
|
16
|
Del Carratore F, Jankevics A, Eisinga R,
Heskes T, Hong F and Breitling R: RankProd 2.0: A refactored
bioconductor package for detecting differentially expressed
features in molecular profiling datasets. Bioinformatics.
33:2774–2775. 2017. View Article : Google Scholar : PubMed/NCBI
|
|
17
|
Marot G, Foulley JL, Mayer CD and
Jaffrézic F: Moderated effect size and P-value combinations for
microarray meta-analyses. Bioinformatics. 25:2692–2699. 2009.
View Article : Google Scholar : PubMed/NCBI
|
|
18
|
Heberle H, Meirelles GV, da Silva FR,
Telles GP and Minghim R: InteractiVenn: A web-based tool for the
analysis of sets through Venn diagrams. BMC Bioinformatics.
16:1692015. View Article : Google Scholar : PubMed/NCBI
|
|
19
|
Kolde R: Pheatmap: Pretty heatmaps: R
package version 1. 2012.
|
|
20
|
Huang da W, Sherman BT and Lempicki RA:
Systematic and integrative analysis of large gene lists using DAVID
bioinformatics resources. Nat Protoc. 4:44–57. 2009. View Article : Google Scholar : PubMed/NCBI
|
|
21
|
Huang da W, Sherman BT and Lempicki RA:
Bioinformatics enrichment tools: Paths toward the comprehensive
functional analysis of large gene lists. Nucleic Acids Res.
37:1–13. 2009. View Article : Google Scholar : PubMed/NCBI
|
|
22
|
The Gene Ontology Consortium: The gene
ontology resource: 20 Years and still GOing strong. Nucleic Acids
Res. 47:D330–D338. 2019. View Article : Google Scholar : PubMed/NCBI
|
|
23
|
Ashburner M, Ball CA, Blake JA, Botstein
D, Butler H, Cherry JM, Davis AP, Dolinski K, Dwight SS, Eppig JT,
et al: Gene ontology: Tool for the unification of biology. The gene
ontology consortium. Nat Genet. 25:25–29. 2000. View Article : Google Scholar : PubMed/NCBI
|
|
24
|
Kanehisa M and Goto S: KEGG: Kyoto
encyclopedia of genes and genomes. Nucleic Acids Res. 28:27–30.
2000. View Article : Google Scholar : PubMed/NCBI
|
|
25
|
Szklarczyk D, Franceschini A, Wyder S,
Forslund K, Heller D, Huerta-Cepas J, Simonovic M, Roth A, Santos
A, Tsafou KP, et al: STRING v10: Protein-protein interaction
networks, integrated over the tree of life. Nucleic Acids Res.
43:D447–D452. 2015. View Article : Google Scholar : PubMed/NCBI
|
|
26
|
Shannon P, Markiel A, Ozier O, Baliga NS,
Wang JT, Ramage D, Amin N, Schwikowski B and Ideker T: Cytoscape: A
software environment for integrated models of biomolecular
interaction networks. Genome Res. 13:2498–2504. 2003. View Article : Google Scholar : PubMed/NCBI
|
|
27
|
Bader GD and Hogue CW: An automated method
for finding molecular complexes in large protein interaction
networks. BMC Bioinformatics. 4:22003. View Article : Google Scholar : PubMed/NCBI
|
|
28
|
Ritchie ME, Phipson B, Wu D, Hu Y, Law CW,
Shi W and Smyth GK: limma powers differential expression analyses
for RNA-sequencing and microarray studies. Nucleic Acids Res.
43:e472015. View Article : Google Scholar : PubMed/NCBI
|
|
29
|
Wickham H: ggplot2: Elegant graphics for
data analysis. Springer International Publishing; 2016
|
|
30
|
Pajak M and Simpson TI: miRNAtap:
miRNAtap: microRNA Targets-Aggregated Predictions. R package
version 1.22.0. 2020.
|
|
31
|
Dhawan A, Scott JG, Harris AL and Buffa
FM: Pan-cancer characterisation of microRNA across cancer hallmarks
reveals microRNA-mediated downregulation of tumour suppressors. Nat
Commun. 9:52282018. View Article : Google Scholar : PubMed/NCBI
|
|
32
|
Uzan J, Carbonnel M, Piconne O, Asmar R
and Ayoubi JM: Pre-eclampsia: Pathophysiology, diagnosis, and
management. Vasc Health Risk Manag. 7:467–474. 2011.PubMed/NCBI
|
|
33
|
Livak KJ and Schmittgen TD: Analysis of
relative gene expression data using real-time quantitative PCR and
the 2(-Delta Delta C(T)) method. Methods. 25:402–408. 2001.
View Article : Google Scholar : PubMed/NCBI
|
|
34
|
Osungbade KO and Ige OK: Public health
perspectives of preeclampsia in developing countries: Implication
for health system strengthening. J Pregnancy. 2011:4810952011.
View Article : Google Scholar : PubMed/NCBI
|
|
35
|
Chen J and Khalil RA: Matrix
metalloproteinases in normal pregnancy and preeclampsia. Prog Mol
Biol Transl Sci. 148:87–165. 2017. View Article : Google Scholar : PubMed/NCBI
|
|
36
|
Karumanchi SA and Bdolah Y: Hypoxia and
sFlt-1 in preeclampsia: The ‘Chicken-and-Egg’ question.
Endocrinology. 145:4835–4837. 2004. View Article : Google Scholar : PubMed/NCBI
|
|
37
|
Janku F, Yap TA and Meric-Bernstam F:
Targeting the PI3K pathway in cancer: Are we making headway? Nat
Rev Clin Oncol. 15:273–291. 2018. View Article : Google Scholar : PubMed/NCBI
|
|
38
|
Mayer IA and Arteaga CL: The PI3K/AKT
pathway as a target for cancer treatment. Annu Rev Med. 67:11–28.
2016. View Article : Google Scholar : PubMed/NCBI
|
|
39
|
Cudmore MJ, Ahmad S, Sissaoui S, Ramma W,
Ma B, Fujisawa T, Al-Ani B, Wang K, Cai M, Crispi F, et al: Loss of
Akt activity increases circulating soluble endoglin release in
preeclampsia: Identification of inter-dependency between Akt-1 and
heme oxygenase-1. Eur Heart J. 33:1150–1158. 2012. View Article : Google Scholar : PubMed/NCBI
|
|
40
|
Hastie R, Brownfoot FC, Pritchard N,
Hannan NJ, Cannon P, Nguyen V, Palmer K, Beard S, Tong S and
Kaitu'u-Lino TJ: EGFR (Epidermal Growth Factor Receptor) signaling
and the mitochondria regulate sFlt-1 (Soluble FMS-Like Tyrosine
Kinase-1) secretion. Hypertension. 73:659–670. 2019. View Article : Google Scholar : PubMed/NCBI
|
|
41
|
Goddard KA, Tromp G, Romero R, Olson JM,
Lu Q, Xu Z, Parimi N, Nien JK, Gomez R, Behnke E, et al:
Candidate-gene association study of mothers with pre-eclampsia, and
their infants, analyzing 775 SNPs in 190 genes. Hum Hered. 63:1–16.
2007. View Article : Google Scholar : PubMed/NCBI
|
|
42
|
Gabinskaya T, Salafia CM, Gulle VE,
Holzman IR and Weintraub AS: Gestational age-dependent extravillous
cytotrophoblast osteopontin immunolocalization differentiates
between normal and preeclamptic pregnancies. Am J Reprod Immunol.
40:339–346. 1998. View Article : Google Scholar : PubMed/NCBI
|
|
43
|
Xia J, Qiao F, Su F and Liu H: Implication
of expression of osteopontin and its receptor integrin alphanubeta3
in the placenta in the development of preeclampsia. J Huazhong Univ
Sci Technolog Med Sci. 29:755–760. 2009. View Article : Google Scholar : PubMed/NCBI
|
|
44
|
Taylor BD, Ness RB, Olsen J, Hougaard DM,
Skogstrand K, Roberts JM and Haggerty CL: Serum leptin measured in
early pregnancy is higher in women with preeclampsia compared with
normotensive pregnant women. Hypertension. 65:594–599. 2015.
View Article : Google Scholar : PubMed/NCBI
|
|
45
|
Salimi S, Farajian-Mashhadi F, Naghavi A,
Naghavi A, Mokhtari M, Shahrakipour M, Saravani M and Yaghmaei M:
Different profile of serum leptin between early onset and late
onset preeclampsia. Dis Markers. 2014:6284762014. View Article : Google Scholar : PubMed/NCBI
|
|
46
|
Buurma AJ, Turner RJ, Driessen JH,
Mooyaart AL, Schoones JW, Bruijn JA, Bloemenkamp KW, Dekkers OM and
Baelde HJ: Genetic variants in pre-eclampsia: A meta-analysis. Hum
Reprod Update. 19:289–303. 2013. View Article : Google Scholar : PubMed/NCBI
|
|
47
|
Estrada-Gutierrez G, Cappello RE, Mishra
N, Romero R, Strauss JF III and Walsh SW: Increased expression of
matrix metalloproteinase-1 in systemic vessels of preeclamptic
women: A critical mediator of vascular dysfunction. Am J Pathol.
178:451–460. 2011. View Article : Google Scholar : PubMed/NCBI
|
|
48
|
Yang X and Meng T: MicroRNA-431 affects
trophoblast migration and invasion by targeting ZEB1 in
preeclampsia. Gene. 683:225–232. 2019. View Article : Google Scholar : PubMed/NCBI
|
|
49
|
Lv Y, Lu X, Li C, Fan Y, Ji X, Long W,
Meng L, Wu L, Wang L, Lv M and Ding H: miR-145-5p promotes
trophoblast cell growth and invasion by targeting FLT1. Life Sci.
239:1170082019. View Article : Google Scholar : PubMed/NCBI
|
|
50
|
Brkić J, Dunk C, O'Brien J, Fu G, Nadeem
L, Wang YL, Rosman D, Salem M, Shynlova O, Yougbaré I, et al:
MicroRNA-218-5p promotes endovascular trophoblast differentiation
and spiral artery remodeling. Mol Ther. 26:2189–2205. 2018.
View Article : Google Scholar : PubMed/NCBI
|
|
51
|
Hong F, Li Y and Xu Y: Decreased placental
miR-126 expression and vascular endothelial growth factor levels in
patients with pre-eclampsia. J Int Med Res. 42:1243–1251. 2014.
View Article : Google Scholar : PubMed/NCBI
|
|
52
|
Yan T, Liu Y, Cui K, Hu B, Wang F and Zou
L: MicroRNA-126 regulates EPCs function: Implications for a role of
miR-126 in preeclampsia. J Cell Biochem. 114:2148–2159. 2013.
View Article : Google Scholar : PubMed/NCBI
|
|
53
|
He P, Shao D, Ye M and Zhang G: Analysis
of gene expression identifies candidate markers and pathways in
pre-eclampsia. J Obstet Gynaecol. 35:578–584. 2015. View Article : Google Scholar : PubMed/NCBI
|
|
54
|
Ma Y, Lin H, Zhang H, Song X and Yang H:
Identification of potential crucial genes associated with
early-onset pre-eclampsia via a microarray analysis. J Obstet
Gynaecol Res. 43:812–819. 2017. View Article : Google Scholar : PubMed/NCBI
|
|
55
|
Song J, Li Y and An RF: Identification of
early-onset preeclampsia-related genes and MicroRNAs by
bioinformatics approaches. Reprod Sci. 22:954–963. 2015. View Article : Google Scholar : PubMed/NCBI
|
|
56
|
Gunel T, Hosseini MK, Gumusoglu E,
Kisakesen HI, Benian A and Aydinli K: Expression profiling of
maternal plasma and placenta microRNAs in preeclamptic pregnancies
by microarray technology. Placenta. 52:77–85. 2017. View Article : Google Scholar : PubMed/NCBI
|
|
57
|
Betoni JS, Derr K, Pahl MC, Rogers L,
Muller CL, Packard RE, Carey DJ, Kuivaniemi H and Tromp G: MicroRNA
analysis in placentas from patients with preeclampsia: Comparison
of new and published results. Hypertens Pregnancy. 32:321–339.
2013. View Article : Google Scholar : PubMed/NCBI
|
|
58
|
Lykoudi A, Kolialexi A, Lambrou GI,
Braoudaki M, Siristatidis C, Papaioanou GK, Tzetis M, Mavrou A and
Papantoniou N: Dysregulated placental microRNAs in early and late
onset preeclampsia. Placenta. 61:24–32. 2018. View Article : Google Scholar : PubMed/NCBI
|
|
59
|
Yang-Dong O, Ya-Xian L and Xue-qiong Z:
Excavation and bioinformatics analysis of early-onset preeclampsia
related MicroRNA and target genes. J Nongken Med. 40:494–499.
2018.
|