Introduction
Gallbladder cancer is the most common malignant
tumor of the biliary tract and is the third most common
gastrointestinal malignancy worldwide (1). Due to the vague clinical symptoms and
signs of gallbladder cancer, most patients are diagnosed at an
advanced stage (2). Since the
etiology and pathogenesis of gallbladder cancer are still unclear,
it is essential to research the molecular mechanism of the disease
and explore novel potential biomarkers that may assist early
diagnosis and treatment.
Gallbladder adenoma is a rare disease and rarely
malignant, but transformation may occur (3). Previous evidence has proposed that
adenomas are the premalignant lesions of gallbladder cancer
(3,4). However, the genetic evidence is still
poorly defined (5). Due to the poor
prognosis of gallbladder cancer, it is crucial to distinguish
benign and malignant gallbladder adenoma (6). There is a need for accurate diagnostic
methods to distinguish between benign and malignant diseases.
Currently, the size and number of gallbladder polyps, along with
patient age, are typically used to assist with distinguishing
benign and malignant diseases (7).
For example, previous research has found that conjugated bile acids
(glycochenodeoxycholic and taurochenodeoxycholic) could be
identified as possible biomarkers for cholesterol polyps and
adenomatous polyps, and the gallbladder bile acids
glycochenodeoxycholic acid and taurochenodeoxycholic acid are
highly expressed in cholesterol polyps (8). For patients with gallbladder
carcinoma, compared with healthy individuals and patients with
cholesterol polyps, serum vascular endothelial growth factors
(SVEGF)-C are closely related with lymph node metastasis, distant
metastasis and stage, in addition, SVEGF-D has a positive
relationship with the tumor depth, lymph, distant metastasis and
stage that could represent available biomarkers for the diagnosis
of gallbladder carcinoma (6).
The present study aimed to comprehensively analyze a
transcriptome profile and identify DEGs in gallbladder cancer based
on annotation analysis of microarray studies.
Materials and methods
Patients and tissue samples
Gallbladder stones (two men and one woman; age
range, 60–62 years), gallbladder adenoma (two men and one woman;
age range, 60–62 years) and gallbladder carcinoma (two men and one
woman; age range, 60–63 years) tissues (n=3 each) were obtained
from the Department of Pancreaticobiliary Surgery, the First
Affiliated Hospital of China Medical University between September
2018 and December 2019. All cases were reviewed by two or more
independent pathologists. No patients received radiation or
chemotherapy before surgery. During the surgery, fresh tumor
tissues or gallbladder wall tissues were collected in the operating
room and immediately frozen in liquid nitrogen within 15 min and
then stored in RNA Fixer reagent (Thermo Fisher Scientific, Inc.)
at −80°C for total RNA extraction. The present study was approved
by the Ethics Committee of The First Affiliated Hospital of China
Medical University (2018075). All patients who participated in the
study signed written informed consent.
RNA extraction and transcript
analysis
RNA extraction was performed using an RNeasy kit
(Qiagen, Inc.) according to the manufacturer's protocol. Total RNA
was quantified using a NanoDrop ND-2000 spectrophotometer (Thermo
Fisher Scientific, Inc.) and the RNA integrity was assessed with an
Agilent Bioanalyzer 2100 (Agilent Technologies, GmbH). Total RNA
samples were analyzed on the Agilent Bioanalyzer 2100 and amplified
RNA (aRNA) was prepared using the GeneChip 3′IVT Express kit
(Affymetrix; Thermo Fisher Scientific, Inc.). Briefly, cDNA was
synthesized by reverse transcription, and a double-stranded DNA
template was then obtained by second-strand synthesis.
Subsequently, an aRNA labeled with biotin was inverted in
vitro utilizing GeneChip 3′IVT Express kit (Affymetrix; Thermo
Fisher Scientific, Inc.) at 40°C for 16 h and stored at 4°C. The
aRNA was purified, fragmented and hybridized with the chip probe
(Beckman Coulter, Inc.). Following hybridization, the chip was
automatically washed using a GeneChip Hybridization Wash and Stain
kit (Affymetrix; Thermo Fisher Scientific, Inc.) and dyed using
GeneChip Fluidics Station 450 instrument (Affymetrix; Thermo Fisher
Scientific, Inc.). Finally, it was scanned to obtain the image and
the Affymetrix microarray data using a GeneChip Scanner 3000
(Affymetrix; Thermo Fisher Scientific, Inc.).
To obtain the raw data, the Feature Extraction
function in GeneSpring (version 10.5.1.1; Agilent Technologies,
GmbH) was utilized to analyze the array image. Briefly, the raw
data were normalized with the quantile algorithm. In the
experiment, probe groups in the lowest 20% of the signal strength
in the two sample groups were filtered as background noise. The
coefficient of variation of the probe group was calculated in the
sample group, and the probe group with a coefficient of variation
>25% in both groups were also filtered out. Finally, DEG
transcripts were identified.
To explore DEGs in different gallbladder diseases,
further analysis was conducted, as shown in Table I. In the present study, gallstones
served as normal samples compared with cholesterol polyps,
gallbladder adenoma and gallbladder cancer.
 | Table I.Six groups for differential
expression analysis via microarray analysis. |
Table I.
Six groups for differential
expression analysis via microarray analysis.
| Groups | Tissue type | Number of
samples | Comparison |
|---|
| Group I | Gallbladder
wall | 3 | Cholesterol polyps
vs. gallbladder stones |
| Group II | Gallbladder
wall | 3 | Gallbladder adenoma
vs. gallbladder stones |
| Group III | Gallbladder
wall | 3 | Gallbladder cancer
vs. gallbladder stones |
| Group IV | Gallbladder
wall | 3 | Gallbladder adenoma
vs. cholesterol polyps |
| Group V | Gallbladder
wall | 3 | Gallbladder cancer
vs. gallbladder adenoma |
| Group VI | Tumor tissue | 3 | Gallbladder cancer
vs. gallbladder adenoma |
Differential expression analysis
In the present study, linear models for microarray
data (version 3.44.3; Bioconductor) were performed based on
empirical Bayesian distribution to calculate the P-value (9). The screening criteria for DEGs was as
follows: |Fold change (FC)|>1.5 and P-value <0.05. To probe
out DEGs in cholesterol polyps, gallbladder adenoma and gallbladder
cancer, differential expression analyses including scatter plot
analysis, volcano plot analysis and hierarchical clustering
analysis were performed using GraphPad Prism (version 7.0; GraphPad
Software, Inc.).
Comparative analysis
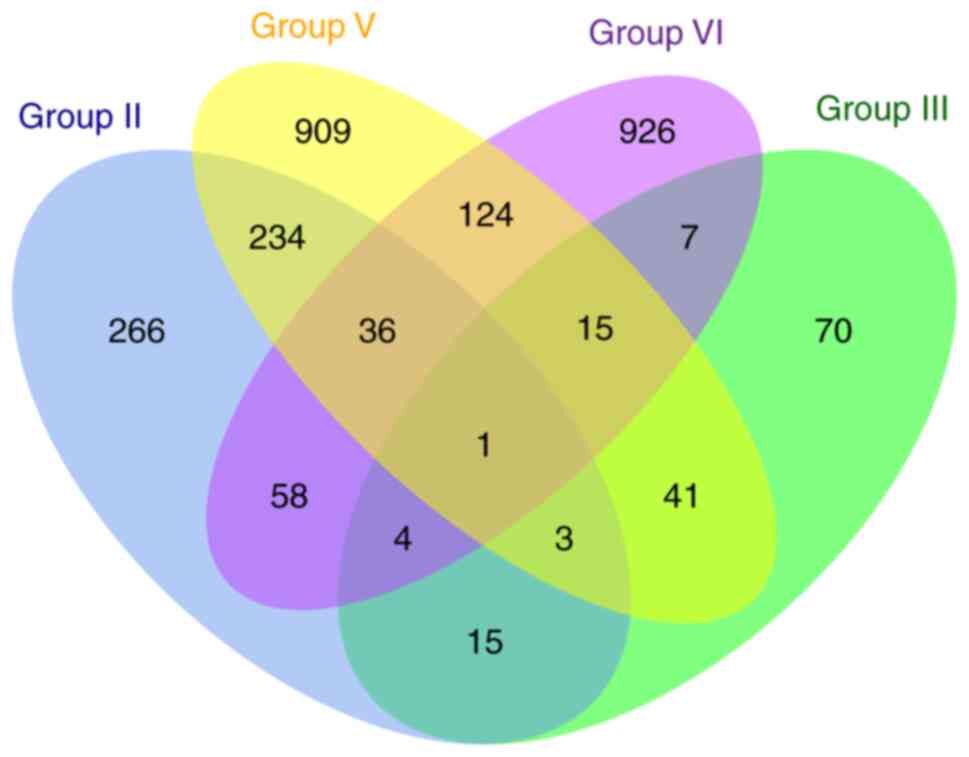
To explore differentially expressed genes between
different diseases a comparative analysis was undertaken, as shown
in Table II and Fig. 1. In group II, the gallbladder wall
of gallbladder adenoma and gallbladder wall of gallbladder stones
were compared. In group III, the gallbladder wall of gallbladder
cancer and gallbladder wall of gallbladder stone were compared. In
group IV, comparative analysis was performed between gallbladder
wall of gallbladder adenoma and gallbladder wall of cholesterol
polyps. For group V, comparative analysis between gallbladder wall
of gallbladder cancer and gallbladder wall of gallbladder adenoma
was presented.
| Table II.Comprehensive analysis of DEGs in the
six groups. |
Table II.
Comprehensive analysis of DEGs in the
six groups.
| Comparative
groups | Gallbladder wall of
gallstone | Cholesterol polyps
(gallbladder wall) | Gallbladder adenoma
(gallbladder wall) | Gallbladder cancer
(gallbladder wall) | Gallbladder adenoma
(tumor wall) | Gallbladder cancer
(tumor wall) |
|---|
| I | ○ | √ |
|
|
|
|
| II | ○ |
| √ |
|
|
|
| III | ○ |
|
| √ |
|
|
| IV |
| ○ | √ |
|
|
|
| V |
|
| ○ | √ |
|
|
| VI |
|
|
|
| ○ | √ |
| A |
|
|
|
|
|
|
|
a=I∩II∩III |
| √ | √ | √ |
|
|
|
b=II∩III-a |
|
| √ | √ |
|
|
|
c=II-b-I∩II |
|
| √ |
|
|
|
|
d=III-b-I∩III |
|
|
| √ |
|
|
| B=IV |
|
| √ |
|
|
|
| C=V∩VI |
|
|
| √ |
| √ |
| D=VI–V∩VI |
|
|
|
|
| √ |
Functional enrichment analysis
To explore the biological processes or pathways
involved in DEGs, Gene Ontology (GO; http://geneontology.org/) and Kyoto Encyclopedia of
Genes and Genomes (KEGG; http://www.kegg.jp/kegg/) pathway enrichment analyses
were performed (10,11). GO terms include ‘biological process’
(BP), ‘molecular function’ (MF) and ‘cellular component’ (CC).
Validation of the differential
expression and prognostic value of key genes using gene expression
profiling interactive analysis (GEPIA)
Key genes were verified by GEPIA (http://gepia.cancer-pku.cn/) in The Cancer Genome
Atlas (https://www.cancer.gov/about-nci/organization/ccg/research/structural-genomics/tcga)
and Genotype-Tissue Expression dataset (GTEx; http://commonfund.nih.gov/GTEx/) (12). Differential expression and overall
survival (OS) analyses were performed.
Reverse transcription-quantitative PCR
(RT-qPCR) assay
A total of 10 pairs of gallbladder cancer tissues
and normal tissues (five men and five woman; age range, 55–65
years) were collected from the Department of Pancreaticobiliary
Surgery, the First Affiliated Hospital of China Medical University
between September 2018 and December 2019. All patients signed
written informed consent. Total RNA was extracted from tissues
using TRIzol® reagent (Invitrogen; Thermo Fisher
Scientific, Inc.). According to the manufacturer's instructions,
reverse transcription was performed using a TaqMan Real-Time PCR
kit (Applied Biosystems; Thermo Fisher Scientific, Inc.). RT-qPCR
was run on a CFX96 Real-Time PCR detection system (Bio-Rad
Laboratories, Inc.). The following primer pairs were used for the
qPCR: HLA class II histocompatibility antigen, DP a1 chain
(HLA-DPB1) forward, 5′-ATGACACTCTTCTGAATTGACTG-3′ and reverse,
5′-GGTAATGATAAAACATGCTCTC-3′; nuclear receptor subfamily 4 group A
member 2 (NR4A2) forward, 5′-TCATCTCCTCAGACTGGGGG-3′ and reverse,
5′-TGTACCAAATGCCCCTGTCC-3′; ephrin-B2 (EFNB2) forward,
5′-TATGCAGAACTGCGATTTCCAA-3′ and reverse,
5′-TGGGTATAGTACCAGTCCTTGTC-3′; four and a half LIM domains protein
1 forward (FHL1), 5′-AAATGCACAAAGTGTGCCCG-3′ and reverse,
5′-TCGTTTGGGACACTCAGCAC-3′; insulin-like growth factor-binding
protein 7 (IGFBP7) forward, 5′-ACAGTGGTTGATGCCTTAC-3′ and reverse,
5′-CCCTTATGGGTTGCTAACTAC-3′; Rho Family GTPase (RND) forward,
5′-CTATGACCAGGGGGCAAATA-3′ and reverse, 5′-TCTTCGCTTTGTCCTTTCGT-3′;
E3 ubiquitin-protein ligase NEURL1B (NEURL1B) forward,
5′-ACAGCAGCTTCCAAGACACA-3′ and reverse, 5′-GTTGGGCAGGCTGTAGTAGG-3′;
and GAPDH forward, 5′-ACTCCCATTCTTCCACCTTTG-3′ and reverse,
5′-CCCTGTTGCTGTAGCCATATT-3′. GADPH served as an internal control.
The relative expression levels were determined using the
2−ΔΔCq method (13).
Statistical analysis
All statistical analysis was conducted on R
(14) or GraphPad Prism 7.0
(GraphPad Software, Inc.). Data were expressed as the mean ± SD.
Each experiment was repeated at least three times. Comparisons
between groups were analyzed by a Student's t-test. GO and KEGG
annotation enrichment analyses were evaluated using a Fisher's
exact test. For OS analysis, the samples were divided into high and
low expression groups according to the median expression value of
key genes. Differences between two groups were compared with
Kaplan-Meier curves, followed by log-rank test. P<0.05 was
considered to indicate a statistically significant difference.
Results
Transcript analysis results
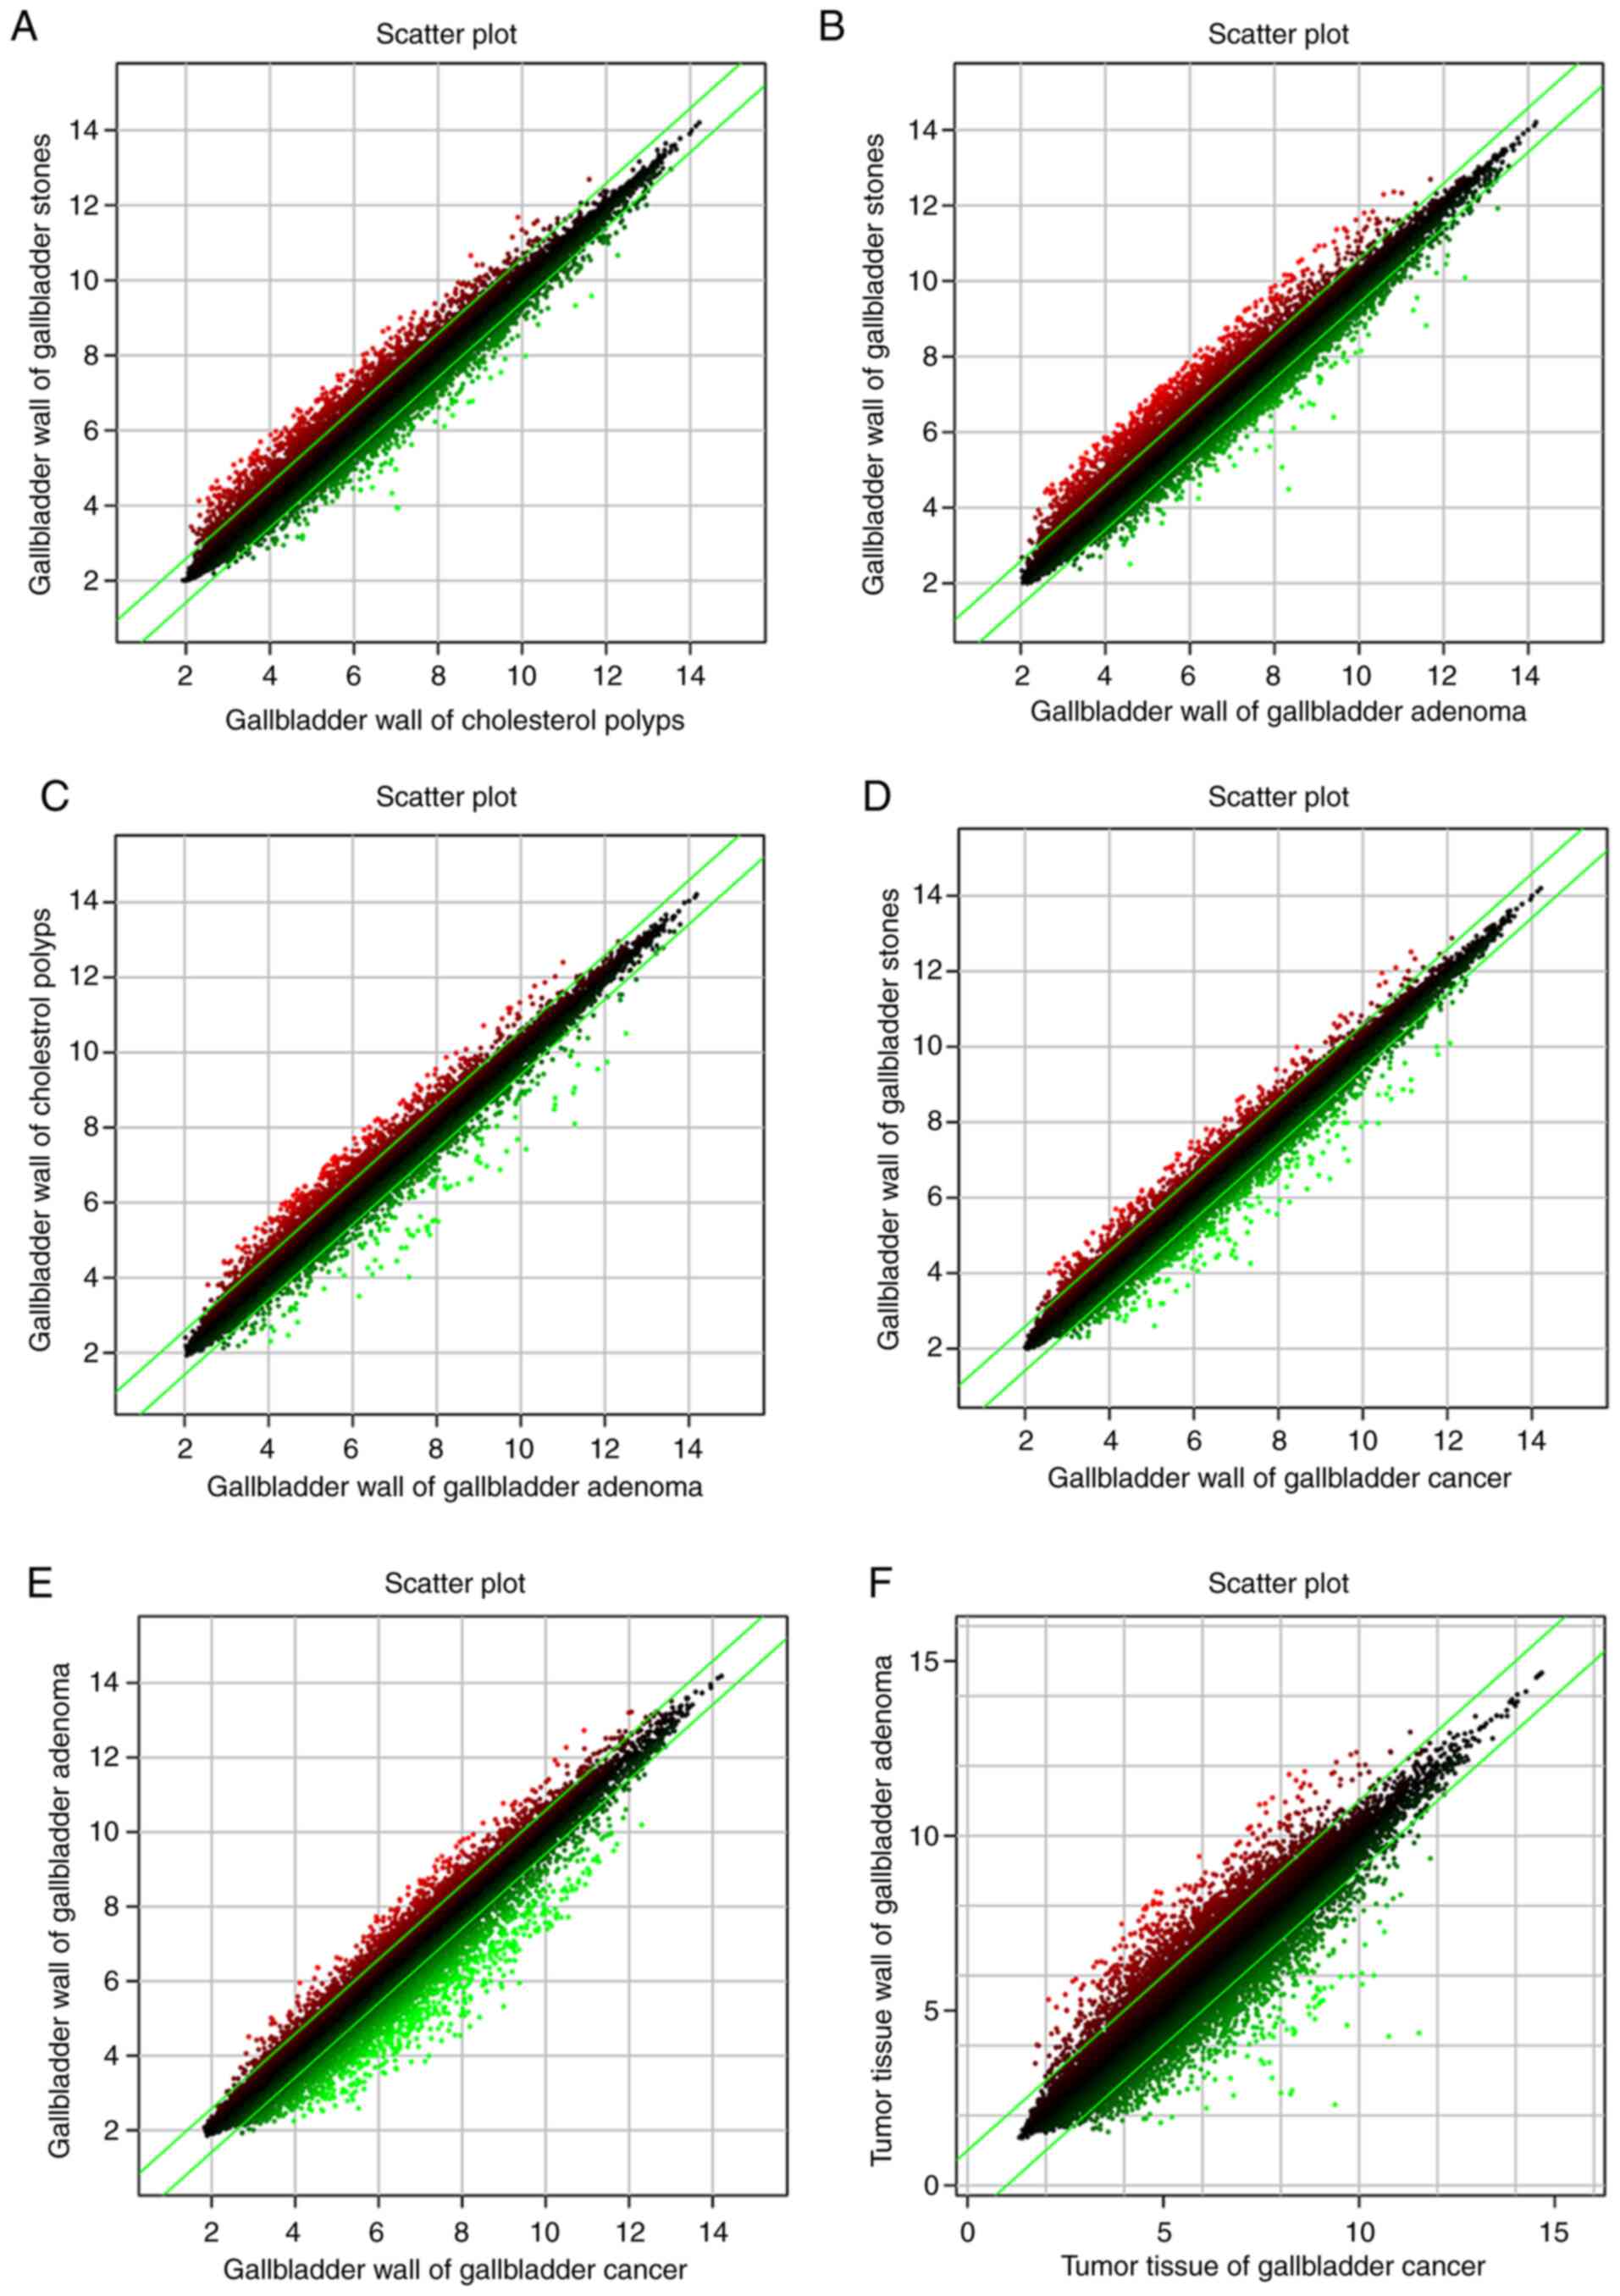
In the present study, the gene expression profiles
in the compared groups were analyzed via microarray analysis. The
differential expression analysis results were shown in Table III according to |FC|>1.5 and
P-value <0.05. The DEGs were marked for further analysis
(Tables SI–SVI listed all DEGs in the six compared
groups). The scatter plots show the distribution of upregulated
genes in the two groups (Fig. 2).
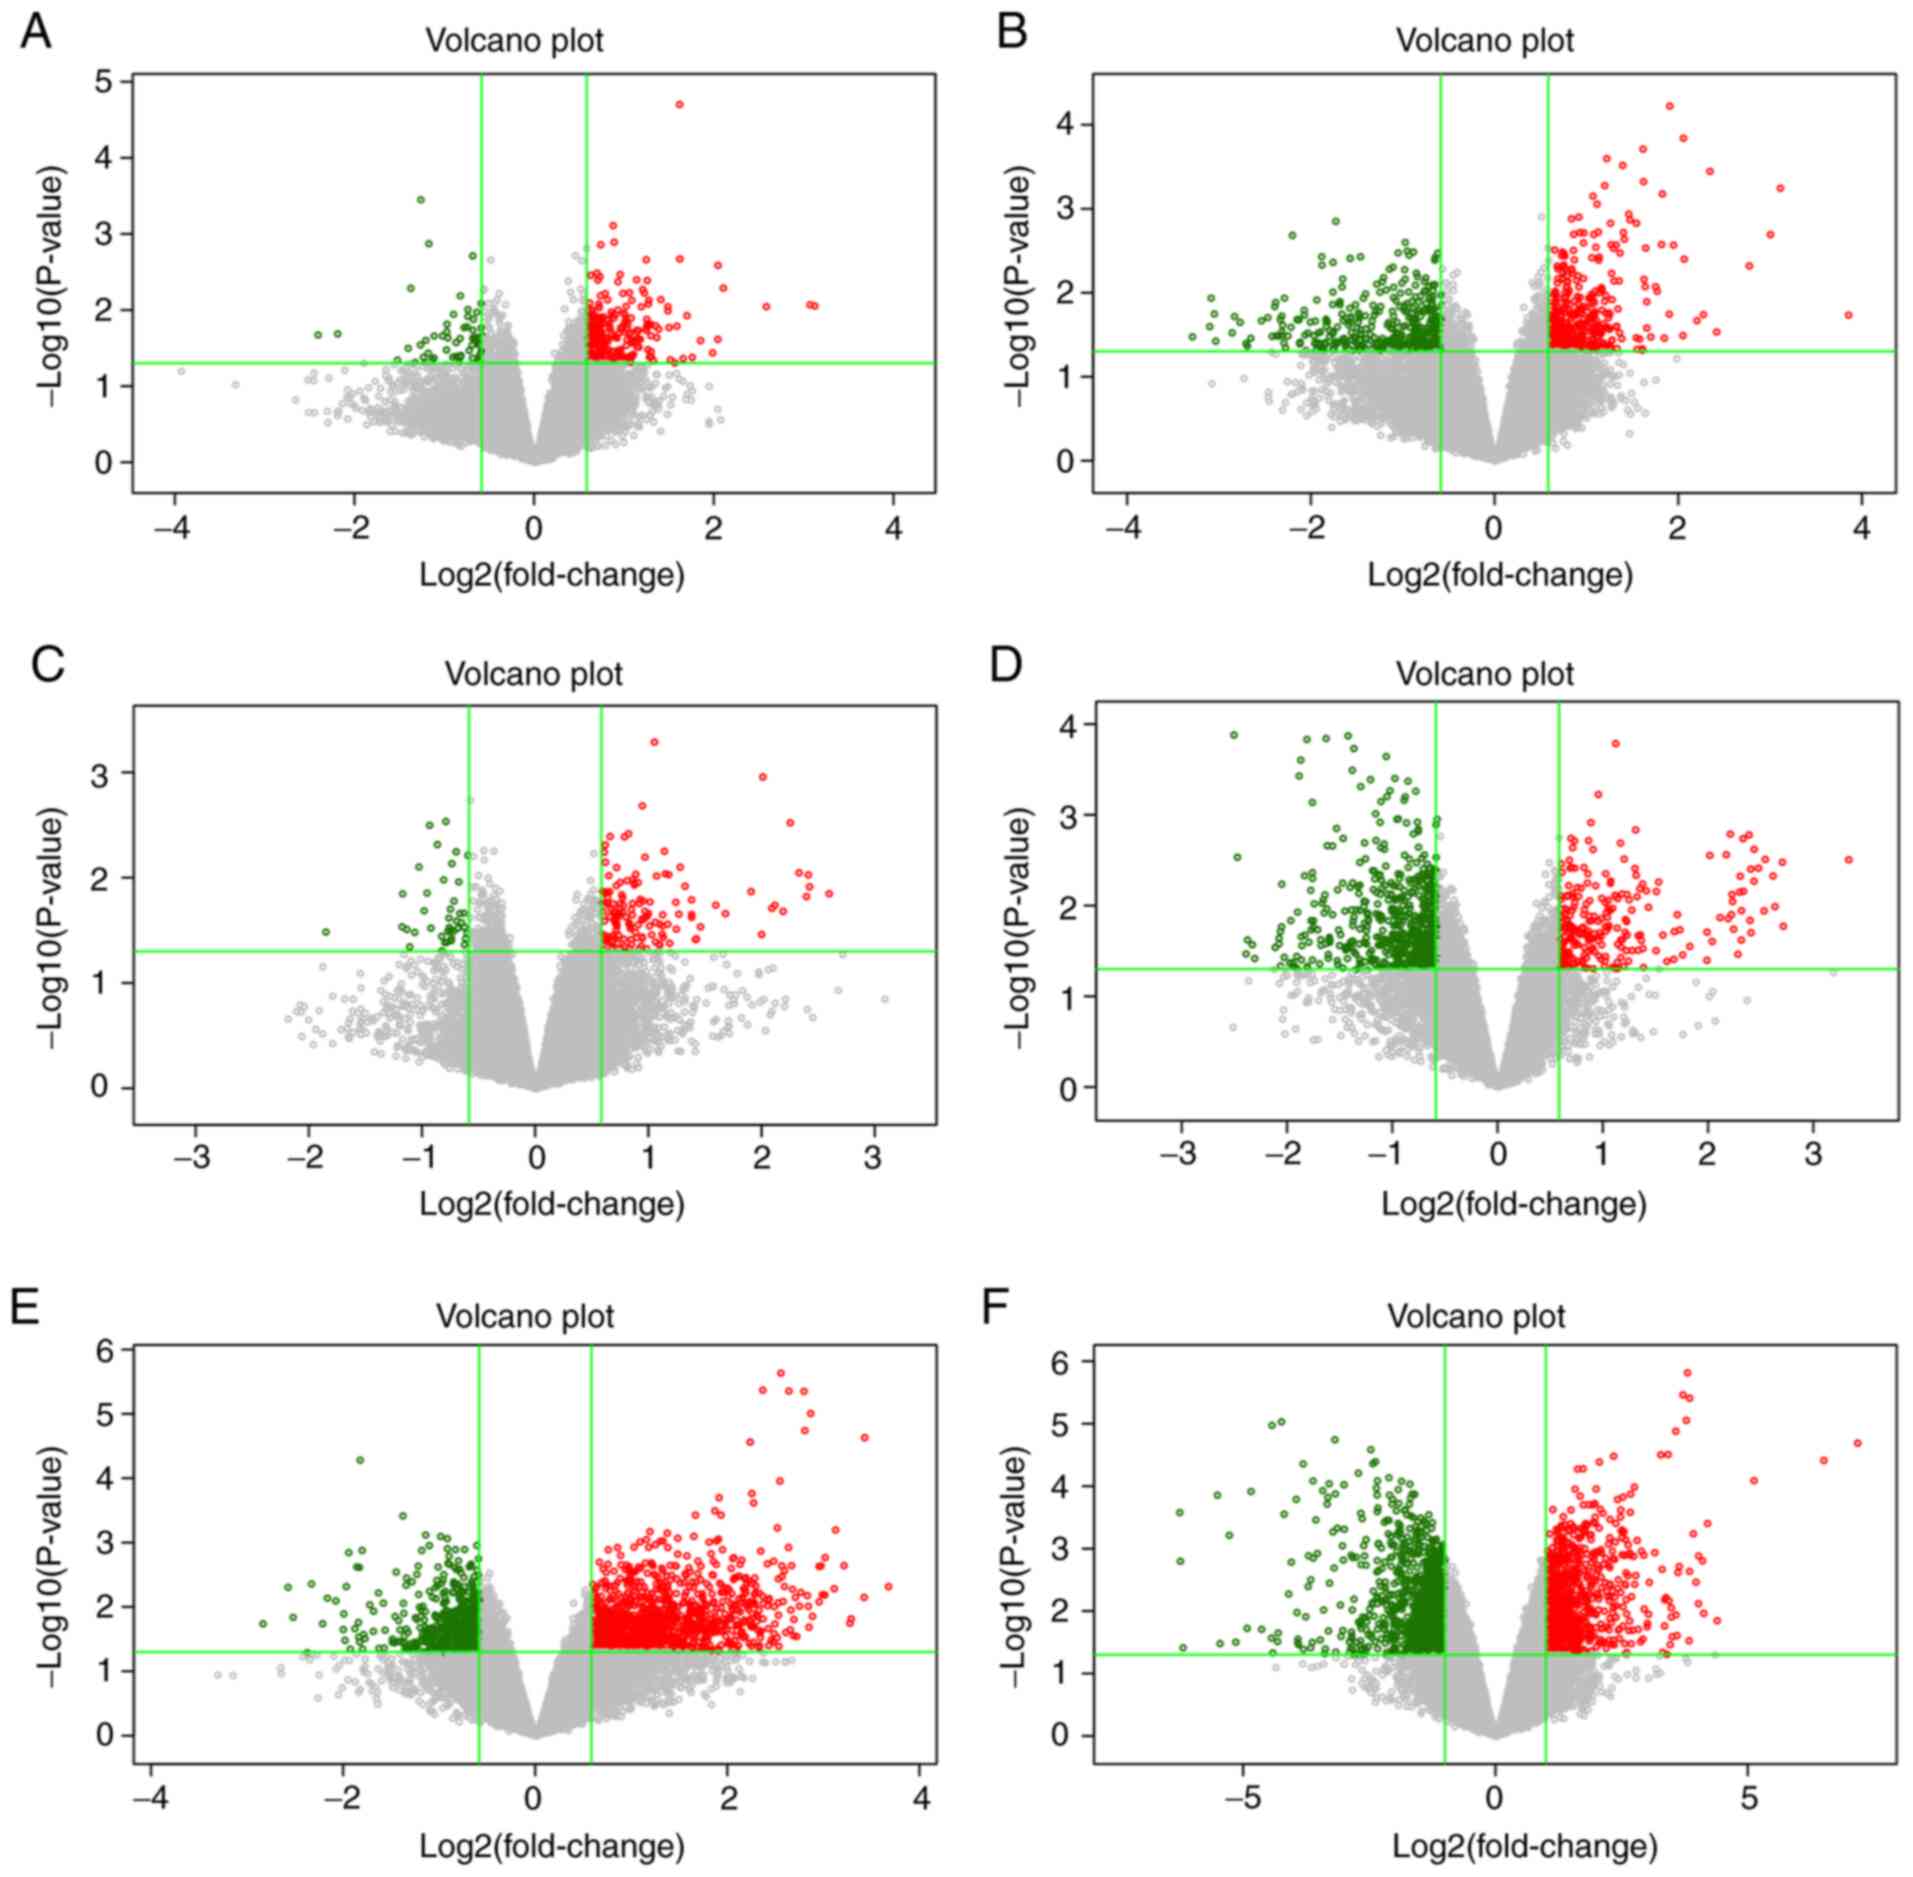
The volcano plots were used to show the DEGs between different
compared groups. In Fig. 3, the red
and green dots represented DEGs with the criteria of | FC |>1.5
and P-value <0.05, and the gray dot indicates genes with no
significant difference.
| Table III.Differentially expressed genes in six
different comparative groups. |
Table III.
Differentially expressed genes in six
different comparative groups.
| Comparative
groups | Total number of
upregulated genes | Total number of
downregulated genes |
|---|
| I | 198 | 43 |
| II | 346 | 271 |
| III | 116 | 40 |
| IV | 182 | 502 |
| V | 830 | 533 |
| VI | 540 | 632 |
To effectively distinguish DEGs in the different
comparison groups, unsupervised hierarchical clustering analysis
was performed. This analysis could distinguish between the
different samples in the six comparison groups (Figs. S1–S6).
Comparative analysis
In comparison A (Groups I–III; Table II): i) A total of eight commonly
upregulated genes [including Uncharacterized LOC101928168
(LOC101928168), 3-Hydroxy-3-Methylglutaryl-CoA Synthase 2 (HMGCS2),
Secretagogin, EF-Hand Calcium Binding Protein (SCGN), Chimerin 2
(CHN2), X-Linked Kx Blood Group (XK), Mucin 6, Oligomeric
Mucus/Gel-Forming (MUC6), Phospholipid Phosphatase 5 (PLPP5) and
Heat Shock Protein Family H Member 1 (HSPH1)] and one downregulated
gene [ST8 α-N-Acetyl-Neuraminide α-2,8-Sialyltransferase 4
(ST8SIA4)] were identified in cholesterol polyps, gallbladder
adenoma and gallbladder cancer for gallbladder walls (data not
shown); ii) A total of 14 common DEGs were found to overlap in the
gallbladder wall of gallbladder cancer and gallbladder adenoma
(Table IV); iii) A total of 273
differentially upregulated genes were only expressed in the
gallbladder wall of gallbladder adenoma, of which the 20 most
significantly DEGs, according to the FC, were selected to continue
further analysis (Tables IV and
V). A total of 85 upregulated genes
were identified in the gallbladder wall of gallbladder cancer
(Table VI). The 20 most
significantly DEGs were selected, as shown in Table VI.
| Table IV.Common DEGs in the gallbladder wall
of gallbladder cancer and gallbladder adenoma. |
Table IV.
Common DEGs in the gallbladder wall
of gallbladder cancer and gallbladder adenoma.
| A, Upregulated
genes |
|---|
|
|---|
| Entrez accession
no. | Gene symbol | Gene name | Fold-change | P-value | False discovery
rate |
|---|
| 1906 | EDN1 | Endothelin 1 | 1.549618769 | 0.029390674 | 0.955609729 |
| 83661 | MS4A8 | Membrane-spanning
4-domains, subfamily A, member 8 | 2.003454854 | 0.016940921 | 0.955609729 |
| 213 | ALB | Albumin | 2.246885592 | 0.044086126 | 0.955609729 |
| 10232 | MSLN | Mesothelin | 3.577553479 | 0.034944882 | 0.955609729 |
| 1515 | CTSV | Cathepsin V | 1.810360067 | 0.018438263 | 0.955609729 |
| 573 | BAG1 | BCL2 associated
athanogene 1 | 1.619984489 | 0.045294551 | 0.955609729 |
| 100507412 | LOC100507412 | Uncharacterized
LOC100507412 | 2.405560916 | 0.00588484 | 0.955609729 |
| 55283 | MCOLN3 | Mucolipin 3 | 2.597985418 | 0.035436453 | 0.955609729 |
| 7586 | ZKSCAN1 | Zinc finger with
KRAB and SCAN domains 1 | 2.303988209 | 0.010795501 | 0.955609729 |
|
| B, Downregulated
genes |
|
| Entrez accession
no. | Gene
symbol | Gene
name |
Fold-change | P-value | False discovery
rate |
|
| 6926 | TBX3 | T-box 3 | −1.97381941 | 0.024886922 | 0.955609729 |
| 25987 | TSKU | Tsukushi, small
leucine rich proteoglycan | −1.506934454 | 0.049505143 | 0.955609729 |
| 6319 | SCD | Stearoyl-coa
desaturase (delta-9-desaturase) | −1.692411038 | 0.031149526 | 0.955609729 |
| 4857 | NOVA1 | Neuro-oncological
ventral antigen 1 | −1.754139316 | 0.041834676 | 0.955609729 |
| 5209 | PFKFB3 |
6-phosphofructo-2-kinase/fructose-2,6-biphosphatase
3 | −1.859592699 | 0.015450602 | 0.955609729 |
| Table V.Top 20 upregulated genes in the
gallbladder wall of gallbladder adenoma. |
Table V.
Top 20 upregulated genes in the
gallbladder wall of gallbladder adenoma.
| Entrez accession
no. | Gene symbol | Gene name | Fold-change | P-value | False discovery
rate |
|---|
| 3115 | HLA-DPB1 | Major
histocompatibility complex, class II, DP β1 | 14.39294587 | 0.018542717 | 0.95561 |
| 10321 | CRISP3 | Cysteine-rich
secretory protein 3 | 8.596046776 | 0.000569554 | 0.95561 |
| 9153 | SLC28A2 | Solute carrier
family 28 (concentrative nucleoside transporter), member 2 | 7.972874721 | 0.002038587 | 0.95561 |
| 1733 | DIO1 | Deiodinase,
iodothyronine, type I | 4.13402372 | 0.000144984 | 0.95561 |
| 2568 | GABRP | γ-aminobutyric acid
(GABA) A receptor, pi | 4.11863611 | 0.032541353 | 0.95561 |
| 6555 | SLC10A2 | Solute carrier
family 10 (sodium/bile acid cotransporter), member 2 | 3.729761379 | 5.99474E-05 | 0.95561 |
| 6819 | SULT1C2 | Sulfotransferase
family 1C member 2 | 3.716642697 | 0.018104673 | 0.95561 |
| 4496 | MT1H | Metallothionein
1H | 3.527957872 | 0.000668336 | 0.95561 |
| 4494 | MT1F | Metallothionein
1F | 3.505661422 | 0.002675451 | 0.95561 |
| 54346 | UNC93A | Unc-93 homolog A
(C. Elegans) | 3.355156356 | 0.008516354 | 0.95561 |
| 148523 | CIART | Circadian
associated repressor of transcription | 3.136234278 | 0.026466979 | 0.95561 |
| 388561 | ZNF761 | Zinc finger protein
761 | 3.111132847 | 0.002949854 | 0.95561 |
| 100127888 | SLCO4A1-AS1 | SLCO4A1 antisense
RNA 1 | 3.072422599 | 0.006932207 | 0.95561 |
| 4495 | MT1G | Metallothionein
1G | 3.050121402 | 0.00019533 | 0.95561 |
| 2069 | EREG | Epiregulin | 3.031503175 | 0.048716806 | 0.95561 |
| 7364 | UGT2B7 | UDP
glucuronosyltransferase 2 family, polypeptide B7 | 2.971195084 | 0.035730027 | 0.95561 |
| 3821 | KLRC1 | Killer cell
lectin-like receptor subfamily C, member 1 | 2.902803001 | 0.00149172 | 0.95561 |
| 3822 | KLRC2 | Killer cell
lectin-like receptor subfamily C, member 2 | 2.902803001 | 0.00149172 | 0.95561 |
| 10562 | OLFM4 | Olfactomedin 4 | 2.899525179 | 0.03455814 | 0.95561 |
| 990 | CDC6 | Cell division cycle
6 | 2.763474564 | 0.001361724 | 0.95561 |
| Table VI.Top 20 upregulated genes in the
gallbladder wall of gallbladder cancer. |
Table VI.
Top 20 upregulated genes in the
gallbladder wall of gallbladder cancer.
| Entrez accession
no. | Gene symbol | Gene name | Fold-change | P-value | False discovery
rate |
|---|
| 54474 | KRT20 | Keratin 20, type
I | 6.027529 | 0.014263 | 0.99994 |
| 11075 | STMN2 | Stathmin 2 | 4.545556 | 0.021002 | 0.99994 |
| 22943 | DKK1 | Dickkopf WNT
signaling pathway inhibitor 1 | 3.983841 | 0.034789 | 0.99994 |
| 3790 | KCNS3 | Potassium
voltage-gated channel, modifier subfamily S, member 3 | 3.193245 | 0.022064 | 0.99994 |
| 3606 | IL18 | Interleukin 18 | 2.740635 | 0.029388 | 0.99994 |
| 8174 | MADCAM1 | Mucosal vascular
addressin cell adhesion molecule 1 | 2.657304 | 0.038834 | 0.99994 |
| 1305 | COL13A1 | Collagen, type
XIII, α1 | 2.593326 | 0.016279 | 0.99994 |
| 7171 | TPM4 | Tropomyosin 4 | 2.492788 | 0.012088 | 0.99994 |
| 84189 | SLITRK6 | SLIT and NTRK like
family member 6 | 2.419904 | 0.007957 | 0.99994 |
| 79966 | SCD5 | Stearoyl-CoA
desaturase 5 | 2.399926 | 0.02229 | 0.99994 |
| 56892 | C8orf4 | Chromosome 8 open
reading frame 4 | 2.363066 | 0.030948 | 0.99994 |
| 81671 | VMP1 | Vacuole membrane
protein 1 | 2.354891 | 0.017192 | 0.99994 |
| 406991 | MIR21 | MicroRNA 21 | 2.354891 | 0.017192 | 0.99994 |
| 55612 | FERMT1 | Fermitin family
member 1 | 2.268497 | 0.042115 | 0.99994 |
| 55816 | DOK5 | Docking protein
5 | 2.254499 | 0.009369 | 0.99994 |
| 24147 | FJX1 | Four jointed box
1 | 2.241426 | 0.027788 | 0.99994 |
| 2043 | EPHA4 | EPH receptor
A4 | 2.181555 | 0.036922 | 0.99994 |
| 1908 | EDN3 | Endothelin 3 | 2.174776 | 0.02892 | 0.99994 |
| 1316 | KLF6 | Kruppel-like factor
6 | 2.17353 | 0.022611 | 0.99994 |
| 440712 | C1orf186 | Chromosome 1 open
reading frame 186 | 2.165575 | 0.034576 | 0.99994 |
| 5318 | PKP2 | Plakophilin 2 | 2.134774 | 0.043853 | 0.99994 |
| 63923 | TNN | Tenascin N | 2.081014 | 0.040874 | 0.99994 |
| 78989 | COLEC11 | Collectin subfamily
member 11 | 2.067131 | 0.000518 | 0.99994 |
| 100131541 | LOC100131541 | Uncharacterized
LOC100131541 | 2.032802 | 0.035034 | 0.99994 |
| 5727 | PTCH1 | Patched 1 | 2.01107 | 0.017085 | 0.99994 |
| 1359 | CPA3 | Carboxypeptidase A3
(mast cell) | 1.992477 | 0.022002 | 0.99994 |
| 3775 | KCNK1 | Potassium channel,
two pore domain subfamily K, member 1 | 1.975891 | 0.02328 | 0.99994 |
| 5732 | PTGER2 | Prostaglandin E
receptor 2 | 1.95077 | 0.006402 | 0.99994 |
| 51751 | HIGD1B | HIG1 hypoxia
inducible domain family member 1B | 1.9257 | 0.025133 | 0.99994 |
| 23705 | CADM1 | Cell adhesion
molecule 1 | 1.907871 | 0.044745 | 0.99994 |
In comparison B (Group IV; Table I), 684 DEGs in the gallbladder wall
of gallbladder adenoma, of which 182 were upregulated and 502 were
downregulated, shown in Table SIV.
The top 20 DEGs are shown in Table
VII. In comparison C, it was revealed that 177 DEGs were
expressed both in the tumor tissue and gallbladder wall in
gallbladder cancer. The 20 most significantly DEGs were selected
according to the FC (Table
VIII). In comparison D, 459 upregulated genes were found in the
tumor of gallbladder cancer. The top 20 upregulated genes that were
identified according to FC in Table
IX.
| Table VII.Top 20 upregulated genes in the
gallbladder wall of gallbladder adenoma compared with the
gallbladder wall of cholesterol polyps. |
Table VII.
Top 20 upregulated genes in the
gallbladder wall of gallbladder adenoma compared with the
gallbladder wall of cholesterol polyps.
| Entrez accession
no. | Gene symbol | Gene name | Fold-change | P-value | False discovery
rate |
|---|
| 8076 | MFAP5 | Microfibrillar
associated protein 5 | 10.055828 | 0.00313194 | 0.930859211 |
| 8483 | CILP | Cartilage
intermediate layer protein | 5.7556811 | 0.01148426 | 0.930859211 |
| 8839 | WISP2 | WNT1 inducible
signaling pathway protein 2 | 5.0126842 | 0.001836636 | 0.930859211 |
| 4495 | MT1G | Metallothionein
1G | 4.958911 | 0.024060491 | 0.930859211 |
| 4496 | MT1H | Metallothionein
1H | 4.7119253 | 0.018260689 | 0.930859211 |
| 2202 | EFEMP1 | EGF containing
fibulin-like extracellular matrix protein 1 | 3.9536176 | 0.019679555 | 0.930859211 |
| 7364 | UGT2B7 | UDP
glucuronosyltransferase 2 family, polypeptide B7 | 3.9512615 | 0.040165838 | 0.930859211 |
| 3489 | IGFBP6 | Insulin like growth
factor binding protein 6 | 3.3672636 | 0.035074166 | 0.930859211 |
| 10562 | OLFM4 | Olfactomedin 4 | 3.3045794 | 0.018570013 | 0.930859211 |
| 4494 | MT1F | Metallothionein
1F | 3.2510145 | 0.01264233 | 0.930859211 |
| 64167 | ERAP2 | Endoplasmic
reticulum aminopeptidase 2 | 3.1751689 | 0.039260457 | 0.930859211 |
| 1543 | CYP1A1 | Cytochrome P450,
family 1, subfamily A, polypeptide 1 | 3.0349092 | 0.041312515 | 0.930859211 |
| 388561 | ZNF761 | Zinc finger protein
761 | 2.8743053 | 0.00550548 | 0.930859211 |
| 683 | BST1 | Bone marrow stromal
cell antigen 1 | 2.8327043 | 0.00702193 | 0.930859211 |
| 55057 | AIM1L | Absent in melanoma
1-like | 2.8267351 | 0.031481094 | 0.930859211 |
| 100127888 | SLCO4A1-AS1 | SLCO4A1 antisense
RNA 1 | 2.689454 | 0.01048406 | 0.930859211 |
| 30835 | CD209 | CD209 molecule | 2.6028341 | 0.048163532 | 0.930859211 |
| 148523 | CIART | Circadian
associated repressor of transcription | 2.5922233 | 0.029837355 | 0.930859211 |
| 10720 | UGT2B11 | UDP
glucuronosyltransferase 2 family, polypeptide B11 | 2.5871195 | 0.005778714 | 0.930859211 |
| 2199 | FBLN2 | Fibulin 2 | 2.5660098 | 0.024397318 | 0.930859211 |
| Table VIII.Top 20 upregulated genes both in the
tumor and gallbladder wall in gallbladder cancer. |
Table VIII.
Top 20 upregulated genes both in the
tumor and gallbladder wall in gallbladder cancer.
| Entrez accession
no. | Gene symbol | Gene name | Fold-change | P-value | False discovery
rate |
|---|
| 1490 | CTGF | Connective tissue
growth factor | 12.721 | 0.0049 | 0.663 |
| 3115 | HLA-DPB1 | Major
histocompatibility complex, class II, DP β1 | 8.0389 | 0.0066 | 0.663 |
| 3400 | ID4 | Inhibitor of DNA
binding 4, dominant negative helix-loop-helix protein | 6.919 | 4E-06 | 0.044 |
| 3399 | ID3 | Inhibitor of DNA
binding 3, dominant negative helix-loop-helix protein | 5.8099 | 0.0001 | 0.435 |
| 1282 | COL4A1 | Collagen, type IV,
α1 | 5.3601 | 0.0398 | 0.663 |
| 4929 | NR4A2 | Nuclear receptor
subfamily 4 group A member 2 | 5.0011 | 0.0113 | 0.663 |
| 2669 | GEM | GTP binding protein
overexpressed in skeletal muscle | 4.6392 | 0.0094 | 0.663 |
| 1948 | EFNB2 | Ephrin-B2 | 4.5216 | 0.0087 | 0.663 |
| 3397 | ID1 | Inhibitor of DNA
binding 1, dominant negative helix-loop-helix protein | 4.3673 | 0.0121 | 0.663 |
| 2919 | CXCL1 | Chemokine (C-X-C
motif) ligand 1 (melanoma growth stimulating activity, α) | 4.2191 | 0.0453 | 0.663 |
| 390 | RND3 | Rho family GTPase
3 | 4.1688 | 0.0017 | 0.663 |
| 2273 | FHL1 | Four and a half LIM
domains 1 | 4.1366 | 0.011 | 0.663 |
| 3490 | IGFBP7 | Insulin like growth
factor binding protein 7 | 4.1039 | 0.0369 | 0.663 |
| 54492 | NEURL1B | Neuralized E3
ubiquitin protein ligase 1B | 3.8487 | 0.0083 | 0.663 |
| 301 | ANXA1 | Annexin A1 | 3.811 | 0.0242 | 0.663 |
| 10631 | POSTN | Periostin,
osteoblast specific factor | 3.7339 | 0.0224 | 0.663 |
| 79772 | MCTP1 | Multiple C2
domains, transmembrane 1 | 3.6779 | 0.0247 | 0.663 |
| 3486 | IGFBP3 | Insulin like growth
factor binding protein 3 | 3.4581 | 0.0304 | 0.663 |
| 5327 | PLAT | Plasminogen
activator, tissue | 3.288 | 0.0023 | 0.663 |
| 26353 | HSPB8 | Heat shock protein
family B (small) member 8 | 3.2012 | 0.0416 | 0.663 |
| Table IX.Top 20 upregulated genes in the tumor
of gallbladder cancer. |
Table IX.
Top 20 upregulated genes in the tumor
of gallbladder cancer.
| Entrez accession
no. | Gene symbol | Gene name | Fold-change | P-value | False discovery
rate |
|---|
| 1048 | CEACAM5 | Carcinoembryonic
antigen-related cell adhesion molecule 5 | 143.4154524 |
2.06062×10⁻⁵ | 0.0894515 |
| 10562 | OLFM4 | Olfactomedin 4 | 90.22299879 |
3.89271×10⁻⁵ | 0.0960529 |
| 7020 | TFAP2A | Transcription
factor AP-2 α (activating enhancer binding protein 2 α) | 18.24994233 |
3.9829×10⁻⁴ | 0.1609015 |
| 1015 | CDH17 | Cadherin 17, LI
cadherin (liver-intestine) | 16.14818371 |
1.31492×10⁻³ | 0.1871078 |
| 10451 | VAV3 | VAV guanine
nucleotide exchange factor 3 | 16.0872594 |
7.651281×10⁻³ | 0.2974407 |
| 1604 | CD55 | CD55 molecule,
decay accelerating factor for complement (Cromer blood group) | 14.25260113 |
3.93845×10⁻⁶ | 0.0512905 |
| 1373 | CPS1 | Carbamoyl-phosphate
synthase 1 | 14.14519343 |
2.998467×10⁻² | 0.3979446 |
| 3872 | KRT17 | Keratin 17, type
I | 11.21846461 |
2.5881794×10⁻² | 0.3854011 |
| 5268 | SERPINB5 | Serpin peptidase
inhibitor, clade B (ovalbumin), member 5 | 11.07304422 |
1.2500212×10⁻² | 0.3344667 |
| 9843 | HEPH | Hephaestin | 11.07030706 |
8.947495×10⁻³ | 0.3090802 |
| 213 | ALB | Albumin | 10.91257754 | 0.034730042 | 0.408424 |
| 3158 | HMGCS2 |
3-hydroxy-3-methylglutaryl-CoA synthase 2
(mitochondrial) | 10.74010853 |
6.900844×10⁻³ | 0.2884597 |
| 63928 | CHP2 | Calcineurin-like
EF-hand protein 2 | 7.987754539 |
1.5774911×10⁻² | 0.3509474 |
| 7031 | TFF1 | Trefoil factor
1 | 7.9601374 | 0.017823277 | 0.3616271 |
| 11074 | TRIM31 | Tripartite motif
containing 31 | 7.589614806 |
1.280721×10⁻³ | 0.1871078 |
| 23213 | SULF1 | Sulfatase 1 | 7.505284011 |
2.8219398×10⁻² | 0.3929094 |
| 3216 | HOXB6 | Homeobox B6 | 7.355635549 |
1.101194×10⁻³ | 0.1861479 |
| 84419 | C15orf48 | Chromosome 15 open
reading frame 48 | 7.266966891 |
3.1186816×10⁻² | 0.4004668 |
| 2982 | GUCY1A3 | Guanylate cyclase
1, soluble, α3 | 7.041356237 |
1.9708261×10⁻² | 0.3677601 |
| 8329 | HIST1H2AI | Histone cluster 1,
h2ai | 6.935644729 |
7.41761×10⁻⁴ | 0.1737322 |
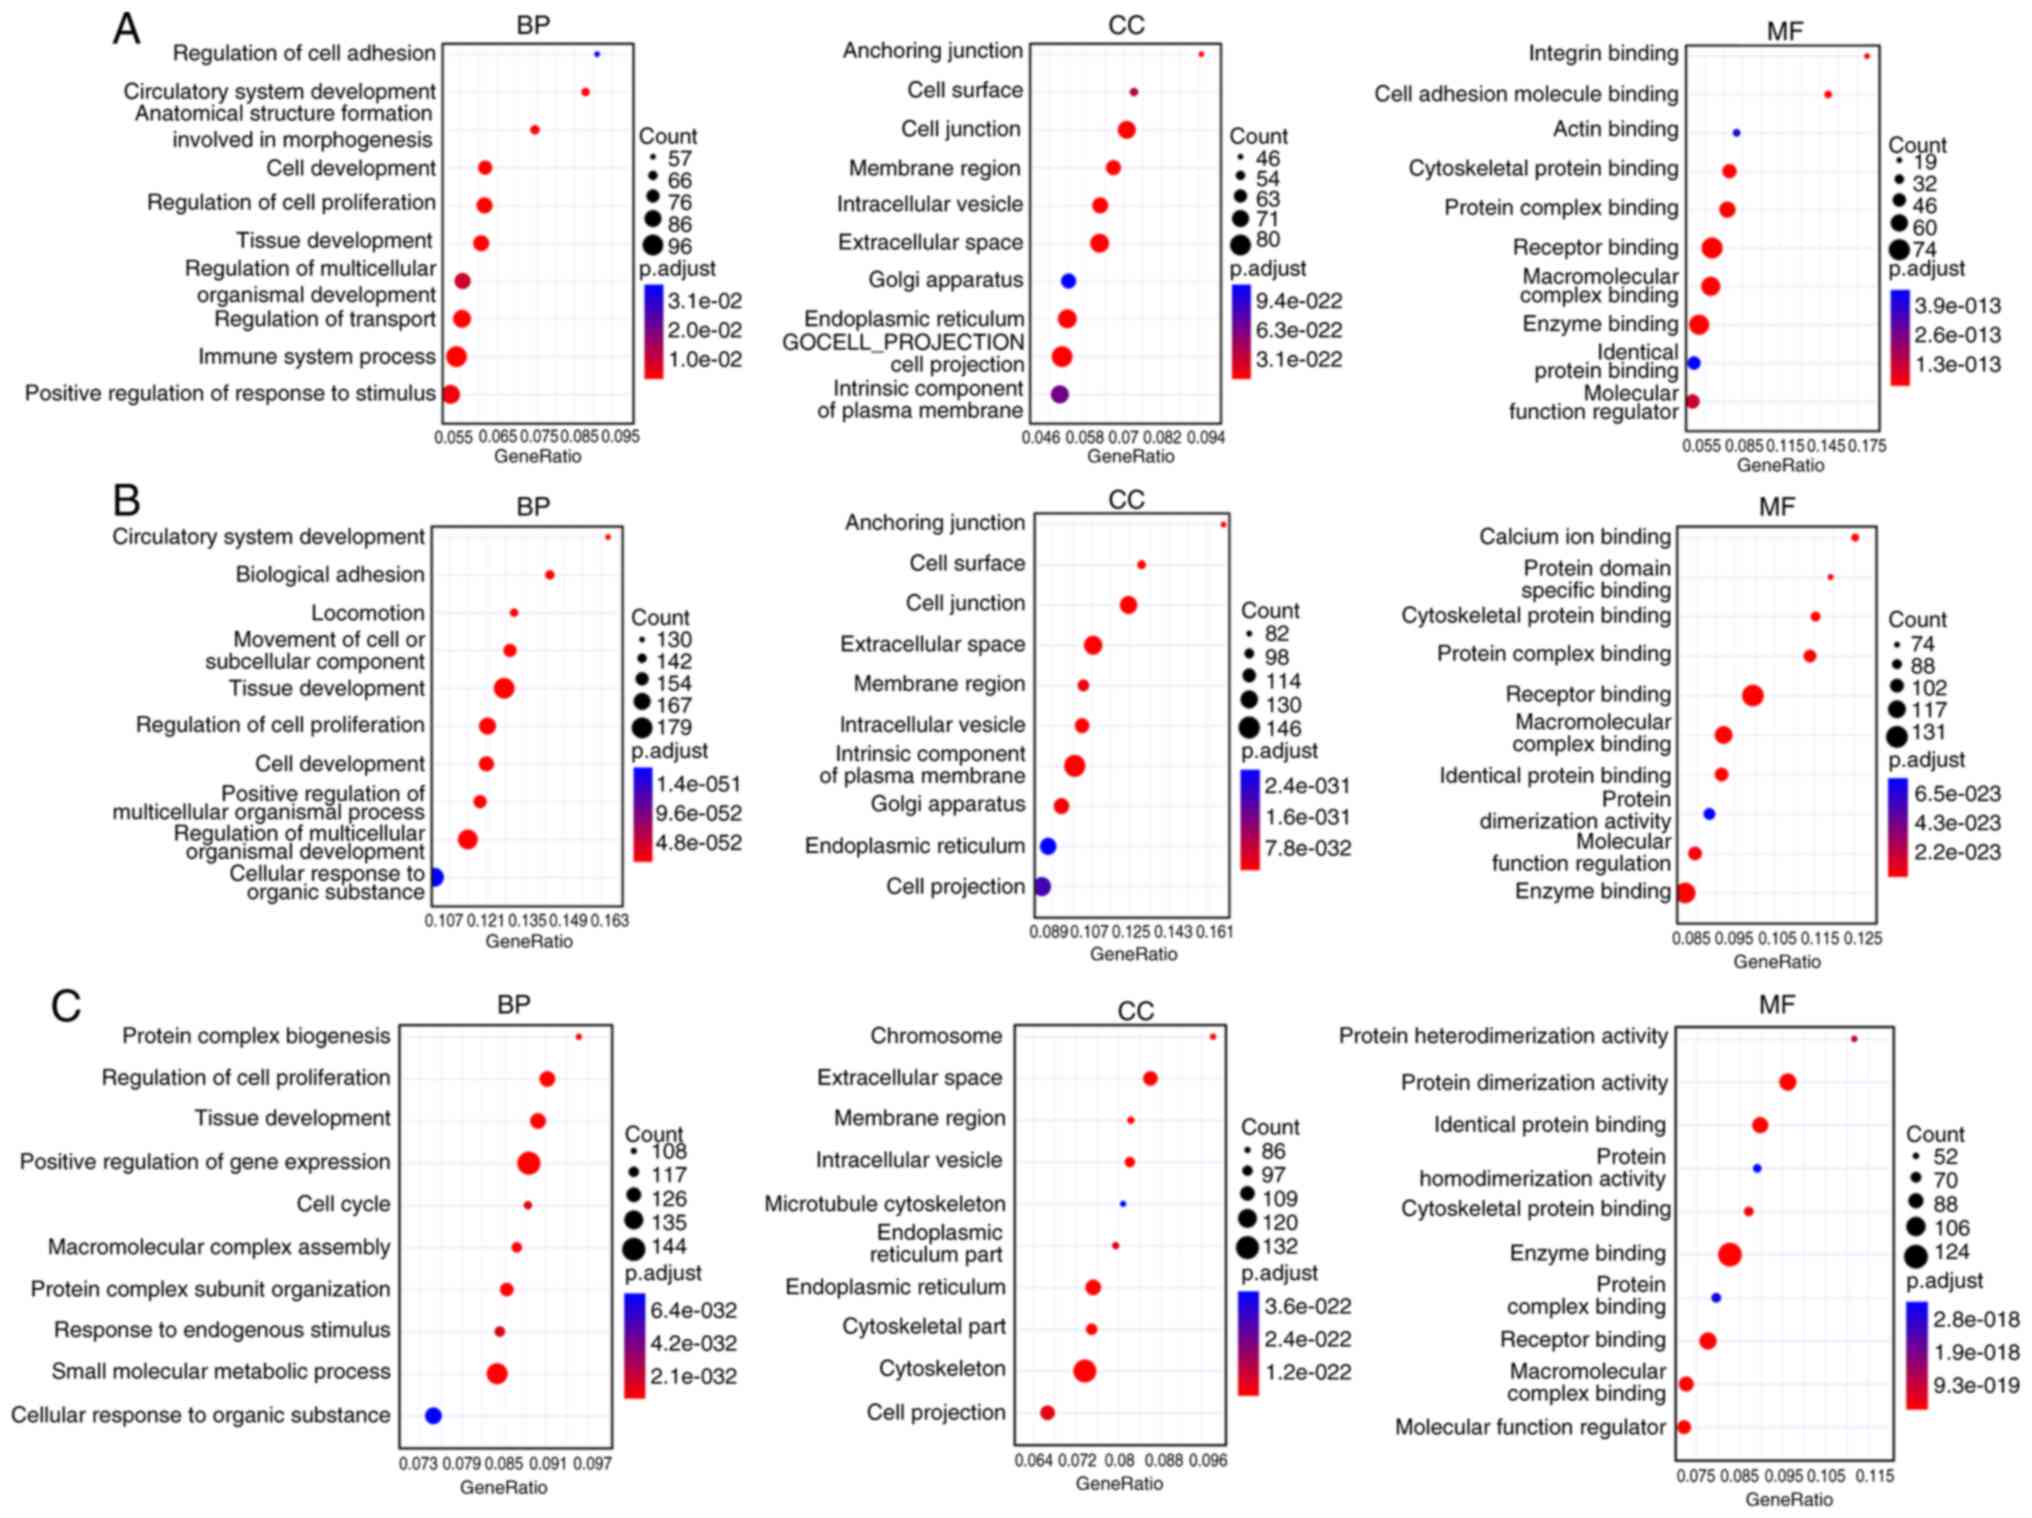
Function enrichment analysis
To better understand the biological pathways that
were affected in the gallbladder walls of cholesterol polyps,
gallbladder adenoma and gallbladder cancer, GO analysis was
conducted on the DEGs. Fig. 4A
shows that the GO terms that experienced the most significant
enrichment of comparison A was the BP ‘Immune system process’, MF
‘Integrin binding’ and the CC ‘Anchoring junction’. Fig. 4B shows that the DEGs of gallbladder
walls in cholesterol polyps vs. gallbladder adenoma participate in
a number of GO pathways, the number of DEGs with the highest count
had roles in the BP ‘Tissue development’, the CC ‘Cell junction’
and the MF ‘Receptor binding’. Fig.
4C demonstrates that the number of DEGs of the tumor tissues in
cholesterol polyps compared with gallbladder adenoma had the
highest count in the BP ‘Positive regulation of gene expression’,
the CC ‘Cytoskeleton’ and the MF ‘Enzyme binding’.
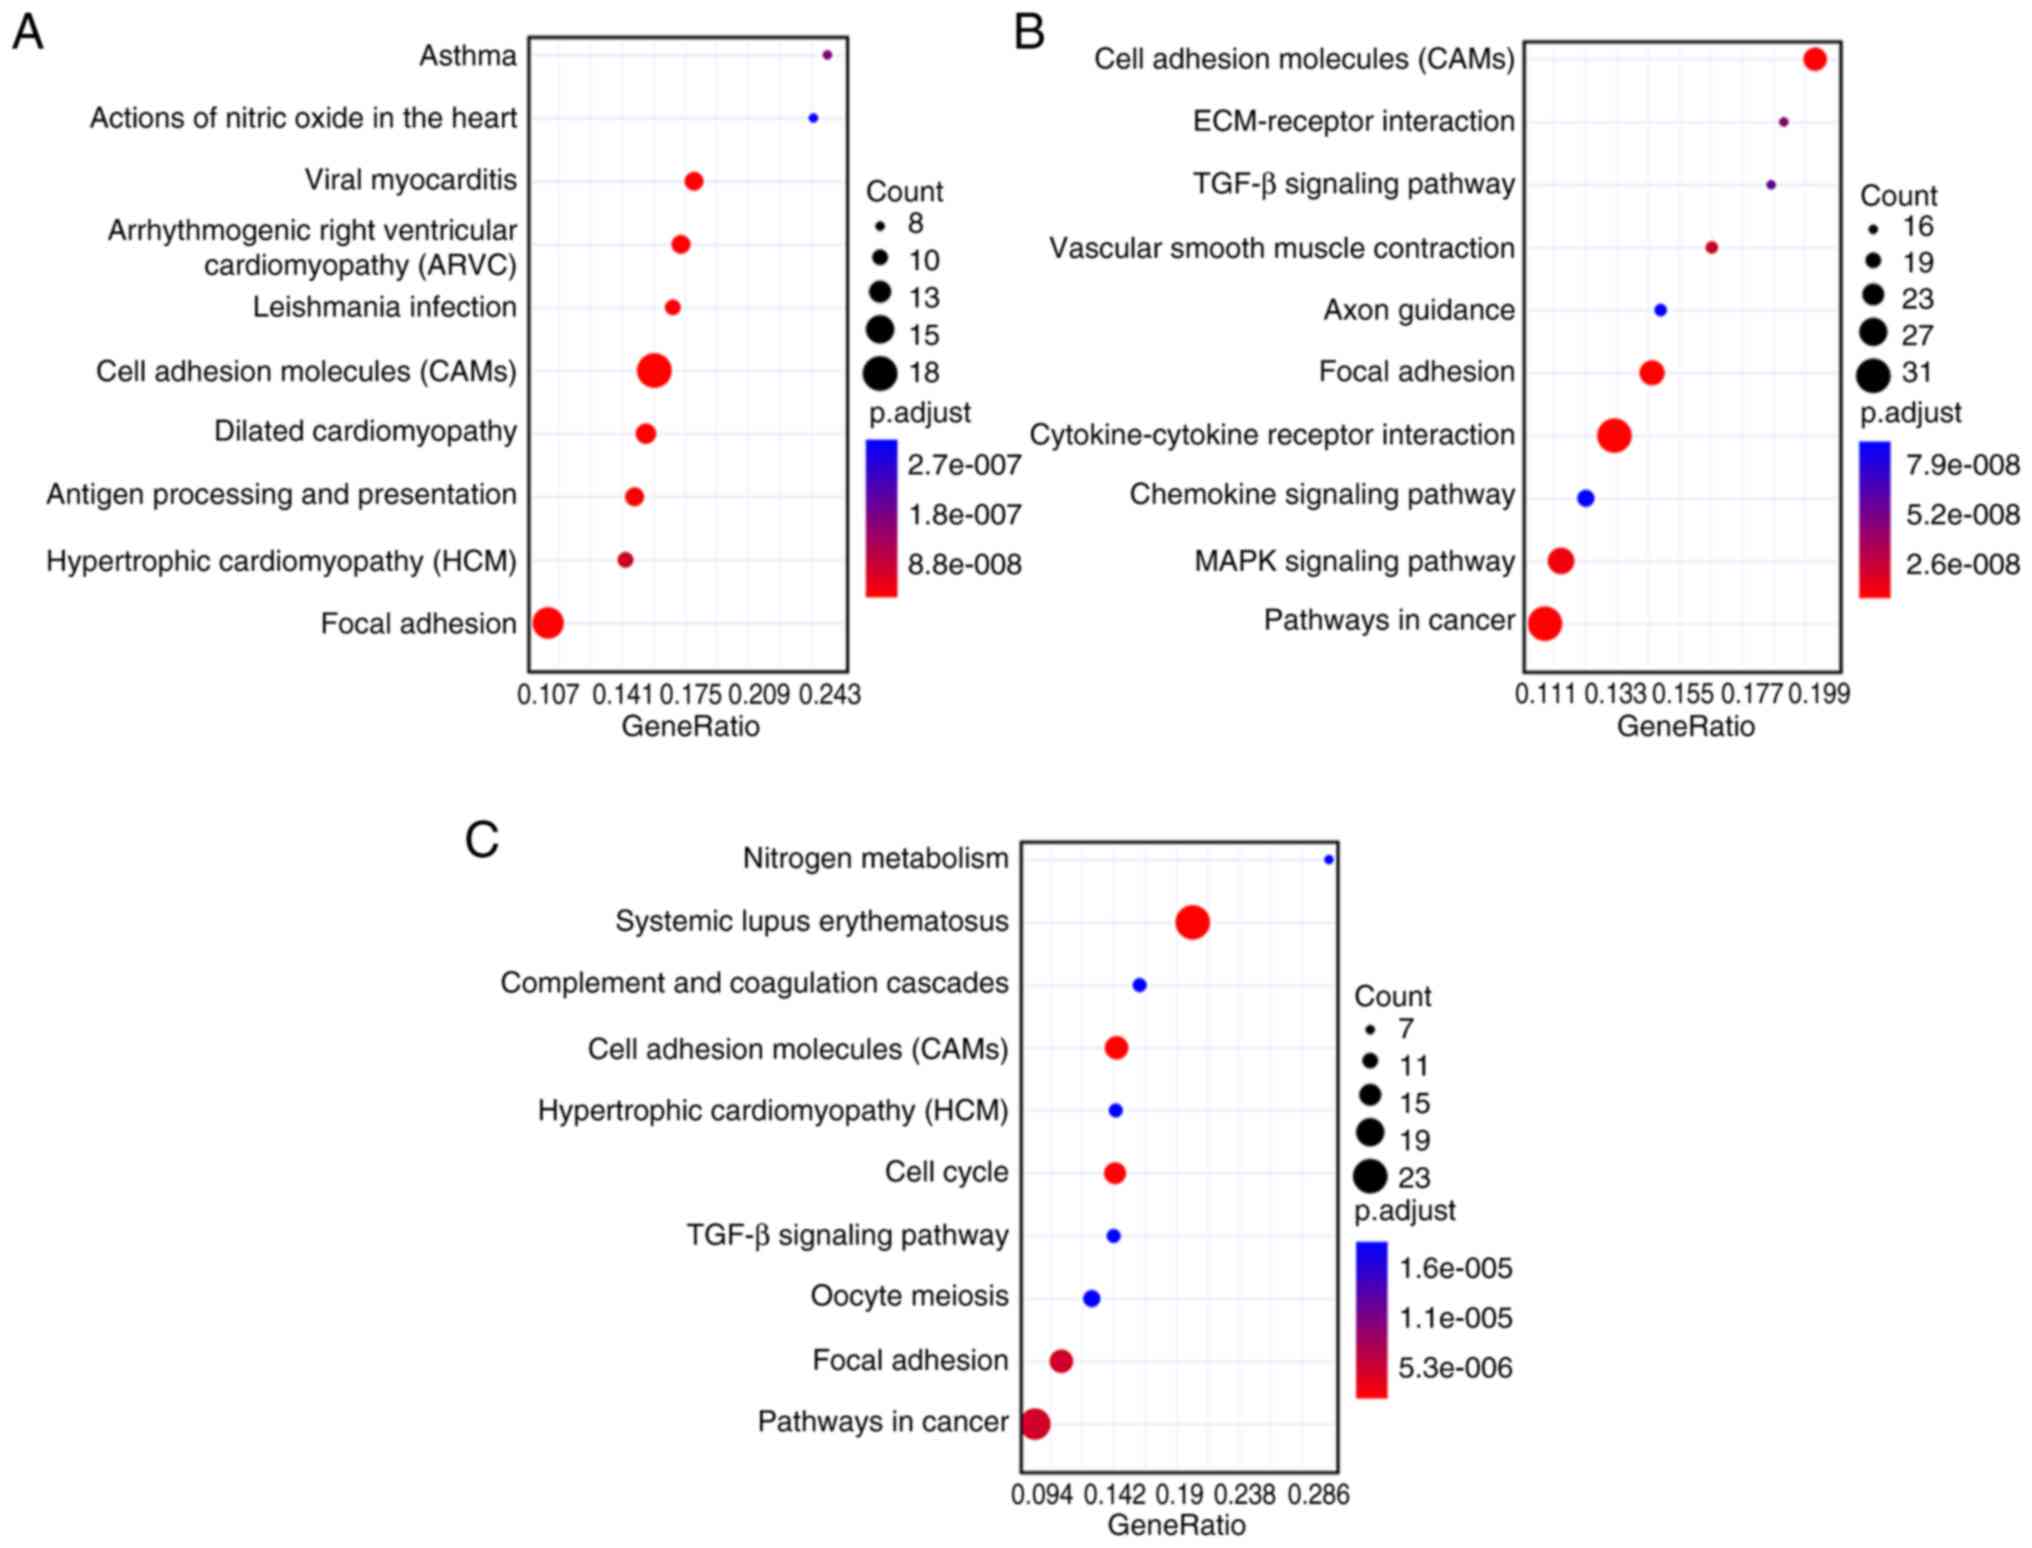
KEGG pathway enrichment analysis
The biological pathways that were enriched by DEGs
were also analyzed with KEGG. Fig.
5A shows that the most significantly enriched pathways in the
gallbladder walls of cholesterol polyps, gallbladder adenoma and
gallbladder cancer compared with normal groups was ‘cell adhesion
molecules (CAMs)’. Fig. 5B shows
that the most significantly enriched pathway with DEGs in the
gallbladder walls of gallbladder adenoma vs. gallbladder cancer was
‘Cell adhesion molecules (CAMs)’. Fig.
5C indicates that the most significantly enriched pathway in
the tumor tissues of gallbladder adenoma vs. gallbladder cancer was
the ‘Systemic lupus erythematosus’.
Validation of key genes in gallbladder
cancer
Among the top 20 DEGs in the gallbladder wall and
tumor of gallbladder cancer, seven novel DEGs, including HLA-DPB1
(Fig. 6A), NR4A2 (Fig. 6B), EFNB2 (Fig. 6C), FHL1 (Fig. 6D), IGFBP7 (Fig. 6E), RND3 (Fig. 6F) and NEURL1B (Fig. 6G) for gallbladder cancer were
validated using GEPIA. HLA-DPB1, EFNB2, IGFBP7 and NEURL1B had a
significantly higher expression in gallbladder cancer tissues
compared with normal tissues. The prognostic value of these DEGs
were further analyzed. There was no significant difference between
low HLA-DPB1 expression and prognosis of gallbladder cancer
(Fig. 7A). The low expression of
NR4A2 (Fig. 7B) indicated poorer OS
for patients with gallbladder cancer. No significant difference was
found between patients with low EFNB2 expression and those with
high EFNB2 expression (Fig. 7C).
Low FHL1 expression predicted significantly less favorable OS
(Fig. 7D). There was no significant
difference observed for different expression levels of IGFBP7
(Fig. 7E), RND3 (Fig. 7F) and NEURL1B (Fig. 7G). Therefore, the data presented
here indicated that only NR4A2 and FHL1 could represent potential
prognostic markers for patients with gallbladder cancer. Following
validation using RT-qPCR, HLA-DPB1 (Fig. 8A), NR4A2 (Fig. 8B) and EFNB2 (Fig. 8C) had significantly higher
expression levels in gallbladder cancer tissues compared with
normal tissues. However, there was no statistical difference in
FHL1 expression between gallbladder cancer tissues and normal
tissues (Fig. 8D). Moreover, high
IGFBP7 expression was determined in gallbladder cancer tissues
compared with normal tissues (Fig.
8E). As shown in Fig. 8F, RND3
mRNA expression was significantly decreased in gallbladder cancer
tissues compared with normal tissues. A significantly higher
expression level of NEURL1B was also detected in gallbladder cancer
tissues compared with normal tissues (Fig. 8G).
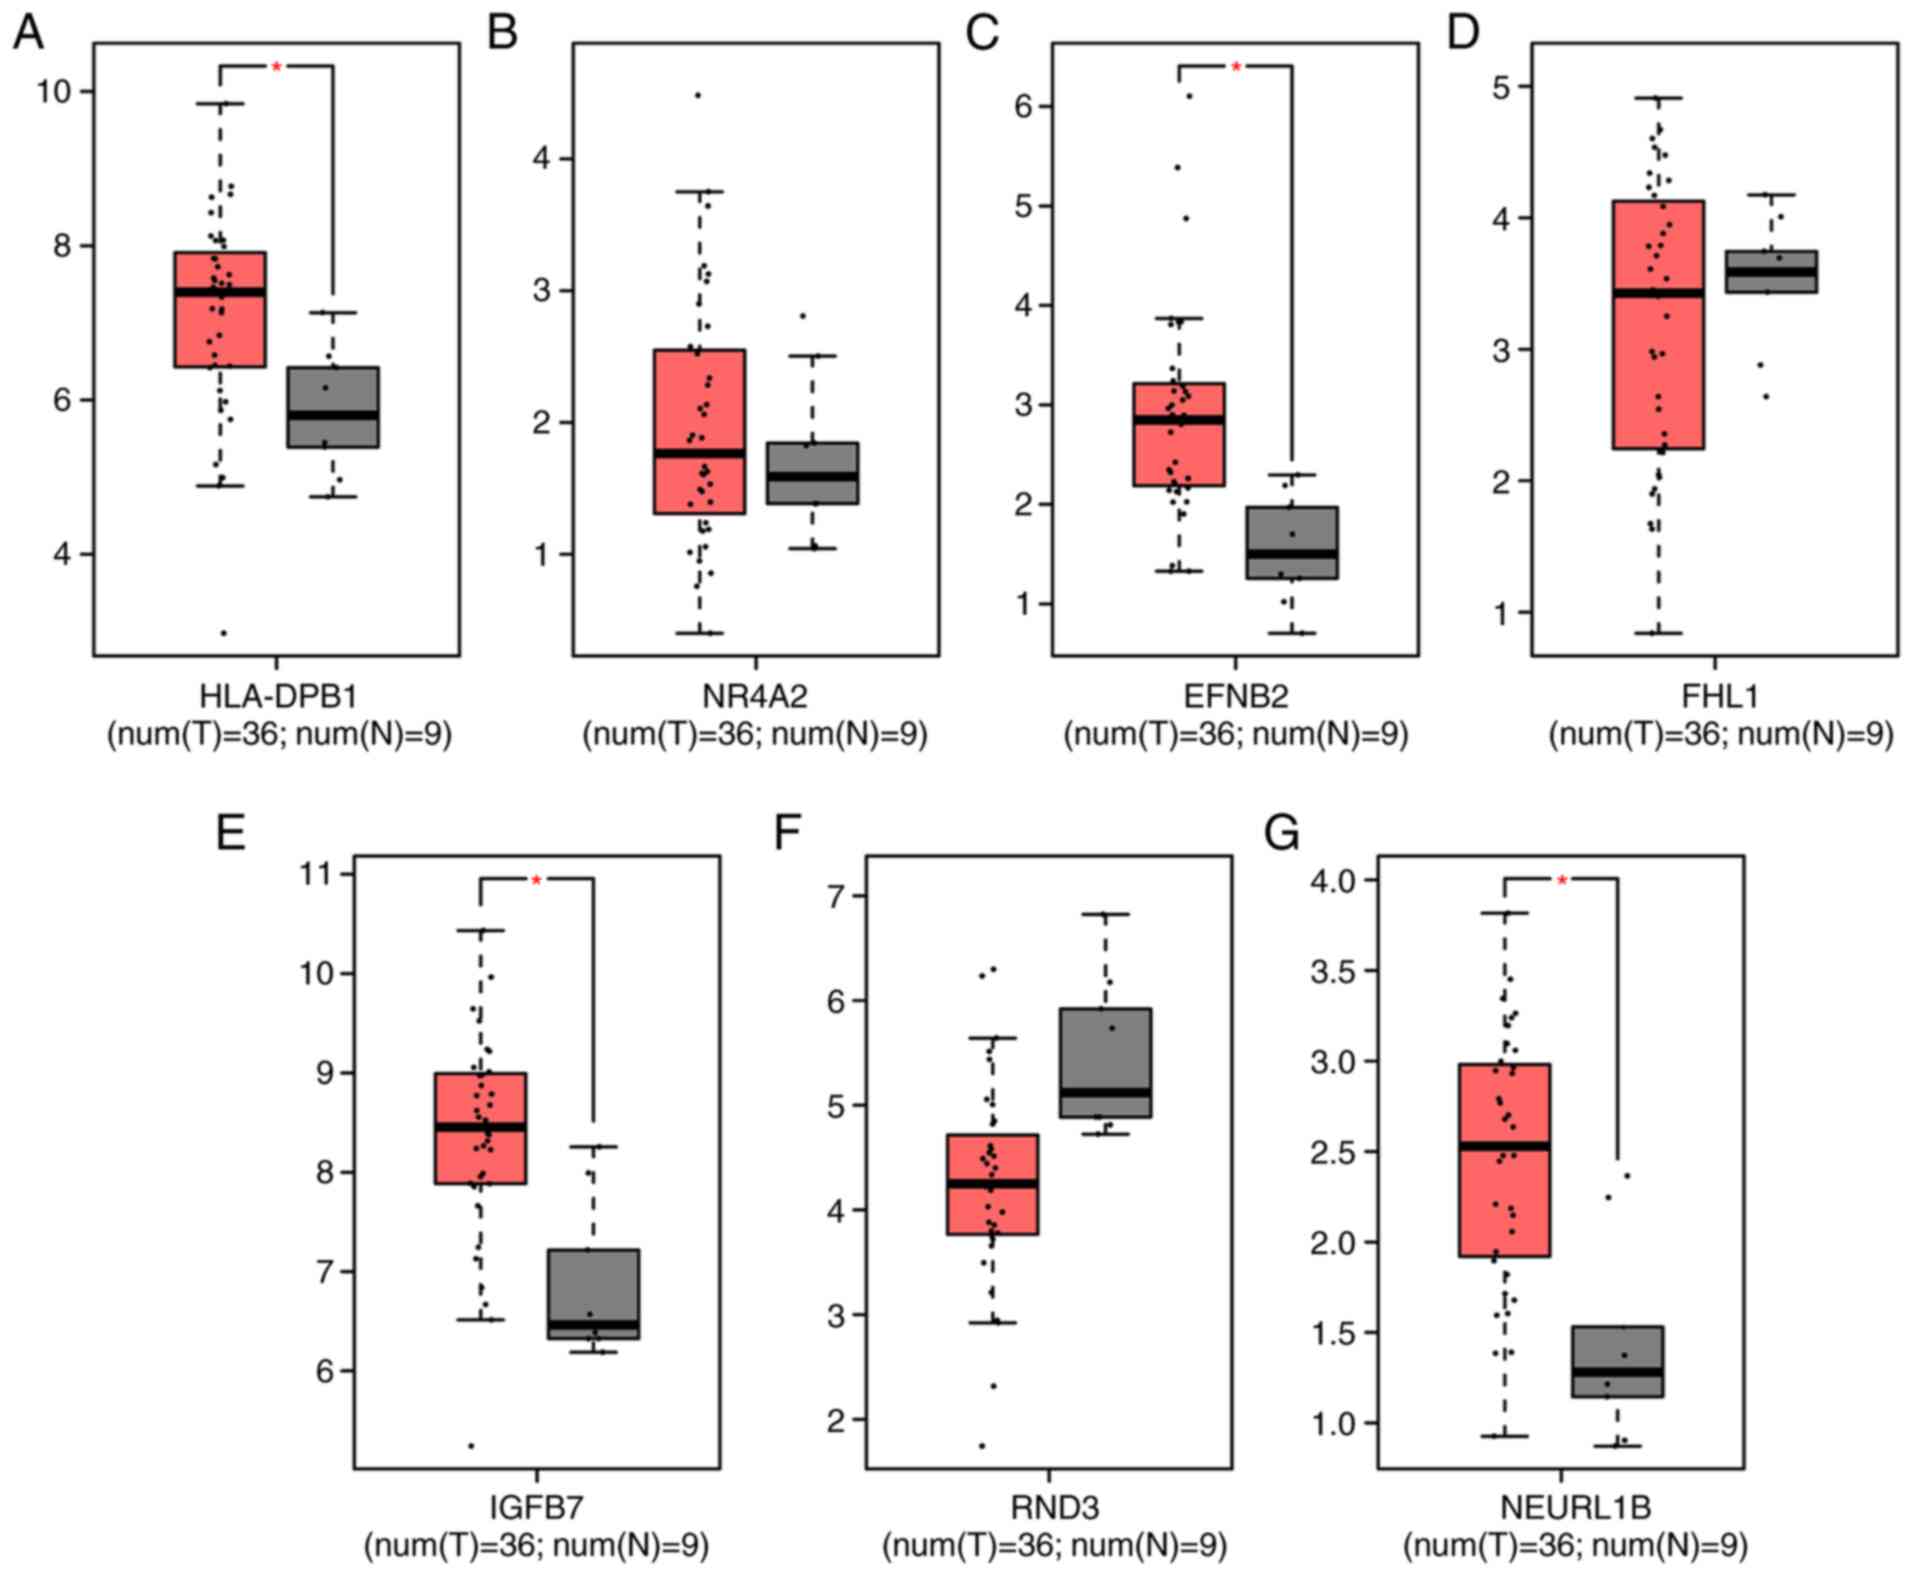 | Figure 6.Validation of key genes in
gallbladder cancer tissues using Gene Expression Profiling
Interactive Analysis. (A) HLA-DPB1, (B) NR4A2, (C) EFNB2, (D) FHL1,
(E) IGFBP7, (F) RND3 and (G) NEURL1B. HLA-DPB1, Major
Histocompatibility Complex, Class II, DP β1; NR4A2, nuclear
receptor subfamily 4 group a member 2; EFNB2, ephrin B2; FHL1, four
and a half LIM domains 1; IGFBP7, insulin like growth factor
binding protein 7; RND3, Rho family GTPase 3; NEURL1B, neutralized
E3 ubiquitin protein ligase 1B; T, tumor; N, normal.
*P<0.05. |
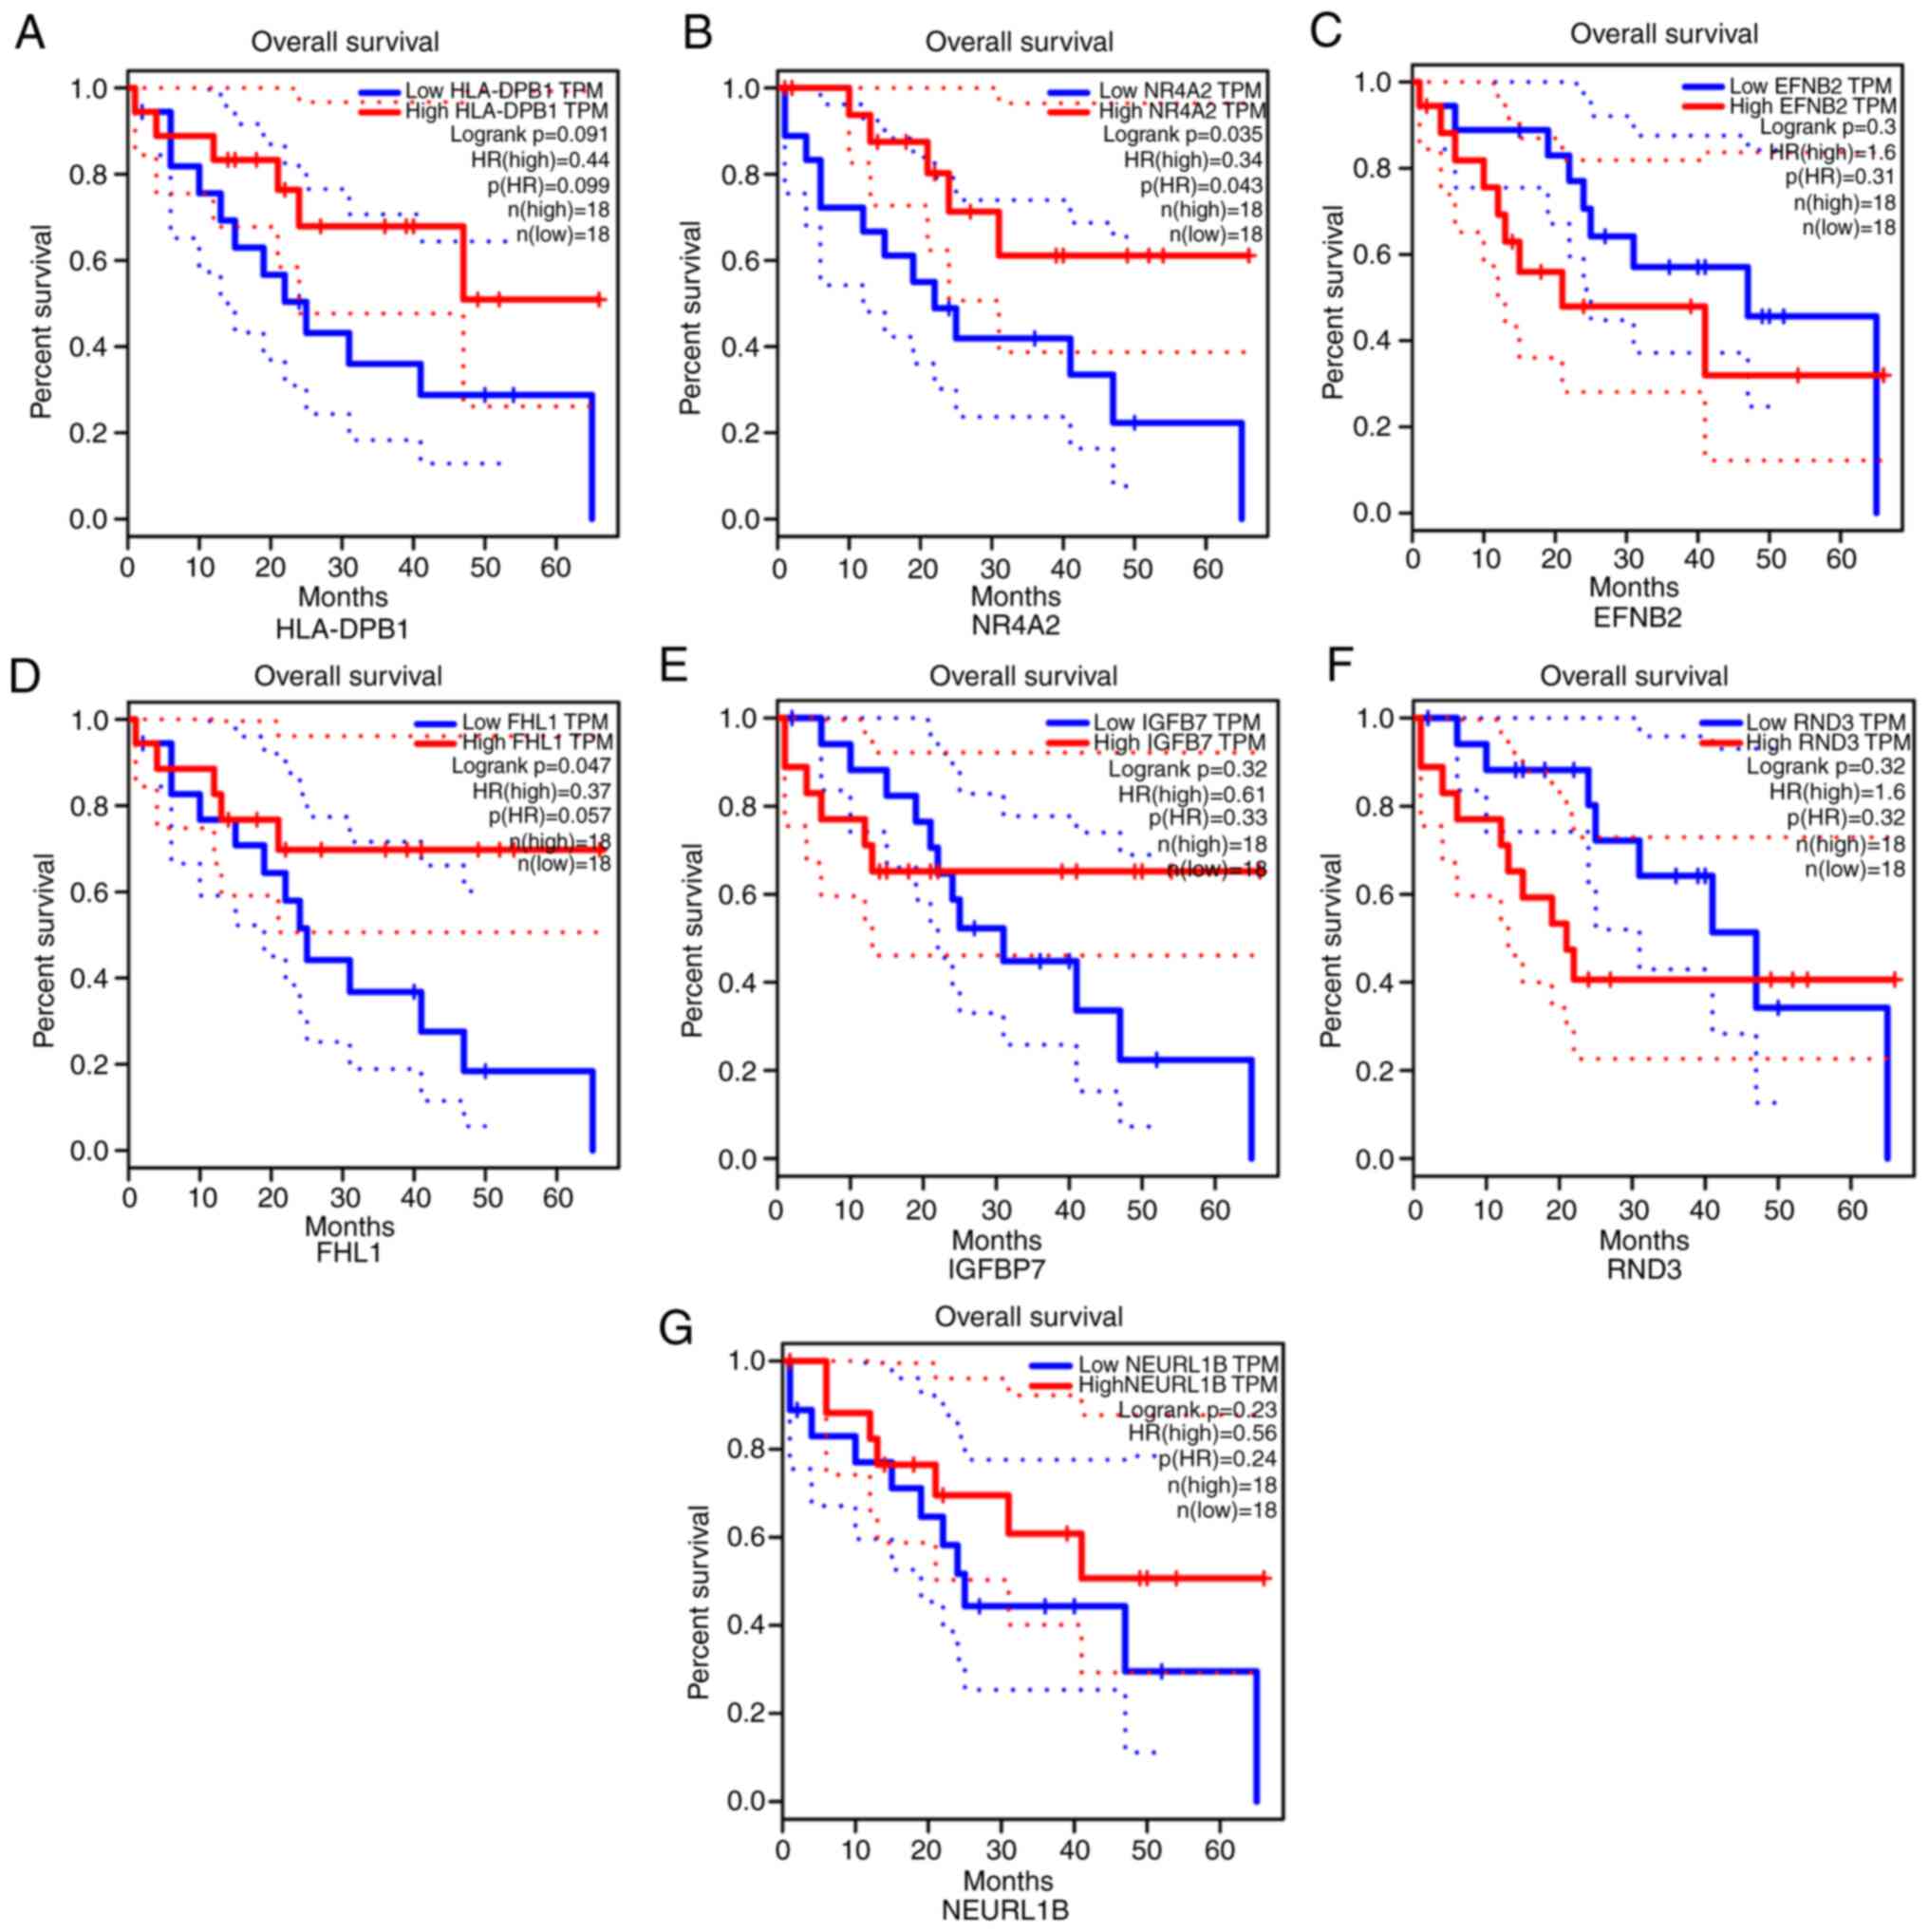 | Figure 7.Overall survival analysis of key
genes in gallbladder cancer. (A) HLA-DPB1, (B) NR4A2, (C) EFNB2,
(D) FHL1, (E) IGFBP7, (F) RND3 and (G) NEURL1B. Red represents high
expression and blue represents low expression. HLA-DPB1, Major
Histocompatibility Complex, Class II, DP β1; NR4A2, nuclear
receptor subfamily 4 group a member 2; EFNB2, ephrin B2; FHL1, four
and a half LIM domains 1; IGFBP7, insulin like growth factor
binding protein 7; RND3, Rho family GTPase 3; NEURL1B, neutralized
E3 ubiquitin protein ligase 1B; HR, hazard ratio. |
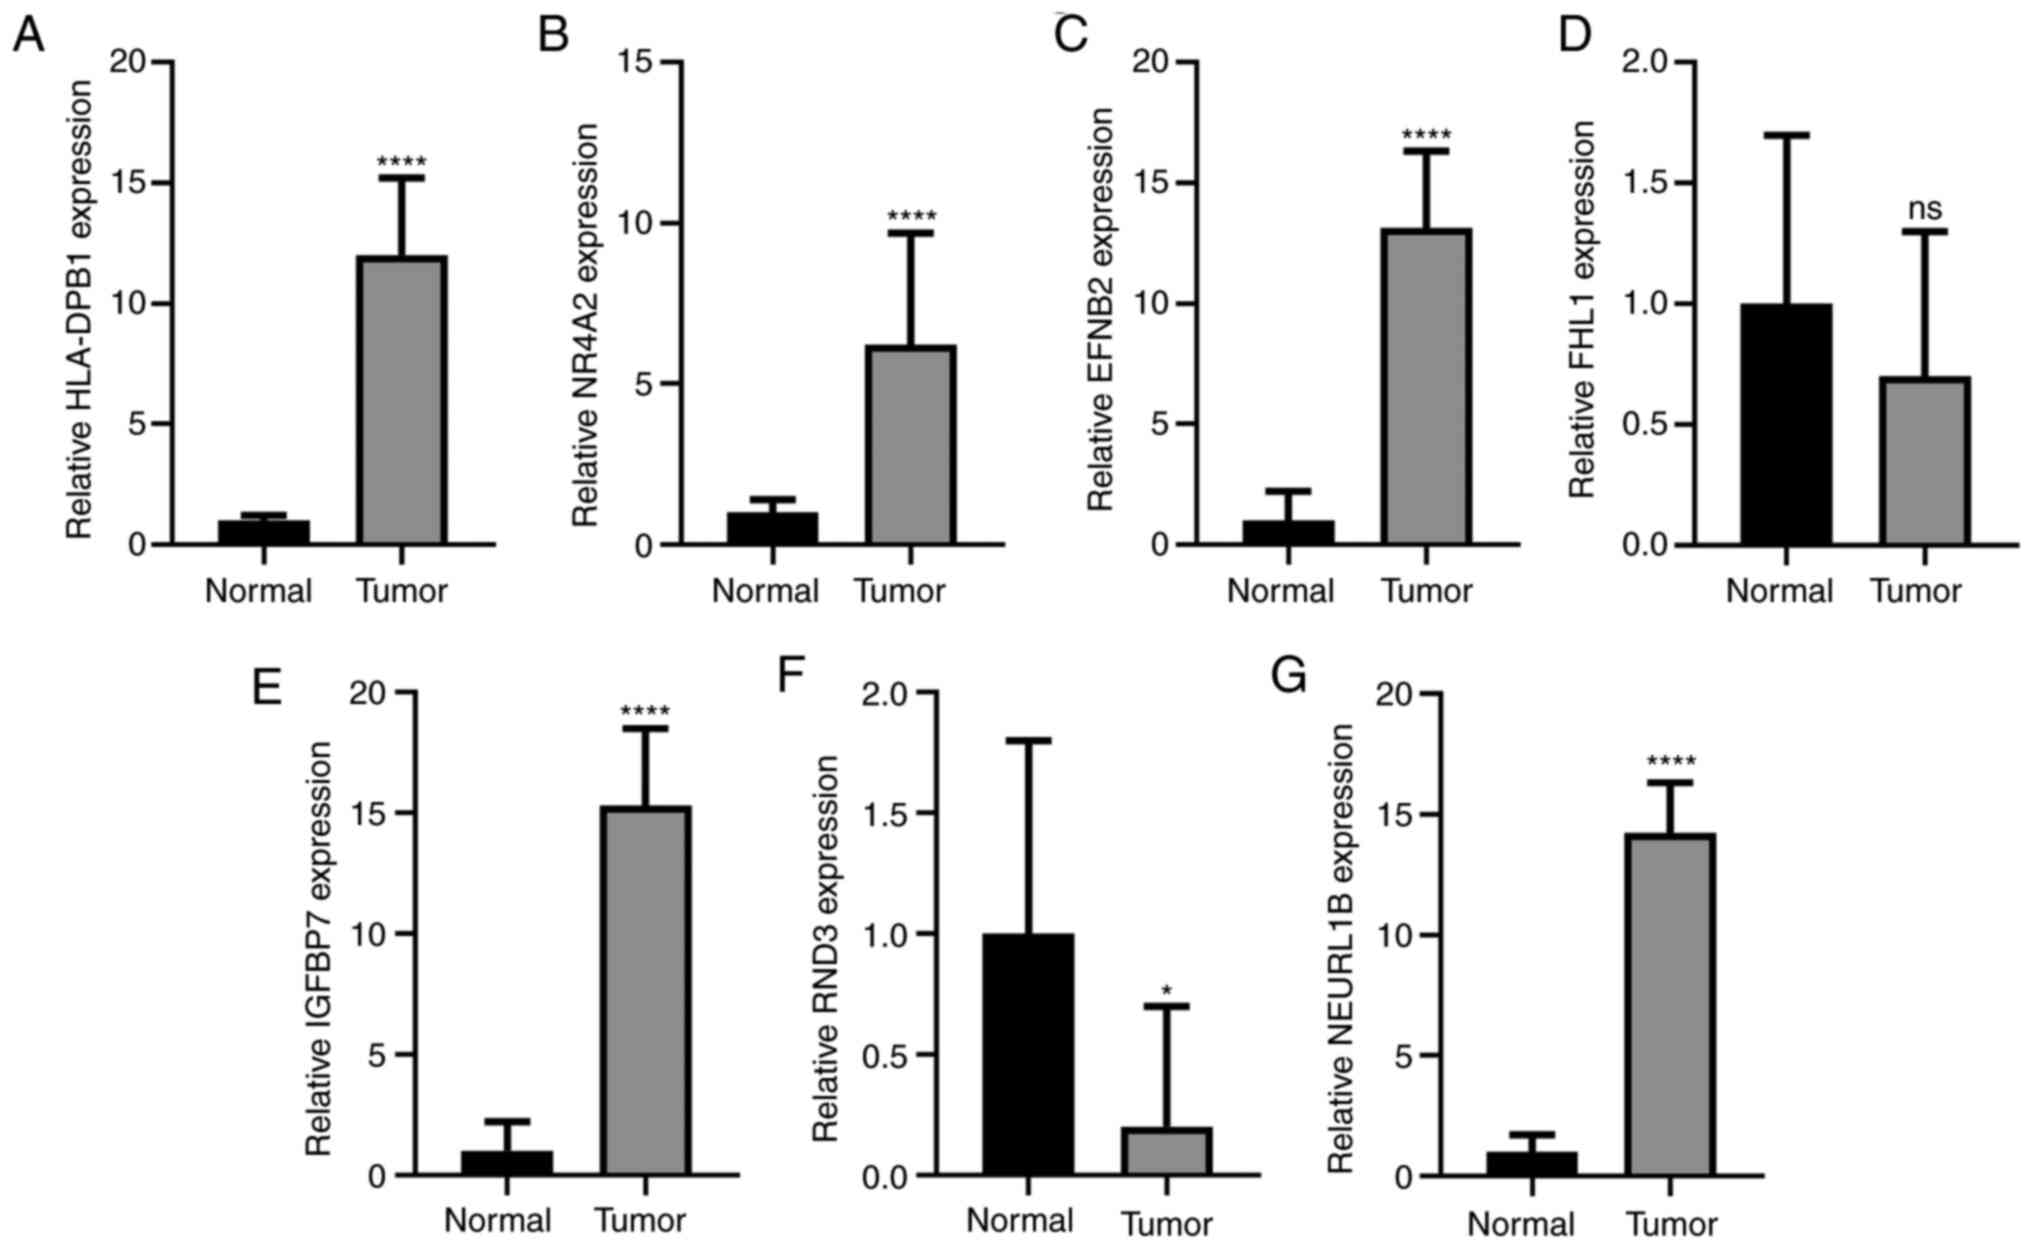 | Figure 8.Validation of key genes in
gallbladder cancer tissues using a reverse
transcription-quantitative PCR assay. (A) HLA-DPB1, (B) NR4A2, (C)
EFNB2, (D) FHL1, (E) IGFBP7, (F) RND3 and (G) NEURL1B. *P<0.05;
and ****P<0.0001; ns, not significant; HLA-DPB1, Major
Histocompatibility Complex, Class II, DP β1; NR4A2, nuclear
receptor subfamily 4 group a member 2; EFNB2, ephrin B2; FHL1, four
and a half LIM domains 1; IGFBP7, insulin like growth factor
binding protein 7; RND3, Rho family GTPase 3; NEURL1B, neutralized
E3 ubiquitin protein ligase 1B. |
Discussion
Gallbladder disease is one of the most common causes
of upper abdominal pain (15). It
is critical to focus on gallbladder diseases due to the potential
for malignant degeneration of any gallbladder lesion (15). Gallbladder adenomas and primary
adenocarcinomas have been identified as the most common benign and
malignant tumors, respectively (16). Nevertheless, efforts have been put
into elucidating the pathophysiological mechanisms leading to the
development of gallbladder cancer, however, most of these
mechanisms remain unknown. Therefore, it is crucial to disclose the
molecular mechanisms of gallbladder cancer to promote the
development of new cancer biomarkers and appropriate treatment
strategies.
Different from other microarray studies, in the
present study, the microarrays were comprehensively analyzed
(17–19). Firstly, eight differentially
expressed upregulated genes were found, which included
LOC101928168, HMGCS2, SCGN, CHN2, XK, MUC6, PLPP5 and HSPH1 both in
cholesterol polyps and gallbladder adenoma from gallbladder walls.
Secondly, 14 common DEGs were identified in the gallbladder walls
of gallbladder cancer and gallbladder adenoma. It is important to
distinguish benign and malignant gallbladder adenoma due to the
poor diagnosis of gallbladder cancer. T-Box Transcription Factor 3,
Tsukushi, Small Leucine Rich Proteoglycan, Stearoyl-CoA Desaturase
(SCD), NOVA Alternative Splicing Regulator 1 and
6-Phosphofructo-2-Kinase/Fructose-2,6-Biphosphatase 3 were
downregulated in the gallbladder wall of gallbladder cancer and
gallbladder adenoma; EDN1, MS4A8, ALB, MSLN, CTSV, BAG1,
LOC100507412, MCOLN3 and ZKSCAN1 were upregulated in the
gallbladder wall of gallbladder cancer and gallbladder adenoma.
Thirdly, 273 upregulated genes were expressed in the gallbladder
wall of gallbladder adenoma. Fourthly, the 20 most significantly
DEGs that were upregulated in the gallbladder wall of gallbladder
cancer were identified including KRT20, STMN2, DKK1, KCNS3, IL18,
MADCAM1, COL13A1, TPM4, SLITRK6, SCD5, C8orf4, VMP1, MIR21, FERMT1,
DOK5, FJX1, EPHA4, EDN3, KLF6 and C1orf186. Among them, DKK1 is
known to regulate tumor angiogenesis, which is essential for tumor
invasive growth and metastasis (20). IL18 has been reported to be a
candidate cytokine that may provide a new insight into the
development of next generation cancer immunotherapy (21). Desaturated fatty acids are essential
for tumor cell survival, and SCD5 may represent a viable target for
the development of novel agents for cancer treatment (22), which could become a candidate for
the treatment of gallbladder cancer. KLF6 is a member of the
Kruppel-like family of zinc finger transcription factors, which has
been identified as a mutated tumor inhibitor in selective human
cancer types, but not gallbladder cancer (23).
A total of 182 upregulated DEGs in the gallbladder
walls of gallbladder adenoma were obtained and compared with that
of cholesterol polyps. The top 20 most significantly expressed
genes included MFAP5, CILP, WISP2, MT1G, MT1H, EFEMP1, UGT2B7,
IGFBP6, OLFM4, MT1F, ERAP2, CYP1A1, ZNF761, BST1, AIM1L,
SLCO4A1-AS1, CD209, CIART, UGT2B11 and FBLN2. The overexpression of
CCN5/WISP2 in adipose tissue has previously been secreted and
circulated in the blood in a transgenic mouse model, which suggests
that WISP2 could become a biomarker in blood for gallbladder
adenoma and cholesterol polyps (24). The gene expression of MT1G, MT1H and
MT1F in human peripheral blood lymphocytes can be used as potential
biomarkers for cadmium exposure (25). Cadmium exposure could contribute to
the development of gallbladder cancer (26). EFEMP1 expression accumulates
angiogenesis and accelerates the growth of cervical cancer in
vivo (27). Patients with
UGT2B7*1/*2 genotypes, UGT2B7 genetic variation are at risk for
suboptimal immune recovery due to significant long-term autologous
induction (28). The expression of
IGFBP-6 in vascular endothelial cells is upregulated by hypoxia and
IGFBP-6 suppresses angiogenesis in vitro and in vivo
(29), but this has not been
reported in the context of gallbladder cancer. OLFM4 expression is
associated with cancer differentiation, stage, metastasis and
prognosis in a variety of cancer types, such as breast cancer,
esophageal adenocarcinoma and gastrointestinal cancer, suggesting
that it has underlying clinical value as an early cancer biomarker
or therapeutic target (30).
CYP1A1/1A2 isoenzymes are involved in EROD activity in blood
lymphocytes (31); however, there
is currently no previous report on the functions of this gene in
gallbladder cancer. The production of extracellular cADPR,
catalyzed by BST-1, followed by concentrating the uptake of cyclic
nucleotides by hemopoietic progenitors, may be physiologically
relevant in normal hematopoiesis (32), but its function in gallbladder
cancer remains unknown. CD209 has been identified to present on
monocyte-derived DCs, a cell adjuvant for cancer immunotherapy
(33). FBLN2 is a novel gene
associated with hypertension (34).
The top 20 upregulated genes were expressed both in
tumors and gallbladder walls of gallbladder cancer, which included
CTGF, HLA-DPB1, ID3, ID4, COL4A1, NR4A2, GEM, EFNB2, ID1, CXCL1,
RND3, FHL1, IGFBP7, NEURL1B, ANXA1, POSTN, MCTP1, IGFBP3, PLAT and
HSPB8. The study focused on whether these genes expression levels
could be assessed using blood or bile. CTGF could play an important
role in the inflammation of gallbladder cancer (35). Therefore, CTGF has the potential to
become a future biomarker for gallbladder cancer, circulating in
the blood and bile. It has been revealed that the dynamic changes
of growth centers and plasma cell differentiation are determined by
ID3 and E protein activity (35).
Following validation using RT-qPCR, the genes HLA-DPB1, NR4A2,
EFNB2, IGFBP7 and NEURL1B were found to be highly expressed in
gallbladder cancer. RND3 was significantly decreased in gallbladder
cancer. HLA-DPB1, NR4A2 and FHL1 could be underlying prognostic
markers for gallbladder cancer.
In the present study, a transcriptome profile was
comprehensively analyzed enabling the identification of DEGs in
gallbladder cancer, based on an annotation analysis of microarray
studies. The present findings could provide a novel understanding
on the tumorigenesis and development of gallbladder cancer.
Supplementary Material
Supporting Data
Acknowledgements
Not applicable.
Funding
This work was funded by Natural Science Foundation
of Liaoning Province (grant no. 2020-BS-283).
Availability of data and materials
The datasets used and/or analyzed during the current
study are available from the corresponding author on reasonable
request.
Authors' contributions
CG conceived and designed the study. XZ and XN
conducted most of the experiments and data analysis and wrote the
manuscript. BZ and LC participated in acquiring data and helped
draft the manuscript. All authors read and approved the final
manuscript.
Ethics approval and consent to
participate
The present study was approved by the Ethics
Committee of The First Affiliated Hospital of China Medical
University (2018075). All patients who participated in the study
signed written informed consent.
Patient consent for publication
Not applicable.
Competing interests
The authors declare that they have no competing
interests.
Glossary
Abbreviations
Abbreviations:
|
DEGs
|
differentially expressed genes
|
|
GO
|
Gene Ontology
|
|
KEGG
|
Kyoto Encyclopedia of Genes and
Genomes
|
|
aRNA
|
amplified RNA
|
|
FC
|
fold-change
|
References
|
1
|
Sicklick JK, Fanta PT, Shimabukuro K and
Kurzrock R: Genomics of gallbladder cancer: The case for
biomarker-driven clinical trial design. Cancer Metastasis Rev.
35:263–275. 2016. View Article : Google Scholar : PubMed/NCBI
|
|
2
|
Chandra V, Kim JJ, Mittal B and Rai R:
MicroRNA aberrations: An emerging field for gallbladder cancer
management. World J Gastroenterol. 22:1787–1799. 2016. View Article : Google Scholar : PubMed/NCBI
|
|
3
|
Kim YT, Kim J, Jang YH, Lee WJ, Ryu JK,
Park YK, Kim SW, Kim WH, Yoon YB and Kim CY: Genetic alterations in
gallbladder adenoma, dysplasia and carcinoma. Cancer Lett.
169:59–68. 2001. View Article : Google Scholar : PubMed/NCBI
|
|
4
|
Itoi T, Watanabe H, Ajioka Y, Oohashi Y,
Takel K, Nishikura K, Nakamura Y, Horil A and Saito T: APC, K-ras
codon 12 mutations and p53 gene expression in carcinoma and adenoma
of the gall-bladder suggest two genetic pathways in gallbladder
carcinogenesis. Pathol Int. 46:333–340. 1996. View Article : Google Scholar : PubMed/NCBI
|
|
5
|
Lee SH, Lee DS, You IY, Jeon WJ, Park SM,
Youn SJ, Choi JW and Sung R: Histopathologic analysis of adenoma
and adenoma-related lesions of the gallbladder. Korean J
Gastroenterol. 55:119–126. 2010.(In Korean). View Article : Google Scholar : PubMed/NCBI
|
|
6
|
Liu MC, Jiang L, Hong HJ, Meng ZW, Du Q,
Zhou LY, She FF and Chen YL: Serum vascular endothelial growth
factors C and D as forecast tools for patients with gallbladder
carcinoma. Tumour Biol. 36:6305–6312. 2015. View Article : Google Scholar : PubMed/NCBI
|
|
7
|
Choi JH, Yun JW, Kim YS, Lee EA, Hwang ST,
Cho YK, Kim HJ, Park JH, Park DI, Sohn CI, et al: Pre-operative
predictive factors for gallbladder cholesterol polyps using
conventional diagnostic imaging. World J Gastroenterol.
14:6831–6834. 2008. View Article : Google Scholar : PubMed/NCBI
|
|
8
|
Zhao MF, Huang P, Ge CL, Sun T, Ma ZG and
Ye FF: Conjugated bile acids in gallbladder bile and serum as
potential biomarkers for cholesterol polyps and adenomatous polyps.
Int J Biol Markers. 31:e73–e79. 2016. View Article : Google Scholar : PubMed/NCBI
|
|
9
|
Ritchie ME, Phipson B, Wu D, Hu Y, Law CW,
Shi W and Smyth GK: limma powers differential expression analyses
for RNA-sequencing and microarray studies. Nucleic Acids Res.
43:e472015. View Article : Google Scholar : PubMed/NCBI
|
|
10
|
Subramanian A, Tamayo P, Mootha VK,
Mukherjee S, Ebert BL, Gillette MA, Paulovich A, Pomeroy SL, Golub
TR, Lander ES and Mesirov JP: Gene set enrichment analysis: A
knowledge-based approach for interpreting genome-wide expression
profiles. Proc Natl Acad Sci USA. 102:15545–15550. 2005. View Article : Google Scholar : PubMed/NCBI
|
|
11
|
Kanehisa M, Goto S, Sato Y, Furumichi M
and Tanabe M: KEGG for integration and interpretation of
large-scale molecular data sets. Nucleic Acids Res. 40((Database
Issue)): D109–D114. 2012. View Article : Google Scholar : PubMed/NCBI
|
|
12
|
Tang Z, Li C, Kang B, Gao G, Li C and
Zhang Z: GEPIA: A web server for cancer and normal gene expression
profiling and interactive analyses. Nucleic Acids Res.
45W:W98–W102. 2017. View Article : Google Scholar
|
|
13
|
Livak KJ and Schmittgen TD: Analysis of
relative gene expression data using real-time quantitative PCR and
the 2(-Delta Delta C(T)) method. Methods. 25:402–408. 2001.
View Article : Google Scholar : PubMed/NCBI
|
|
14
|
R Core Team: R: A language and environment
for statistical computing. R Foundation for Statistical Computing;
Vienna, Austria: 2013, simplehttp://www.R-project.org/
|
|
15
|
Rodriguez S, Gaunt TR, Guo Y, Zheng J,
Barnes MR, Tang W, Danish F, Johnson A, Castillo BA, Li YR, et al:
Lipids, obesity and gallbladder disease in women: Insights from
genetic studies using the cardiovascular gene-centric 50K SNP
array. Eur J Hum Genet. 24:106–112. 2016. View Article : Google Scholar : PubMed/NCBI
|
|
16
|
Mellnick VM, Menias CO, Sandrasegaran K,
Hara AK, Kielar AZ, Brunt EM, Doyle MB, Dahiya N and Elsayes KM:
Polypoid lesions of the gallbladder: Disease spectrum with
pathologic correlation. Radiographics. 5:387–399. 2015. View Article : Google Scholar
|
|
17
|
Wang F, Wang R, Li Q, Qu X, Hao Y, Yang J,
Zhao H, Wang Q, Li G, Zhang F, et al: A transcriptome profile in
hepatocellular carcinomas based on integrated analysis of
microarray studies. Diagn Pathol. 12:42017. View Article : Google Scholar : PubMed/NCBI
|
|
18
|
Meng LZ, Fang JG, Sun JW, Yang F and Wei
YX: Aberrant expression profile of long noncoding RNA in human
sinonasal squamous cell carcinoma by microarray analysis. Biomed
Res Int. 2016:10957102016. View Article : Google Scholar : PubMed/NCBI
|
|
19
|
Liu L, Liu Y, Liu C, Zhang Z, Du Y and
Zhao H: Analysis of gene expression profile identifies potential
biomarkers for atherosclerosis. Mol Med Rep. 14:3052–3058. 2016.
View Article : Google Scholar : PubMed/NCBI
|
|
20
|
Park H, Jung HY, Choi HJ, Kim DY, Yoo JY,
Yun CO, Min JK, Kim YM and Kwon YG: Distinct roles of DKK1 and DKK2
in tumor angiogenesis. Angiogenesis. 17:221–234. 2014. View Article : Google Scholar : PubMed/NCBI
|
|
21
|
Ma Z, Li W, Yoshiya S, Xu Y, Hata M,
El-Darawish Y, Markova T, Yamanishi K, Yamanishi H, Tahara H, et
al: Augmentation of immune checkpoint cancer immunotherapy with
IL18. Clin Cancer Res. 22:2969–2980. 2016. View Article : Google Scholar : PubMed/NCBI
|
|
22
|
Roongta UV, Pabalan JG, Wang X, Ryseck RP,
Fargnoli J, Henley BJ, Yang WP, Zhu J, Madireddi MT, Lawrence RM,
et al: Cancer cell dependence on unsaturated fatty acids implicates
stearoyl-CoA desaturase as a target for cancer therapy. Mol Cancer
Res. 9:1551–1561. 2011. View Article : Google Scholar : PubMed/NCBI
|
|
23
|
Yin D, Komatsu N, Miller CW, Chumakov AM,
Marschesky A, McKenna R, Black KL and Koeffler HP: KLF6: mutational
analysis and effect on cancer cell proliferation. Int J Oncol.
30:65–72. 2007.PubMed/NCBI
|
|
24
|
Grünberg JR, Elvin J, Paul A, Hedjazifar
S, Hammarstedt A and Smith U: CCN5/WISP2 and metabolic diseases. J
Cell Commun Signal. 12:309–318. 2018. View Article : Google Scholar : PubMed/NCBI
|
|
25
|
Chang XL, Jin TY and Zhou YF:
Metallothionein 1 isoform gene expression induced by cadmium in
human peripheral blood lymphocytes. Biomed Environ Sci. 19:104–109.
2006.PubMed/NCBI
|
|
26
|
Lee MH, Gao YT, Huang YH, McGee EE, Lam T,
Wang B, Shen MC, Rashid A, Pfeiffer RM, Hsing AW and Koshiol J: A
metallomic approach to assess associations of serum metal levels
with gallstones and gallbladder cancer. Hepatology. 71:917–928.
2020. View Article : Google Scholar : PubMed/NCBI
|
|
27
|
En-lin S, Sheng-guo C and Hua-qiao W: The
expression of EFEMP1 in cervical carcinoma and its relationship
with prognosis. Gynecol Oncol. 117:417–422. 2010. View Article : Google Scholar : PubMed/NCBI
|
|
28
|
Habtewold A, Amogne W, Makonnen E, Yimer
G, Riedel KD, Ueda N, Worku A, Haefeli WE, Lindquist L, Aderaye G,
et al: Long-term effect of efavirenz autoinduction on
plasma/peripheral blood mononuclear cell drug exposure and CD4
count is influenced by UGT2B7 and CYP2B6 genotypes among HIV
patients. J Antimicrob Chemother. 66:2350–2361. 2011. View Article : Google Scholar : PubMed/NCBI
|
|
29
|
Zhang C, Lu L, Li Y, Wang X, Zhou J, Liu
Y, Fu P, Gallicchio MA, Bach LA and Duan C: IGF binding protein-6
expression in vascular endothelial cells is induced by hypoxia and
plays a negative role in tumor angiogenesis. Int J Cancer.
130:2003–2012. 2012. View Article : Google Scholar : PubMed/NCBI
|
|
30
|
Liu W and Rodgers GP: Olfactomedin 4
expression and functions in innate immunity, inflammation, and
cancer. Cancer Metastasis Rev. 35:201–212. 2016. View Article : Google Scholar : PubMed/NCBI
|
|
31
|
Dey A, Parmar D, Dayal M, Dhawan A and
Seth PK: Cytochrome P450 1A1 (CYP1A1) in blood lymphocytes evidence
for catalytic activity and mRNA expression. Life Sci. 69:383–393.
2001. View Article : Google Scholar : PubMed/NCBI
|
|
32
|
Podestà M, Benvenuto F, Pitto A, Figari O,
Bacigalupo A, Bruzzone S, Guida L, Franco L, Paleari L, Bodrato N,
et al: Concentrative uptake of cyclic ADP-ribose generated by
BST-1+ stroma stimulates proliferation of human
hematopoietic progenitors. J Biol Chem. 280:5343–5349. 2005.
View Article : Google Scholar : PubMed/NCBI
|
|
33
|
Osugi Y, Vuckovic S and Hart DN: Myeloid
blood CD11c(+) dendritic cells and monocyte-derived dendritic cells
differ in their ability to stimulate T lymphocytes. Blood.
100:2858–2866. 2002. View Article : Google Scholar : PubMed/NCBI
|
|
34
|
Vallvé JC, Serra N, Zalba G, Fortuño A,
Beloqui O, Ferre R, Ribalta J and Masana L: Two variants in the
fibulin2 gene are associated with lower systolic blood pressure and
decreased risk of hypertension. PLoS One. 7:e430512012. View Article : Google Scholar : PubMed/NCBI
|
|
35
|
Gloury R, Zotos D, Zuidscherwoude M,
Masson F, Liao Y, Hasbold J, Corcoran LM, Hodgkin PD, Belz GT, Shi
W, et al: Dynamic changes in Id3 and E-protein activity orchestrate
germinal center and plasma cell development. J Exp Med.
213:1095–1111. 2016. View Article : Google Scholar : PubMed/NCBI
|