Introduction
Primary Sjögren syndrome (pSS) is an autoimmune
disease that can attack the exocrine glands, causing symptoms such
as xerostomia and keratoconjunctivitis sicca (1). However, treatments for patients with
pSS, such as stimulating drugs and artificial saliva, are
ineffective and only symptomatic (2).
Mesenchymal stem cells (MSCs), such as human
umbilical cord mesenchymal stem cells (hUCMSCs), offer a promising
treatment for pSS due to their low immunogenicity and
immunoregulatory potential (3).
MSCs have been reported to exert inhibitory functions on activated
lymphoid cells, including CD4+ T cells (4). However, the underlying mechanisms,
such as direct cell contact and secretion of soluble mediators,
including prostaglandin E2 (PGE2), IL-10, TGF-β and hepatic growth
factor (5), are contradictory.
However, the regulatory mechanisms underlying CD4+ T
cell activation by MSCs are still unclear due to their
multiplicity, for example, subtle gene regulation. The microRNA
(miRNA or miR) pathway may be involved in gene regulation for
CD4+ T cell activation (6).
miRNAs have been reported to control T cell
activation (6). miRNA microarray
has been used to identify unique miRNAs associated with glandular
inflammation and dysfunction from patients with pSS (7). Furthermore, pathway analysis of miRNAs
predicted to target Ro/SSA and La/SSB autoantigens revealed
differential miRNA expression levels in the salivary glands and
peripheral blood mononuclear cells (PBMCs) from patients with pSS
(7).
In light of miRNA function in CD4+ T
cells and pSS pathogenesis, MSCs may exert immunomodulatory effects
on CD4+ T cells and offer a potential treatment for pSS.
Therefore, the present study aimed to perform an miRNome analysis
of quiescent and T cell receptor (TCR)-activated CD4+ T
cells treated with MSCs via miRNA profiling and bioinformatics. The
interaction between miRNAs and regulatory pathways (particularly
the TCR pathway) was studied in TCR-activated CD4+ T
cells to provide a novel understanding of pSS progression and MSC
treatment mechanisms.
Materials and methods
Isolation, cultivation,
immunophenotyping and labeling of hUCMSCs
The present study was approved (approval no.
K-2012-006) by the Research Ethics Committee of Tongji Hospital of
Tongji University (Shanghai, China). hUCMSCs were isolated from
full-term infants after obtaining parental written consent
(8). Briefly, Wharton's jelly
tissue was separated from UCs, digested with 1 mg/ml collagenase
type I (Sigma-Aldrich; Merck KGaA) and then plated in fresh culture
medium. Following expansion for 1 week, adherent cells were
obtained and replated in DMEM (Gibco; Thermo Fisher Scientific,
Inc.) at 37°C and 5% CO2.
At passage 4, hUCMSCs were identified by flow
cytometry with a FACSCalibur II flow cytometer (BD Biosciences),
using antibodies (all from eBioscience; Thermo Fisher Scientific,
Inc.) against MSCs [CD13-APC (cat. no. 47-0138-42), CD54-APC (cat.
no. 17-0542-82), CD73-PE (cat. no. 25-0739-42), CD166-PE (cat. no.
12-1668-42) and CD90-APC (cat. no. 47-0909-41)], hematopoietic
cells [CD14-FITC (cat. no. MHCD1401), CD19-FITC (cat. no.
11-0193-82), CD34-PE (cat. no. 12-0349-41), CD45-PE-Cy7 (cat. no.
MHCD4512) and CD117-APC (cat. no. 47-1171-80)], integrins [CD29-APC
(cat. no. 17-0291-80)], extracellular matrix receptors [CD44-FITC
(cat. no. 11-0441-86)] and major histocompatibility complexes
[HLA-DR-PerCP (cat. no. 46-9952-41) and HLA-ABC-FITC (cat. no.
11-9983-41)]. MSCs were stained with primary human albumin-FITC
(cat. no. CLFAG2140; Cedarlane Laboratories) and
pan-cytokeratin-FITC (cat. no. 130-119-141; Miltenyi Biotec GmbH),
and then with secondary FITC rabbit anti-human albumin (cat. no.
A18904; eBioscience; Thermo Fisher Scientific, Inc.). MSCs were
inductively cultured to assay adipogenic, osteoplastic and
chondrogenic differentiation to assess their multipotency, as
previously described (9).
Patients and controls
Venous blood was collected from inpatients with pSS
at the Department of Rheumatology and Immunology, Tongji Hospital
of Tongji University (Shanghai, China) between January 2013 and
December 2016. The pSS diagnosis complied with the
American-European Consensus Group criteria (10). The patients had no other autoimmune
diseases and took no immunosuppressive drugs. Healthy controls
(HCs) were recruited from the Examination Department, Tongji
Hospital of Tongji University. The present study was conducted in
accordance with the Declaration of Helsinki. Written informed
consent was obtained from all patients and HCs. Clinical features
are presented in Table I. The pSS
activity was evaluated using the EULAR Sjögren's syndrome disease
activity index (ESSDAI) (11).
 | Table I.Clinical characteristics of patients
with pSS and healthy controls. |
Table I.
Clinical characteristics of patients
with pSS and healthy controls.
| Clinical
characteristics | Patients with pSS,
n=13 | Healthy controls,
n=13 |
|---|
| Age, years (mean ±
SEM) | 19–68
(47.21±8.33) | 20–65
(48.42±9.75) |
| Female, % | 100 | 100 |
| Mean disease
duration, years (SEM) | 6.09 (3.54) | – |
| Anti-SSA positive,
% | 100 | 0 |
| Anti-SSB positive,
% | 100 | 0 |
| Antinuclear
antibody positive, % | 100 | 0 |
| Lymphocytic focus
score ≥1 foci, % | 100 | – |
| IgG >16 g/l,
% | 100 | 0 |
Peripheral CD4+ T cell
separation
Venous blood was collected in EDTA tubes for PBMC
isolation within 4 h using Ficoll-Hypaque density configuration
(Sigma-Aldrich; Merck KGaA). CD4+ T cells stained at 4°C
for 20 min with FITC anti-human CD4 (cat. no. 300506; BioLegend,
Inc.) were sorted on a FACSCalibur flow cytometer.
CD4+ T cell and MSC
co-culture experiments
Following isolation, the CD4+ T cells
were divided into five groups: Healthy naïve (CD4+ T
cells from HC), pSS naïve (CD4+ T cells from patients
with pSS), pSS activation [CD4+ T cells from patients
with pSS stimulated by anti-CD3 antibody and anti-CD28 antibody
(BioLegend, Inc.) for 72 h], MSC treatment (stimulated
CD4+ T cells from patients with pSS co-cultured with
MSCs for 72 h) and pre-IFN-γ MSC treatment [stimulated
CD4+ T cells from patients with pSS co-cultured with
MSCs (pre-stimulated by IFN-γ) for 72 h]. CD4+ T cell
proliferation was analyzed using flow cytometry with CellTrace™
CFSE cell proliferation kit (cat. no. C34554; Thermo Fisher
Scientific, Inc.). The CFSE plot consisted of certain
characteristic ridges demonstrating cell proliferation following
stimulation. CD4+ T cell division was denoted by the
mean generation number (MGN). Cells were gated in compliance with
their forward- and side-scatter characteristics for the purpose of
excluding dead cells and debris. For flow cytometry, primary
antibodies [CD4-PE (cat. no. 565999) and IFN-γ-FITC (cat. no.
561057; both from BD Biosciences)] were added to the cells at 4°C
for 20 min. The cells were operated on a FACS Calibur and studied
using CellQuest™ Pro software (BD Biosciences). The co-culture
supernatants were tested by ELISA, according to the manufacturer's
instructions (Shanghai Westang Bio-Tech).
miRNA microarray
The microarray assay was performed using a
facilitator (LC Sciences). The 3′ end of the micromolecular RNAs (4
µg) was elongated by adding a poly (A) tail and ligated with
pCp-Cy3 dyes. Hybridization was carried out at 4°C for 20 h on a
µParaflo microfluidic array. Following RNA hybridization,
fluorescence signals were scanned using a laser scanner (GenePix
4000B; Molecular Devices LLC), analyzed with Array-Pro image
analysis software version X3 (Media Cybernetics, Inc.) and then
standardized with a locally weighted scatterplot smoothing filter
as previously described (12).
Reverse transcription-quantitative
(RT-q)PCR
The miRNAs were confirmed via stem-loop RT-PCR.
Total RNA from CD4+ T cells was extracted with
TRIzol® reagent (Invitrogen; Thermo Fisher Scientific,
Inc.), according to the manufacturer's instructions. cDNA was
synthesized from 0.5 µg RNA, using a reverse transcription kit
(Takara Bio, Inc.), according to the manufacturer's protocols.
miRNAs were reverse-transcribed using a specific primer (Table SI). qPCR was run with a specific
primer (Table SI) and SYBR Premix
Ex Taq (Takara Bio, Inc.) on an ABI PRISM 7500 Real-Time PCR system
(Applied Biosciences; Thermo Fisher Scientific, Inc.). PCR was
performed as follows: 95°C for 10 sec, followed by 40 cycles of
denaturation at 95°C for 5 sec, and annealing/extension at 60°C for
20 sec. The relative changes were calculated using the
2−ΔΔCq method (13);
healthy naïve individuals were used as the control.
Pathway and miRNA gene network
Two databases [TargetScan (targetscan.org/) and miRanda (microrna.org)] were used to predict the combined
target genes of aberrant miRNAs in the two groups. Gene Ontology
(GO) was applied to predict the primary function of target genes
based on the microarray data obtained as aforementioned (14,15). A
pathway study was used to identify the significant pathway of
differential genes in accordance with Kyoto Encyclopedia of Genes
and Genomes (KEGG), Biocarta and Reactome analysis (15,16).
Furthermore, Fisher's exact test was used to select the crucial
pathway, and the ingate was determined using the P and false
discovery rate values. The enrichment Re was calculated as
described previously (17–19), which was as follows by:
Re=(nf/n)/(Nf/N), where nf is the number of differential genes
within the particular category, n is the total number of genes
within the same category, while Nf is the number of differential
genes in the entire microarray, and N is the total number of genes
in the microarray. The association between miRNAs and targets was
acquired based on differential levels and their associations in the
Sanger miRBase Release 20.0 (sanger.ac.uk/Software/Rfam/mirna/) for
miRNAs to construct an miRNA gene network (19).
Statistical analysis
Data were analyzed using SPSS 17.0 (SPSS, Inc.) for
Windows, followed by two-tailed, unpaired or paired Student's
t-test for significant differences. Data are presented as the mean
± SEM of three independent repeats. P<0.05 was considered to
indicate a statistically significant difference.
Results
Isolation and identification of
hUCMSCs
The primary hUCMSC culture took 5–10 days to reach
sub-confluence. Flow cytometry revealed that the cells did not
exhibit hematopoietic progenitor labels (for example, CD45, CD34,
CD14 and HLA-DR) but expressed MSC markers such as CD73, CD105,
CD166 and CD90 (data not shown). After 10 days, the attached cells
were fibroblast-like. MSCs also differentiated into adipocytes,
chondrocytes and osteocytes (data not shown).
MSCs inhibit proliferation of
CD4+ T cells
Following co-culture for 72 h, MSCs suppressed
CD3/CD28-stimulated CD4+ T cell multiplication under a
dose-dependent mode, as determined by a decrease in the CFSE peak
generation number (Table II).
Under co-culture through cell-cell contact, MGN decreased in terms
of MSC:CD4+ ratio (1:10 and 1:5; MSC treatment vs. pSS
activation). This confirmed previous studies describing
dose-dependent MSC inhibition of T cell proliferation (20,21).
IFN-γ has previously been reported to trigger the MSC inhibitory
effects on T cell proliferation (22,23),
but in the present study, MSC pretreatment with IFN-γ did not
result in increased CD4+ T cell inhibition.
| Table II.MSCs inhibit mitogenic
CD4+ T cell proliferation. |
Table II.
MSCs inhibit mitogenic
CD4+ T cell proliferation.
|
|
| MSC treatment
(MSC:CD4+ T) | Pre-IFN-γ MSC
treatment (MSC:CD4+ T) |
|---|
|
|
|
|
|
|---|
| MGN statistics | pSS activation | 1:5 | 1:10 | 1:20 | 1:5 | 1:10 | 1:20 |
|---|
| MGN | 6.62±1.28 | 2.89±0.53 | 3.36±0.69 | 5.97±0.81 | 3.14±0.78 | 3.79±0.46 | 6.58±0.95 |
| q-value | – | 3.67 | 6.33 | 2.09 | 4.27 | 5.99 | 1.76 |
| P-value | – |
<0.05a |
<0.01b |
>0.05c |
<0.01a |
<0.01b |
>0.05c |
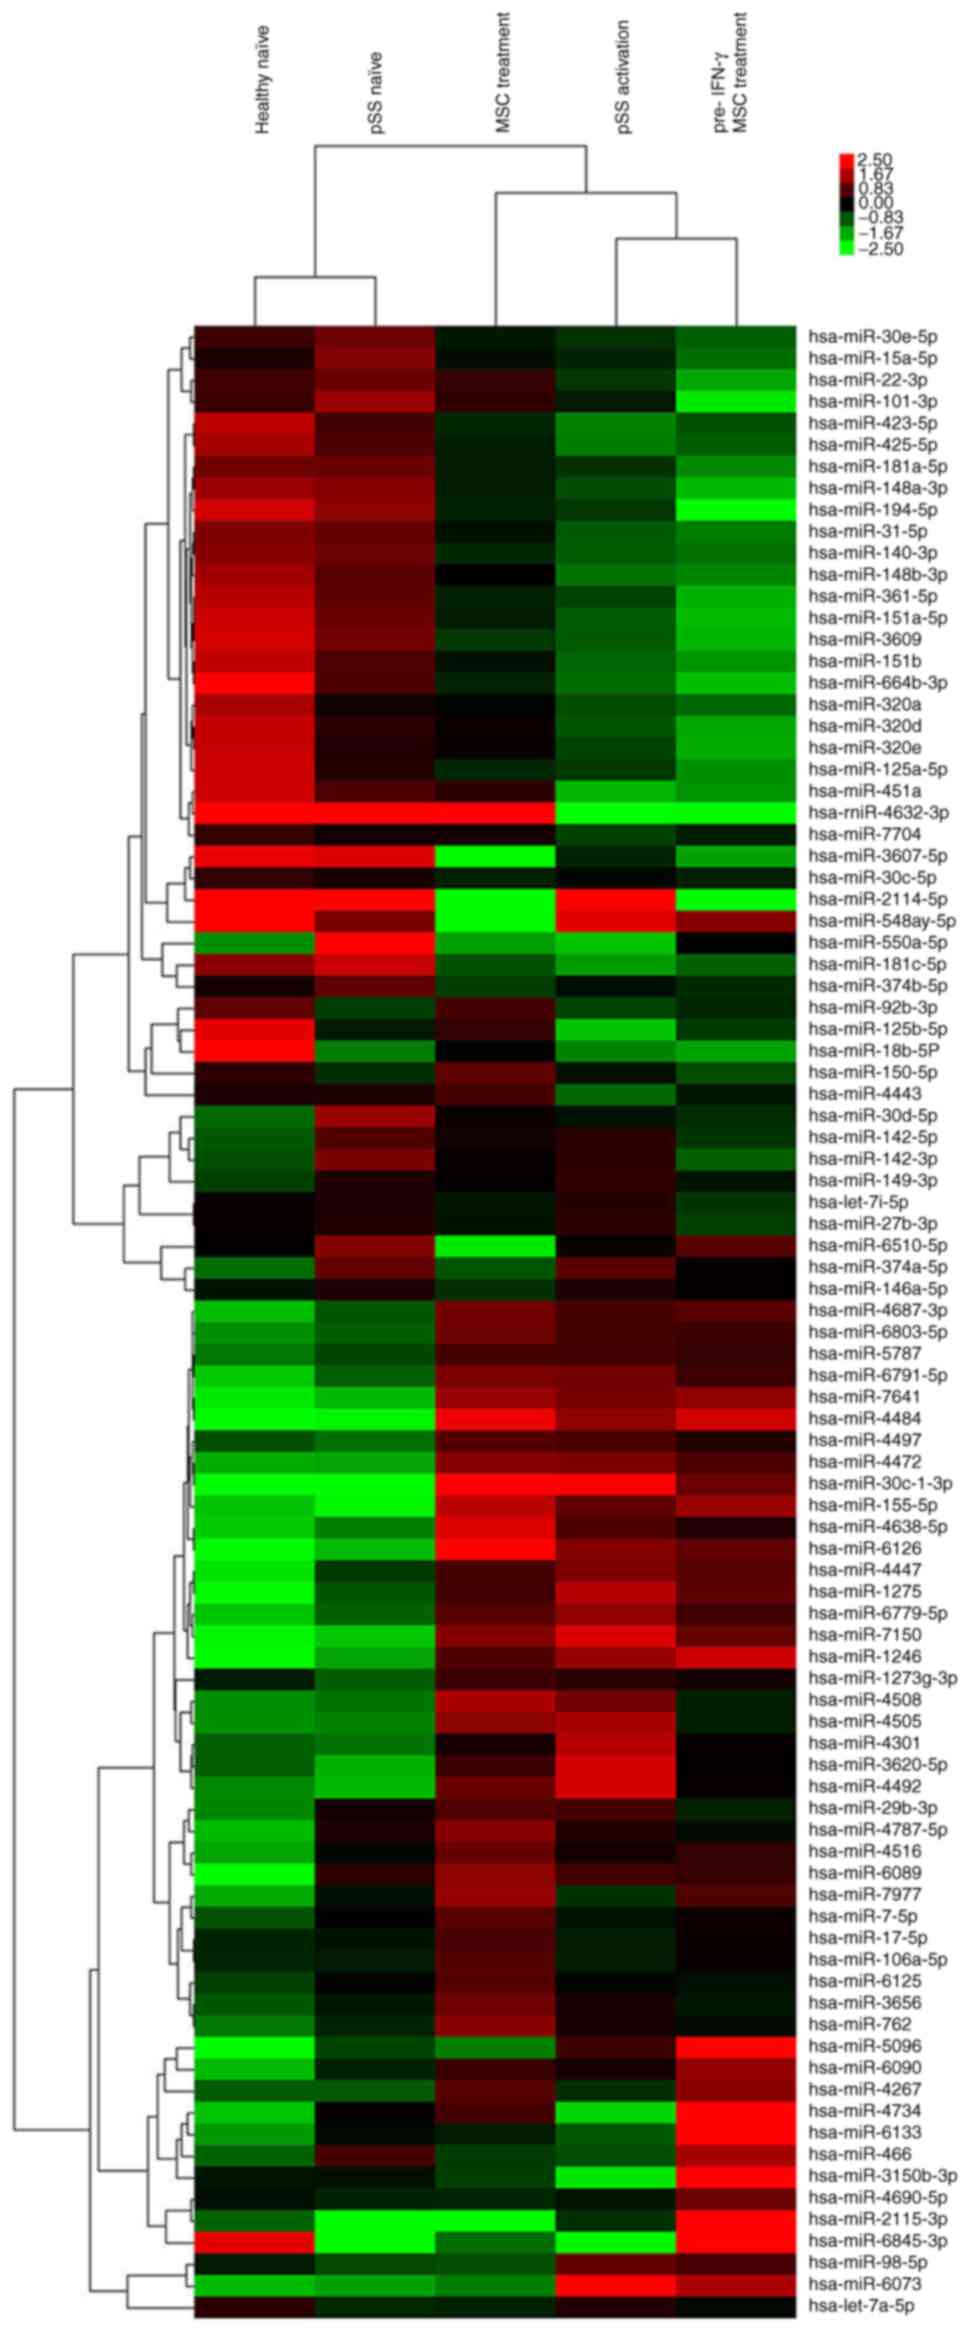
Activated CD4+ T cells and
MSC treatment demonstrate different miRNA signatures
A genome-wide survey of miRNA expression levels was
performed using miRNA microarray for 2,578 human miRNA sequences
enumerated in the Sanger database. After separating signals from
noise, the numbers of distinct miRNAs in pSS naïve (vs. healthy
naïve), pSS activation (vs. pSS naïve), MSC treatment (vs. pSS
activation) and pre-IFN-γ MSC treatment (vs. MSC treatment) groups
were 42, 55, 27 and 32, respectively (Fig. 1; Table
SII). Compared with the pSS naïve group, 26 of 55 miRNAs were
upregulated in the pSS activation group. The top 10 upregulated
miRNAs were miRNA-30c-1-3p, −155-5p, −1246, −1273g-3p, −1275,
−4472, −4638-5p, −5096, −7150 and −7641. The top downregulated
miRNAs were miRNA-15a-5p, −30d-5p, −30e-5p, −140-3p, −181a-5p,
−451a, −3607-5p, −4443, −4734 and −6510-5p. miRNA-15a-5p, −30d-5p,
−451a, −1246, −1275, −4734, −5096 and −6510-5p were also
differentially expressed between pSS and healthy naïve groups
(Fig. 1; Table SII). These data indicated that
these miRNAs were involved in pSS pathogenesis.
Given the unique miRNA profiling in stimulated
CD4+ T cells from patients with pSS, the effect of MSC
treatment alone on miRNome patterns of activated CD4+ T
cells was further investigated. Compared with pSS activation, 13 of
27 differentially expressed miRNAs were upregulated following MSC
treatment (Fig. 1; Table SII), including miRNA-92b-3p,
−125b-5p, −150-5p, −155-5p, −451a, −3150b-3p, −4267, −4443, −4484,
−4638-5p, −4734, −6126 and −7977. The downregulated miRNAs were
miRNA-98-5p, −146a-5p, −374a-5p, −1246, −1275, −3607-5p, −3620-5p,
−4301, −4492, −5096, −6073, −6510-5p and −7150. Moreover, the
upregulation of miRNA-98-5p, −1246, −1275, −3620-5p, −4301, −4492,
−5096, −6073 and −7150 and miRNA-155-5p, −4484, −4638-5p and −6216
in pSS activation was reversed or promoted by MSC treatment,
respectively. Downregulation of miRNA-125b-5p, −451a, −3150b-3p,
−4443 and −4734 and miRNA-3607-5p and −6510-5p in pSS activation
was reversed or promoted by MSC treatment, respectively.
Although MSC pretreatment by IFN-γ did not inhibit
CD4+ T cell proliferation more potently compared with
MSC treatment alone, 32 differentially expressed miRNAs existed
between the two groups (Fig. 1;
Table SII). The primary
upregulated miRNAs in the pre-IFN-γ MSC treatment group included
miRNA-146a-5p, −466, −1246, −3150b-3p, −4267, −4690-5p, −4734,
−5096, −6090 and −6133, whereas the downregulated miRNAs included
miRNA-22-3p, −30c-1-3p, −150-5p, −451a, −762, −3656, −4508,
−4638-5p and −6126.
miRNA target prediction by two
databases
In light of the impact of pSS activation and MSC
treatment on CD4+ T cell proliferation, TargetScan and
miRanda were used to predict the combined target genes of aberrant
miRNAs in the two groups. A total of 3,124 and 2,127 target genes
were predicted for the 55 miRNAs in the pSS activation group and 27
miRNAs in the MSC treatment group, respectively (Tables SIII and SIV).
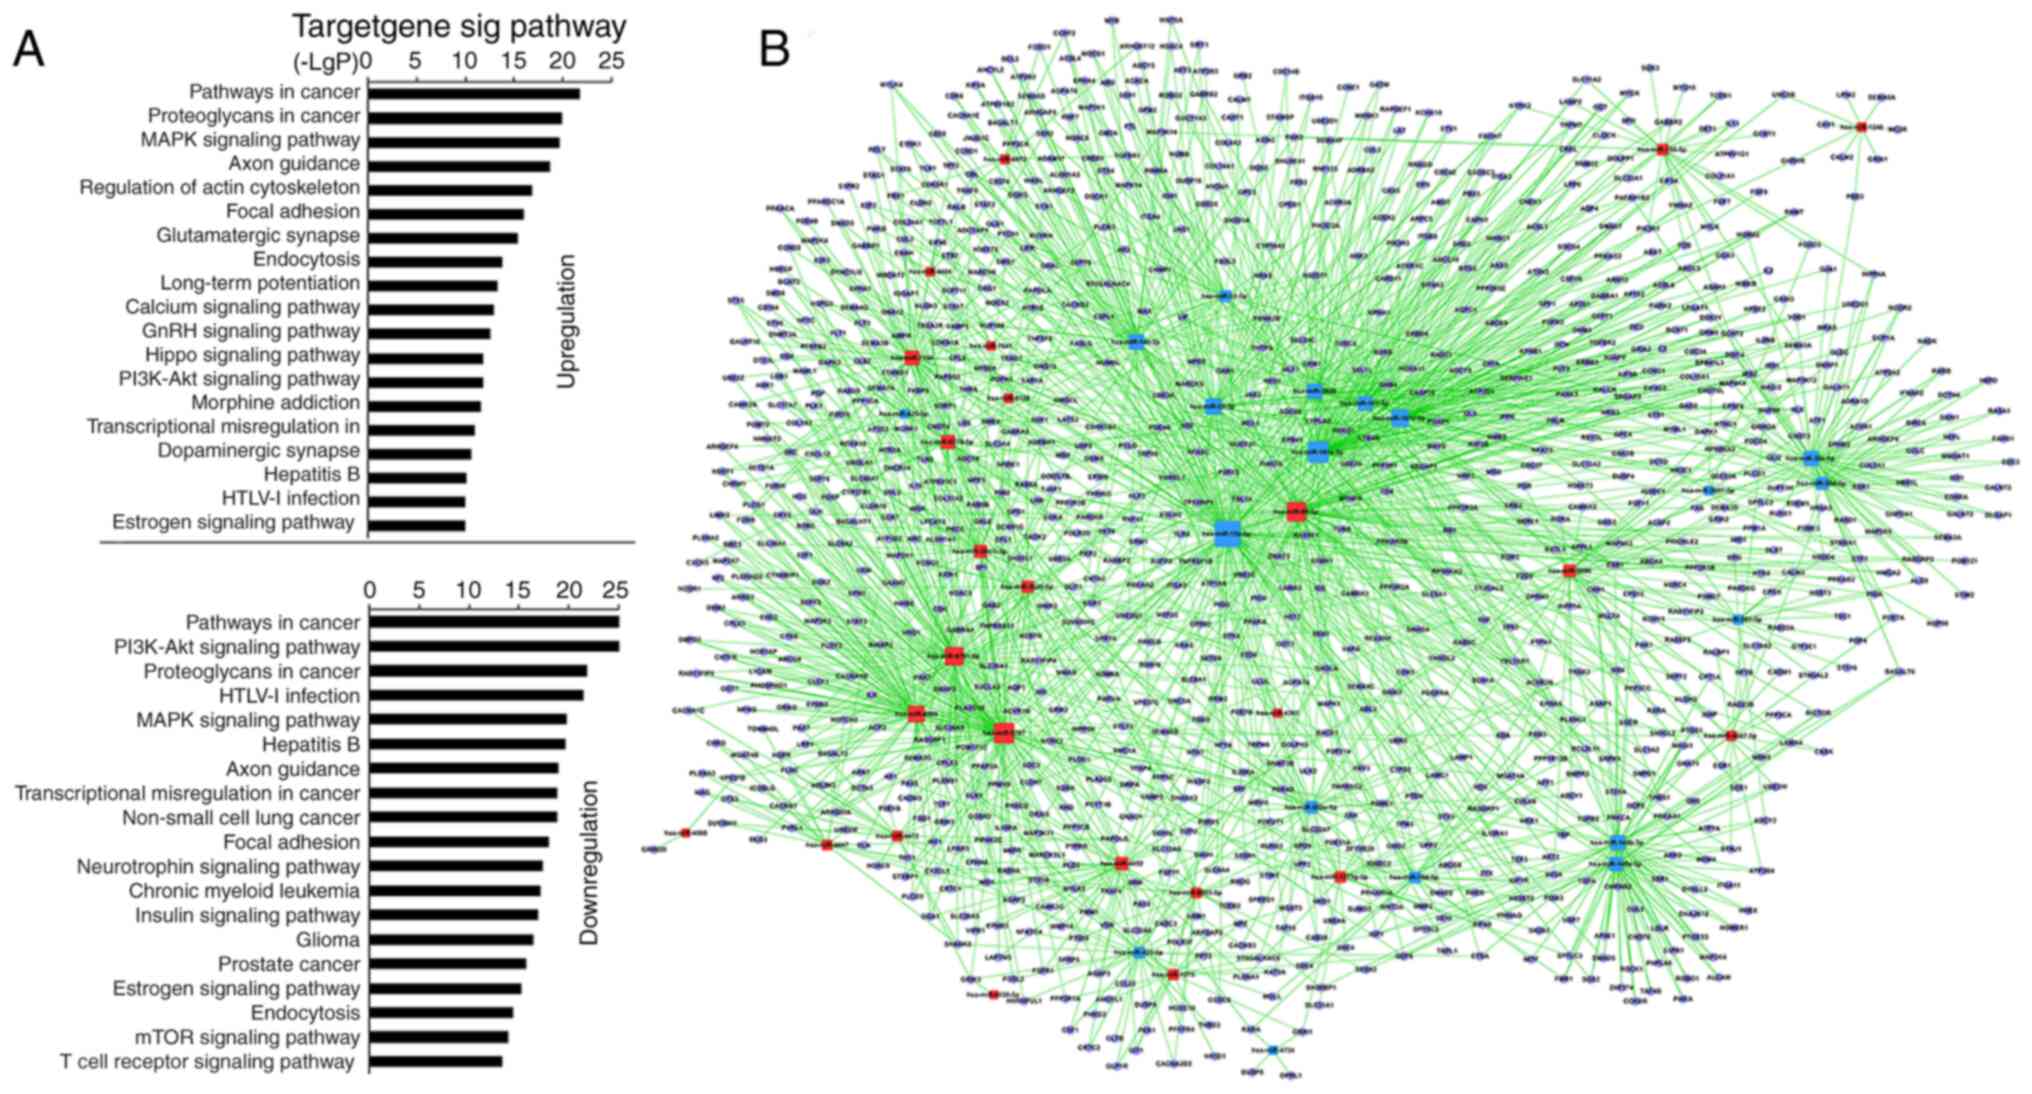
miRNA action on activated
CD4+ T cells and MSC treatment via bioinformatics
KEGG predicted that 55 miRNAs in the pSS activation
group significantly upregulated 128 and downregulated 131 GO terms
(Table SV). Among the upregulated
GOs, the top 10 were associated with ‘pathways in cancer’,
‘proteoglycans in cancer’, ‘MARK signaling pathway’, ‘regulation of
actin cytoskeleton’, ‘axon guidance’, ‘focal adhesion’,
‘glutamatergic synapse’, ‘endocytosis’, ‘long-term potentiation’
and ‘calcium signaling pathway’ (Fig.
2A; Table SV). Among the
downregulated GOs, the top 10 were associated with ‘PI3K-AKT
signaling pathway’, ‘pathways in cancer’, ‘HTLV–I infection’,
‘proteoglycans in cancer’, ‘hepatitis B’, ‘MAPK signaling pathway’,
‘axon guidance’, ‘non-small-cell lung cancer’, ‘transcriptional
misregulation in cancer’ and ‘focal adhesion’ (Fig. 2A; Table
SV). ‘TCR signaling pathway’, which is stimulated directly by
the anti-CD3 antibody and anti-CD28 antibody, was significantly
downregulated (Fig. 2A; Table SV). The miRNA-mRNA network via
bioinformatics predicted that the top 20 GO terms showing a high
enrichment degree were upregulated by miRNA-5787, −98-5p, −6791-5p,
−4505, −7150, −6779-5p, −30c-1-3p, −155-5p and −5096, and
downregulated by miRNA-15a-5p, −181a-5p, −181c-5p, −22-3p, −140-3p,
−3609, −30e-5p, −148b-3p, −101-3p, −148a-3p and −30d-5p (Fig. 2B and Table SVI). Notably, miRNA-155-5p, −98-5p,
−5096, −5787, −181a-5p, −15a-5p, −148b-3p, −140-3p, −7150 and −3609
participated in ‘TCR signaling pathway’ (Table SVII). miRNA-155 was predicted to
regulate the TCR signaling pathway via targeting key genes [such as
Fos, p21 (RAC1) activated kinase (PAK)2, MAP3K14, and PIK3R1]
whereas miRNA-181a-5p was predicted to target Fos and tumor
necrosis factor. Other high-degree miRNAs were also associated with
‘TCR signaling pathway’ [miRNA-5096 and −148b-3p targeted SOS1;
miRNA-15a-5p targeted KRAS; miRNA-7150 targeted
3-phosphoinositide-dependent protein kinase 1, MAP2K4 and P73;
miRNA-98-5p targeted AKT2, CBL, RAS guanyl releasing protein 1
(RASGPR1), VAV3 and PAK1; Table
SVII]. The microarray analysis indicated that miRNA-92b-3p,
−125b-5p and −150-5p exhibited the highest upregulation, and
miRNA-146a-5p, −374a-5p and −1246 exhibited the greatest
downregulation. However, bioinformatics demonstrated that the
aforementioned miRNAs were not involved in ‘TCR signaling
pathway’.
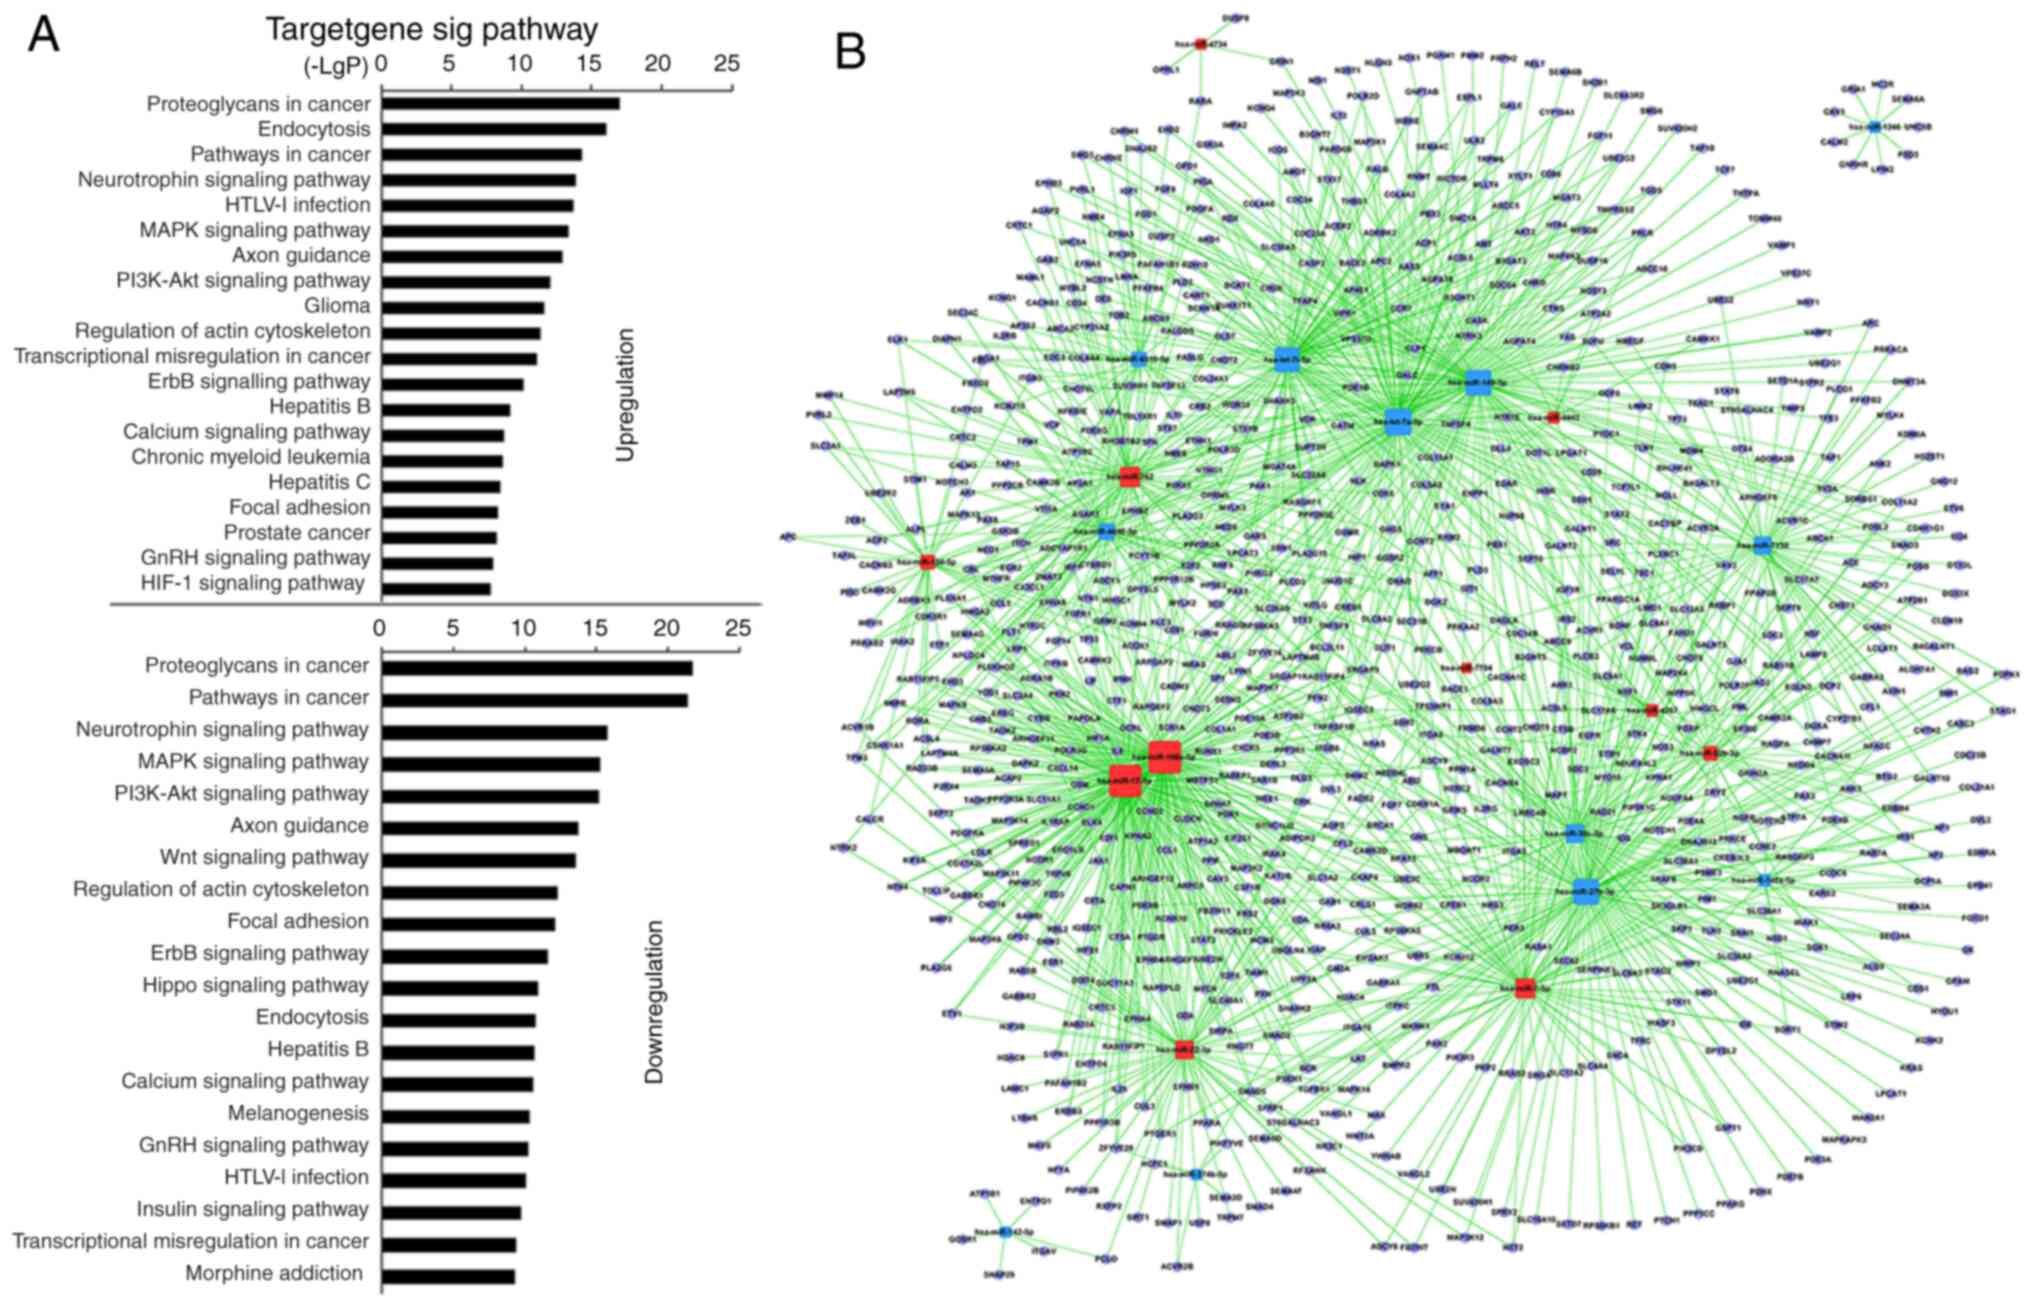
Analysis using KEGG revealed that 27 miRNAs in
MSC-treated CD4+ T cells upregulated 117 and
downregulated 123 GO terms significantly (Table SVIII). Among the upregulated GO
terms, the top 10 were associated with ‘proteoglycans in cancer’,
‘endocytosis’, ‘pathways in cancer’, ‘neurotrophin signaling
pathway’, ‘HTLV–I infection’, ‘PI3K-AKT signaling pathway’, ‘MAPK
signaling pathway’, ‘axon guidance’, ‘glioma’ and ‘regulation of
actin cytoskeleton’. Among the downregulated GO terms, the top 10
were associated with ‘proteoglycans in cancer’, ‘pathways in
cancer’, ‘neurotrophin signaling pathway’, ‘PI3K-AKT signaling
pathway’, ‘MAPK signaling pathway’, ‘axon guidance’, ‘regulation of
actin cytoskeleton’, ‘Wnt signaling pathway’, ‘focal adhesion’ and
‘ErbB signaling pathway’ (Fig. 3A;
Table SVIII). Furthermore, GO
terms, including ‘proteoglycans in cancer’, ‘endocytosis, pathways
in cancer’, ‘MAPK signaling pathway’, ‘HTLV–I infection’, ‘PI3K-AKT
signaling pathway’, ‘axon guidance’, ‘regulation of actin
cytoskeleton’ and ‘focal adhesion’, also showed statistically
significant enrichment in the pSS activation group. ‘TCR signaling
pathway’ remained unchanged in the MSC treatment group (Table SIX). The miRNA-mRNA network
revealed that, of miRNAs with high enrichment degree, miRNA-92b-3p,
−7704, −762, −7-5p, −4734, −4443, −4267, −22-3p, −17-5p, −150-5p
and −106a-5p were upregulated, and miRNA-7150, −6510-5p, −4690-5p,
−374b-5p, −30c-5p, −27b-3p, −149-3p, −146a-5p, −142-5p, −1246,
-let-7i-5p and -let-7a-5p were downregulated (Fig. 3B; Table SX). miRNA-22-3p and −7150
exhibited a high enrichment degree in the pSS activation group and
miRNA-7150 participated in ‘TCR signaling pathway’.
qPCR validation in the miRNA
microarray
Based on miRNA function classification, certain
miRNAs in the miRNA microarray were validated by qPCR. Of the eight
aberrant miRNAs in the pSS activation group (Fig. 4), the expression levels of
miRNA-155-5p, −7150 and −5096 were upregulated in activated
CD4+ T cells while those of miRNA-15a-5p, −181a,
−125b-5p, −140-3p and −22-3p were downregulated. Furthermore,
upregulation of miRNA-7150 and −5096 and downregulation of
miRNA-125b-5p and −22-3p were reversed in the MSC treatment group.
Moreover, miRNA-5096 was upregulated in the pSS naïve (vs. healthy
naïve) group whereas miRNA-125b-5p was downregulated (Fig. 4). All these results coincided with
the microarray results. Although the microarray indicated that
miRNA-155-5p had no 2-fold difference in the pSS activation or MSC
treatment groups, qPCR validated a 1.5-fold increase in the MSC
treatment group compared with the pSS activation group.
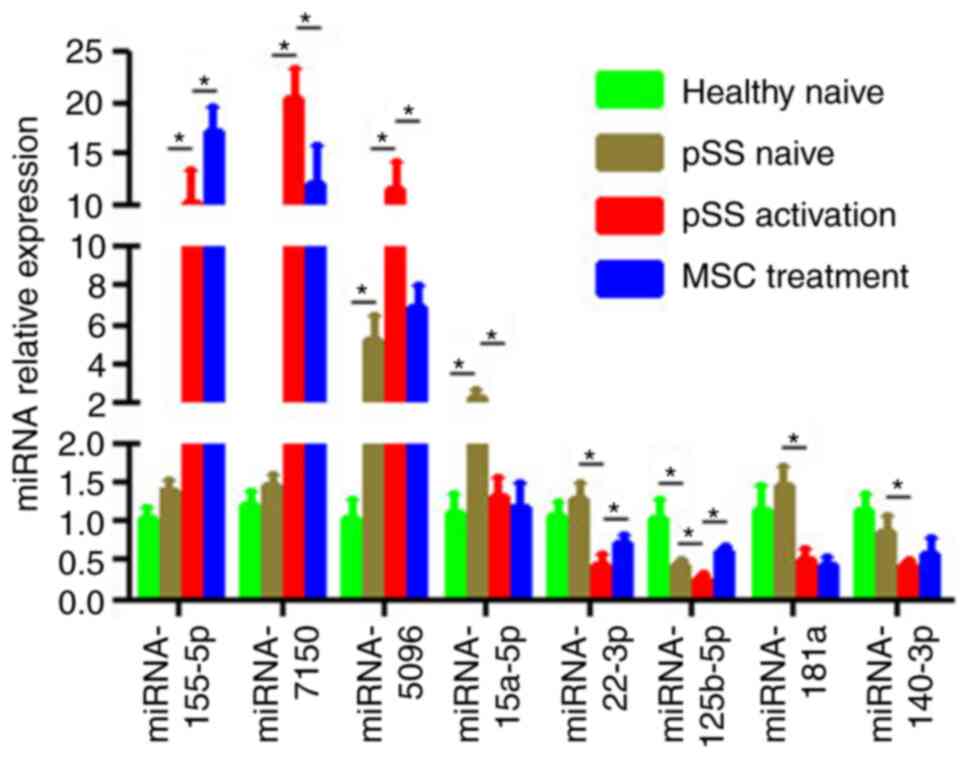 | Figure 4.Confirmation of differential
expression levels of miRNAs via RT-qPCR. Expression levels of
mature miRNA-155-5p, −7150, −5096, −15a-5p, −181a, −125b-5p,
−140-3p and −22-3p in CD4+ T cells from healthy and pSS
naïve, pSS activation and MSC treatment groups were determined
using RT-qPCR. U6 snRNA expression levels were used for
normalization. Data are presented as the mean ± SEM of three
independent repeats. *P<0.05. miRNA, microRNA; RT-q, reverse
transcription-quantitative; pSS, primary Sjögren syndrome; MSC,
mesenchymal stem cell. |
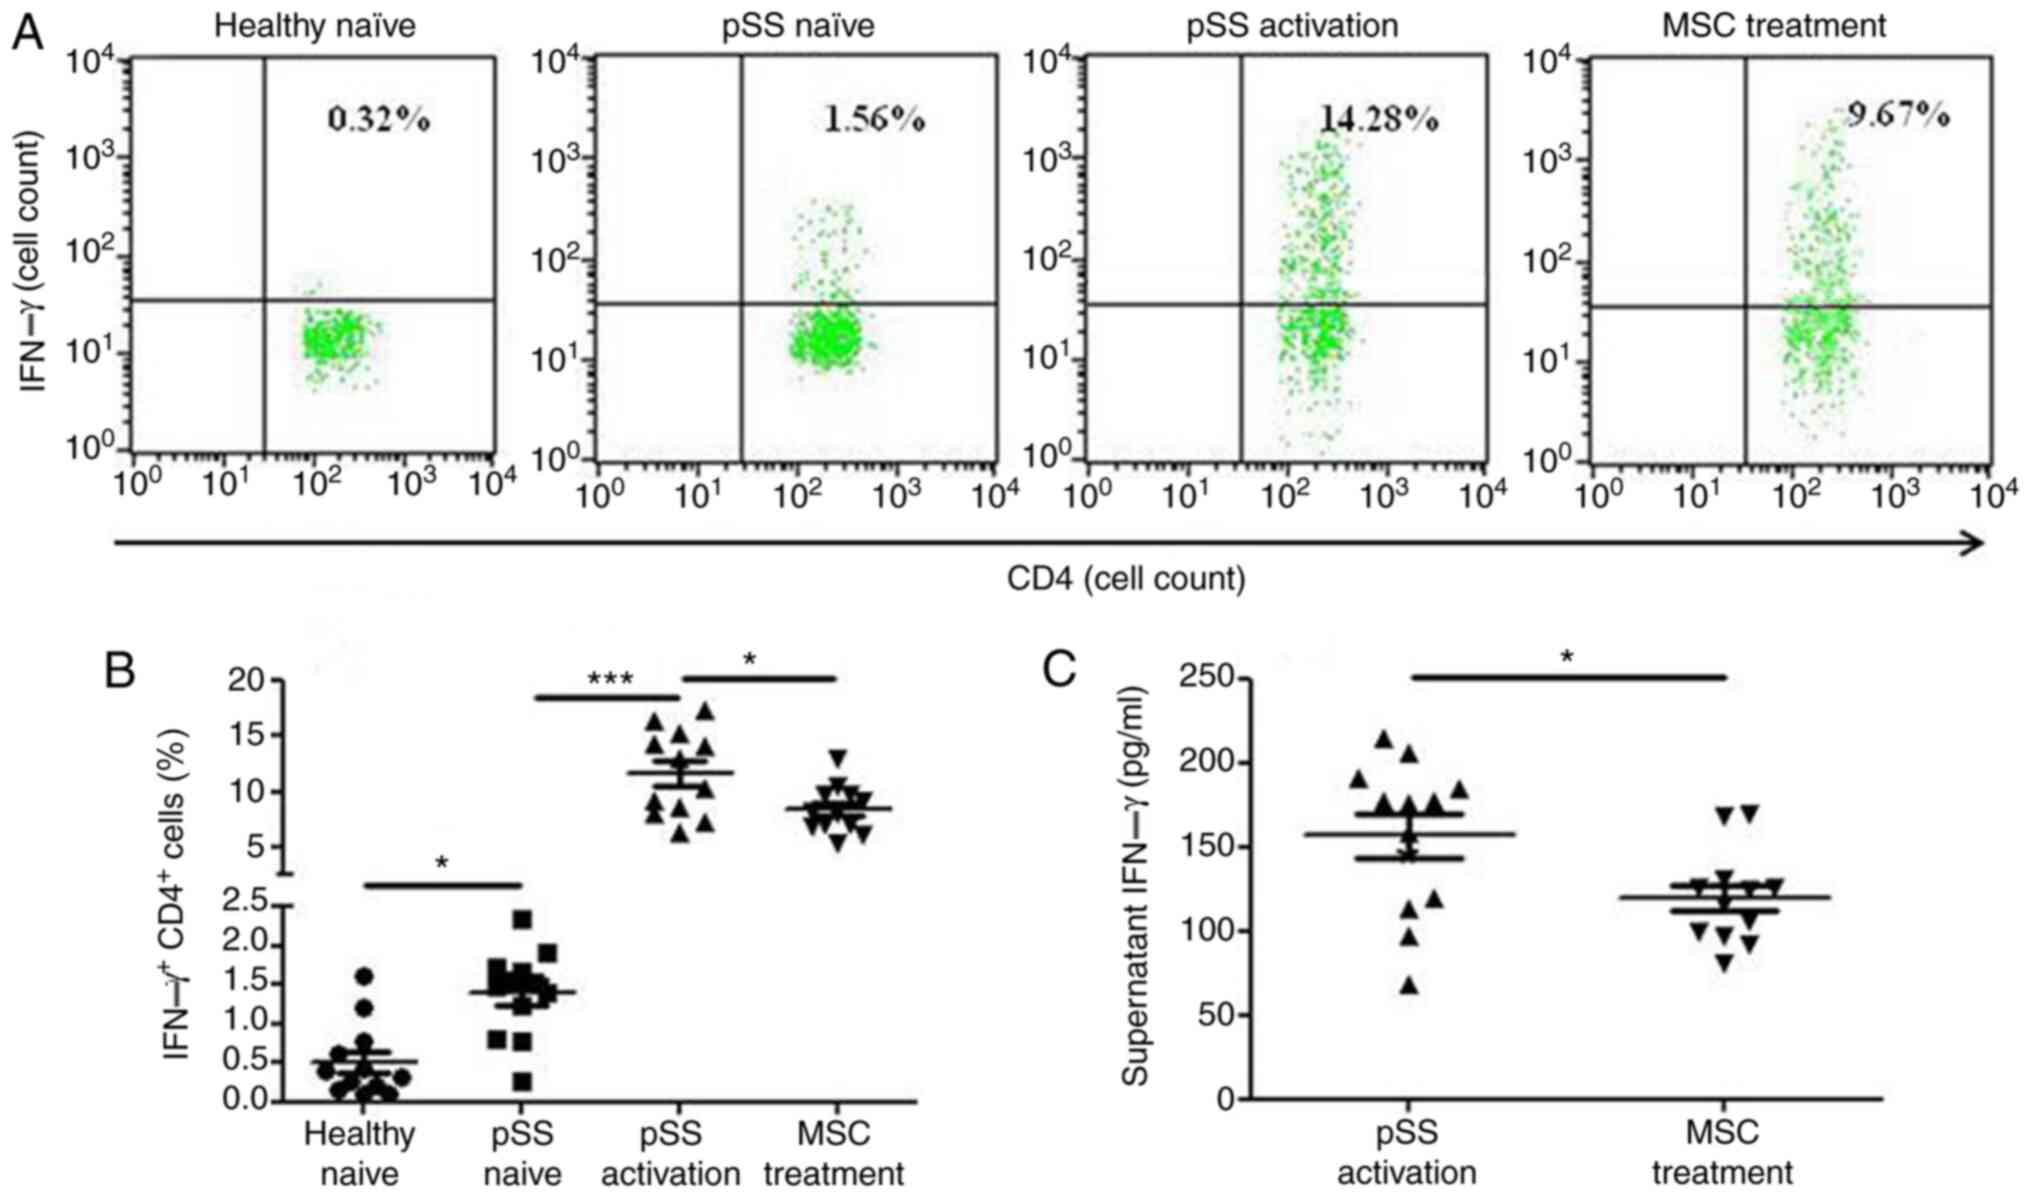
MSCs suppress IFN-γ production in
activated CD4+ T cells from patients with pSS
CD4+ IFN-γ+ cells were more
prevalent in the pSS activation group than in the pSS naïve group
following 72-h co-culture, and MSCs suppressed the levels of
CD4+ IFN-γ+ cells (Fig. 5A and B). Moreover, MSCs decreased
the levels of supernatant IFN-γ (Fig.
5C).
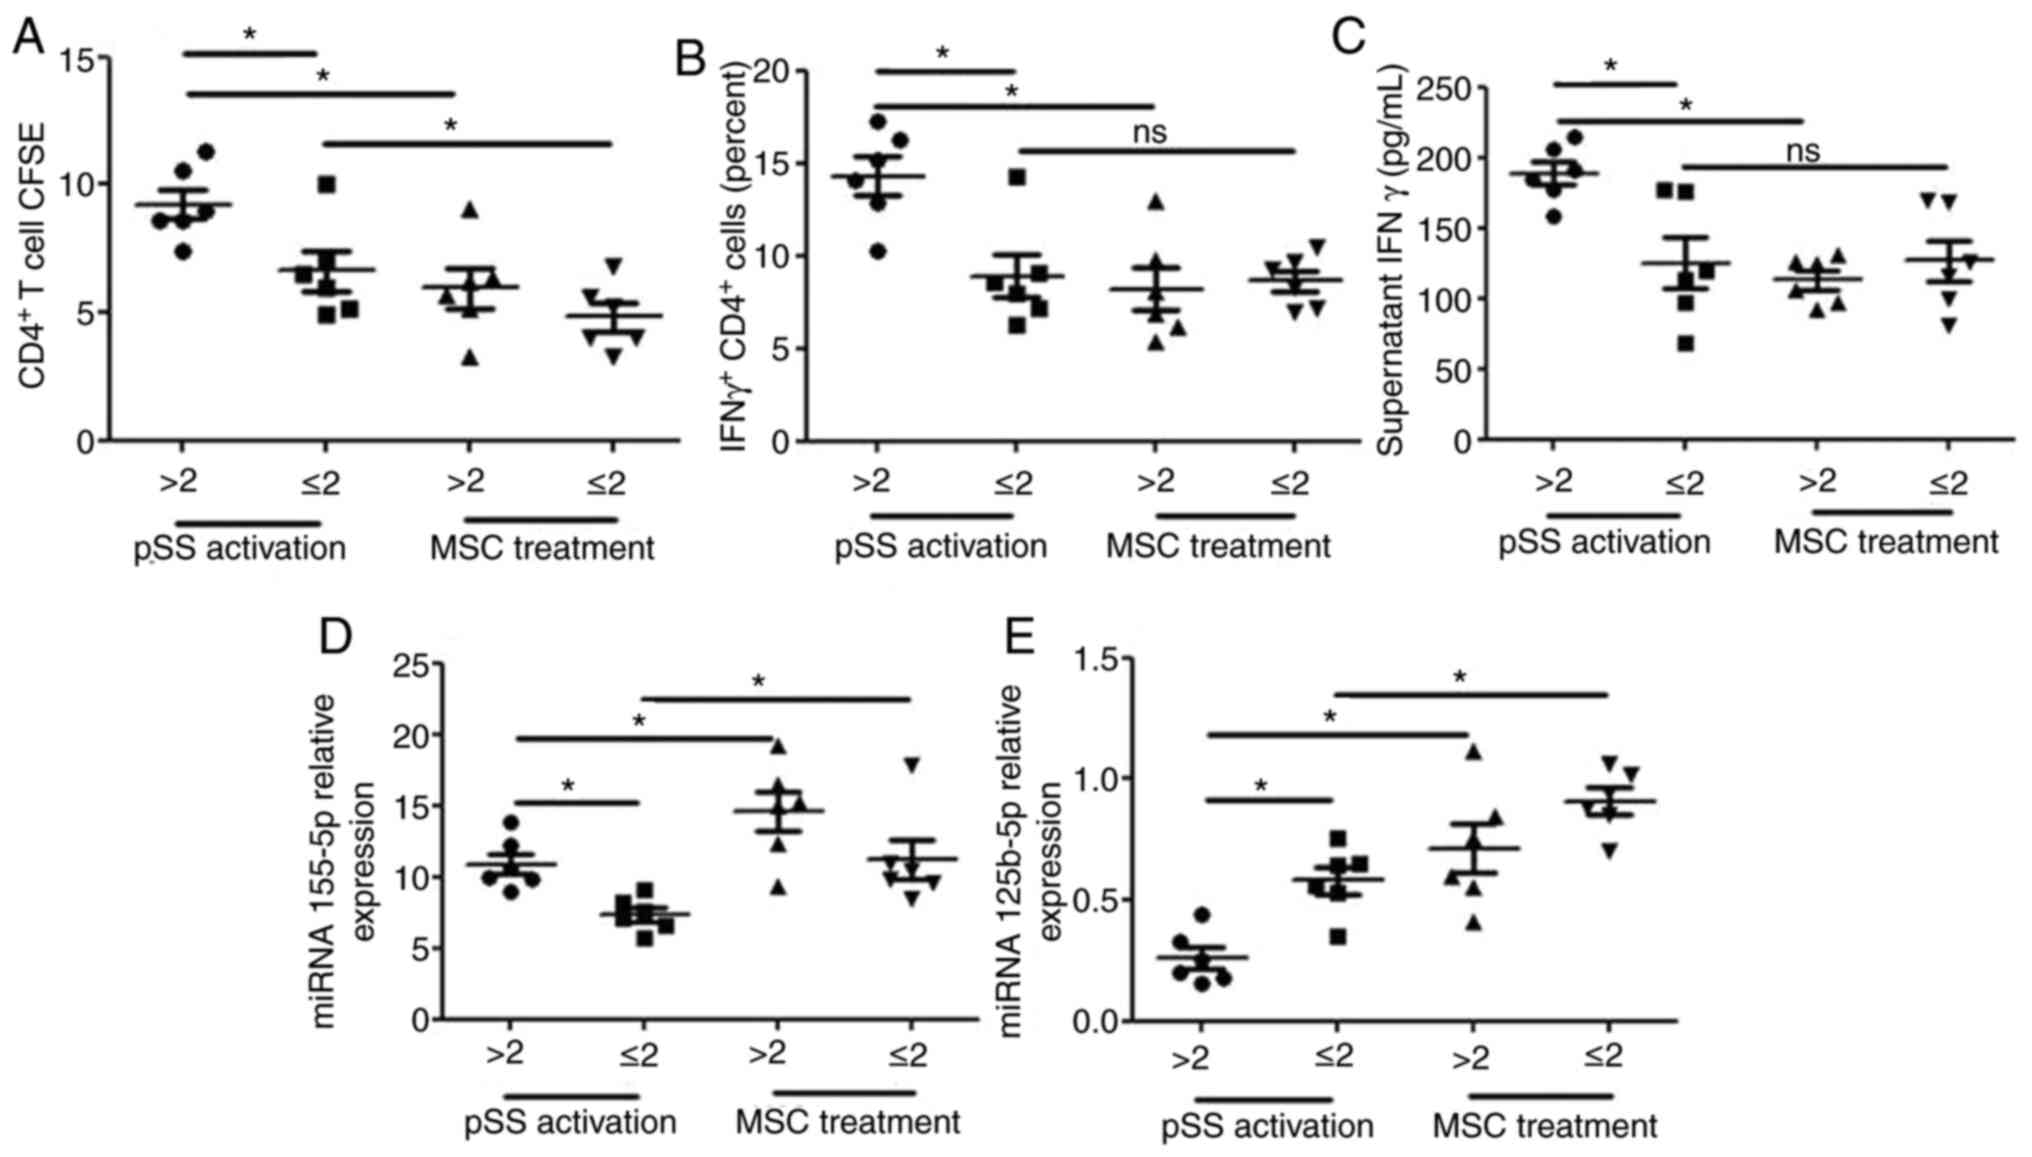
Association between disease activity
and miRNA-155-5p/miRNA-125b-5p in activated CD4+ T cells
from patients with pSS
In light of activated CD4+ cells in PBMCs
from patients with pSS, the present study investigated whether
miRNA-155-5p/miRNA-125b-5p in activated CD4+ T cells was
associated with pSS disease activity. Patients were classified into
two groups based on ESSDAI score: ESSDAI ≤2 (n=6) was classified as
inactive and ESSDAI >2 (n=6) was considered to be active. The
ESSDAI score was associated with alterations in proliferation of
CD4+ T cells and CD4+ IFN-γ+
cells, the expression levels of miRNA-125b-5p and miRNA-155 in
CD4+ T cells and supernatant IFN-γ secretion (Fig. 6). The proliferation of
CD4+ T and CD4+ IFN-γ+ cells, the
expression levels of miRNA-155 in CD4+ T cells and
supernatant IFN-γ secretion were notably increased and the
expression levels of miRNA-125b-5p in CD4+ T cells were
significantly decreased in patients with active pSS. MSC treatment
reversed these effects on the proliferation of CD4+ T
cells and CD4+ IFN-γ+ cells, the expression
levels of miRNA-125b-5p in CD4+ T cells and supernatant
IFN-γ secretion and promoted the expression levels of miRNA-155 in
CD4+ T cells from patients with active pSS. However, MSC
treatment did not reverse the effects on the proliferation of
CD4+ IFN-γ+ cells and supernatant IFN-γ
secretion in CD4+ T cells from patients with inactive
pSS.
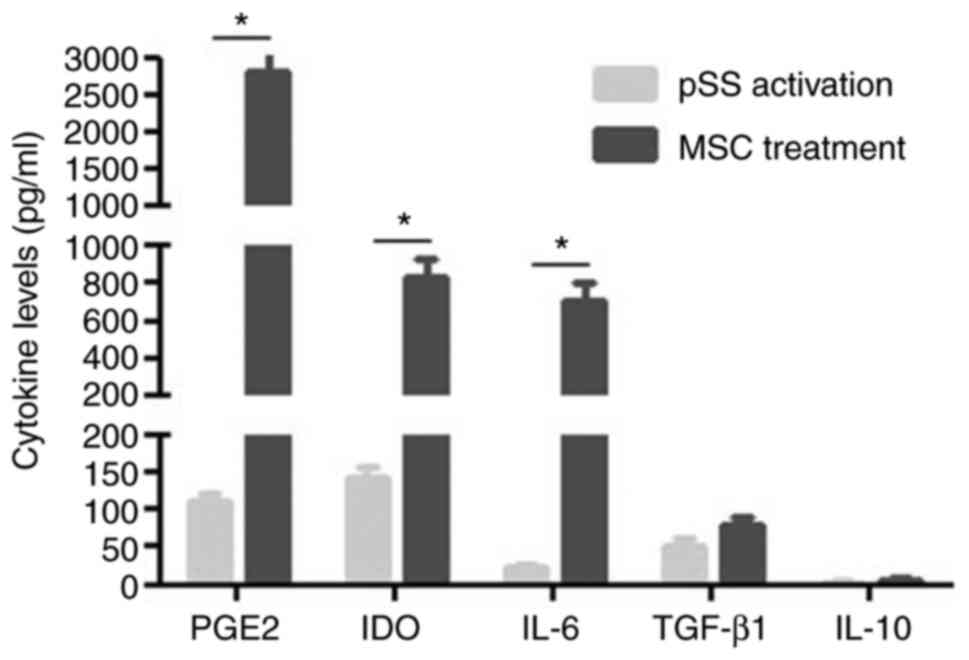
MSC-secreted cytokines
MSCs regulate T cells via soluble factors (24). Therefore, potential cytokines for
MSC modulation of CD4+ T cells were investigated.
Activated CD4+ T cells alone in culture were revealed to
secrete numerous cytokines such as PGE2, indoleamine
2,3-dioxygenase (IDO), IL-6 and −10 and TGF-β1. When MSCs were
co-cultured with activated CD4+ T cells, the expression
levels of PGE2, IDO and IL-6 significantly increased (Fig. 7).
Discussion
To the best of our knowledge, the present study was
novel in revealing genome-wide miRNAs in CD4+ T cells
from patients with pSS following activation and MSC treatment.
CD4+ T cells relied on signaling pathways that maintain
homeostasis between activation and quiescence. Specific miRNAomics
detected 55 differential miRNAs between the pSS activation and
naïve groups. Teteloshvili et al (25) reported that CD4+ T cells
of healthy individuals stimulated by CD3/CD28 antibodies exhibited
significant activation-induced changes in 12 miRNAs, including
upregulation of miRNA-155, miR-21 and miR-146a. The present miRNA
array comprised 38 new miRNAs in the T-lymphocyte function,
including upregulated 128 and 131 downregulated GO terms. Moreover,
‘TCR signaling pathway’ also changed directly, which was targeted
by miRNAs such as miRNA-155-5p, −98-5p, −5096, −5787, −181a-5p,
−15a-5p, −148b-3p, −140-3p, −7150 and −3609. The present study
investigated certain known miRNAs in the T-lymphocyte function. For
example, miRNA-155 has been revealed to upregulate the
susceptibility of CD4+ T cells to natural regulatory T
cell-mediated inhibition (26);
miRNA-1246 is predominantly expressed in both naïve and memory
regulatory T cells (Tregs) (27);
and miRNA-15a-5p is displayed in naïve natural Tregs from patients
at high risk of type 1 diabetes (28). The loss of miRNA-181a-5p has been
demonstrated to alleviate experimental autoimmune
encephalomyelitis, attenuate basal TCR signaling in peripheral T
cells and decrease their migration from lymph to lesions (29).
MSCs inhibit T cell proliferation and activation and
suppress IFN-γ production in CD4+ T cells in patients
with pSS, but the underlying mechanism remains unclear. In the
present study, the effect of MSCs on miRNA expression levels in
activated CD4+ T cells in patients with pSS was studied;
a total of 27 differential miRNAs between the pSS activation and
MSC treatment groups was identified. These miRNAs were involved in
117 upregulated and 123 downregulated GO terms. Although the TCR
signaling pathway remained unchanged, certain TCR-targeted miRNAs
in the pSS activation group, such as miRNA-98-5p, −5096, −7150 or
miRNA-155-5p, were reversed or promoted by MSC treatment. Notably,
the expression levels of miRNA-155-5p are increased in PBMCs of
patients with pSS (7). Upregulated
miRNA-155-5p in the pSS activation group was promoted by MSC
treatment. Grigoryev et al (30) revealed that knockdown of
miRNA-155-5p resulted in significant proliferation of
CD4+ T cells, confirming that the miRNA-155-5p serves an
antiproliferative role during activation. The present findings
indicated that MSCs may inhibit mitogenic CD4+ T cell
proliferation via upregulation of miRNA-155-5p. In addition,
although miRNA-125b-5p did not target the TCR signaling pathway
directly, both miRNA microarray and qPCR demonstrated that
downregulation of miRNA-125b-5p in the pSS naïve group further
decreased activation, whereas these effects were reversed by MSC
treatment. miRNA-125b-5p was reported to regulate genes associated
with T cell differentiation, such as IL2RB, IFNG, PR/SET domain 1
and IL10RA (31); overexpression of
miRNA-125b-5p in naïve lymphocytes may inhibit differentiation to
effector lymphocytes. miRNA-125b-5p may indirectly participate in
TCR activation of CD4+ T cells, pSS pathogenesis and MSC
treatment for pSS.
The association between ESSDAI and
miRNA-155-5p/miRNA-125b-5p in activated CD4+ T cells was
analyzed. The activated CD4+ T cells from patients with
active pSS exhibited increased expression of the IFN-γ+
phenotype, characterized by the overexpression of IFN-γ and
miRNA-155-5p and low expression levels of miRNA-125b-5p. MSC
treatment did not change IFN-γ levels in activated CD4+
T cells from patients with inactive pSS but did change miRNA-155-5p
and miRNA-125b-5p levels in activated CD4+ T cells from
patients with inactive pSS. miRNA-155-5p or miRNA-125b-5p may be a
more suitable biomarker than IFN-γ when patients with inactive pSS
are treated using MSCs. However, further studies are required to
confirm this due to the small cohort of patients with pSS.
As for the underlying mechanisms by which MSCs
change the miRNome patterns of activated CD4+ T cells,
MSCs may affect the alloimmune response via either direct contact
or secretory cytokines such as PGE2, TGF-β, IL-10, matrix
metalloproteinases and IDO. MSCs suppressed CD4+ T cell
proliferation in patients with pSS, which was consistent with the
findings of a previous study (3).
However, exposure to IFN-γ 24 h before co-culture did not induce
greater MSC inhibitory effects on CD4+ T cell
proliferation, which was different from the findings of a previous
study (22). This may be because
the inhibitory effects of exogenous IFN-γ pretreatment were
insufficient to overcome the effects of endogenous IFN-γ in
activated CD4+ T cells.
MSCs alone or co-cultured with activated
CD4+ T cells were revealed to secrete a number of
factors, which were reported to affect the miRNA expression levels
directly, such as PGE2 (32,33),
TGF-β1 (34,35) and IL-10 (36,37),
indicating the critical role of these soluble factors of MSCs in
miRNA profiles.
The present study had certain limitations. Firstly,
the association between miRNA-155/125-5p and pSS pathogenesis was
only investigated via co-culturing MSCs with pSS CD4+ T
cells. Future studies should use transiently silenced miRNA-155
and/or −125-5p in pSS CD4+ T cells to support the
present results. Secondly, miRNA-125b and miRNA-155 changes in
systematic RNA array were not significant. This may because be only
one RNA array was performed for each group, therefore the
miRNA-125b and miRNA-155 was verified by qPCR. Finally, the present
study did not demonstrate whether soluble factors or MSCs
themselves affect CD4+ activation and cytokine
production. This requires confirmation via further experiments,
such as RNA interference against Cox-2 in MSCs.
In summary, the present study identified miRNome
changes in CD4+ T cells from patients with pSS following
activation and MSC treatment, which presented with different miRNA
profiles. These miRNAs changed GO terms significantly and were
associated with CD4+ T cell proliferation and
activation. The TCR signaling pathway induced directly by anti-CD3
and anti-CD28 antibody was affected more profoundly in the pSS
activation group than in the MSC treatment group. Upregulation of
miRNA-5096 and miRNA-7150 and downregulation of miRNA-22-3p and
miRNA-125b-5p in the pSS activation group were reversed by MSC
treatment; miRNA-5096 was upregulated and miRNA-125b-5p was
downregulated in the pSS naïve group compared with the healthy
naïve group, indicating that the two miRNAs may serve a key role in
pSS pathogenesis and MSC treatment. Moreover, upregulated
miRNA-155-5p was further increased by MSC treatment, implying that
MSCs may exhibit immunosuppressant effects in activated
CD4+ T cells via the miRNA-155-5p antiproliferative
mechanism. The findings demonstrated a key role of miRNAs in
CD4+ T cells from patients with pSS following activation
and MSC treatment; miRNA-5096, −125b-5p or −155-5p contributed to
CD4+ T cell proliferation and activation, which may be
crucial for pSS pathogenesis and MSC treatment. Moreover,
miRNA-125b-5p and miRNA-155 levels in activated CD4+ T
cells from patients with pSS indicated that pSS disease activity
could offer a novel biomarker for future MSC management.
Supplementary Material
Supporting Data
Supporting Data
Supporting Data
Supporting Data
Supporting Data
Supporting Data
Supporting Data
Supporting Data
Supporting Data
Supporting Data
Acknowledgements
Not applicable.
Funding
The present study was supported by the National
Natural Science Foundation of China (grant nos. 81273295, 81671598
and 81801601), the China International Medical Exchange Foundation
(grant no. Z-2014-06-2-1620), the Shanghai Wu Mengchao Medical
Foundation (grant no. 17YF1417200), the Clinical Research Key
Program of Tongji Hospital Tongji University (grant no. ITJZD1909)
and the Research Training Foundation of Tongji Hospital (grant no.
GJPY1805).
Availability of data and materials
The datasets used and/or analyzed during the current
study are available from the corresponding author on reasonable
request.
Authors' contributions
JT have made substantial contributions to conception
and design of the present study, and acquisition, analysis and
interpretation of data. BG was involved in data acquisition and
drafting the manuscript. ZL, LZ, JH, JP, SP, MZ and JL contributed
to data acquisition. JL also made substantial contributions to
conception and design of the present study. All authors read and
approved the final manuscript.
Ethics approval and consent to
participate
Healthy controls and patients with pSS signed
informed consent from Tongji Hospital, Tongji University School of
Medicine (Shanghai, China). The participants' rights were
protected. All procedures with blood samples and MSCs were
confirmed by the Ethics Committee of Tongji Hospital (approval no.
K-2012-006; 25 February 2012).
Patient consent for publication
Not applicable.
Competing interests
The authors declare that they have no competing
interests.
Glossary
Abbreviations
Abbreviations:
|
MSCs
|
mesenchymal stem cells
|
|
pSS
|
primary Sjögren syndrome
|
|
GO
|
Gene Ontology
|
|
PGE2
|
prostaglandin E2
|
|
IDO
|
indoleamine 2,3-dioxygenase
|
|
UCs
|
umbilical cords
|
|
KEGG
|
Kyoto Encyclopedia of Genes and
Genomes
|
References
|
1
|
Mariette X and Criswell LA: Primary
sjögren's syndrome. N Engl J Med. 378:931–939. 2018. View Article : Google Scholar : PubMed/NCBI
|
|
2
|
Brito-Zerón P, Sisó-Almirall A, Bové A,
Kostov BA and Ramos-Casals M: Primary Sjögren syndrome: An update
on current pharmacotherapy options and future directions. Expert
Opin Pharmacother. 14:279–289. 2013. View Article : Google Scholar : PubMed/NCBI
|
|
3
|
Xu J, Wang D, Liu D, Fan Z, Zhang H, Liu
O, Ding G, Gao R, Zhang C, Ding Y, et al: Allogeneic mesenchymal
stem cell treatment alleviates experimental and clinical sjögren
syndrome. Blood. 120:3142–3151. 2012. View Article : Google Scholar : PubMed/NCBI
|
|
4
|
Weiss AR and Dahlke MH: Immunomodulation
by mesenchymal stem cells (MSCs): Mechanisms of action of living,
apoptotic, and dead MSCs. Front Immunol. 10:11912019. View Article : Google Scholar : PubMed/NCBI
|
|
5
|
De Miguel MP, Fuentes-Julián S,
Blázquez-Martínez A, Pascual CY, Aller MA, Arias J and
Arnalich-Montiel F: Immunosuppressive properties of mesenchymal
stem cells: Advances and applications. Curr Mol Med. 12:574–591.
2012. View Article : Google Scholar : PubMed/NCBI
|
|
6
|
Podshivalova K and Salomon DR: MicroRNA
regulation of T-lymphocyte immunity: Modulation of molecular
networks responsible for T-cell activation, differentiation, and
development. Crit Rev Immunol. 33:435–476. 2013. View Article : Google Scholar : PubMed/NCBI
|
|
7
|
Alevizos I, Alexander S, Turner RJ and
Illei GG: MicroRNA expression profiles as biomarkers of minor
salivary gland inflammation and dysfunction in sjögren's syndrome.
Arthritis Rheum. 63:535–544. 2011. View Article : Google Scholar : PubMed/NCBI
|
|
8
|
Campard D, Lysy PA, Najimi M and Sokal EM:
Native umbilical cord matrix stem cells express hepatic markers and
differentiate into hepatocyte-like cells. Gastroenterology.
134:833–848. 2008. View Article : Google Scholar : PubMed/NCBI
|
|
9
|
Tondreau T, Lagneaux L, Dejeneffe M,
Delforge A, Massy M, Mortier C and Bron D: Isolation of BM
mesenchymal stem cells by plastic adhesion or negative selection:
Phenotype, proliferation kinetics and differentiation potential.
Cytotherapy. 6:372–379. 2004. View Article : Google Scholar : PubMed/NCBI
|
|
10
|
Vitali C, Bombardieri S, Jonsson R,
Moutsopoulos HM, Alexander EL, Carsons SE, Daniels TE, Fox PC, Fox
RI, Kassan SS, et al: Classification criteria for sjögren's
syndrome: A revised version of the European criteria proposed by
the American-European consensus group. Ann Rheum Dis. 61:554–558.
2002. View Article : Google Scholar : PubMed/NCBI
|
|
11
|
Seror R, Ravaud P, Bowman SJ, Baron G,
Tzioufas A, Theander E, Gottenberg JE, Bootsma H, Mariette X and
Vitali C; EULAR Sjögren's Task Force, : EULAR sjögren's task force.
EULAR sjogren's syndrome disease activity index: Development of a
consensus systemic disease activity index for primary sjogren's
syndrome. Ann Rheum Dis. 69:1103–1109. 2010. View Article : Google Scholar : PubMed/NCBI
|
|
12
|
Bolstad BM, Irizarry RA, Astrand M and
Speed TP: A comparison of normalization methods for high density
oligonucleotide array data based on variance and bias.
Bioinformatics. 19:185–193. 2003. View Article : Google Scholar : PubMed/NCBI
|
|
13
|
Pfaffl MW, Lange IG, Daxenberger A and
Meyer HH: Tissue-specific expression pattern of estrogen receptors
(ER): Quantification of ER alpha and ER beta mRNA with real-time
RT-PCR. APMIS. 109:345–355. 2001. View Article : Google Scholar : PubMed/NCBI
|
|
14
|
The Gene Ontology Consortium: The gene
ontology resource: 20 years and still GOing strong. Nucleic Acids
Res. 47:D330–D338. 2019. View Article : Google Scholar : PubMed/NCBI
|
|
15
|
Rouillard AD, Gundersen GW, Fernandez NF,
Wang Z, Monteiro CD, McDermott MG and Ma'ayan A: The harmonizome: A
collection of processed datasets gathered to serve and mine
knowledge about genes and proteins. Database (Oxford).
2016:baw1002016. View Article : Google Scholar : PubMed/NCBI
|
|
16
|
Jassal B, Matthews L, Viteri G, Gong C,
Lorente P, Fabregat A, Sidiropoulos K, Cook J, Gillespie M, Haw R,
et al: The reactome pathway knowledgebase. Nucleic Acids Res.
48:D498–D503. 2020.PubMed/NCBI
|
|
17
|
Kanehisa M, Goto S, Kawashima S, Okuno Y
and Hattori M: The KEGG resource for deciphering the genome.
Nucleic Acids Res. 32:D277–D280. 2004. View Article : Google Scholar : PubMed/NCBI
|
|
18
|
Yi M, Horton JD, Cohen JC, Hobbs HH and
Stephens RM: WholePathwayScope: A comprehensive pathway-based
analysis tool for high-throughput data. BMC Bioinformatics.
19:302006. View Article : Google Scholar
|
|
19
|
Draghici S, Khatri P, Tarca AL, Amin K,
Done A, Voichita C, Georgescu C and Romero R: A systems biology
approach for pathway level analysis. Genome Res. 17:1537–1545.
2007. View Article : Google Scholar : PubMed/NCBI
|
|
20
|
Kim JH, Lee YT, Hong JM and Hwang YI:
Suppression of in vitro murine T cell proliferation by human
adipose tissue-derived mesenchymal stem cells is dependent mainly
on cyclooxygenase-2 expression. Anat Cell Biol. 46:262–271. 2013.
View Article : Google Scholar : PubMed/NCBI
|
|
21
|
Schurgers E, Kelchtermans H, Mitera T,
Geboes L and Matthys P: Discrepancy between the in vitro and
in vivo effects of murine mesenchymal stem cells on T-cell
proliferation and collagen-induced arthritis. Arthritis Res Ther.
12:R312010. View
Article : Google Scholar : PubMed/NCBI
|
|
22
|
Ryan JM, Barry F, Murphy JM and Mahon BP:
Interferon-gamma does not break, but promotes the immunosuppressive
capacity of adult human mesenchymal stem cells. Clin Exp Immunol.
149:353–363. 2007. View Article : Google Scholar : PubMed/NCBI
|
|
23
|
Krampera M, Cosmi L, Angeli R, Pasini A,
Liotta F, Andreini A, Santarlasci V, Mazzinghi B, Pizzolo G,
Vinante F, et al: Role for interferon-gamma in the immunomodulatory
activity of human bone marrow mesenchymal stem cells. Stem Cells.
24:386–398. 2006. View Article : Google Scholar : PubMed/NCBI
|
|
24
|
Wang Y, Chen X, Cao W and Shi Y:
Plasticity of mesenchymal stem cells in immunomodulation:
Pathological and therapeutic implications. Nat Immunol.
15:1009–1016. 2014. View Article : Google Scholar : PubMed/NCBI
|
|
25
|
Teteloshvili N, Smigielska-Czepiel K,
Kroesen BJ, Brouwer E, Kluiver J, Boots AM and van den Berg A:
T-Cell activation induces dynamic changes in miRNA expression
patterns in CD4 and CD8 T-cell subsets. Microrna. 4:117–122. 2015.
View Article : Google Scholar : PubMed/NCBI
|
|
26
|
Lind EF and Ohashi PS: Mir-155, a central
modulator of T-cell responses. Eur J Immunol. 44:11–15. 2014.
View Article : Google Scholar : PubMed/NCBI
|
|
27
|
Smigielska-Czepiel K, van den Berg A,
Jellema P, van der Lei RJ, Bijzet J, Kluiver J, Boots AM, Brouwer E
and Kroesen BJ: Comprehensive analysis of miRNA expression in
T-cell subsets of rheumatoid arthritis patients reveals defined
signatures of naive and memory tregs. Genes Immun. 15:115–125.
2014. View Article : Google Scholar : PubMed/NCBI
|
|
28
|
Zhang Y, Feng ZP, Naselli G, Bell F,
Wettenhall J, Auyeung P, Ellis JA, Ponsonby AL, Speed TP, Chong MM
and Harrison LC: MicroRNAs in CD4+ T cell subsets are
markers of disease risk and T cell dysfunction in individuals at
risk for type 1 diabetes. J Autoimmun. 68:52–61. 2016. View Article : Google Scholar : PubMed/NCBI
|
|
29
|
Schaffert SA, Loh C, Wang S, Arnold CP,
Axtell RC, Newell EW, Nolan G, Ansel KM, Davis MM, Steinman L and
Chen CZ: Mir-181a-1/b-1 modulates tolerance through opposing
activities in selection and peripheral t cell function. J Immunol.
195:1470–1479. 2015. View Article : Google Scholar : PubMed/NCBI
|
|
30
|
Grigoryev YA, Kurian SM, Hart T,
Nakorchevsky AA, Chen C, Campbell D, Head SR, Yates JR III and
Salomon DR: MicroRNA regulation of molecular networks mapped by
global microRNA, mRNA, and protein expression in activated T
lymphocytes. J Immunol. 187:2233–2243. 2011. View Article : Google Scholar : PubMed/NCBI
|
|
31
|
Rossi RL, Rossetti G, Wenandy L, Curti S,
Ripamonti A, Bonnal RJ, Birolo RS, Moro M, Crosti MC, Gruarin P, et
al: Distinct microRNA signatures in human lymphocyte subsets and
enforcement of the naive state in CD4+ T cells by the microRNA
miR-125b. Nat Immunol. 12:796–803. 2011. View Article : Google Scholar : PubMed/NCBI
|
|
32
|
Domingo-Gonzalez R, Katz S, Serezani CH,
Moore TA, Levine AM and Moore BB: Prostaglandin E2-induced changes
in alveolar macrophage scavenger receptor profiles differentially
alter phagocytosis of pseudomonas aeruginosa and Staphylococcus
aureus post-bone marrow transplant. J Immunol. 190:5809–5817. 2013.
View Article : Google Scholar : PubMed/NCBI
|
|
33
|
Oshima H and Oshima M: The role of
PGE2-associated inflammatory responses in gastric cancer
development. Semin Immunopathol. 35:139–150. 2013. View Article : Google Scholar : PubMed/NCBI
|
|
34
|
Domingo-Gonzalez R, Wilke CA, Huang SK,
Laouar Y, Brown JP, Freeman CM, Curtis JL, Yanik GA and Moore BB:
Transforming growth factor-β induces microRNA-29b to promote murine
alveolar macrophage dysfunction after bone marrow transplantation.
Am J Physiol Lung Cell Mol Physiol. 308:L86–L95. 2015. View Article : Google Scholar : PubMed/NCBI
|
|
35
|
Davis BN, Hilyard AC, Lagna G and Hata A:
SMAD proteins control DROSHA-mediated microRNA maturation. Nature.
454:56–61. 2008. View Article : Google Scholar : PubMed/NCBI
|
|
36
|
Curtale G, Mirolo M, Renzi TA, Rossato M,
Bazzoni F and Locati M: Negative regulation of toll-like receptor 4
signaling by IL-10-dependent microRNA-146b. Proc Natl Acad Sci USA.
110:11499–11504. 2013. View Article : Google Scholar : PubMed/NCBI
|
|
37
|
Schaefer JS, Montufar-Solis D, Vigneswaran
N and Klein JR: Selective upregulation of microRNA expression in
peripheral blood leukocytes in IL-10-/-mice precedes expression in
the colon. J Immunol. 187:5834–5841. 2011. View Article : Google Scholar : PubMed/NCBI
|