Introduction
Vitiligo (leukoderma, VIT) is characterized by
pigment loss in skin patches and is defined as a long-term skin
condition in which patches of affected skin turn white with obvious
color margins (1). The disease
incidence was 0.5–2% worldwide in 2017, independently of sex or
ethnicity factors (2). There is
increasing evidence that loss and degradation of functional
epidermal melanocytes may cause the onset of VIT (2,3). It
has been speculated that autoimmunity, cytotoxic metabolites and
oxidative stress induction may be the factors causing VIT
development and progression (4),
and therefore, may explain the molecular mechanisms underlying the
degradation of melanocytes. However, the pathogenesis of VIT
requires further investigation.
Melanocytes are melanin-producing neural
crest-derived cells (5). Recent
studies have demonstrated that VIT is an autoimmune disease that
targets melanocytes and that melanin loss is the main cause of
morbidity, regardless of ethnicity (6). Therefore, protecting melanocytes from
being targeted may have potential for slowing down the development
and progression of VIT (7).
Melanocytes may be targeted or destroyed by
T-cell-mediated immune responses initiated by autoimmune diseases
(8). Effector T cells (Teff cells),
mainly T helper 1 (Th1) and Th17 cells, are pro-inflammatory T
cells that may induce the development and progression of autoimmune
processes, while regulatory T cells (Treg cells) serve protective
and anti-inflammatory roles (9) and
are downregulated in autoimmune diseases (10). In multiple diseases, including skin
diseases, an imbalance between Treg and Teff cells is detected, as
Treg cells are decreased and Teff cells are increased (11). Additionally, a study has
demonstrated that microRNAs (miRNAs/miRs) serve key roles in
regulating the balance between Treg and Teff cells (12). However, the detailed molecular
mechanisms remain unclear.
At present, miRNAs have been reported to have
critical functions in the development and progression of VIT
(13,14). Overexpression of pre-miR-21 has been
demonstrated to regulate Treg/Teff balance following gastric cancer
resection (15). Another study
revealed that low miR-21-5p expression was associated with an
imbalance of Treg/Teff cells in patients with rheumatoid arthritis
(16). Therefore, the present study
hypothesized that miR-21-5p (also known as miR-21) may be a crucial
regulator during the differentiation of Treg/Teff cells, which is
rarely reported in VIT. Additionally, the mechanism through which
miR-21-5p participates in VIT affecting the differentiation of
Treg/Teff cells remains unclear. A study on the analysis of the
miRNA signature in Treg cells indicated that miR-21 is highly
expressed in Treg cells and positively regulates FOXP3 expression
(17), which is considered to be a
main regulator of Treg development. It is well known that the
transcription of miR-21 can be activated by STAT3 signaling
(18). However, in the present
study, TargetScan 7.2 (targetscan.org) predicted that STAT3 may be a
potential target of miR-21-5p.
Therefore, the present study aimed to investigate
the role of miR-21-5p and its underlying mechanism associated with
STAT3 in Treg/Teff balance, and its potentially indirect effect on
melanocytes, hoping to find a potential therapeutic treatment for
VIT.
Materials and methods
Ethics statement
The present study was approved by the Ethics
Committee of Dezhou People's Hospital (approval no. PFK20181006;
Dezhou, China). All participants provided written informed
consent.
Isolation of peripheral blood
mononuclear cells (PBMCs)
PBMCs were isolated using Ficoll-Hypaque-based
density gradient centrifugation (19). Peripheral blood samples were
obtained from 15 patients with VIT and 15 healthy individuals and
stored at 4°C to minimize cell activation. Whole blood samples were
mixed with PBS (Biologos, LLC) and manually layered over a
lymphocyte separation medium (Thomas Scientific), and centrifuged
at 2,000 × g for 30 min at room temperature. The layer containing
PBMCs was carefully harvested and then washed twice with PBS. The
cells were resuspended in PBS and were counted manually using a
Neubauer chamber (Ningbo Finer Medical Instruments Co., Ltd.) and
light microscope (magnification, ×100).
Flow cytometry
For analysis of lymphocyte subsets, PBMCs
(1×10⁶ cells/well) obtained from patients with VIT or
healthy individuals were suspended in RPMI-1640 medium supplemented
with 10% FBS (Invitrogen; Thermo Fisher Scientific, Inc.), 25 ng/ml
phorbol myristate acetate, 1 µg/ml ionomycin and 1 µg/ml brefeldin
A at 37°C with 5% CO2 for 5 h. All data were analyzed by
FlowJo software (version 7.6.1; FlowJo LLC).
Subsequently, cells were incubated and stained with
the following PE-Cyanine5-conjugated monoclonal antibodies (mAbs):
Anti-CD4 (RPA-T4; 1:40; cat. no. 15-0049-42), anti-CD8 (3B5; 1:500;
cat. no. MHCD0818), anti-CD25 (PC61.5; 1:100; cat. no. 61-0251-82),
anti-CD127 (A7R34; 1:700; cat. no. 15-1271-82), anti-interferon
(IFN)-γ (R4-6A2; Biotin; 1:400; cat. no. 36-7312-85),
anti-interleukin (IL)-17 (50104; 1:100; cat. no. MA5-23748) and
anti-IL-22 (22URTI; 1:500; cat. no. 12-7229-41) at 4°C for 10 min;
all antibodies were purchased from Thermo Fisher Scientific, Inc.,
and the experiments were performed according to the manufacturer's
protocol. The lymphocyte subsets were then analyzed by flow
cytometry. Differences in the proportions of Teff cells (Th1,
CD4+CD8−IFN-γ+/CD4+; Th17,
CD4+CD8−IL-17+/CD4+;
Th22,
CD4+CD8−IL-22+/CD4+)
and Treg cells
(CD4+CD25+CD127−/CD4+)
in patients with VIT and in healthy controls were detected and
measured using a CytoFLEX Flow Cytometry assay (B96622; Beckman
Coulter, Inc.).
Cell apoptosis was detected using an Annexin
V-fluorescein isothiocyanate/propidium iodide (PI) apoptosis kit
(cat. no. K101; BioVision, Inc.) according to the manufacturer's
protocol. Briefly, the cells were harvested 48 h after
transfection, washed twice with cold PBS and treated with Annexin V
and PI together for 15 min at room temperature in the dark. Cell
apoptosis was detected using a flow cytometry assay (APO006; FLISP
Serine Protease Detection kit; Bio-Rad Laboratories, Inc.). The
Annexin V+ PI+ cells were considered to be
the apoptotic cells. The apoptosis rate was assessed according to
the proportion of Annexin V+ PI+ cells.
Enzyme-linked immunosorbent assay
(ELISA)
ELISA was performed to measure the protein
expression levels of cellular cytokines (IFN-γ, IL-17A and IL-22)
in the peripheral blood of patients with VIT and of healthy
individuals, or from CD4+T cells or melanocyte
supernatant. The PBMCs and supernatant were separated by
centrifugation at 2,000 × g for 15 min at 4°C and stored in
aliquots at 80°C. The expression levels of inflammatory factors
(IFN-γ, IL-17A and IL-22) in CD4+T cells or melanocyte
supernatant were determined using their corresponding ELISA kits
(cat. nos. KHC4021 for IFN-γ, BMS2017 for IL-17A and BMS2047 for
IL-22; Invitrogen; Thermo Fisher Scientific, Inc.). OD values were
detected and measured using a Crocodile 4-in-one assay
miniWorkstation (Titertek-Berthold).
RNA isolation and reverse
transcription-quantitative (RT-q)PCR
Total RNA was extracted from PBMCs from patients
with VIT or healthy controls using TRIzol® reagent
(Invitrogen; Thermo Fisher Scientific, Inc.) and preserved at 4 or
−80°C. The RNA preserved at 4°C was used for cDNA, while the RNA
kept at −80°C was for long-term storage. The concentration of total
RNA was detected using a biological spectrometer (NanoDrop 2000;
Thermo Fisher Scientific, Inc.). A total of 1 µg of total RNA was
reverse transcribed into cDNA at 37°C for 60 min and 4°C for 5 min
using a First-strand cDNA Synthesis kit (cat. no. E6300L; New
England BioLabs, Inc.) according to the manufacturer's protocol.
RT-qPCR was conducted using the SYBR PremixEx Taq II kit (cat. no.
RR820L; Takara Bio, Inc.) in an AriaMx real-time PCR system (cat.
no. G8830A; Agilent Technologies, Inc.). Samples were run using the
following thermocycling parameters: Initial denaturation at 95°C
for 15 min, 94°C for 15 sec, followed by 40 cycles of 60°C for 30
sec and final extension at 72°C for 30 sec. Primer sequences are
shown in Table I. GAPDH (for STAT3)
and U6 (for miR-21-5p) were used as internal references. The
relative expression levels of genes were quantified using the
2−ΔΔCq method (20).
 | Table I.Primers used for reverse
transcription-quantitative PCR. |
Table I.
Primers used for reverse
transcription-quantitative PCR.
| Gene | Primers
(5′→3′) |
|---|
| Foxp3 |
|
|
Forward |
GAGAAGCTGAGTGCCATGC |
|
Reverse |
AGCCCTTGTCGGATGATG |
| MicroRNA-21-5p |
|
|
Forward |
TGTTGAGTCGTATCCAGTGCAA |
|
Reverse |
GTATCCAGTGCGTGTCGTGG |
| STAT3 |
|
|
Forward |
GAGGACTGAGCATCGAGCA |
|
Reverse |
CATGTGATCTGACACCCTGAA |
| U6 |
|
|
Forward |
GAGAAAGTTAGCACGGCTTCTG |
|
Reverse |
CAAAATATGGAATGCTTCAAAGAG |
| GAPDH |
|
|
Forward |
GATCAACACGTACCAGTGCAA |
|
Reverse |
CGCCTGTACACTCCACCAC |
Western blot analysis
Western blot analysis was performed to measure the
protein levels of relative mRNAs in PBMCs from patients with VIT or
healthy controls as previously described (21). Proteins were lysed and extracted
using RIPA buffer (P0013C; Beyotime Institute of Biotechnology)
shortly after cell collection, and protein concentration was
measured using a BCA protein kit (Sigma-Aldrich; Merck KGaA). A
total of 30 µg protein/lane was separated via 12% SDS-PAGE (cat.
no. P0012A; Beyotime Institute of Biotechnology) and transferred
onto polyvinylidene fluoride membranes (cat. no. FFP28; Beyotime
Institute of Biotechnology), which were then blocked using 5%
skimmed milk for 2 h at room temperature. The membranes were
incubated at 4°C overnight with the following primary antibodies:
Anti-STAT3 antibody (mouse; 1:5,000; cat. no. ab119352; Abcam) and
anti-GAPDH antibody (rabbit; 1:10,000; cat. no. ab181602; Abcam).
GAPDH was used as the internal reference. The membranes were
subsequently incubated at room temperature for 1 h with secondary
horseradish peroxidase-conjugated antibodies: goat anti-mouse IgG
H&L (1:2,000; cat. no. ab205719; Abcam) and goat anti-rabbit
IgG H&L (1:2,000; cat. no. ab205718; Abcam). The membranes were
washed three times with TBST (0.1% Tween-20) and developed using an
enhanced chemiluminescence kit (EMD Millipore). The grey values of
the strips were quantified by ImageJ (version 5.0; National
Institutes of Health).
Th17 cell polarization
PBMCs were isolated from patients with VIT using
Ficoll-Hypaque-based density gradient centrifugation.
CD4+ T cells used in the experiments were purified using
CD4 microbeads (cat. no. 130-045-101; Miltenyi Biotec, Inc.) for
PBMCs in peripheral blood with 95% purity. To induce Th17 cell
polarization, CD4+ T cells were cultured with 5 µg/ml
anti-CD3 mAb (cat. no. 17-0038-42; Thermo Fisher Scientific, Inc.)
in 24-well culture plates, and anti-CD28 mAb (cat. no. CD2804;
Thermo Fisher Scientific, Inc.) at a final concentration of 2 µg/µl
and incubated in RPMI-1640 medium (Thermo Fisher Scientific, Inc.)
at 4°C for 30 min 5% CO2. Cell were treated with 5 ng/ml
tumor growth factor (TGF)-β, 20 ng/ml IL-6 and 25 ng/ml IL-23 to
induce the polarization of Th17 cells at 4°C for 30 min.
Target prediction and Dual-Luciferase
reporter assay
Target gene and potential binding sites of miR-21-5p
and STAT3 were predicted using TargetScan 7.2 (targetscan.org), and subsequently confirmed via
Dual-Luciferase reporter assay.
A PMIR-REPORT Luciferase vector (cat. no. AM5795;
Thermo Fisher Scientific, Inc.) containing wild-type (WT) or
mutated (MUT) STAT3 sequences was cloned into the pMirGLO reporter
vector (Promega Corporation) to generate STAT3-WT and STAT3-MUT,
respectively. CD4+ T cells (5×10³ cells/well)
from 1 normal control were cultured in 96-well plates and
co-transfected with STAT3-WT (sequence,
5′-ACUCUUCAGUACAUAAUAAGCUU-3′) or STAT3-MUT (sequence,
5′-ACUCUUCAGUACAUAGGCCAUGU-3′), and a miR-21-5p mimic or a mimic
control using Lipofectamine® 3000 (Thermo Fisher
Scientific, Inc.) according to the manufacturer's protocol at 37°C.
The Renilla luciferase gene of the pMirGLO reporter vector
served as an internal control. Cells were harvested 48 h after
transfection for the detection of luciferase activity using a
dual-luciferase reporter assay (cat. no. E1910; Promega
Corporation) according to the manufacturer's protocol. Firefly
luciferase activity was normalized to Renilla luciferase
activity.
Cell co-culture and transfection
For cell co-culture, Th17-polarized CD4+
T cells obtained from patient with VIT were cultured in the upper
chamber, whereas primary melanocytes were cultured in the lower
chamber. Cells were cultured in 0.4 µM Transwell inserts for
24-well plates (Greiner Bio-One International GmbH) at 37°C in a 5%
CO2 atmosphere. The culture medium for both chambers was
Ham's F12 nutrient mixture (Thermo Fisher Scientific, Inc.).
For cell transfection, Th17-polarized
CD4+ T cells were cultured at a density of
5×10⁵ cells/well in a 96-well plate for 24 h at room
temperature in 5% CO2 atmosphere. miR-21-5p mimic
(sequence, 5′-UAGCUUAUCAGACUGAUGUUGA-3′) and the miR-21-5p
inhibitor (sequence, 5′-UCAACAUCAGUCUGAUAAGCUA-3′) were purchased
from Sigma-Aldrich (Merck KGaA). STAT3 was overexpressed using a
pcDNA3.1 plasmid (Thermo Fisher Scientific, Inc.). The medium in
the 96-well plates was replaced after 24 h, and the cells were
transfected with 100 ng miR-21-5p mimic or miR-21-5p inhibitor, and
STAT3 using Lipofectamine® 3000 (Thermo Fisher
Scientific, Inc.), according to the manufacturer's protocol. The
cells were harvested 48 h after transfection and used for
subsequent experiments.
Primary melanocytes were isolated from the skin of
the 15 patients with VIT by suction blistering (4) and subsequently cultured in the lower
chamber containing Hu 16 medium, which was supplemented with 50
µg/ml gentamicin, 20 ng/ml fibroblast growth factor (Sigma-Aldrich;
Merck KGaA), 20 µg/ml isobutylmethylxanthine (Sigma-Aldrich; Merck
KGaA) and 10 ng/ml cholera toxin (Sigma-Aldrich; Merck KGaA), at
37°C with 5% CO2 for 4 h. The cell density in the
culture flasks was 5×10⁵ cells/ml.
Subsequently, Th17-polarized CD4+ T cells
(in the upper chamber) and primary melanocytes (in the lower
chamber) were co-cultured in a 6-well plate at a density of
1×10⁵ cells/well for 72 h at 37°C. The cells were
harvested for subsequent experiments to detect the survival of
primary melanocytes after various treatments.
Tyrosinase activity detection
Levodopa (L-DOPA) solution (cat. no. 333786;
Sigma-Aldrich; Merck KGaA) was used for the detection of tyrosinase
activity. Briefly, after co-culturing Th17-polarized
CD4+ T cells obtained from patients with VIT for 72 h,
melanocytes were washed once with PBS. Subsequently, cells were
pretreated with 90 µl 1% Triton X-100 solution at −80°C for 30 min
and allowed to thaw at room temperature. A total of 0.1% L-DOPA
solution (100 µl/well) was then added into cells at 37°C for 2 h.
OD values at 490 nm were measured and recorded using a microplate
reader (model 680; Bio-Rad Laboratories, Inc.). The tyrosinase
activity in each group relative to the control group was calculated
as follows: Relative tyrosinase activity=(OD
valuessample-OD valuescontrol group)/OD
valuescontrol group ×100.
Detection of melanin
For melanin detection of melanocytes obtained from
the skin of patients with VIT, the supernatant was discarded and
the cells were washed once with PBS, and treated with 500 µl 1
mol/l NaOH diluted into DMSO in a water bath at 70°C for 2 h to
dissolve melanin. Subsequently, lysates in the 6-well plate were
transferred to a 96-well plate (100 µl for each plate). OD values
at 405 nm were measured and recorded using a microplate reader
(model 680; Bio-Rad Laboratories, Inc.).
Statistical analysis
The data are expressed as the mean ± SD (n≥3).
Statistical analysis was performed using SPSS 20.0 software (IBM
Corp.). Statistical significance was analyzed using unpaired
Student's t-test to compare control and VIT groups or one-way ANOVA
followed by Dunnett's post hoc test for other experiments.
P<0.05 was considered to indicate a statistically significant
difference.
Results
Proportion of Treg cells is decreased,
but that of Teff cells is increased in CD4+ T cells of
patients with VIT
Treg/Teff cell imbalance has been identified in
multiple diseases, including skin diseases (11). Therefore, Treg and Teff subset
populations in CD4+ T cells from patients with VIT and
from normal healthy controls were measured. The proportions of Th17
cells (CD4+CD8−IL-17+) and Th22
cells (CD4+CD8−IL-22+) in
CD4+ T cells from patients with VIT were significantly
increased compared with those from normal individuals (P<0.001;
Fig. 1B and C). a significant
difference is shown in Fig. 1A and
1D, indicating that Th1
(CD4+CD8−IFN-γ+) and Treg cells
(CD4+CD25+CD127−) in patients with
VIT were significantly decreased compared with controls (P<0.01;
Fig. 1A, P<0.001; Fig. 1D). Therefore, the proportion of Treg
cells was decreased, while that of Teff cells was increased in
CD4+ T cells of patients with VIT.
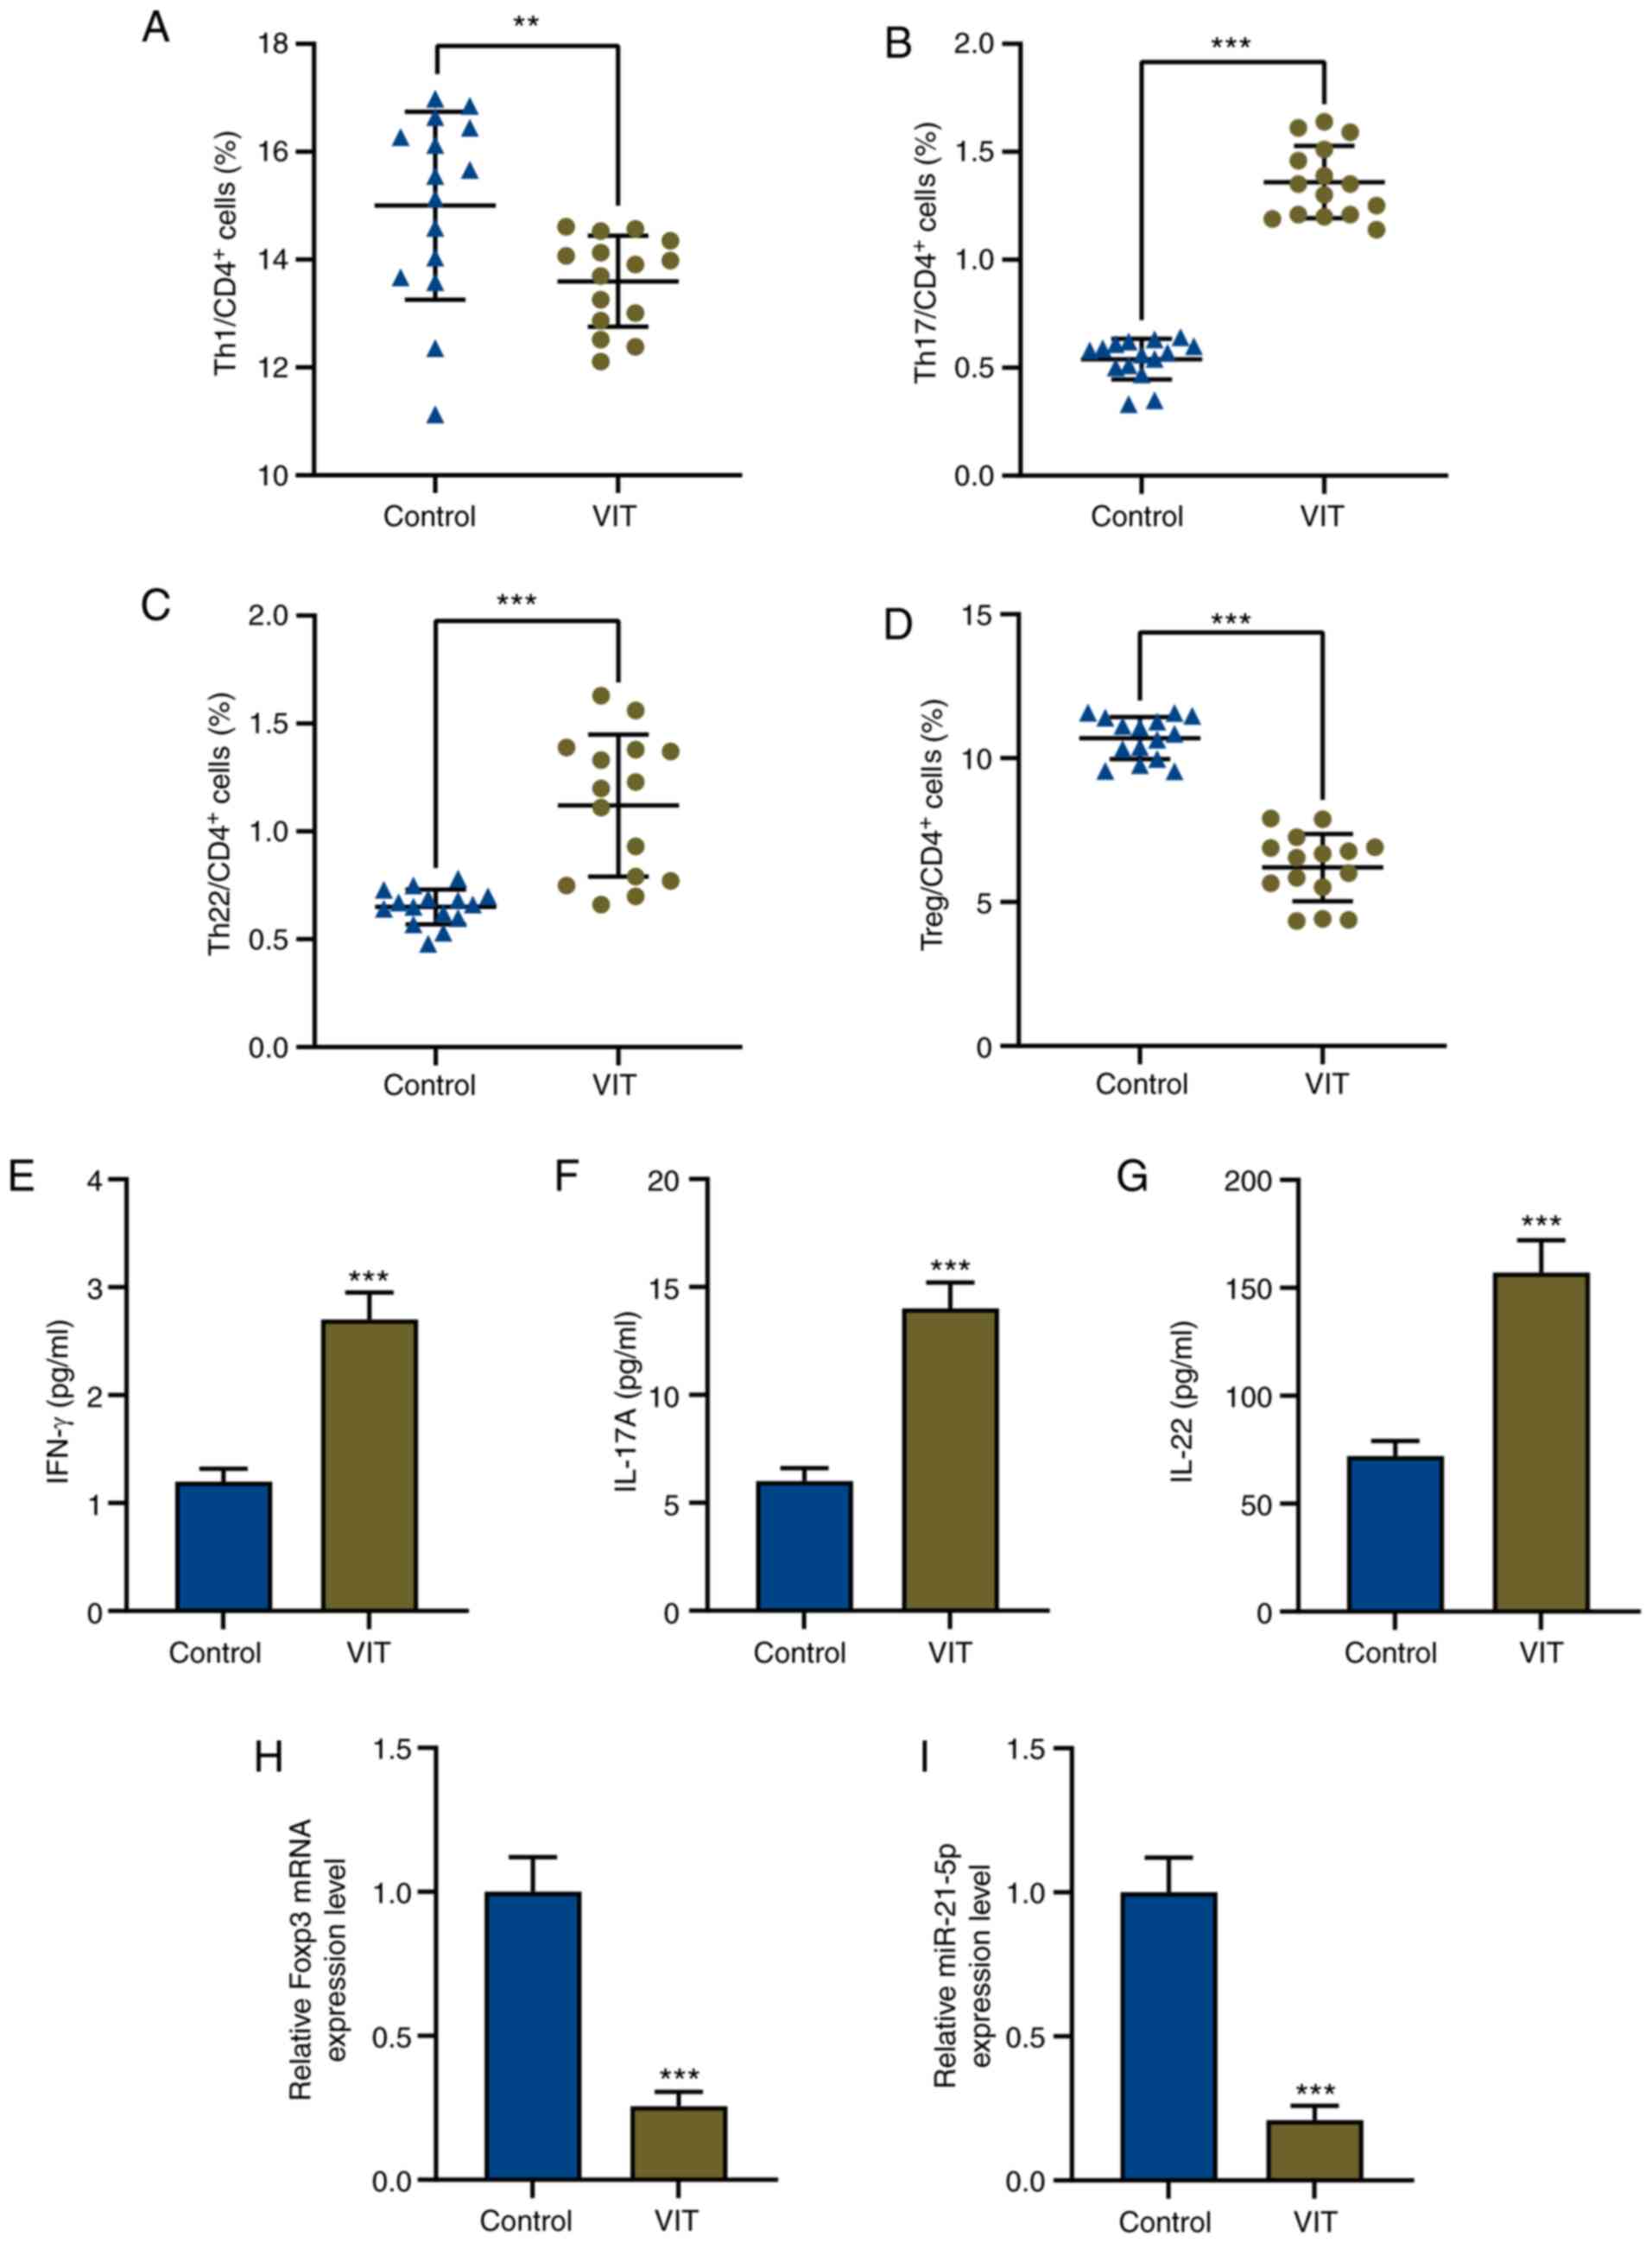 | Figure 1.Imbalance of T effector/Treg cells
and dysregulation of miR-21-5p in patients with VIT. Percentages of
(A) Th1, (B) Th17, (C) Th22 and (D) Treg cells in CD4+ T
cells of peripheral blood mononuclear cells in patients with VIT
and healthy controls (n=15 for each group) were measured via flow
cytometry. Protein levels of (E) IFN-γ, (F) IL-17A and (G) IL-22 in
the peripheral blood of patients with VIT and healthy controls were
measured via enzyme-linked immunosorbent assay. Relative expression
levels of (H) Foxp3 and (I) miR-21-5p in the peripheral blood of
patients with VIT and healthy controls were measured via reverse
transcription-quantitative PCR. GAPDH and U6 were used as the
internal controls, respectively. **P<0.01; ***P<0.001. VIT,
vitiligo; Th, T helper; IFN, interferon; IL, interleukin; miR,
microRNA; Treg cells, regulatory T cells. |
Expression levels of the Teff cell
cytokines IFN-γ, IL-17A and IL-22 are increased, while those of the
Treg cell cellular marker Foxp3 is decreased in patients with
VIT
To further explore why Treg cells were decreased but
Teff cells were increased in CD4+ T cells of patients
with VIT, the expression levels of the Teff cell cytokines IFN-γ,
IL-17A and IL-22, and those of the Treg cell marker Foxp3 were
determined using ELISA and RT-qPCR, respectively. The present
results indicated that the expression levels of the Teff cytokines
IFN-γ, IL-17A and IL-22 were increased, while Foxp3 expression was
decreased in PBMCs of patients with VIT compared with in those of
normal healthy controls (P<0.001; Fig. 1E-H).
STAT3 is a target of miR-21-5p, and
miR-21-5p expression is downregulated while STAT3 expression is
increased in patients with VIT
In order to investigate the role of miR-21-5p in
patients with VIT, miR-21-5p expression in PBMCs of patients with
VIT and normal healthy controls was detected by RT-qPCR. The
results revealed that miR-21-5p expression was significantly
decreased in patients with VIT compared with in normal healthy
controls (P<0.001; Fig. 1I).
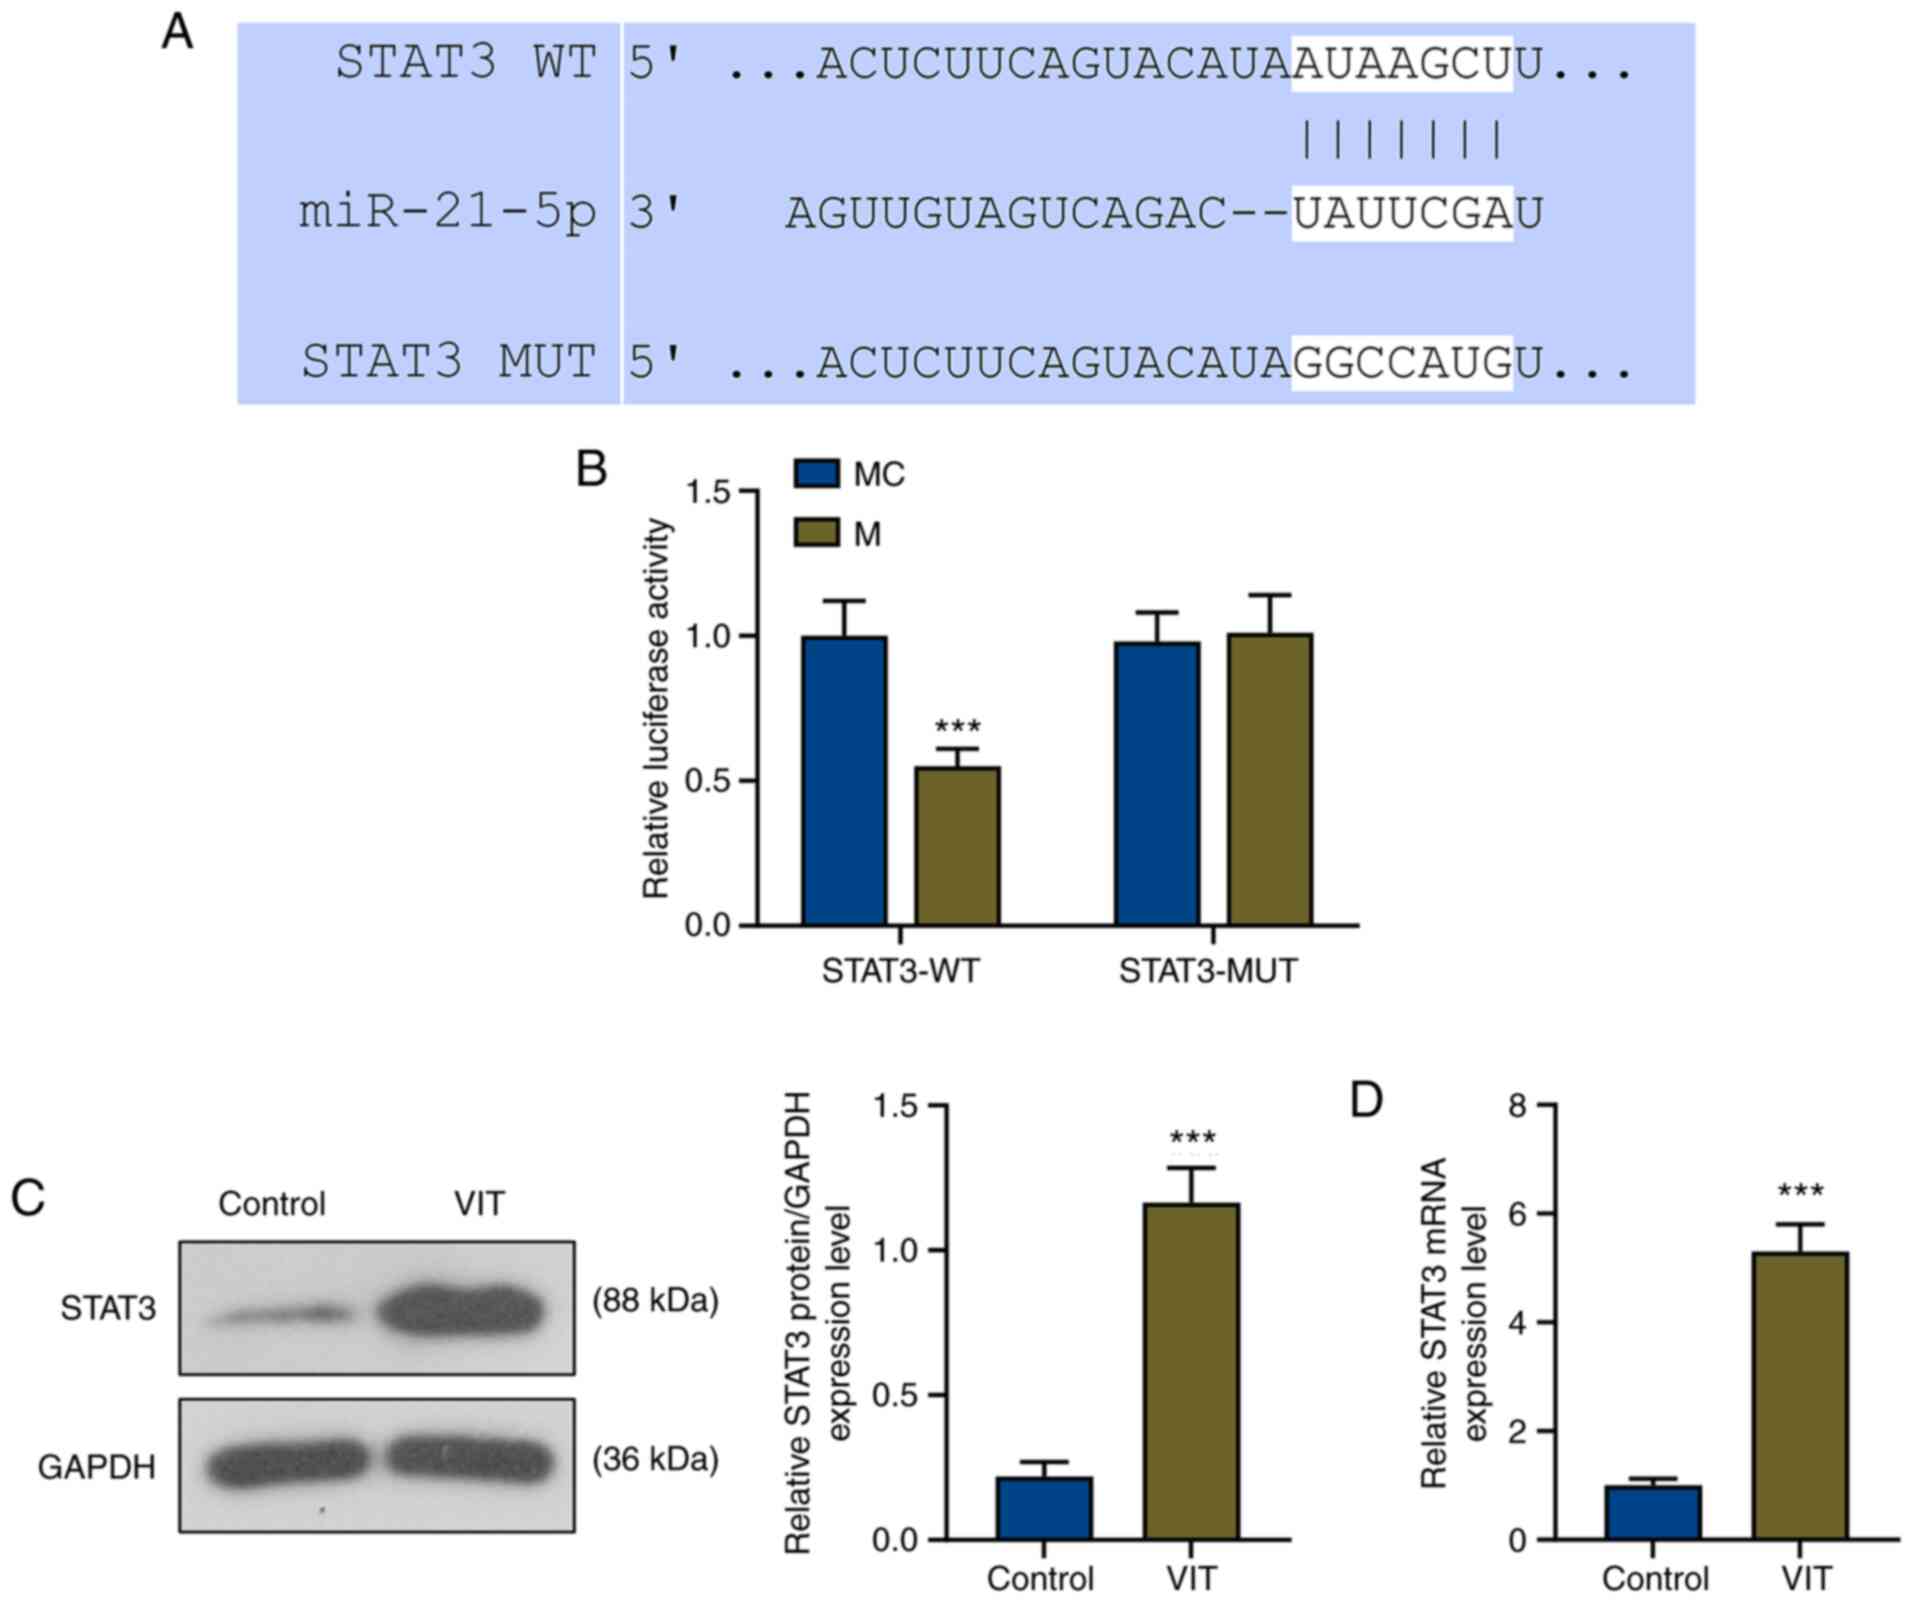
TargetScan successfully predicted that the target
gene of miR-21-5p was STAT3, and its conserved binding sites are
shown in Fig. 2A. To further
confirm that miR-21-5p could bind to STAT3, a Dual-Luciferase
reporter vector containing the STAT3 3′-UTR was built. The
Dual-Luciferase reporter assay demonstrated that the relative
luciferase activity of the STAT3-WT-mimic (STAT3-WT-M) group was
significantly decreased compared with that of the STAT3-WT-mimic
control (STAT3-WT-MC) group (P<0.001), while that of the
STAT3-MUT-M group was not affected compared with that of the
STAT3-MUT-MC group (Fig. 2B),
indicating that STAT3 was the target gene of miR-21-5p.
To determine the role of STAT3 in VIT, the protein
and mRNA levels of STAT3 were detected by western blot analysis and
RT-qPCR, respectively. As shown in Fig.
2C and D, the relative protein and mRNA levels of STAT3 in
patients with VIT were significantly increased compared with in the
control group (P<0.001).
miR-21-5p mimic increases miR-21-5p
expression but inhibits STAT3 expression
The association between miR-21-5p and STAT3 in
patients with VIT was studied via transfections using a miR-21-5p
mimic and STAT3 overexpression plasmids into CD4+ T
cells. The present results revealed that after miR-21-5p mimic
transfection (M+NC), miR-21-5p expression was significantly
increased compared with the MC+negative control (MC+NC) group
(P<0.001; Fig. 3A), while mRNA
and protein levels of STAT3 were significantly decreased
(P<0.001; Fig. 3B and C). STAT3
overexpression did not affect miR-21-5p expression levels, whereas
miR-21-5p mimic significantly decreased STAT3 expression levels
(Fig. 3A-C). In addition, mRNA and
protein levels of STAT3 in CD4+ T cells of patients with
VIT were significantly increased after STAT3 overexpression
(MC+STAT3; P<0.05 vs. MC+NC; Fig. 3B
and C); however, these were reversed by concomitant miR-21-5p
overexpression (M+STAT3; P<0.01 vs. MC+STAT3; P<0.001 vs.
M+NC; Fig. 3B and C).
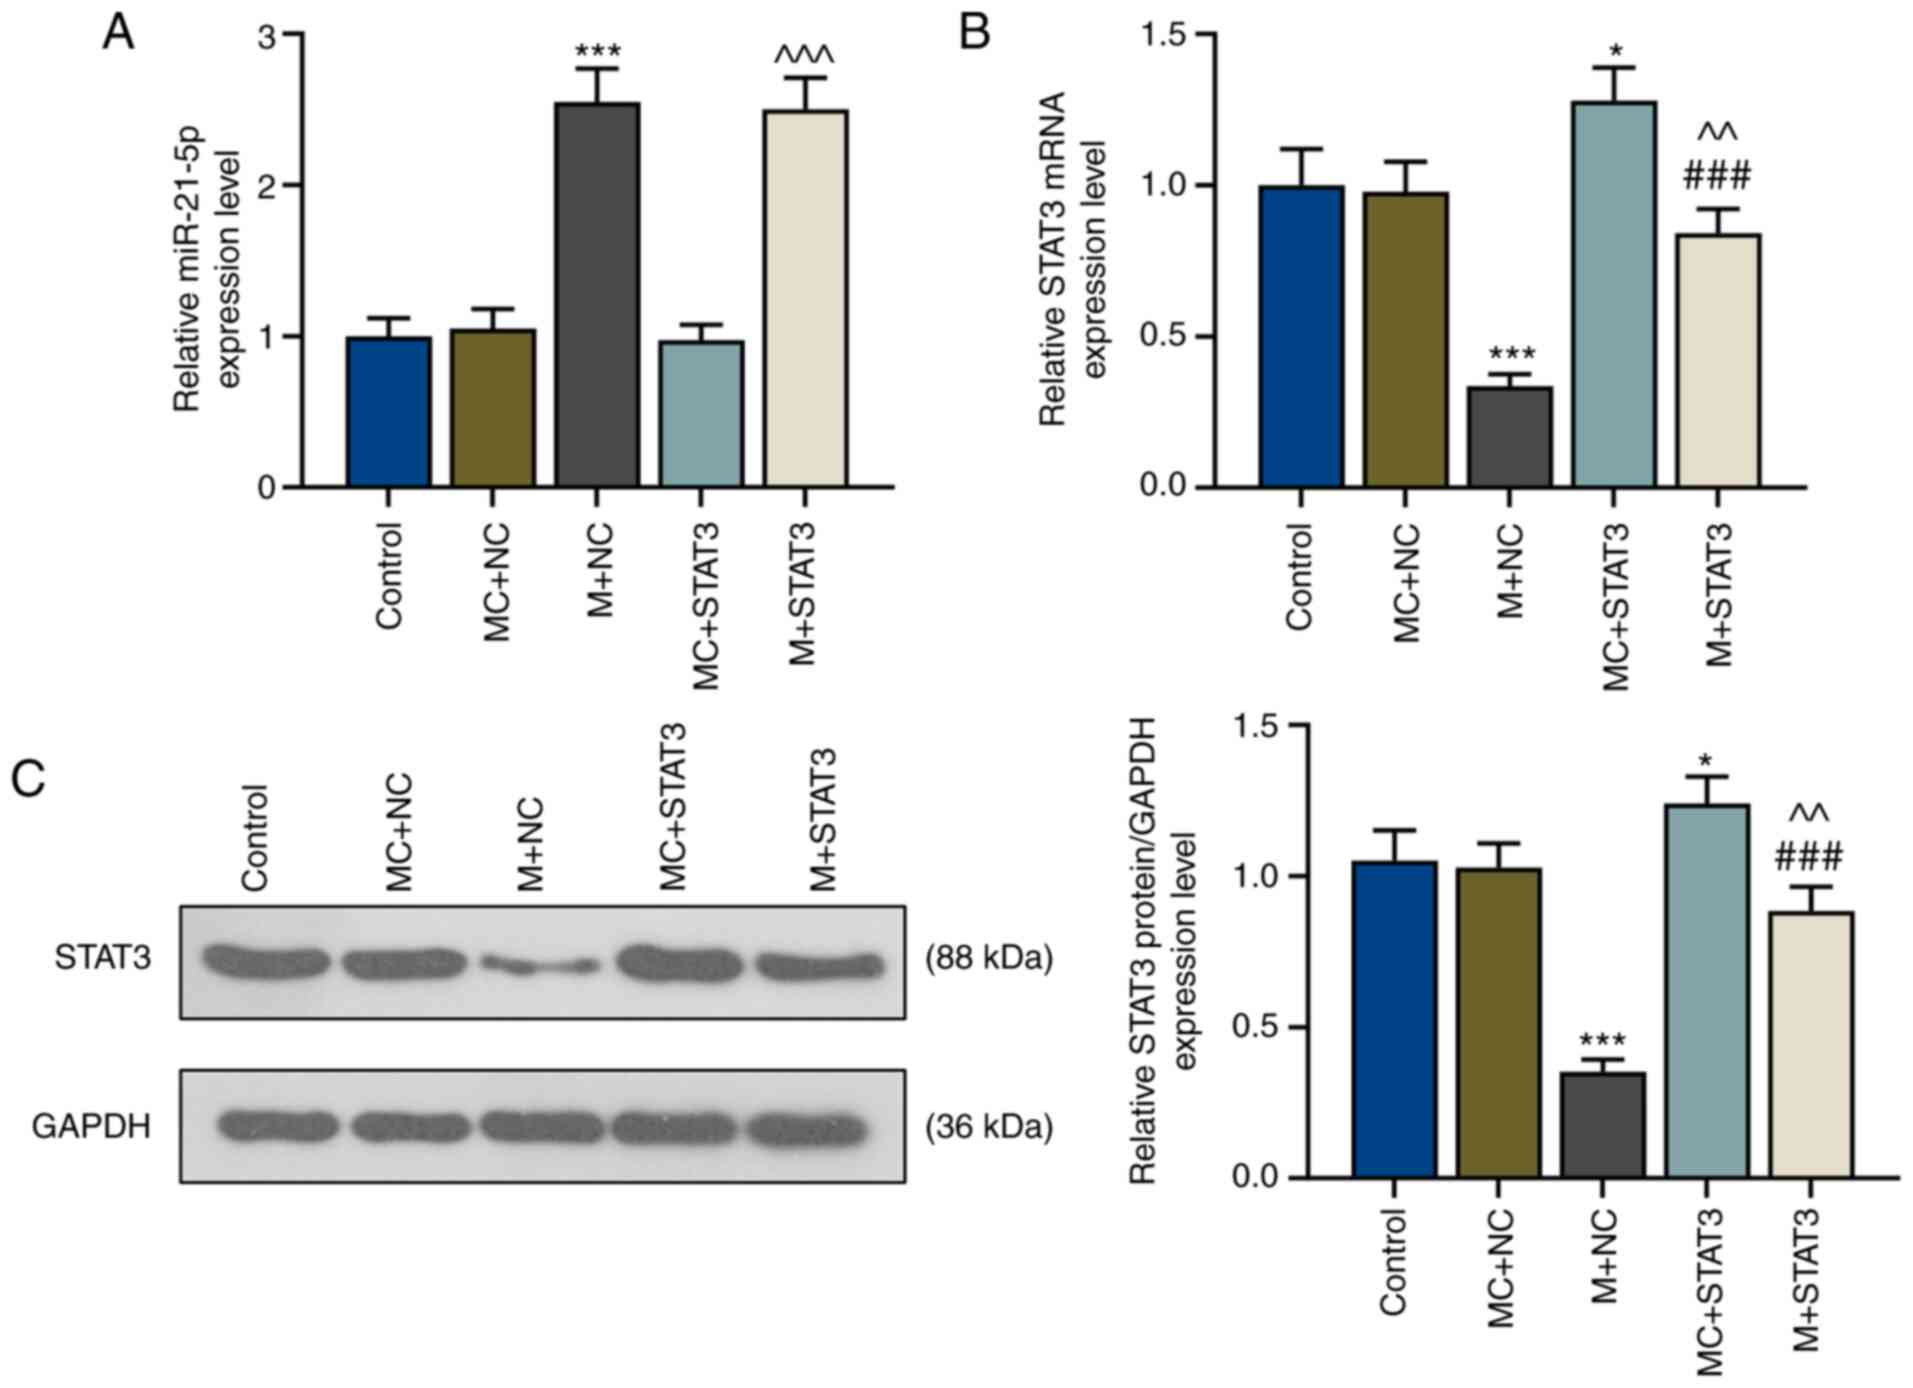 | Figure 3.miR-21-5p mimic inhibits STAT3
expression in T helper 17-polarized CD4+ T cells of
patients with vitiligo. (A) Relative expression levels of (A)
miR-21-5p and (B) STAT3 of the control, MC+NC, M+NC, MC+STAT3 and
M+STAT3 groups were measured via reverse transcription-quantitative
PCR. U6 and GAPDH were used as internal controls, respectively.
*P<0.05 and ***P<0.001 vs. MC+NC; ^^P<0.01 and
^^^P<0.001 vs. MC+STAT3; ###P<0.001 vs.
M+NC. (C) Relative STAT3 protein expression of the control, MC+NC,
M+NC, MC+STAT3 and M+STAT3 groups were measured via western blot
analysis. GAPDH was used as the internal control. *P<0.05 vs.
MC+NC; ***P<0.001 vs. MC+NC; ###P<0.001 vs. M+NC;
^^P<0.01 vs. MC+STAT3. miR, microRNA; M, miR-21-5p
mimic; MC, mimic control; NC, negative control. |
miR-21-5p overexpression increases the
proportion of Treg cells but decreases that of Teff cells by
reversing the effects of STAT3
To explore the effects of miR-21-5p and STAT3 on the
proportion of Treg/Teff cells in patients with VIT, miR-21-5p was
overexpressed in the Th17-polarized CD4+ T cells, and
the proportion of Treg and Teff (Th17 and Th22 cells) cell subsets
in CD4+ T cells was measured. Flow cytometry assays
demonstrated that after miR-21-5p overexpression, the proportion of
Teff cells (Th17 and Th22 cells) in CD4+ T cells was
decreased, but that of Treg cells was increased compared with the
MC+NC group (P<0.01; Fig. 4A-C).
STAT3 overexpression resulted in the opposite results, with
increased Teff cells and decreased Treg cells (P<0.01); however,
this was partially reversed by miR-21-5p overexpression (P<0.01
vs. MC+STAT3 and vs. M+NC; Fig.
4A-C).
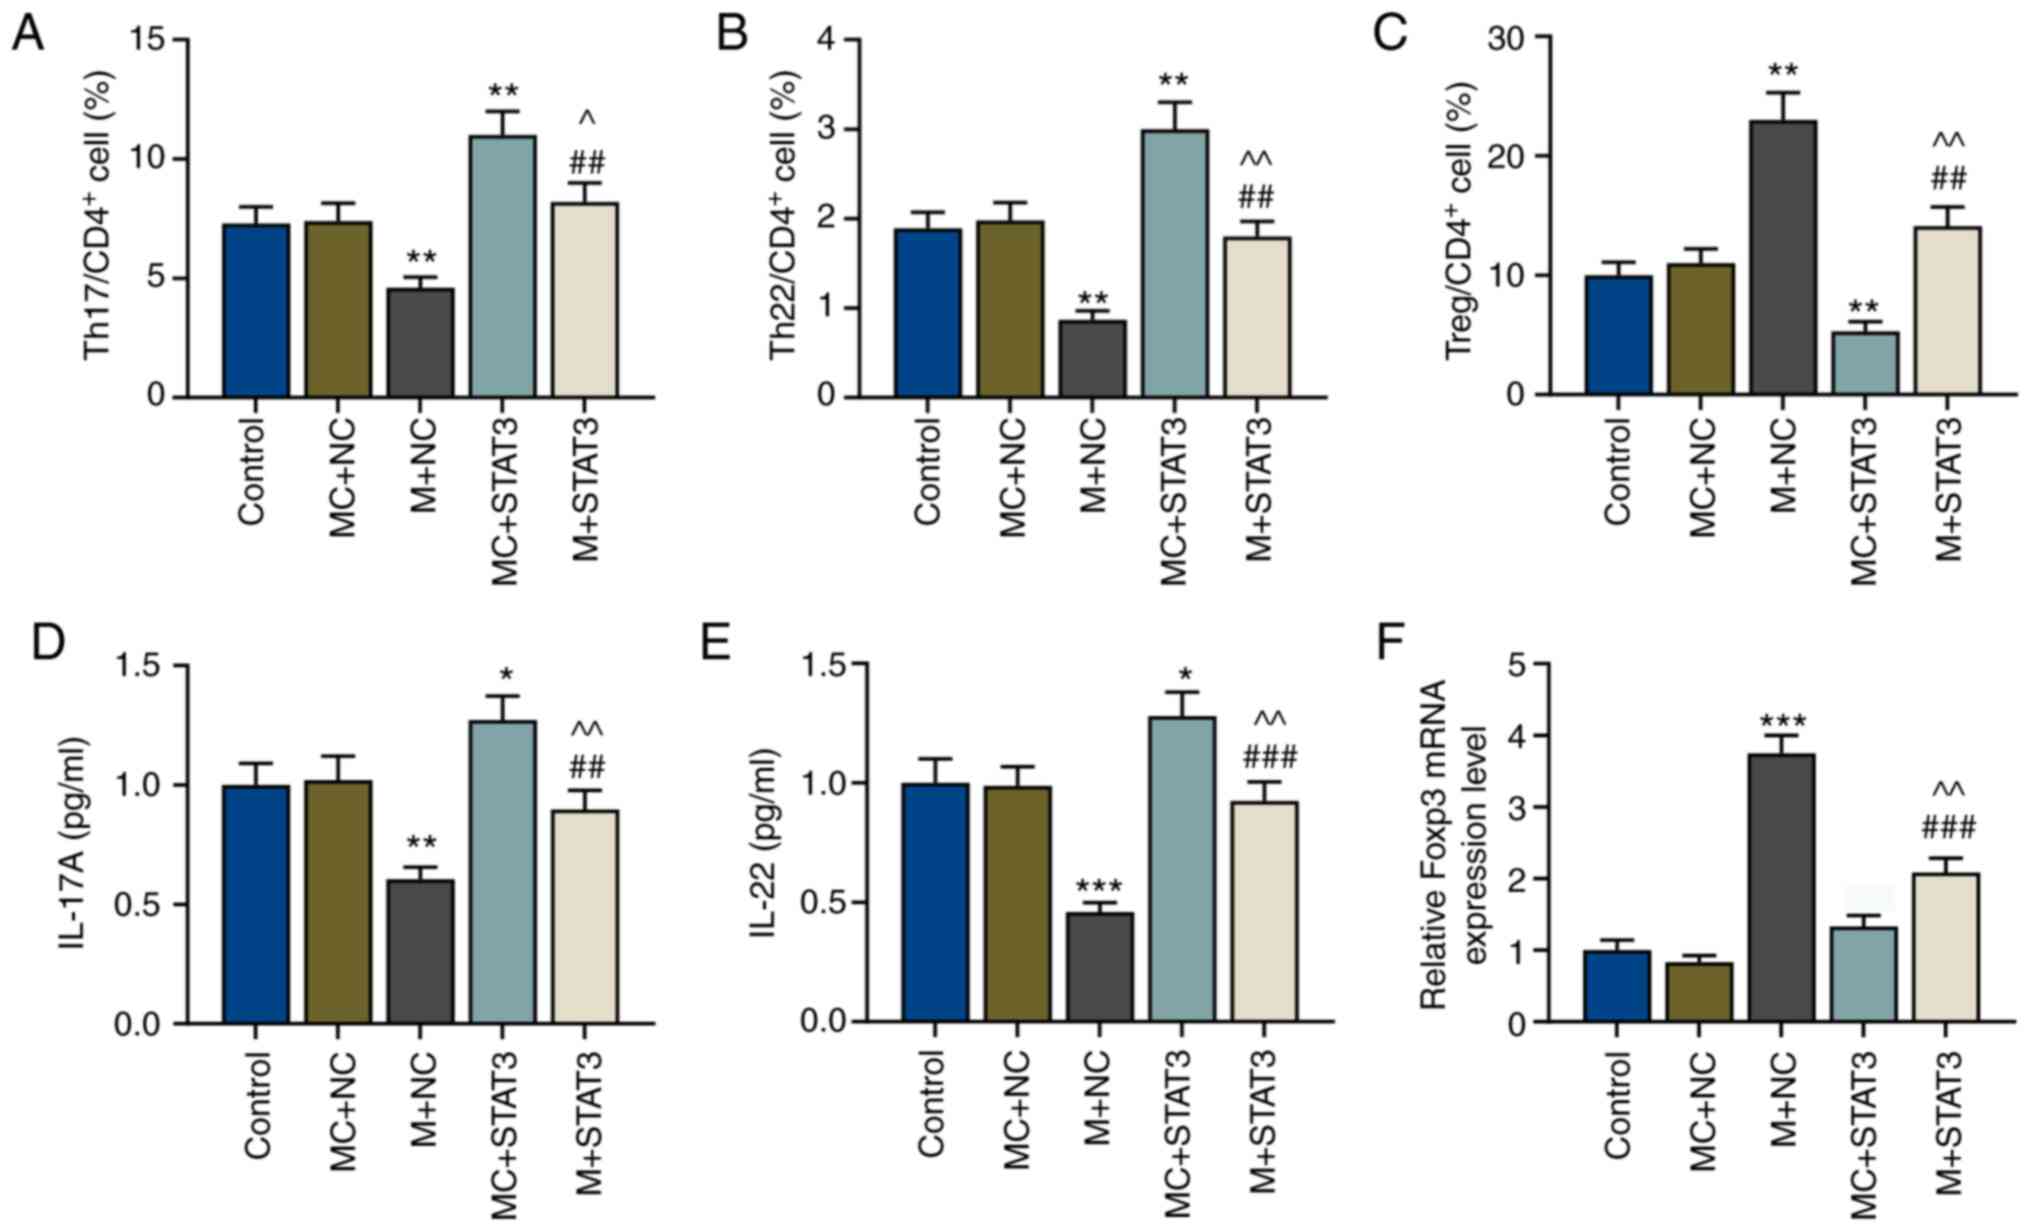 | Figure 4.miR-21-5p overexpression regulates T
effector/Treg cell balance via STAT3. Percentages of (A) Th17, (B)
Th22 and (C) Treg cells in CD4+ T cells of the control,
MC+NC, M+NC, MC+STAT3 and M+STAT3 groups were measured via flow
cytometry. Protein levels of (D) IL-17A and (E) IL-22 of T cells in
the control, MC+NC, M+NC, MC+STAT3 and M+STAT3 groups were measured
via enzyme-linked immunosorbent assay. (F) Relative Foxp3
expression in the control, MC+NC, M+NC, MC+STAT3 and M+STAT3 groups
were measured via reverse transcription-quantitative PCR. GAPDH was
used as the internal control. *P<0.05, **P<0.01 and
***P<0.001 vs. MC+NC; ^P<0.05 and
^^P<0.01 vs. MC+STAT3; ##P<0.01 and
###P<0.001 vs. M+NC. Th, T helper; IL, interleukin;
miR, microRNA; Treg cells, regulatory T cells; M, miR-21-5p mimic;
MC, mimic control; NC, negative control. |
miR-21-5p overexpression decreases the
expression levels of IL-17A and IL-22 cytokines in Teff cells but
increases Foxp3 expression in Treg cells by reversing the effects
of STAT3
Subsequently, expression levels of the Teff cell
cytokines IL-17A and IL-22, and those of the Treg cell marker Foxp3
in CD4+ T cells of patients with VIT and normal healthy
controls were detected via ELISA and RT-qPCR, respectively. The
present results revealed that IL-17A and IL-22 expression levels
were decreased, while Foxp3 expression was significantly increased
after miR-21-5p overexpression compared with the MC+NC group
(P<0.01 and P<0.001; Fig.
4D-F). However, after STAT3 overexpression, IL-17A and IL-22
expression levels were increased compared with the MC+NC group
(P<0.05; Fig. 4D-E).
Furthermore, miR-21-5p overexpression reversed the effects of STAT3
overexpression on the expression levels of Teff cell cytokines and
the Treg cell marker (P<0.01 vs. MC+STAT3; P<0.01 and
P<0.001 vs. M+NC; Fig.
4D-F).
miR-21-5p/STAT3 axis in Th17-polarized
CD4+ T cells regulates the apoptosis of melanocytes
In order to further determine the effects of the
miR-21-5p/STAT3 axis on Th17-polarized CD4+ T cells in
melanocytes protection, the apoptosis of melanocytes after
co-culture with pretreated CD4+ T cells was examined via
flow cytometry. It was observed that the apoptosis of melanocytes
was decreased by miR-21-5p overexpression in Th17-polarized
CD4+ T cells (P<0.001 vs. MC+NC), but increased after
STAT3 overexpression (P<0.05 vs. MC+NC), suggesting that STAT3
overexpression in CD4+ T cells could induce apoptosis of
melanocytes (Fig. 5A). In addition,
miR-21-5p overexpression in Th17-polarized CD4+ T cells
reversed the effects of STAT3 overexpression on the apoptosis of
melanocytes (P<0.01 vs. MC+STAT3; P<0.001 vs. M+NC; Fig. 5A).
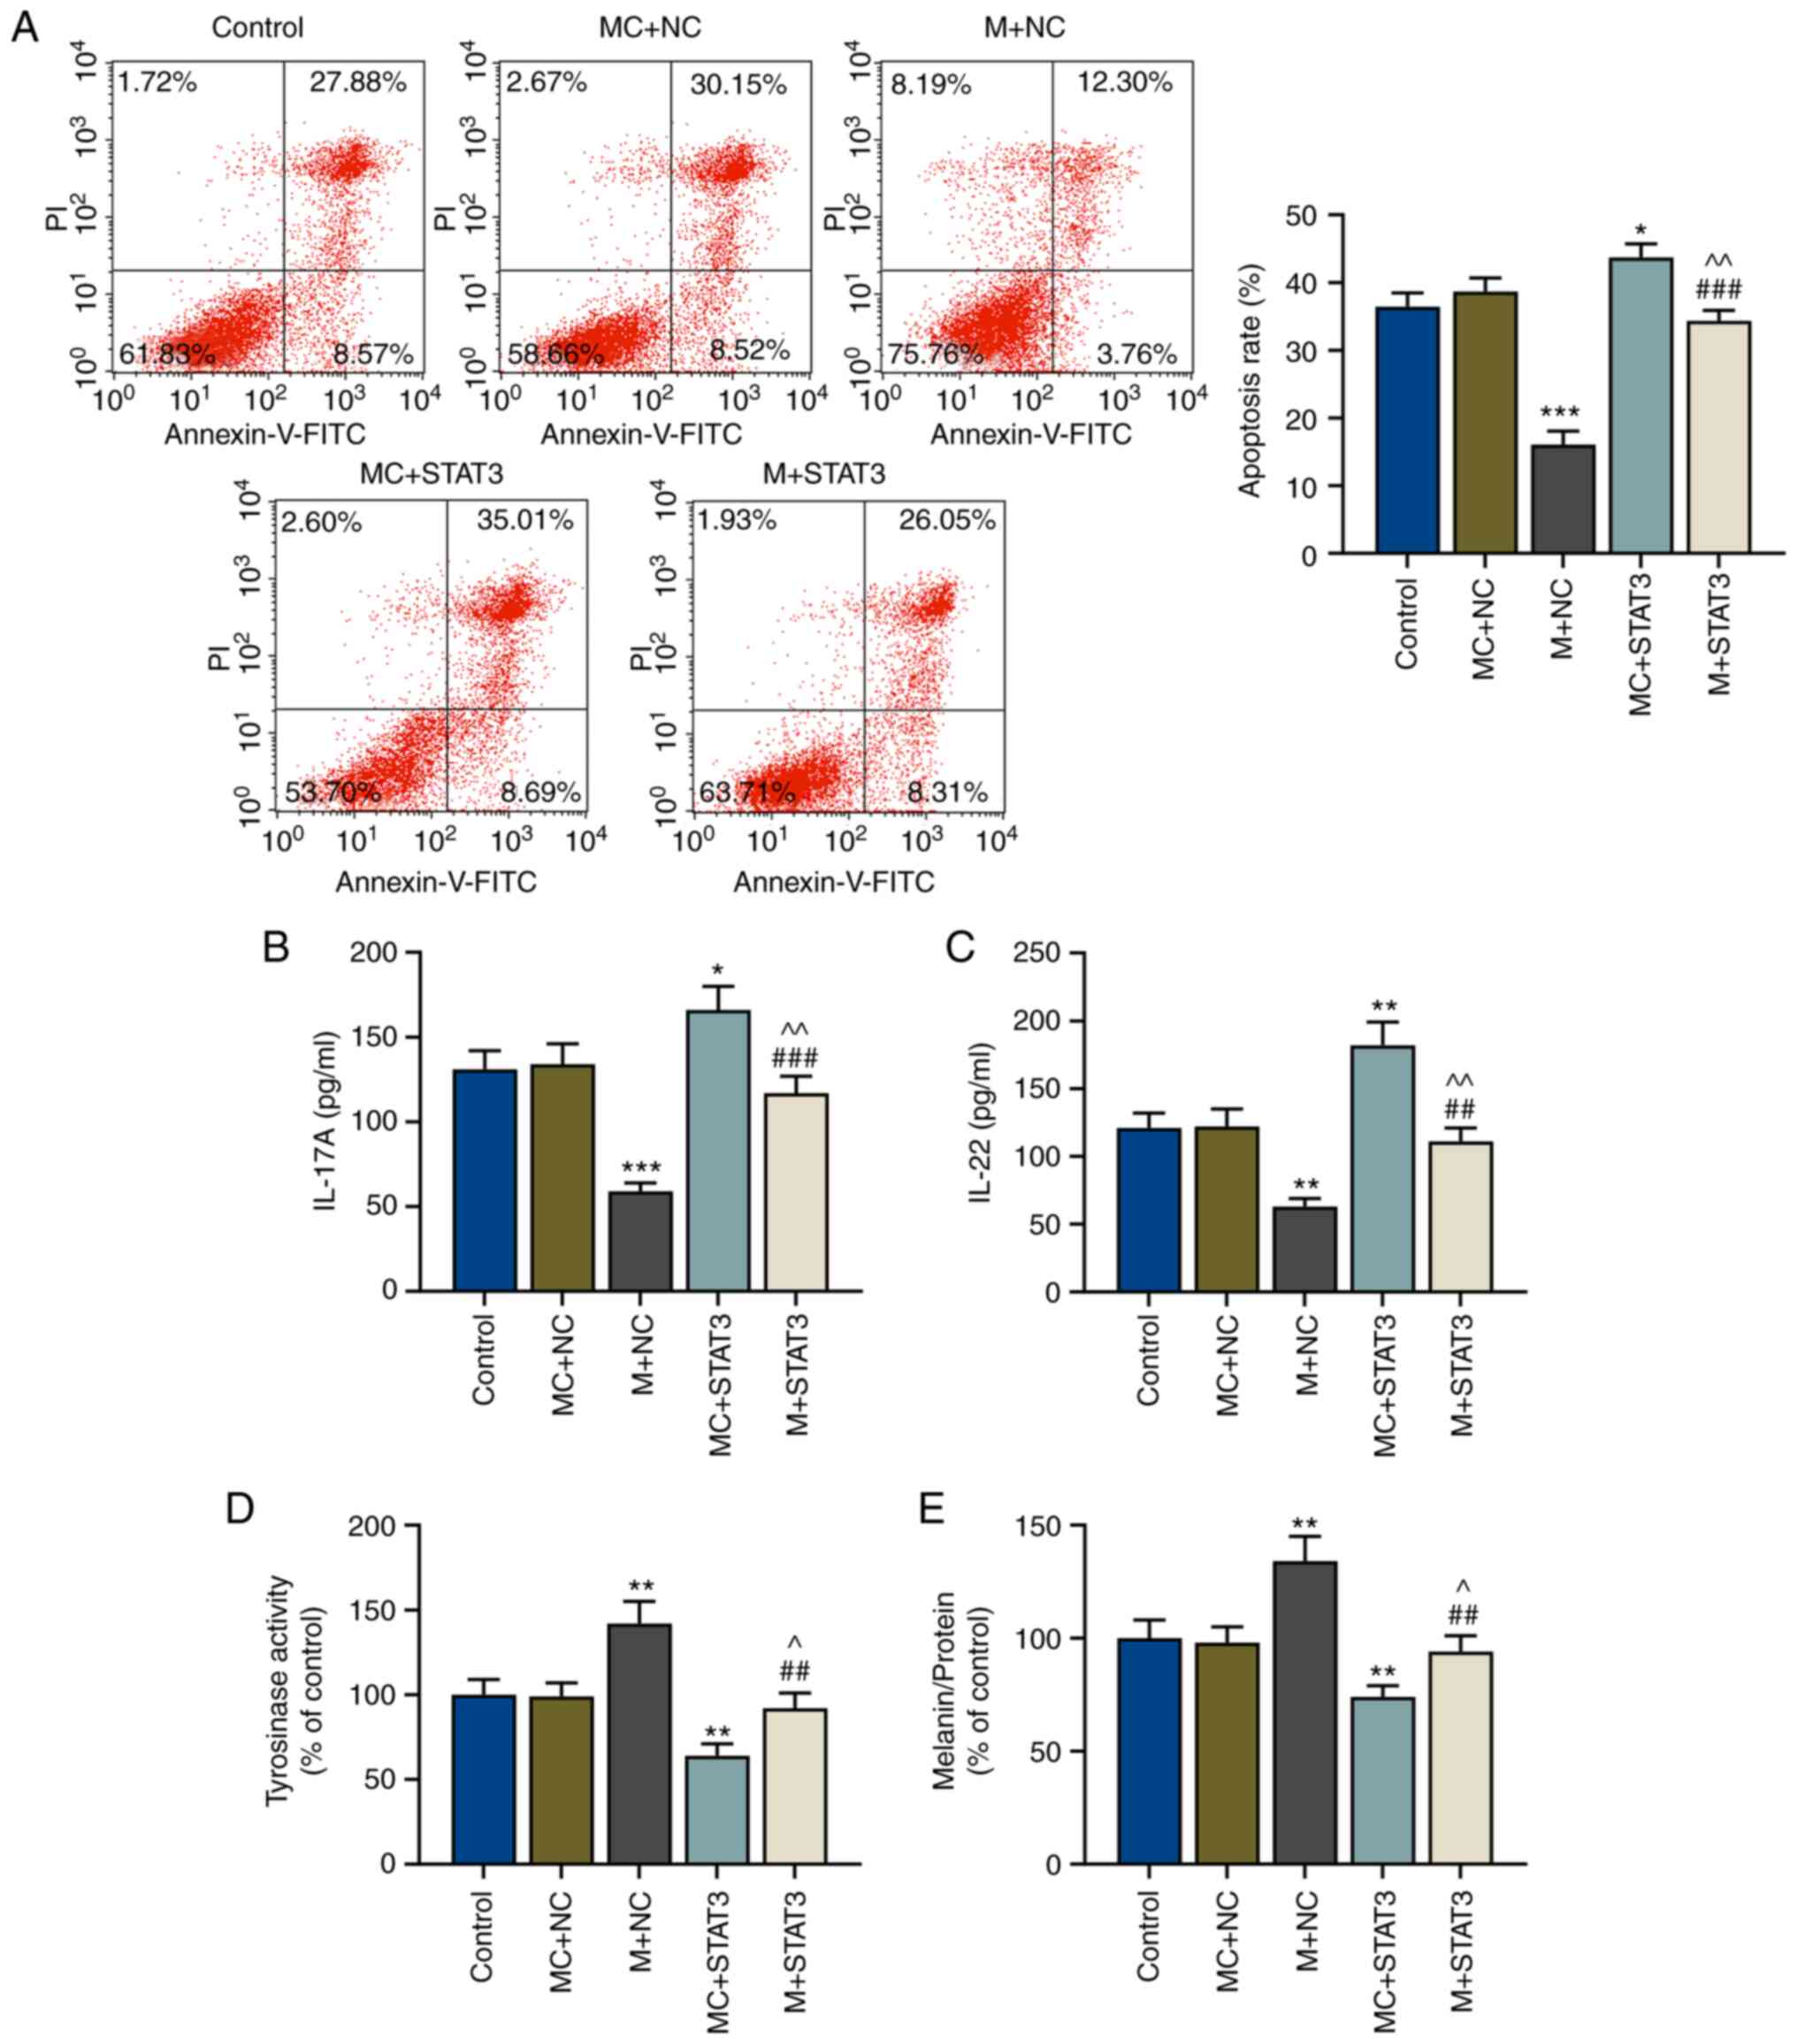 | Figure 5.miR-21-5p overexpression may protect
melanocytes via regulating T effector/regulatory T cell balance
through STAT3. (A) Apoptosis rates of melanocytes in the control,
MC+NC, M+NC, MC+STAT3 and M+STAT3 groups were measured via flow
cytometry. Protein levels of (B) IL-17A and (C) IL-22 in the lower
chamber of Transwell inserts after co-culture of melanocytes and
Th17-polarized CD4+ T cells in the control, MC+NC, M+NC,
MC+STAT3 and M+STAT3 groups was measured via enzyme-linked
immunosorbent assay. (D) Tyrosinase activity and (E) relative
melanin content in melanocytes in the control, MC+NC, M+NC,
MC+STAT3 and M+STAT3 groups were measured using a microplate
reader. *P<0.05, **P<0.01 and ***P<0.001 vs. MC+NC;
^P<0.05 and ^^P<0.01 vs. MC+STAT3;
##P<0.01 and ###P<0.001 vs. M+NC. Th, T
helper; IL, interleukin; miR, microRNA; M, miR-21-5p mimic; MC,
mimic control; NC, negative control. |
miR-21-5p/STAT3 axis in Th17-polarized
CD4+ T cells regulates the release of IL-17A and IL-22
cytokines
After co-culture of CD4+ T cells and
melanocytes, the levels of released cytokines (IL-17A and IL-22)
were measured via ELISA, and it was observed that after miR-21-5p
overexpression in Th17-polarized CD4+ T cells, the
expression levels of IL-17A and IL-22 in the lower chamber were
decreased compared with the MC+NC group (P<0.001 and P<0.01;
Fig. 5B and C, respectively);
however, these were reversed by STAT3 overexpression (P<0.05 and
P<0.01; Fig. 5B and C,
respectively). miR-21-5p overexpression in Th17-polarized
CD4+ T reversed the effects of STAT3 overexpression on
the release of IL-17A and IL-22 (P<0.01 vs. MC+STAT3; P<0.001
and P<0.01 vs. M+NC; Fig. 5B and
C, respectively).
miR-21-5p/STAT3 axis in
CD4+ T cells regulates tyrosinase activity and melanin
synthesis
The effects of the miR-21-5p/STAT3 axis in
CD4+ T cells on tyrosinase activity and melanin
synthesis of melanocytes were explored. Tyrosinase activity and
melanin content in melanocytes were detected using a microplate
reader. As shown in Fig. 5D and E,
tyrosinase activity and melanin content of melanocytes were
increased after miR-21-5p overexpression in Th17-polarized
CD4+ T (P<0.01 vs. MC+NC), but STAT3 overexpression
in Th17-polarized CD4+ T resulted in opposite results,
with both tyrosinase activity and melanin synthesis being decreased
compared with the MC+NC group (P<0.01) (Fig. 5D and E). Furthermore, miR-21-5p
overexpression in Th17-polarized CD4+ T cells reversed
the effects of STAT3 overexpression on tyrosinase activity and
melanin content of melanocytes (P<0.05 vs. MC+STAT3; P<0.01
vs. M+NC; Fig. 5D and E). Finally,
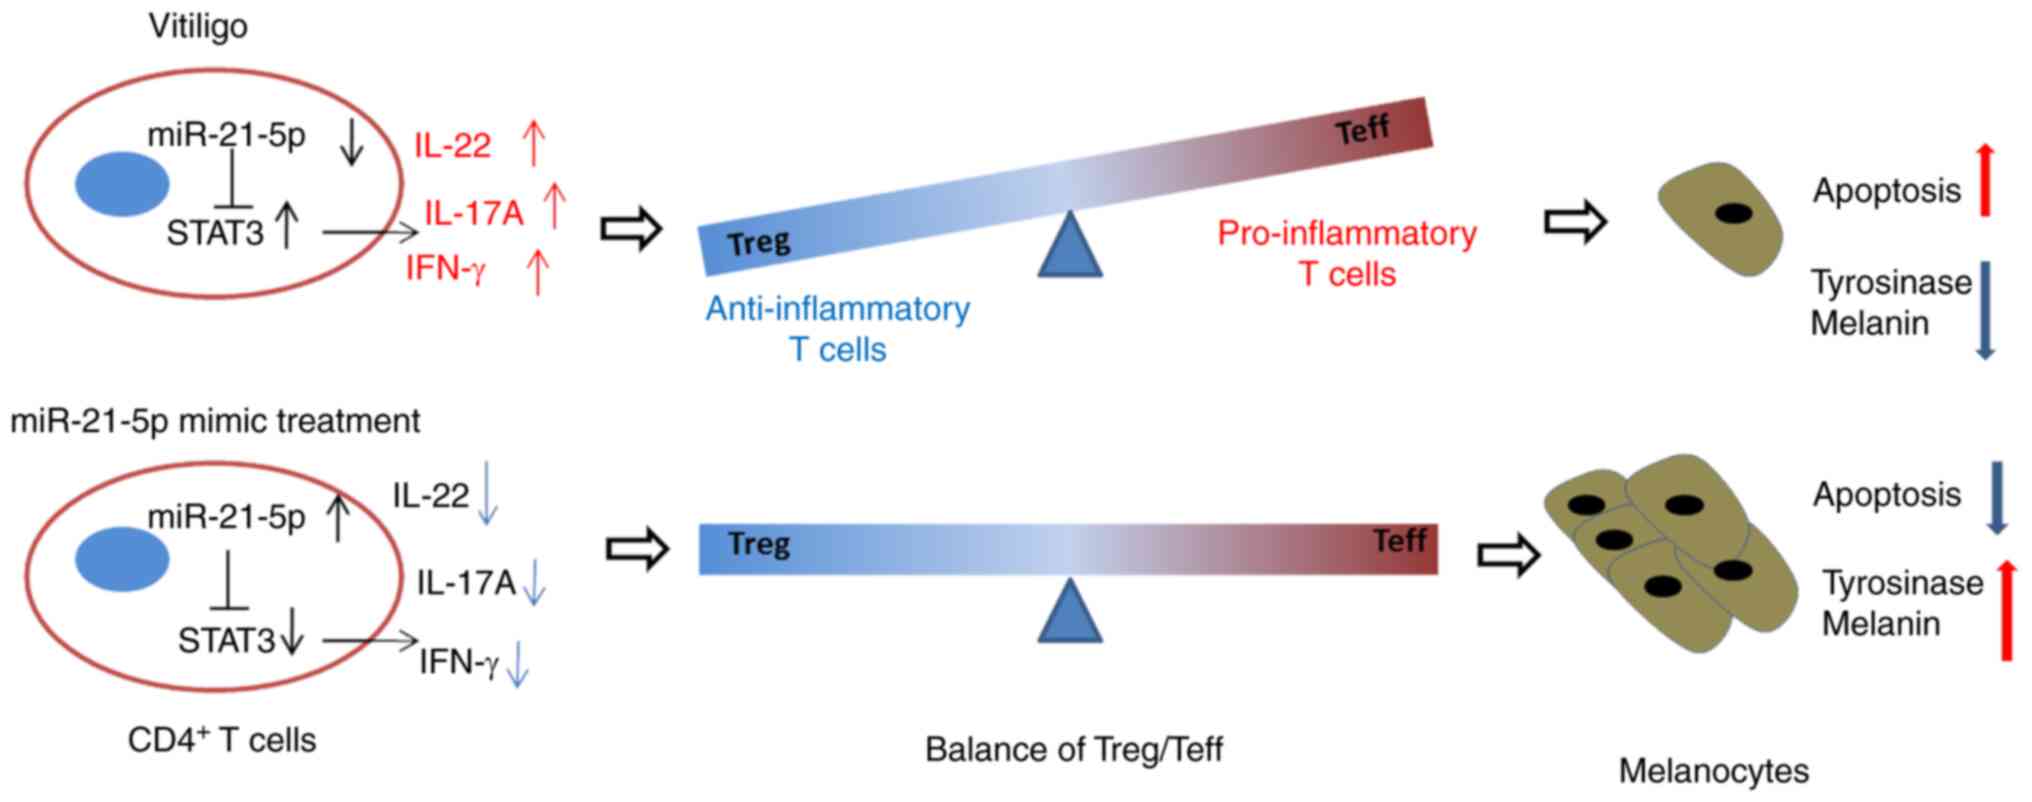
a potential mechanism has been constructed (Fig. 6), which indicated that miR-21-5p
protected melanocytes via targeting STAT3 and modulating the
Treg/Teff balance to alleviate VIT.
Discussion
The balance between Treg and Teff cells has been the
focus of the pathological examination of numerous autoimmune
disorders, such as uveitis, scleroderma and rheumatoid arthritis
(9,10,22).
Treg cells, which are a subset of T cells, serve a vital role in
peripheral immune tolerance maintenance (23), and Teff cells have the function of
regulating immunity and inflammation (9). Decreased activity of Treg cells
enhances the activity of Teff cells, particularly the activity of
Th17 cells (24). The present study
observed an imbalance between Treg and Teff cells in
CD4+ T cells in patients with VIT; specifically, the
proportion of Teff cells was increased but that of Treg cells was
decreased in CD4+ T cells of patients with VIT compared
with those of healthy controls, with the expression levels of the
Treg cellular marker Foxp3 being decreased and the secretion of
Teff cell cytokines (IFN-γ, IL-17A and IL-22) being increased. It
was noted that the proportion of Th22 cells in patients with VIT
had a higher SD compared with other T-cell subtypes; this high SD
may be due to individual differences among patients with VIT,
although there is currently no evidence to support this
hypothesis.
miRNAs regulate the balance of Treg/Teff cells
(25), consistent with the findings
of the present study, in which miR-21-5p expression in patients
with VIT was decreased compared with in healthy individuals.
Therefore, a miR-21-5p mimic was transfected into Th17-polarized
CD4+ T cells to overexpress miR-21-5p and study its
potential effects. The present data revealed that miR-21-5p
overexpression regulated the Treg/Teff balance in CD4+ T
cells, which was consistent with a previous study suggesting that
miR-21-5p may regulate Treg/Teff balance in CD4+ T cells
(15). Therefore, miR-21-5p may be
a potential regulator of Treg/Teff balance.
miRNAs target mRNAs to regulate their expression and
functions (26). A previous study
has demonstrated that STAT3 can bind to the promoter of the miR-21
gene and thereby enhances the expression levels of pre-miR-21 and
mature miR-21 in CD4+ T cells induced upon IL-21
stimulation in Sezary syndrome (27). Similar results have been observed in
cellular transformation in which STAT3 directly activates the
transcription of miR-21 (28). By
contrast, the present study indicated that miR-21-5p could regulate
STAT3 expression in CD4+ T cells. Therefore, it is
inferred that a feedback loop may exist between STAT3 and miR-21 in
CD4+ T cells, which should be further explored in future
studies.
STAT3 may be modulated by arsenic trioxide in
treatment-naïve patients with rheumatoid arthritis and may improve
the Treg/Teff balance (29). STAT3
has been detected in VIT pathogenesis (30), but the association between STAT3
modulation and Treg/Teff balance in VIT is less explored. The
present study demonstrated that STAT3 was the target of miR-21-5p
and that its expression in patients with VIT was increased compared
with in normal controls, causing an imbalance between Treg and Teff
cells; however, this effect was reversed by miR-21-5p
overexpression. Nevertheless, the mechanism through which
miR-21-5p/STAT3 regulates the Treg/Teff balance in CD4+
T cells requires further elucidation.
Melanocytes serve an important role in VIT
pathogenesis, and interaction between intrinsic and extrinsic
melanocyte defects may be a key factor causing the onset of VIT
(31). Therefore, protection of
melanocytes may be a possible clinical method for VIT treatment.
Zhou et al (32) revealed
that IL-10 may contribute to the survival of primary melanocytes
via the activation of the STAT3 and PI3K/Akt/NF-кB signaling
pathways. The present study demonstrated that miR-21-5p
overexpression indirectly ensured the survival of melanocytes with
increasing tyrosinase activity and melanin synthesis via regulating
the Treg/Teff balance, and that the effect of miR-21-5p
overexpression was reversed by overexpression of its target gene,
STAT3.
Additionally, it should be noted that there are some
limitations in the present study, such as that only cellular assays
were performed and that the analysis of CD4+ T cells
from patients with VIT were preliminary. Therefore, more
comprehensive experiments are required to confirm the effects of
miR-21-5p in the development and progression of VIT using an animal
model.
In conclusion, the present study identified a
potential novel role for miR-21-5p in patients with VIT involving
the protection of melanocytes via regulating the Treg/Teff balance.
During this process, STAT3 may be a crucial target gene. Therefore,
miR-21-5p may be used as a potential therapeutic target for
treating VIT.
Acknowledgements
Not applicable.
Funding
No funding was received.
Availability of data and materials
The datasets generated and/or analyzed during the
current study are available from the corresponding author on
reasonable request.
Authors' contributions
JH substantially contributed to the conception and
design of the present study. TL, FL, XS and XH were involved in the
data acquisition, analysis and interpretation, and in drafting and
critically revising the manuscript for important intellectual
content. All authors have read and approved the final
manuscript.
Ethics approval and consent to
participate
All experiments performed in the present study
involving human participants were in accordance with the ethical
standards of the institutional and/or national research committee
and with the 1964 Declaration of Helsinki and its later amendments
or comparable ethical standards. The present study was approved by
the Ethics Committee of Dezhou People's Hospital (approval no.
PFK20181006; Dezhou, China). All participants provided written
informed consent.
Patient consent for publication
Not applicable.
Competing interests
The authors declare that they have no competing
interests.
References
|
1
|
Ezzedine K, Eleftheriadou V, Whitton M and
van Geel N: Vitiligo. Lancet. 386:74–84. 2015. View Article : Google Scholar : PubMed/NCBI
|
|
2
|
Lai YC, Yew YW, Kennedy C and Schwartz RA:
Vitiligo and depression: A systematic review and meta-analysis of
observational studies. Br J Dermatol. 177:708–718. 2017. View Article : Google Scholar : PubMed/NCBI
|
|
3
|
Xie H, Zhou F, Liu L, Zhu G, Li Q, Li C
and Gao T: Vitiligo: How do oxidative stress-induced autoantigens
trigger autoimmunity? J Dermatolo Sci. 81:3–9. 2016. View Article : Google Scholar
|
|
4
|
Lv M, Li Z, Liu J, Lin F, Zhang Q, Li Z,
Wang Y, Wang K and Xu Y: MicroRNA155 inhibits the proliferation of
CD8+ T cells via upregulating regulatory T cells in
vitiligo. Mol Med Rep. 20:3617–3624. 2019.PubMed/NCBI
|
|
5
|
Lin JY and Fisher DE: Melanocyte biology
and skin pigmentation. Nature. 445:843–850. 2007. View Article : Google Scholar : PubMed/NCBI
|
|
6
|
Patel S, Rauf A, Khan H, Meher BR and
Hassan SSU: A holistic review on the autoimmune disease vitiligo
with emphasis on the causal factors. Biomed Pharmacother.
92:501–508. 2017. View Article : Google Scholar : PubMed/NCBI
|
|
7
|
Frisoli ML and Harris JE: Vitiligo:
Mechanistic insights lead to novel treatments. J Allergy Clin
Immunol. 140:654–662. 2017. View Article : Google Scholar : PubMed/NCBI
|
|
8
|
Sabat R, Wolk K, Loyal L, Docke WD and
Ghoreschi K: T cell pathology in skin inflammation. Semin
Immunopathol. 41:359–377. 2019. View Article : Google Scholar : PubMed/NCBI
|
|
9
|
Zhu W, Chen X, Yu J, Xiao Y, Li Y, Wan S,
Su W and Liang D: Baicalin modulates the Treg/Teff balance to
alleviate uveitis by activating the aryl hydrocarbon receptor.
Biochem Pharmacol. 154:18–27. 2018. View Article : Google Scholar : PubMed/NCBI
|
|
10
|
Wang Y, Zhang S, Liang Z, Feng M, Zhao X,
Qin K, Gao C, Li X, Guo H and Luo J: Metformin attenuates
bleomycin-induced scleroderma by regulating the balance of
Treg/Teff cells and reducing spleen germinal center formation. Mol
Immunol. 114:72–80. 2019. View Article : Google Scholar : PubMed/NCBI
|
|
11
|
Kalekar LA and Rosenblum MD: Regulatory T
cells in inflammatory skin disease: From mice to humans. Int
Immunol. 31:457–463. 2019. View Article : Google Scholar : PubMed/NCBI
|
|
12
|
De Santis G, Ferracin M, Biondani A,
Caniatti L, Rosaria Tola M, Castellazzi M, Zagatti B, Battistini L,
Borsellino G, Fainardi E, et al: Altered miRNA expression in T
regulatory cells in course of multiple sclerosis. J Neuroimmunol.
226:165–171. 2010. View Article : Google Scholar : PubMed/NCBI
|
|
13
|
Mansuri MS, Singh M and Begum R: miRNA
signatures and transcriptional regulation of their target genes in
vitiligo. J Dermatol Sci. 84:50–58. 2016. View Article : Google Scholar : PubMed/NCBI
|
|
14
|
Yan S, Shi J, Sun D and Lyu L: Current
insight into the roles of microRNA in vitiligo. Mol Biol Rep.
47:3211–3219. 2020. View Article : Google Scholar : PubMed/NCBI
|
|
15
|
Zheng X, Dong L, Wang K, Zou H, Zhao S,
Wang Y and Wang G: MiR-21 participates in the PD-1/PD-L1
pathway-mediated imbalance of Th17/Treg cells in patients after
gastric cancer resection. Ann Surg Oncol. 26:884–893. 2019.
View Article : Google Scholar : PubMed/NCBI
|
|
16
|
Dong L, Wang X, Tan J, Li H, Qian W, Chen
J, Chen Q, Wang J, Xu W, Tao C and Wang S: Decreased expression of
microRNA-21 correlates with the imbalance of Th17 and Treg cells in
patients with rheumatoid arthritis. J Cell Mol Med. 18:2213–2224.
2014. View Article : Google Scholar : PubMed/NCBI
|
|
17
|
Rouas R, Fayyad-Kazan H, El Zein N,
Lewalle P, Rothé F, Simion A, Akl H, Mourtada M, El Rifai M, Burny
A, et al: Human natural Treg microRNA signature: Role of
microRNA-31 and microRNA-21 in FOXP3 expression. Eur J Immunol.
39:1608–1618. 2009. View Article : Google Scholar : PubMed/NCBI
|
|
18
|
Tscherner A, Brown AC, Stalker L, Kao J,
Dufort I, Sirard MA and LaMarre J: STAT3 signaling stimulates
miR-21 expression in bovine cumulus cells during in vitro oocyte
maturation. Sci Rep. 8:115272018. View Article : Google Scholar : PubMed/NCBI
|
|
19
|
Fuss IJ, Kanof ME, Smith PD and Zola H:
Isolation of whole mononuclear cells from peripheral blood and cord
blood. Curr Protoc Immunol Chapter. 7:Unit7.1. 2009.
|
|
20
|
Livak KJ and Schmittgen TD: Analysis of
relative gene expression data using real-time quantitative PCR and
the 2(-Delta Delta C(T)) method. Methods. 25:402–408. 2001.
View Article : Google Scholar : PubMed/NCBI
|
|
21
|
Banerjee K, Pru C, Pru JK and Resat H:
STAT3 knockdown induces tumor formation by MDA-MB-231 cells. Clin
Oncol Res. 1:10.31487/j.COR.2018.10.002. 2018.PubMed/NCBI
|
|
22
|
Huang Z, Yang B, Shi Y, Cai B, Li Y, Feng
W, Fu Y, Luo L and Wang L: Anti-TNF-α therapy improves Treg and
suppresses Teff in patients with rheumatoid arthritis. Cell
Immunol. 279:25–29. 2012. View Article : Google Scholar : PubMed/NCBI
|
|
23
|
Yang WY, Shao Y, Lopez-Pastrana J, Mai J,
Wang H and Yang XF: Pathological conditions re-shape physiological
tregs into pathological tregs. Burns Trauma. 3:12015. View Article : Google Scholar : PubMed/NCBI
|
|
24
|
Saini C, Siddiqui A, Ramesh V and Nath I:
Leprosy reactions show increased Th17 cell activity and reduced
FOXP3+ Tregs with concomitant decrease in TGF-β and
increase in IL-6. PLoS Negl Trop Dis. 10:e00045922016. View Article : Google Scholar : PubMed/NCBI
|
|
25
|
Liu C, Yang H, Shi W, Wang T and Ruan Q:
MicroRNA-mediated regulation of T helper type 17/regulatory T-cell
balance in autoimmune disease. Immunology. 155:427–434. 2018.
View Article : Google Scholar : PubMed/NCBI
|
|
26
|
Catalanotto C, Cogoni C and Zardo G:
MicroRNA in control of gene expression: An overview of nuclear
functions. Int J Mol Sci. 17:17122016. View Article : Google Scholar
|
|
27
|
van der Fits L, van Kester MS, Qin Y,
Out-Luiting JJ, Smit F, Zoutman WH, Willemze R, Tensen CP and
Vermeer MH: MicroRNA-21 expression in CD4+ T cells is
regulated by STAT3 and is pathologically involved in Sezary
syndrome. J Invest Dermatol. 131:762–768. 2011. View Article : Google Scholar : PubMed/NCBI
|
|
28
|
Iliopoulos D, Jaeger SA, Hirsch HA, Bulyk
ML and Struhl K: STAT3 activation of miR-21 and miR-181b-1 via PTEN
and CYLD are part of the epigenetic switch linking inflammation to
cancer. Mol Cell. 39:493–506. 2010. View Article : Google Scholar : PubMed/NCBI
|
|
29
|
Almasi-Nasrabadi M, Amoli MM, Robati RM,
Rajabi F, Ghalamkarpour F and Gauthier Y: CDH1 and DDR1 common
variants confer risk to vitiligo and autoimmune comorbidities.
Gene. 700:17–22. 2019. View Article : Google Scholar : PubMed/NCBI
|
|
30
|
Samaka RM, Basha MA and Menesy D: Role of
Janus kinase 1 and signal transducer and activator of transcription
3 in vitiligo. Clin Cosmet Investig Dermatol. 12:469–480. 2019.
View Article : Google Scholar : PubMed/NCBI
|
|
31
|
Rashighi M and Harris JE: Vitiligo
pathogenesis and emerging treatments. Dermatol Clin. 35:257–265.
2017. View Article : Google Scholar : PubMed/NCBI
|
|
32
|
Zhou J, Ling J, Song J, Wang Y, Feng B and
Ping F: Interleukin 10 protects primary melanocyte by activation of
Stat-3 and PI3K/Akt/NF-κB signaling pathways. Cytokine. 83:275–281.
2016. View Article : Google Scholar : PubMed/NCBI
|