Introduction
Renal cell carcinoma (RCC) accounts for 2–3% of all
adult malignancies, and the most common subtype of RCC is clear
cell RCC (ccRCC) (1). Moreover,
~20–30% of patients have locally advanced or metastatic disease at
the time of diagnosis, and about 20–30% of patients with localized
disease who are treated eventually relapse (2,3).
Although several targeted therapies have been approved for the
treatment of advanced or metastatic RCC, these treatments are
associated with limited overall survival (OS) if resistance to
therapy occurs (4,5). Thus, validated biomarkers for
diagnosis, prognosis, and disease monitoring during therapy, as
well as potential therapeutic targets are urgently needed.
In our previous study on tumor-specific changes in
the proteome of ccRCC, macrophage-capping protein (CapG) was
differentially expressed in ccRCC, compared with paired healthy
tissue (6). CapG is an
actin-binding protein of the gelsolin superfamily that serves a
crucial role for the organization of the actin cytoskeleton
(7). Although CapG only contains
three gelsolin-like domains and can bind and cap actin filaments in
the presence of calcium, it does not sever filaments (8). Previous studies have confirmed that
CapG expression is elevated in several types of cancer, such as
pancreatic cancer (9) and breast
cancer (10). High CapG expression
is associated with tumor progression and metastasis in gastric
cancer (11). However, the
expression pattern and function of CapG in ccRCC remain to be
investigated.
Therefore, the aim of this study was to evaluate the
expression levels of CapG in ccRCC and adjacent normal tissue and
to determine whether CapG expression was associated with
clinicopathological characteristics and OS. In addition, the
function of CapG was also examined in ccRCC cell lines.
Materials and methods
Patients and tissue samples
Matched ccRCC and normal tissue samples were
obtained from 24 patients with ccRCC at the Department of Urology,
Southern Medical University Nanfang Hospital, between February 2010
and July 2010. The patients included 15 males and 9 females aged
41–73 years (median, 58 years). Tissue samples were frozen in
liquid nitrogen within 20 min after surgery and stored in liquid
nitrogen until use. All tissue samples were examined by certified
pathologists at the hospital. In addition, 152 paraffin-embedded
specimens of ccRCC and 40 specimens of adjacent normal tissue were
collected between January 1999 and August 2002 for
immunohistochemistry (IHC) analysis. The median survival time of
the 152 patients was 89 months, and the follow-up duration ranged
from 4 to 131 months. This study was approved by The Ethics
Committee of Southern Medical University Nanfang Hospital, and all
patients provided informed consent for the treatments, and to have
their data used for research purposes.
Western blot
The tissues samples were lysed in RIPA lysis buffer
(cat. no. P0013B; Beyotime Insitute of Biotechnology). Protein
concentration was determined using a Bicinchoninic Acid Protein
Assay kit (cat. no. P0010S; Beyotime Institute of Biotechnology)
according to the manufacturer's protocol. Western blot for proteins
expression were performed. Briefly, 40 µg of lysates were separated
via 12% SDS-PAGE, and transferred to PVDF membranes (EMD
Millipore). The membrnes were blocked with 5% non-fat dry milk for
2 h at room temperature, and then incubated with primary goat
polyclonal anti-CapG antibody (1:200; cat. no. sc-33084; Santa Cruz
Biotechnology, Inc.) overnight at 4°C. Subsequently, the membranes
were incubated with a horseradish peroxidase-conjugated rabbit
anti-goat IgG secondary antibody (cat. no. ZB-2306; 1:5,000;
OriGene Technologies, Inc.) for 1.5 h at room temperature. β-actin
was used as internal loading control (1:1,000; cat. no. ab8229;
Abcam). Signals were visualized with ECL detection reagent (Thermo
Fisher Scientific, Inc.). Protein bands were scanned and analyzed
using a Gel-Pro analyzer (version 4.0; Media Cybernetics, Inc.).
All samples were set up in triplicate in every experiment.
IHC
IHC procedures were performed using an SP-9000
detection kit (OriGene Technologies, Inc.) according to the
manufacturer's protocol. Briefly, tissue samples were fixed in 10%
neutral formalin for 24 h at room temperature and embedded in
paraffin, which were cut into 4-µm sections and placed in a 37°C
incubator for 120 min. Subsequently, tissue sections were
deparaffinized with xylene at room temperature for 20 min and
rehydrated using a descending ethanol series (100, 100, 95 and 70%
ethanol). Sections were submerged into EDTA antigenic retrieval
buffer and microwaved for antigenic retrieval. The sections were
then treated with 3% hydrogen peroxide in methanol to quench the
endogenous peroxidase activity, followed by incubation with normal
goat serum (cat. no. SP9000; OriGene Technologies, Inc.) for 15 min
at room temperature to block the nonspecific binding. CapG was
detected using a goat polyclonal antibody against CapG (1:100; cat.
no. sc-33084; Santa Cruz Biotechnology, Inc.) overnight at 4°C. In
the negative control group, the primary antibody was replaced with
primary antibody diluent (cat. no. ZLI-9029; OriGene Technologies,
Inc.) in blocking buffer. After washing with PBS, the tissue
sections were treated with biotinylated anti-goat secondary
antibody (cat. no. SP9000; OriGene Technologies, Inc.) for 15 min
at room temperature, followed by further incubation with a
horseradish peroxidase-labeled streptavidin (cat. no. SP9000;
OriGene Technologies, Inc.) for 15 min at room temperature. The
tissue sections were stained with 3,3′-diaminobenzidine (cat. no.
ZLI-9033; OriGene Technologies, Inc.) for 3 min at room
temperature, counterstained with 10% Mayer's hematoxylin for 30 sec
at room temperature, dehydrated and mounted in Crystal Mount. The
slides were observed using a light microscope (Olympus Corporation;
magnification, ×200).
The proportion of cells expressing CapG varied from
0 to 100%, scored as 1 (≤10%), 2 (11–50%), 3 (51–75%) or 4 (≥76%),
and the intensity of immunostaining varied from weak to strong,
scored as 1 (no staining), 2 (weak staining), 3 (moderate staining)
or 4 (strong staining). The final score was calculated as the
proportion of cells multiplied by the staining intensity. A final
score >8 classified tumors into the high-expression group,
whereas a score ≤8 classified tumors into the low-expression group.
Each section was assessed by two independent experienced
pathologists and a third pathologist made the final decision when
two pathologists were not in agreement.
Cell lines and cell culture
conditions
The human 786-O ccRCC cell line was obtained from
the Institute of Urology, Southern Medical University. The cells
were maintained in RPMI-1640 medium (HyClone; GE Healthcare Life
Sciences) with 25 mM glucose, 10% fetal calf serum (Gibco; Thermo
Fisher Scientific, Inc.), 100 U/ml penicillin, and 100 µg/ml
streptomycin at 37°C in a humidified atmosphere containing 5%
CO2.
Lentivirus vector siRNA
construction
For CapG knockdown, three small interfering RNAs
(siRNAs; siRNA1, 5′-CCAACATCCTGGAACGCAA-3′; siRNA2,
5′-CGAATGAGAAGGAGCGGCA-3′; and siRNA3, 5′-GGAAGGTGGTGTGGAGTCA-3′)
specifically targeting CapG were designed, synthesized and
individually subcloned into the GV248 plasmid (Shanghai GeneChem
Co., Ltd.). For lentivirus packaging, 5×10⁶ 239T cells
were seeded onto a 10-cm culture dish and incubated with complete
Dulbecco's modified Eagle's medium (HyClone; GE Healthcare Life
Sciences) for 24 h, followed by transfection with 20 µg
GV248-CapG-siRNA plasmid and two helper plasmids (helper 1.0, 15
µg; helper 2.0, 10 µg; Shanghai GeneChem Co., Ltd.) using
Lipofectamine® 2000 (Invitrogen; Thermo Fisher
Scientific, Inc.) according to the manufacturer's instructions.
After 48 h, the viral supernatant was purified by
ultracentrifugation at 75,555 × g at 4°C for 2 h. The resulting
pellet was resuspended in PBS and centrifugated at 9,600 × g at 4°C
for 5 min. The supernatant was collected. The most effective
double-stranded CapG-targeting siRNA sequence (siRNA1;
5′-CCAACATCCTGGAACGCAA-3′; referred to as CapG-siRNA thereafter)
was synthesized and cloned into the pGCSIL-GFP vector by Shanghai
GeneChem Co., Ltd. An siRNA sequence with no homology to any known
human gene (5′-TTCTCCGAACGTGTCACGT-3′) was used to generate the
negative control (NC) lentiviral vector. For lentiviral
transduction, 786-O cells were plated in 6-well plates at a density
of 5×10⁴ cells/ml until cell confluence reached 30%.
Lentivirus with an MOI of 5 and 5 µg/ml of polybrene (Shanghai
GeneChem Co. Ltd.) were then added.
RNA isolation and reverse
transcription-quantitative (RT-q) PCR
Lentivirus siRNA knockdown efficiency was determined
by RT-qPCR. Cells were harvested, and total RNA was extracted with
TRIzol® reagent (Invitrogen Thermo Fisher Scientific,
Inc.) according to the manufacturer's protocol. Reverse
transcription was performed using M-MLV reverse transcriptase
(Promega Corporation) and oligo-dT primers (Sangon Biotech Co.,
Ltd.) to obtain cDNA. The RT temperature protocol was 42°C for 60
min and 70°C for 10 min, followed by maintenance at −20°C until
qPCR analysis. CapG mRNA expression was determined with RT-qPCR
using SYBR Green master mix (Takara Bio, Inc.) on a TP80 RT-PCR
instrument TP800 (Takara Bio, Inc.). The thermocycling conditions
were as follows: Initial denaturation at 95°C for 30 sec; followed
by 40 cycles of denaturation at 95°C for 5 sec and 60°C for 30 sec;
dissociation at 95°C for 15 sec, 60°C for 30 sec and 95°C for 15
sec. The primers used were: i) GAPDH forward,
5′-TGACTTCAACAGCGACACCCA-3′; ii) GAPDH reverse,
5′-CACCCTGTTGCTGTAGCCAAA-3′; iii) CapG forward,
5′-GCAGCTCTGTATAAGGTCTCTG-3′; and iv) CapG reverse,
5′-TTTCGCCCCTTCCAGATATAG-3′. Relative CapG expression was
normalized to GAPDH, and data analysis was conducted using the
2−ΔΔCq method (12).
Cell proliferation assay
The 786-O cells were seeded in 96-well plates to
examine cell proliferation using a Cell Counting Kit-8 (CCK-8)
proliferation assay (cat. no. 96992; Sigma Aldrich; Merck KGaA)
according to the manufacturer's guidelines. Cells were transduced
with CapG-siRNA lentivirus or NC lentivirus and incubated for 24,
48, 72, 96 and 120 h, then treated with CCK-8 for 4 h. Optical
density (OD) was measured at 450 nm using an M2009PR automatic
microplate reader (Tecan Infinite). OD450/fold was calculated as
the sum of day 1-day 5 OD450 values relative to the day 1 OD450
value in each group.
Cell cycle analysis by flow
cytometry
The 786-O cells were transduced with CapG-siRNA
lentivirus or NC lentivirus. After incubation for 72 h, cell
suspensions were generated and plated in 6-cm dishes for further
culture. After reaching ~80% coverage, cells were collected and
fixed with pre-chilled 70% alcohol for at least 1 h. Cells were
then washed with PBS, and incubated in dark at 4°C for 30 min with
propidium iodide (PI; cat. no. P4170; Sigma-Aldrich; Merck KGaA)
buffer containing 40X PI stock solution (2 mg/ml), 100X RNase stock
solution (10 mg/ml), and 1X PBS at a ratio of 25:10:1,000. Cell
cycle analysis was performed using a flow cytometer (Guava EasyCyte
HT; EMD Millipore), and at least 1×10⁶ cells per sample
were used in each experiment. Data were analyzed using ModFit
software (version LT 4.1; Verity Software House, Inc.).
Annexin V-allophycocyanin (APC)
apoptosis assay
An Annexin V-APC apoptosis detection kit (cat. no.
88–8007; eBioscience) was used for cell apoptosis analysis,
according to the manufacturer's instructions. After lentiviral
infection, cells were incubated for 120 h, harvested, washed with
PBS buffer, and resuspended in staining buffer at a final density
of ≥5×10⁵ cells/ml. Then, 5 µl Annexin V-APC was added
into 100 µl cell suspensions and incubated at room temperature for
10–15 min. Signals were detected using a Guava EasyCyte HT flow
cytometer (EMD Millipore) and InCyte software (version 3.1; EMD
Millipore).
Wound healing and Transwell
assays
The CytoSelect™ 96-well Wound Healing Assay (cat.
no. CBA-120; Cell Biolabs) was used to analyze migration of NC and
CapG knockdown cells. After lentiviral infection, cells were
incubated for 72 h and then the assay was performed according to
the manufacturer's protocol. Briefly, cells were seeded
(5×10⁴ cells/well) into a 96-well plate and incubated in
medium supplemented with 0.5% FBS (cat. no. VS500T; Ausbian, Inc.).
At 90% confluence, the wound was created using a scratch tester to
align the center of the lower end of the 96-well plate and gently
push upward to form a scratch, and detached cells were removed by
washing the cells with PBS three times. The wound was observed at
0, 3 and 6 h using an IX71 fluorescence microscope (Olympus
Corporation; magnification, ×200). The migration rate was
calculated as the ratio of the width of the wound at a given time
point relative to the width of wound at the 0 h time point
(13).
The Transwell assay was performed using 8-µm
membrane filter inserts (cat. no. 3422; Corning Inc.), according to
the manufacturer's instructions. Briefly, Matrigel (cat no. 356234;
BD Biosciences) was dissolved overnight at 4°C and diluted with
serum free medium (1:3; cat. no. 10-013-CVR; Corning, Inc.).
Subsequently, 100 µl diluted Matrigel was added to the membrane in
the Transwell upper chamber and incubated at 37°C for 3 h. Cells
(5×10⁴) in 0.1 ml serum-free medium were seeded into the
upper chamber, whereas the lower chamber consisted of a 24-well
plate containing 0.6 ml minimum essential medium supplemented with
30% FBS. Following incubation for 18 h at 37°C with 5%
CO2, non-invading cells in the upper chamber were
carefully removed with a cotton swab and invading cells were fixed
with 4% paraformaldehyde at room temperature for 30 min and stained
with Giemsa (cat. no. 32884; Sigma-Aldrich; Merck KGaA) at room
temperature for 5 min. Following washing three times with double
distilled H2O, samples were allowed to air dry. Invading
cells were observed using an IX71 fluorescence microscope (Olympus
Corporation; magnification, ×100).
Microarray processing and
analysis
Total RNA from 786-O cells transduced with
CapG-siRNA lentivirus or NC lentivirus was extracted using TRIzol
reagent. Samples were set up in triplicate. RNA quantity and
quality were assessed with a NanoDrop™ 2000 spectrophotometer
(NanoDrop Technologies; Thermo Fisher Scientific, Inc.) and Agilent
Bioanalyzer 2100 (Agilent Technologies, Inc.). Microarray
processing was performed using an Affymetrix Human GeneChip
PrimeView (100K array; cat. no. 901838; Affymetrix; Thermo Fisher
Scientific, Inc.), according to the manufacturer's instructions.
Arrays were scanned using a GeneChip Scanner 3000 to produce the
raw data. Significant, differentially expressed genes between 786-O
cells treated with CapG-siRNA lentivirus and NC lentivirus were
selected based on a threshold of P<0.05 and absolute fold-change
>1.5 using the ‘Affy’ package of R (version 1.46.1; bioconductor.org/packages/release/bioc/html/affy.html).
Bioinformatics analysis of the differentially expressed genes was
performed using Ingenuity Pathway Analysis (IPA; version 42012434;
Qiagen China Co., Ltd.).
Statistical analysis
Quantitative data are presented as the mean ±
standard deviation. A two-way repeated-measures ANOVA followed by
Fisher's Least Significant Difference post-hoc test was used to
compare the expression of CapG between ccRCC and adjacent normal
tissue. All measurements were repeated three times. One-way ANOVA
and Dunnett's post hoc test as were used to analyze the data from
functional assays. Categorical variables are presented as count
(percentage). The χ2 test was used to analyze the
relationship between CapG expression and clinicopathological
characteristics. Survival curves were plotted using the
Kaplan-Meier method, and compared using the log-rank test. The
significance of clinicopathological variables for survival was
analyzed using the univariate and multivariate Cox proportional
hazards method. All statistical analysis was carried out using the
SPSS version 13.0 (SPPS, Inc.). In all analyses, two-tailed
P<0.05 was considered to indicate a statistically significant
difference.
Results
CapG expression was elevated in ccRCC
tissues, and was closely correlated with clinical outcomes
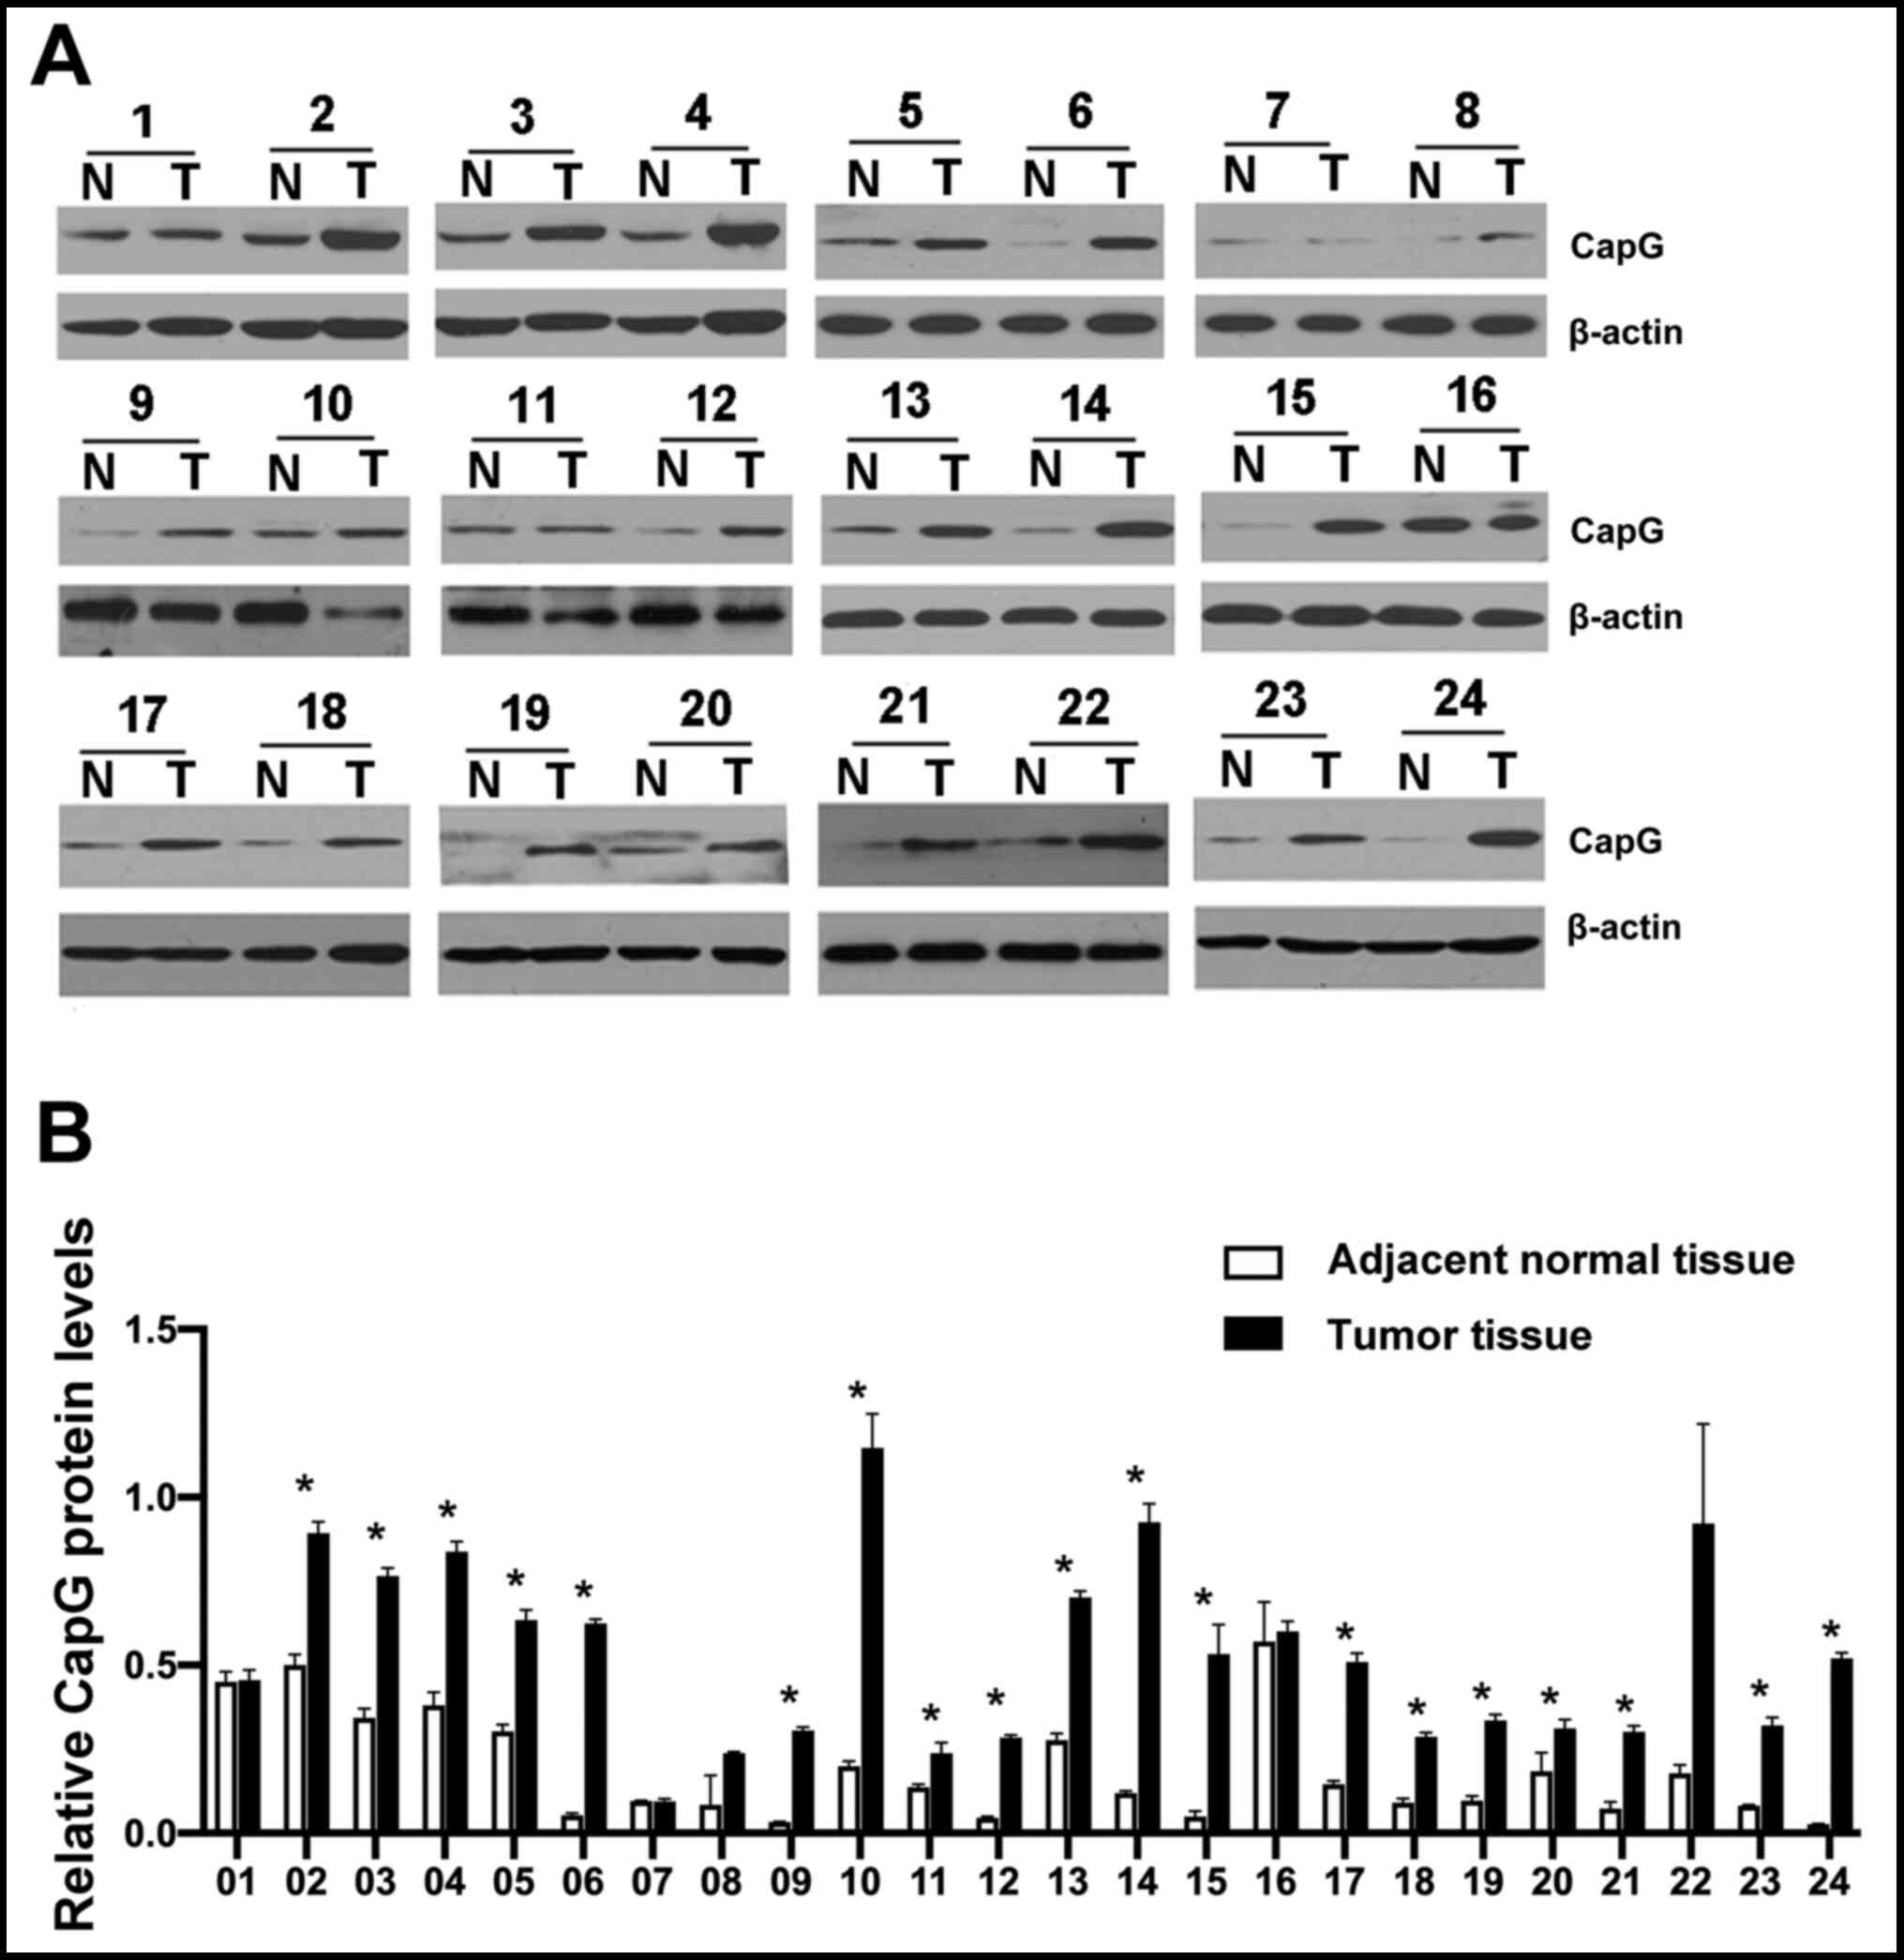
Western blot analysis was performed to examine CapG
protein expression in 24 ccRCC and paired normal renal tissue
samples (Fig. 1). Using
repeated-measures ANOVA, only the main effect of CapG expression in
ccRCC and adjacent normal tissue samples was significant
(P<0.001). The effect of repeated measurements and interaction
were not significant (P=0.703 and P=0.115, respectively). CapG
protein expression levels was significantly increased in ccRCC
tissue samples, compared with adjacent normal tissue were observed,
and most patients (79.17%; 19/24) displayed significantly higher
CapG expression levels in tumor tissue in post-hoc comparisons (all
P<0.05).
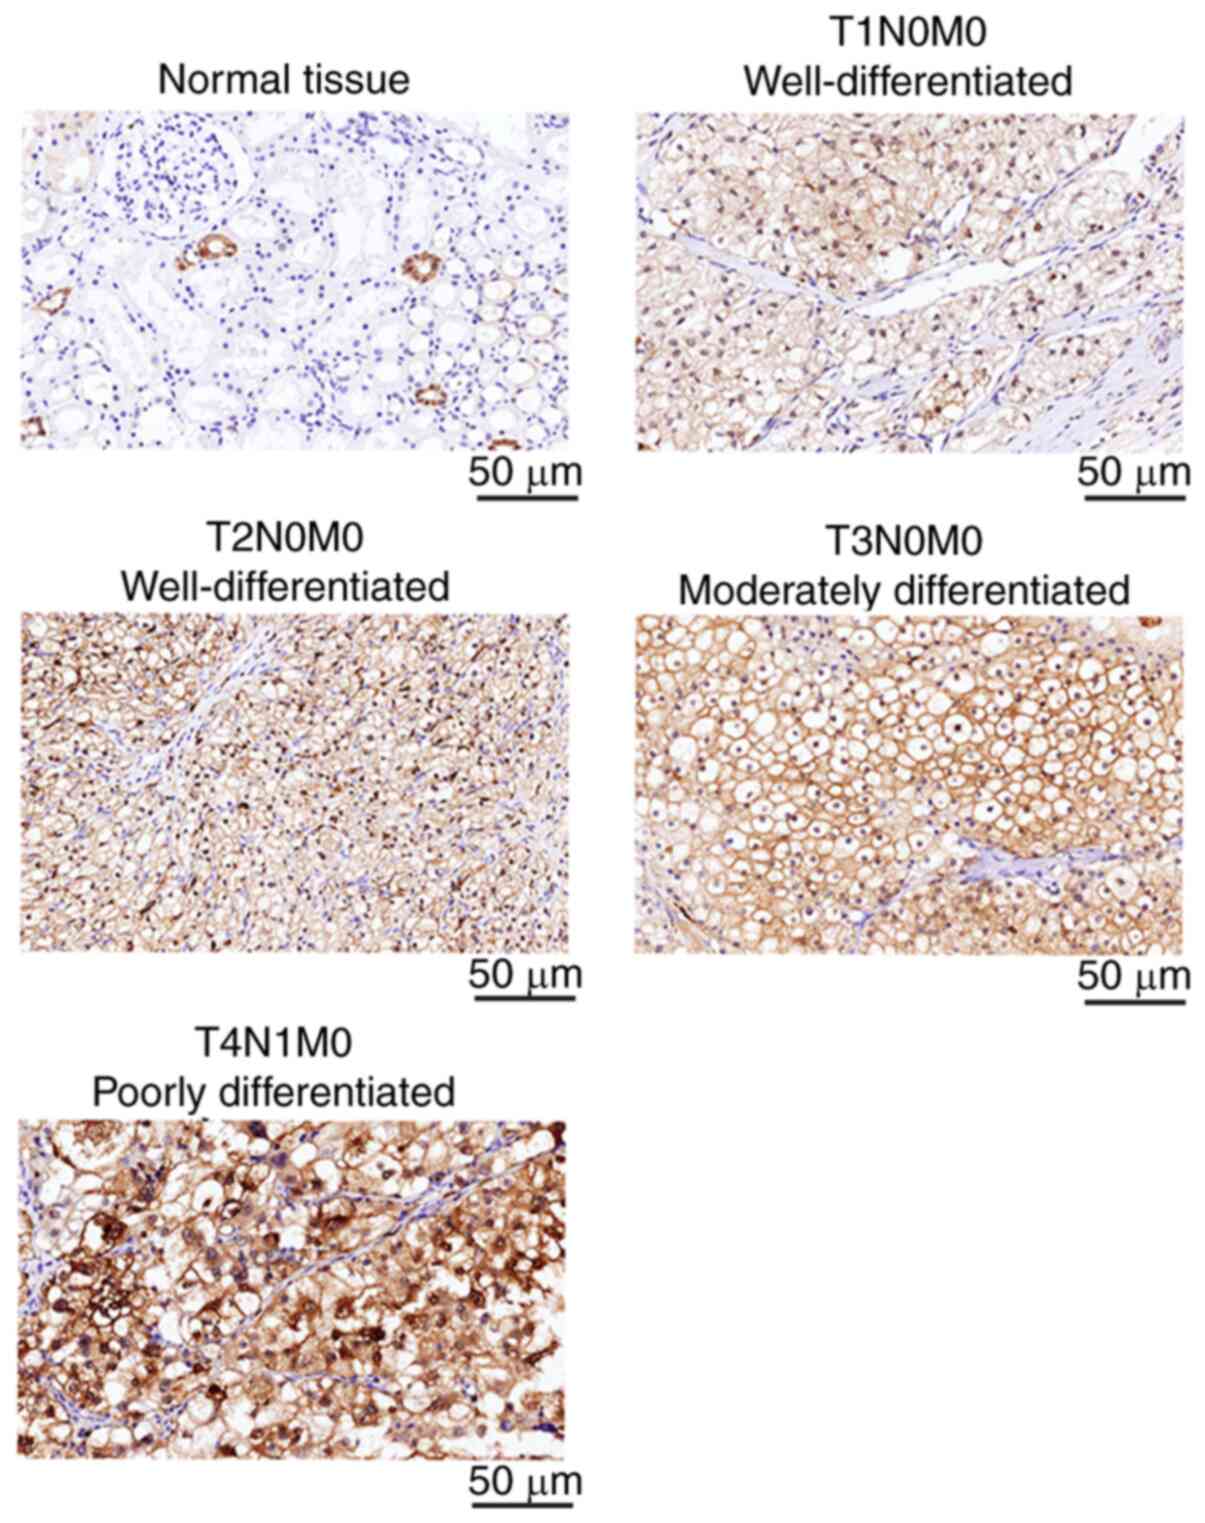
CapG expression was then examined by
IHC in 152 ccRCC and 40 normal renal tissue samples
Representative images of CapG IHC staining of ccRCC
tissues at different stages and grades, as well as adjacent normal
tissues, are presented in Fig. 2.
CapG staining was observed both in the cytoplasm and nuclear region
of the cells. CapG was highly expressed in 7.5% (3 out of 40) of
normal tissues, compared with 55.3% (84 of 152) of ccRCC tissue
samples (P<0.001). Moreover, CapG expression was significantly
associated with tumor stage (P=0.017), histological grade
(P=0.029), and lymph node metastasis (P=0.038) (Table I). However, CapG expression was not
associated with sex, age, incidence of distant metastasis, or
recurrence.
 | Table I.Association between CapG expression
levels and clinicopathological variables. |
Table I.
Association between CapG expression
levels and clinicopathological variables.
|
|
| CapG expression, n
(%) |
|
|
|---|
|
|
|
|
|
|
|---|
| Clinicopathological
variable | Cases, n | Low | High | χ2 | P-value |
|---|
| Sex |
|
|
| 3.261 | 0.071 |
|
Male | 93 | 47 (50.5) | 46 (49.5) |
|
|
|
Female | 59 | 21 (35.6) | 38 (64.4) |
|
|
| Age |
|
|
| 0.869 | 0.351 |
|
<60 | 89 | 37 (41.6) | 52 (58.4) |
|
|
|
≥60 | 63 | 31 (49.2) | 32 (50.8) |
|
|
| pT stage |
|
|
| 10.241 | 0.017 |
| T1 | 68 | 39 (57.4) | 29 (42.6) |
|
|
| T2 | 52 | 20 (38.5) | 32 (61.5) |
|
|
| T3 | 28 | 9
(32.1) | 19 (67.9) |
|
|
| T4 | 4 | 0 (0.0) | 4
(100.0) |
|
|
| pN stage |
|
|
| 4.316 | 0.038 |
| N0 | 131 | 63 (48.1) | 68 (51.9) |
|
|
| N+ | 21 | 5
(23.8) | 16 (76.2) |
|
|
| M stage |
|
|
| 0.336 | 0.562 |
| M0 | 141 | 64 (45.4) | 77 (54.6) |
|
|
| M1 | 11 | 4
(36.4) | 7
(63.6) |
|
|
| Tumor grade |
|
|
| 7.081 | 0.029 |
|
1/2 | 51 | 24 (47.1) | 27 (52.9) |
|
|
| 3 | 61 | 33 (54.1) | 28 (45.9) |
|
|
| 4 | 40 | 11 (27.5) | 29 (72.5) |
|
|
| Recurrence |
|
|
| 0.392 | 0.531 |
|
Yes | 130 | 60 (46.2) | 70 (53.8) |
|
|
| No | 11 | 4
(36.4) | 7
(63.6) |
|
|
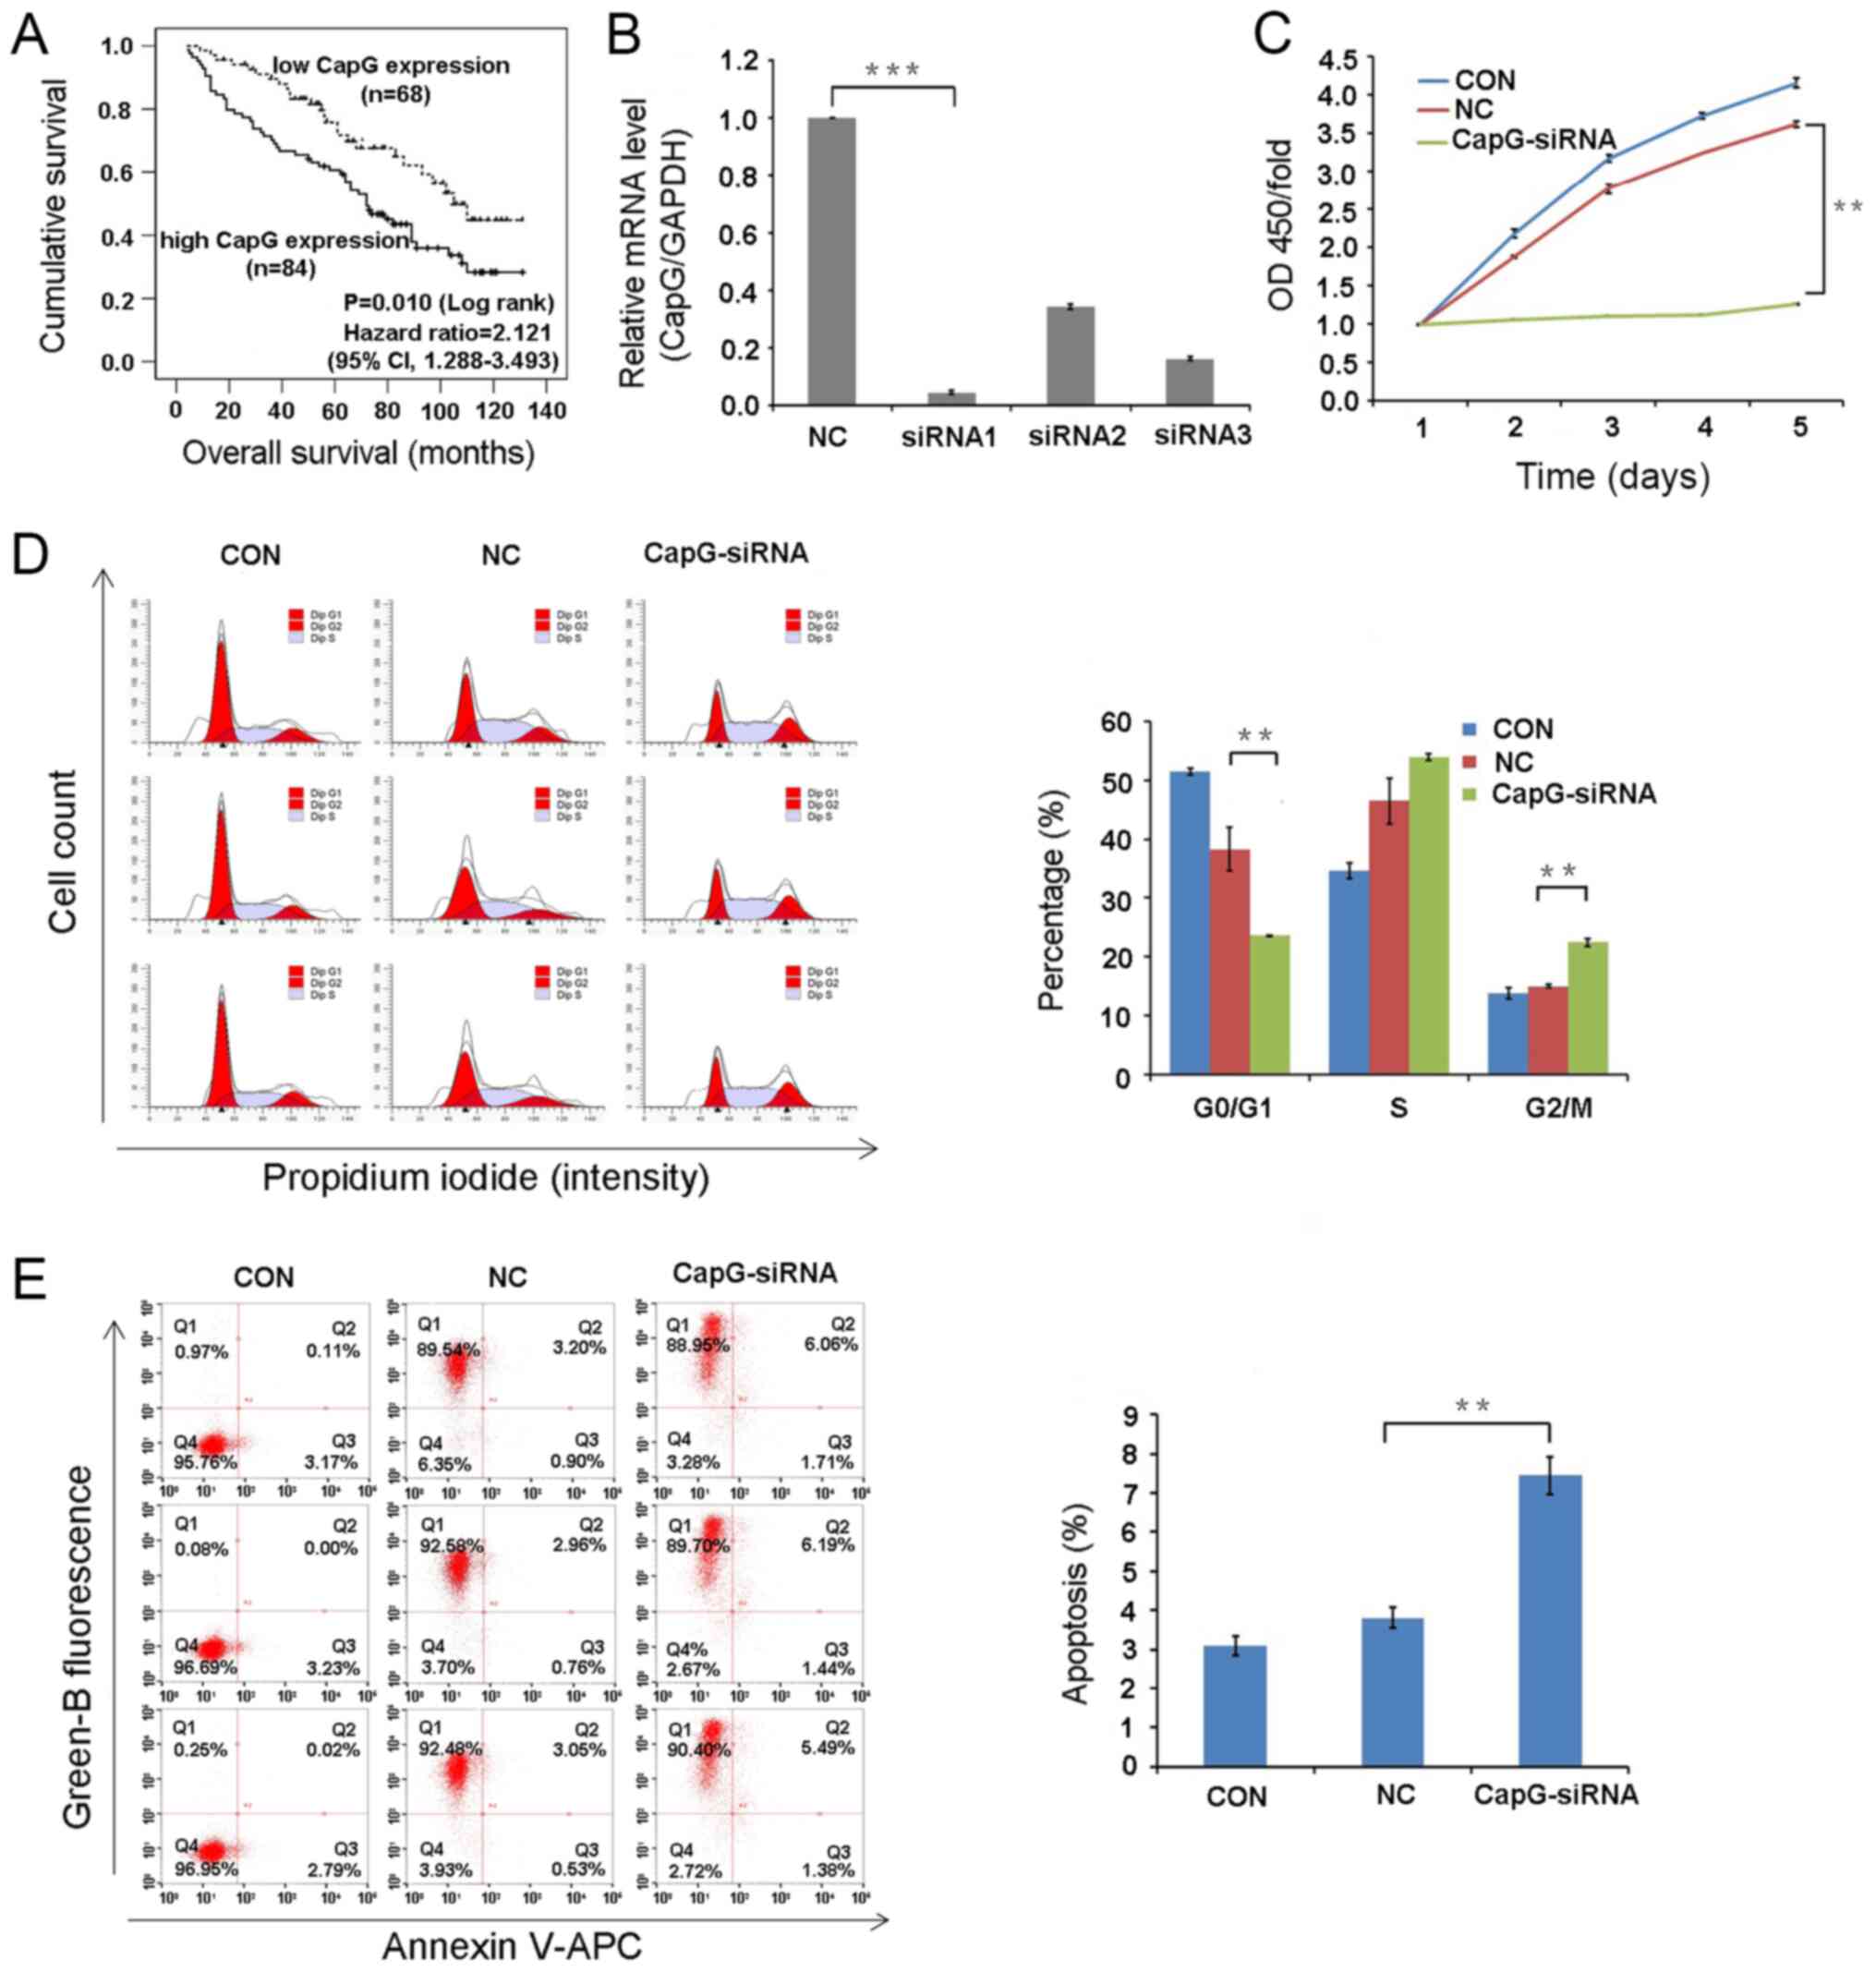
CapG expression predicts prognosis in
ccRCC patients
To determine the prognostic value of CapG
expression, the association between CapG expression and OS was
examined using Kaplan-Meier survival curves and a log-rank test, as
well as univariate and multivariate Cox regression models. The
5-year OS rate in patients with high CapG expression was 60.6 and
75.7% in patients with low expression (log-rank, 6.562, P=0.010,
Fig. 3A). In addition, the
low-expression group displayed significantly higher 1-year OS rate
(98.5 and 90.5% in the high and low-expression groups,
respectively; P=0.043) and 3-year OS rate (90.8 and 71.4.5%;
P=0.004), compared with the high-expression group. Moreover, the
estimated median survival time was significantly longer in the
low-expression group (105 months; 95% CI, 87.93–122.07) than in the
high-expression group (72 months; 95% CI, 57.37-86-63)
(P<0.05).
To identify clinicopathological variables associated
with survival time, univariate analysis of each variable (gender,
age, tumor size, T stage, N stage, M stage, tumor grade and CapG
expression) was performed. The difference in prognosis prediction
is expressed using a hazard ratio (HR) and a P-value. Univariate
analysis demonstrated that tumor size, T stage, N stage, M stage,
tumor grade, and CapG expression levels were significant predictors
of OS. The relative importance of each of these variables was then
determined using a multivariate Cox proportional hazards analysis.
Multivariate analysis showed that T stage, N stage, M stage, and
CapG expression level were independent predictors of OS. Patients
with high CapG expression had a 2.12-time higher risk than those
with low expression (HR, 2.121; 95% CI, 1.288–3.493; P=0.003)
(Table II).
| Table II.Univariate and multivariate Cox
proportional hazards model for overall survival in 152 patients
with clear cell renal cell carcinoma. |
Table II.
Univariate and multivariate Cox
proportional hazards model for overall survival in 152 patients
with clear cell renal cell carcinoma.
|
| Univariate
analysis | Multivariate
analysis |
|---|
|
|
|
|
|---|
| Clinicopathological
variable | HR | 95% CI | P-value | HR | 95% CI | P-value |
|---|
| Sex (female vs.
male) | 1.084 |
0.692–1.700 |
0.724 | – | – | – |
| Age ≥60 vs.
<60 | 1.167 |
0.749–1.818 |
0.496 | – | – | – |
| Tumor size, cm
(>7.0vs. ≤7.0) | 2.322 |
1.478–3.648 | <0.001 | 1.757 | 0.896–3.446 |
0.101 |
| pT stage | – | – |
0.001 | – | – |
0.018 |
| T2 vs.
T1 | 1.459 |
0.854–2.492 |
0.167 | 0.690 | 0.331–1.435 |
0.320 |
| T3 /T4
vs. T1 | 3.044 |
1.743–5.317 | <0.001 | 1.672 | 0.841–3.325 |
0.143 |
| pN stage (N+ vs.
N0) | 4.995 |
2.928–8.522 | <0.001 | 4.712 | 2.465–9.006 | <0.001 |
| M stage (M1 vs.
M0) | 7.433 |
3.673–15.042 | <0.001 | 7.284 |
3.224–16.445 | <0.001 |
| Tumor grade | – | – | <0.001 | – | – |
0.131 |
| 3 vs.
1/2 | 1.504 |
0.837–2.702 |
0.173 | 1.219 | 0.644–2.309 |
0.543 |
| 4 vs.
1/2 | 4.863 |
2.733–8.653 | <0.001 | 1.997 | 0.968–4.123 |
0.061 |
| CapG expression
(high vs. low) | 1.827 |
1.142–2.922 |
0.012 | 2.121 | 1.288–3.493 |
0.003 |
CapG expression is efficiently
inhibited by lentivirus-based siRNA knockdown in 786-O cells
CapG mRNA levels were effectively decreased in 786-O
cell treated with CapG-specific siRNA, compared with the control
scramble NC control (Fig. 3B).
Since knockdown efficiency following siRNA1 transfection was 95.4%,
this siRNA was used in subsequent experiments.
Cell proliferation is impaired by CapG
knockdown
The effect of CapG knockdown on 786-O cell
proliferation was determined using a CCK-8 cell proliferation
assay. The proliferation rate in the CapG-siRNA group was
significantly reduced, compared with the NC group (P<0.01;
Fig. 3C). Thus, CapG knockdown
suppresses the proliferation of human ccRCC cells in
vitro.
CapG knockdown induces cell cycle
arrest and apoptosis
Cell cycle progression and apoptosis were analyzed
by flow cytometry. Cell cycle distribution in the untransduced
control (CON) group was: i) G0/G1, 51.56%;
ii) S, 34.62%; and iii) G2/M, 13.82%. The distribution in the NC
group was: i) G0/G1, 38.40%; ii) S, 46.58%;
and iii) G2/M, 15.03%. The distribution in the
CapG-siRNA group was: i) G0/G1, 23.54%; ii) S, 54.04%; and iii)
G2/M, 22.43%. Overall, the CapG-siRNA group displayed a
significant decrease in G0/G1 phase cells,
and a significant increase in G2/M phase cells
(P<0.01 in both cases). These findings indicate that CapG
silencing induces cell cycle arrest at the G2/M phase
and that CapG affects cell cycle distribution.
Furthermore, the percentage of apoptotic 786-O cells
significantly increased in the CapG-siRNA group, compared with the
NC group (7.43±0.49% vs. NC 3.81±0.26%, respectively; P<0.01;
Fig. 3E). These results suggest
that CapG is associated with apoptosis of ccRCC cells.
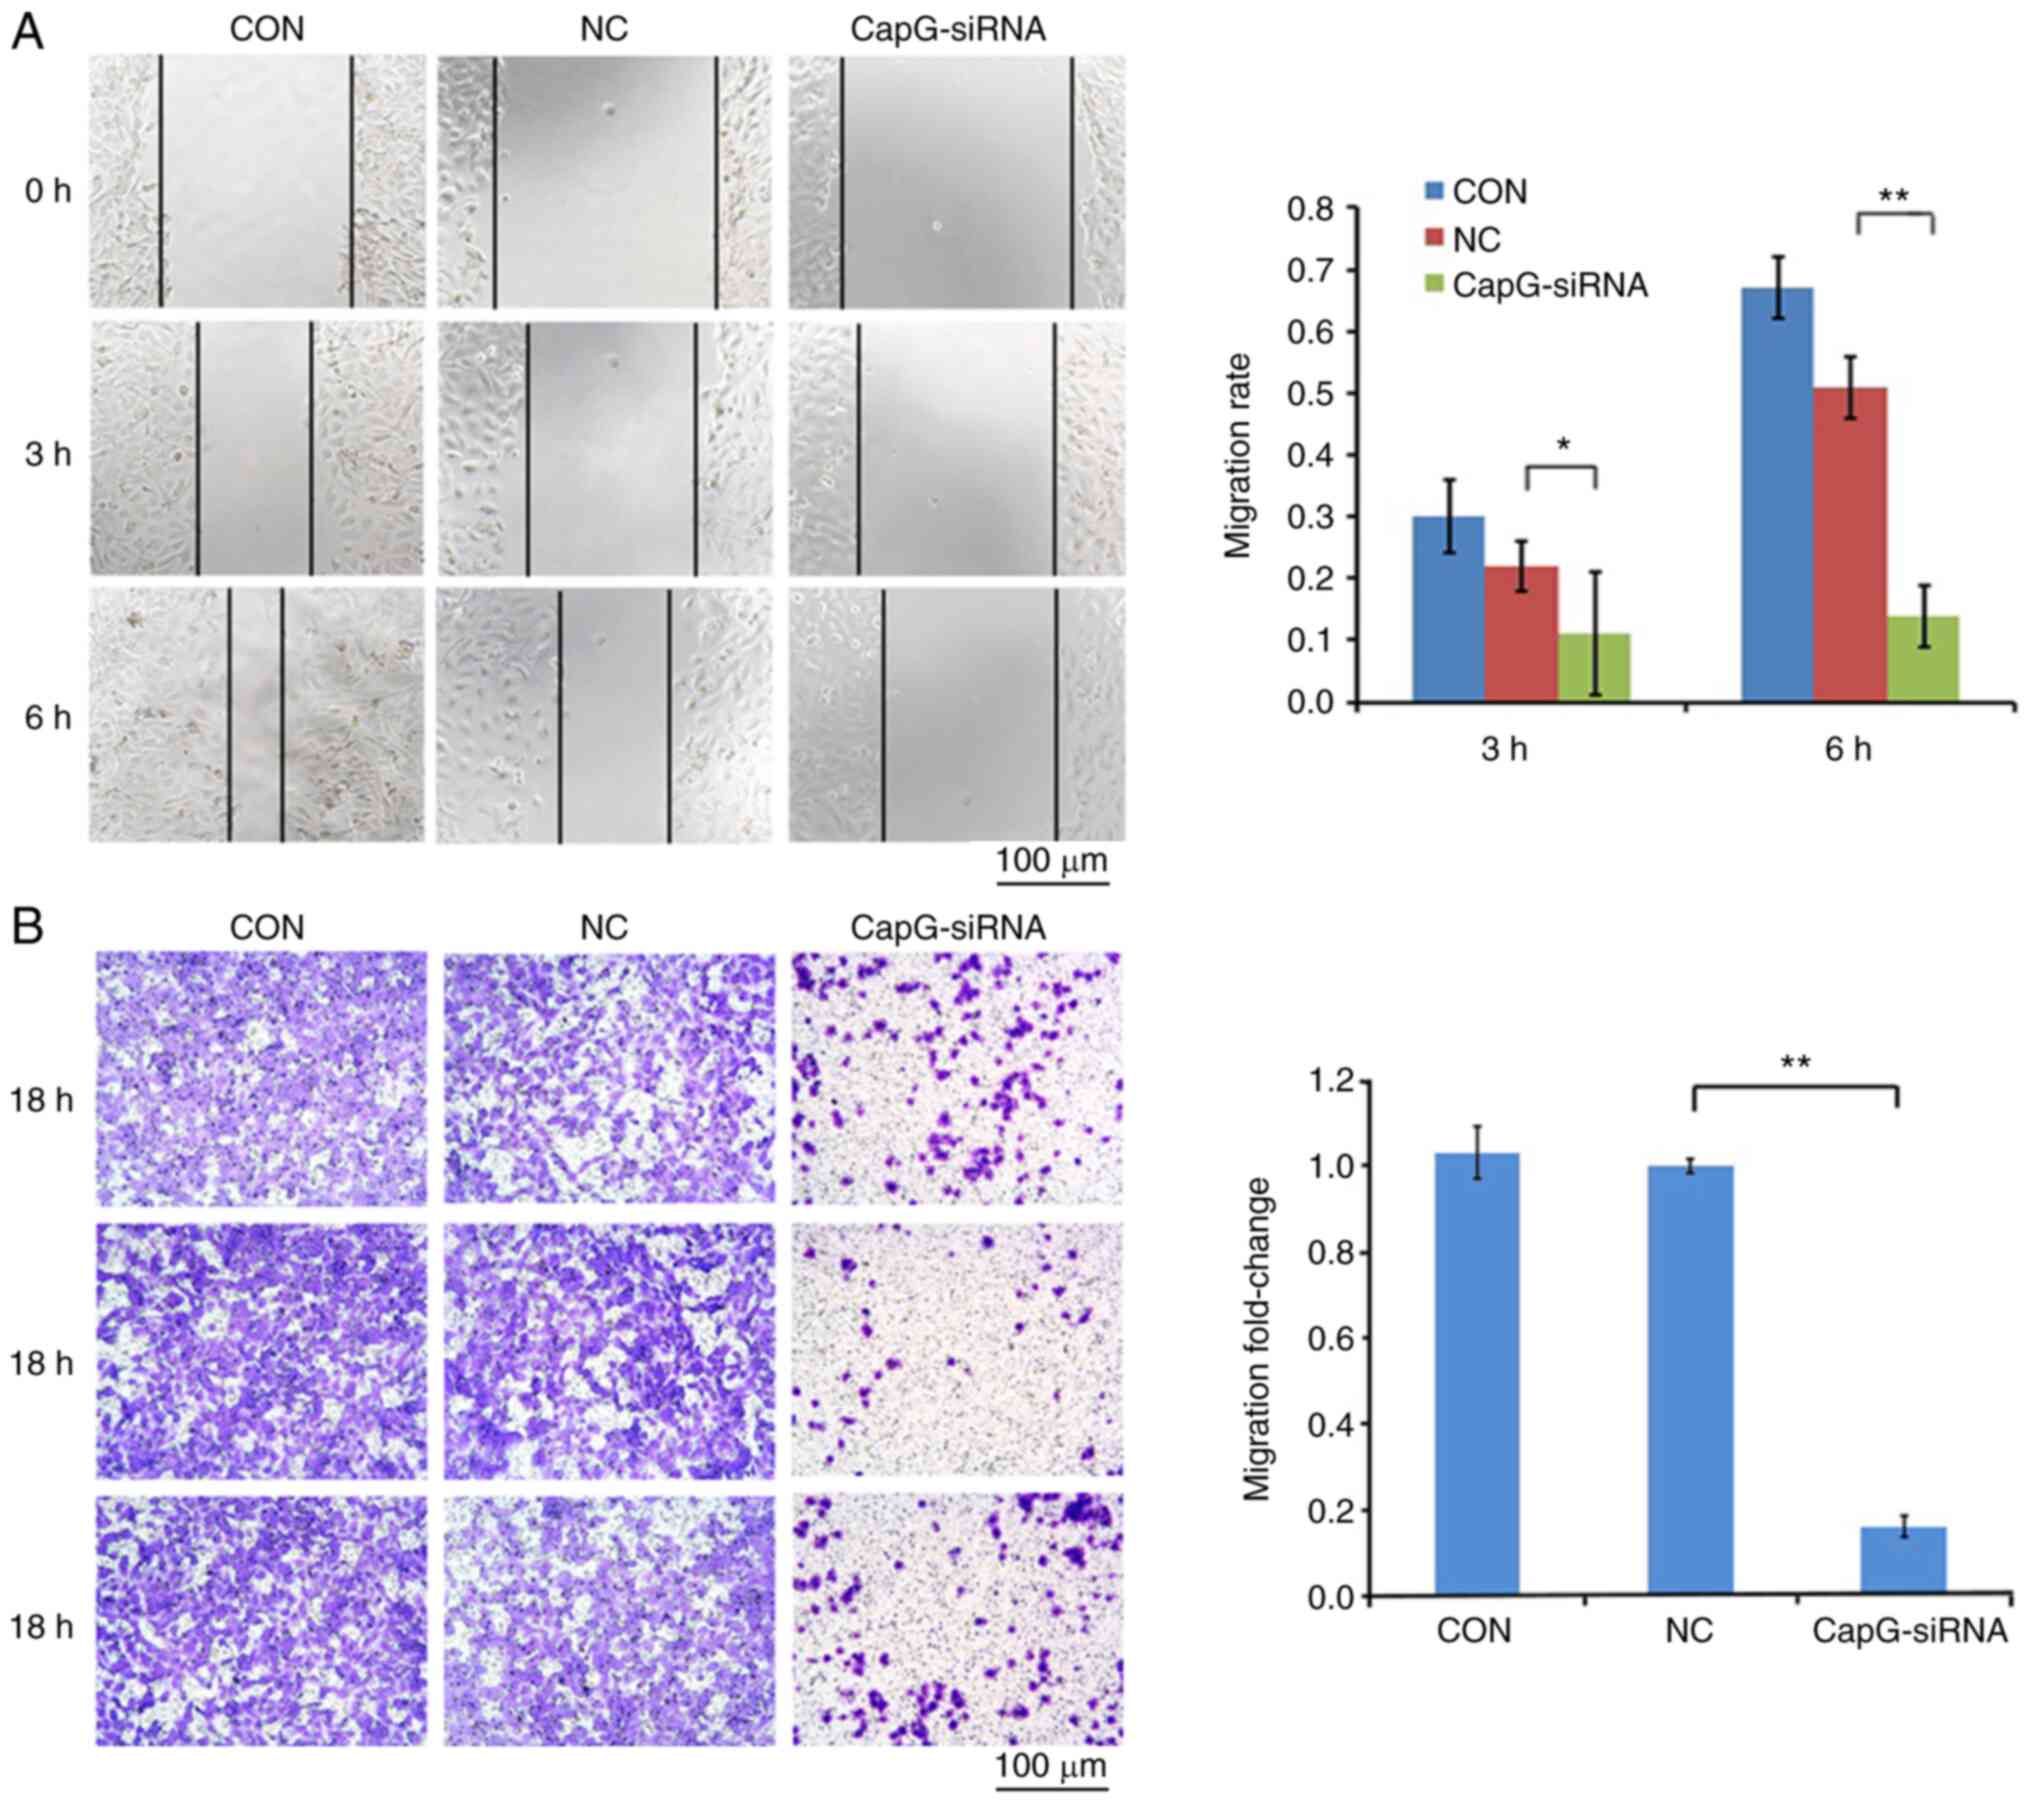
Knockdown of CapG inhibited tumor cell
migration and invasion
A wound healing assay and a Transwell Matrigel™
assay were carried out to evaluate the influence of CapG on cell
migration and invasion, respectively, of 786-O cells. Microscopic
analysis indicated that CapG-silenced cells migrated faster than
cells transduced with NC lentivirus after 3 h (P<0.05) and 6 h
(P<0.01) (Fig. 4A), indicating
the migration ability of 786-O cells was significantly inhibited by
CapG silencing. Moreover, in the Transwell Matrigel™ assay,
downregulation of CapG suppressed the invasion ability of ccRCC
cells (Fig. 4B). Altogether, these
findings suggest that CapG plays a crucial role in migration and
invasion of ccRCC cells.
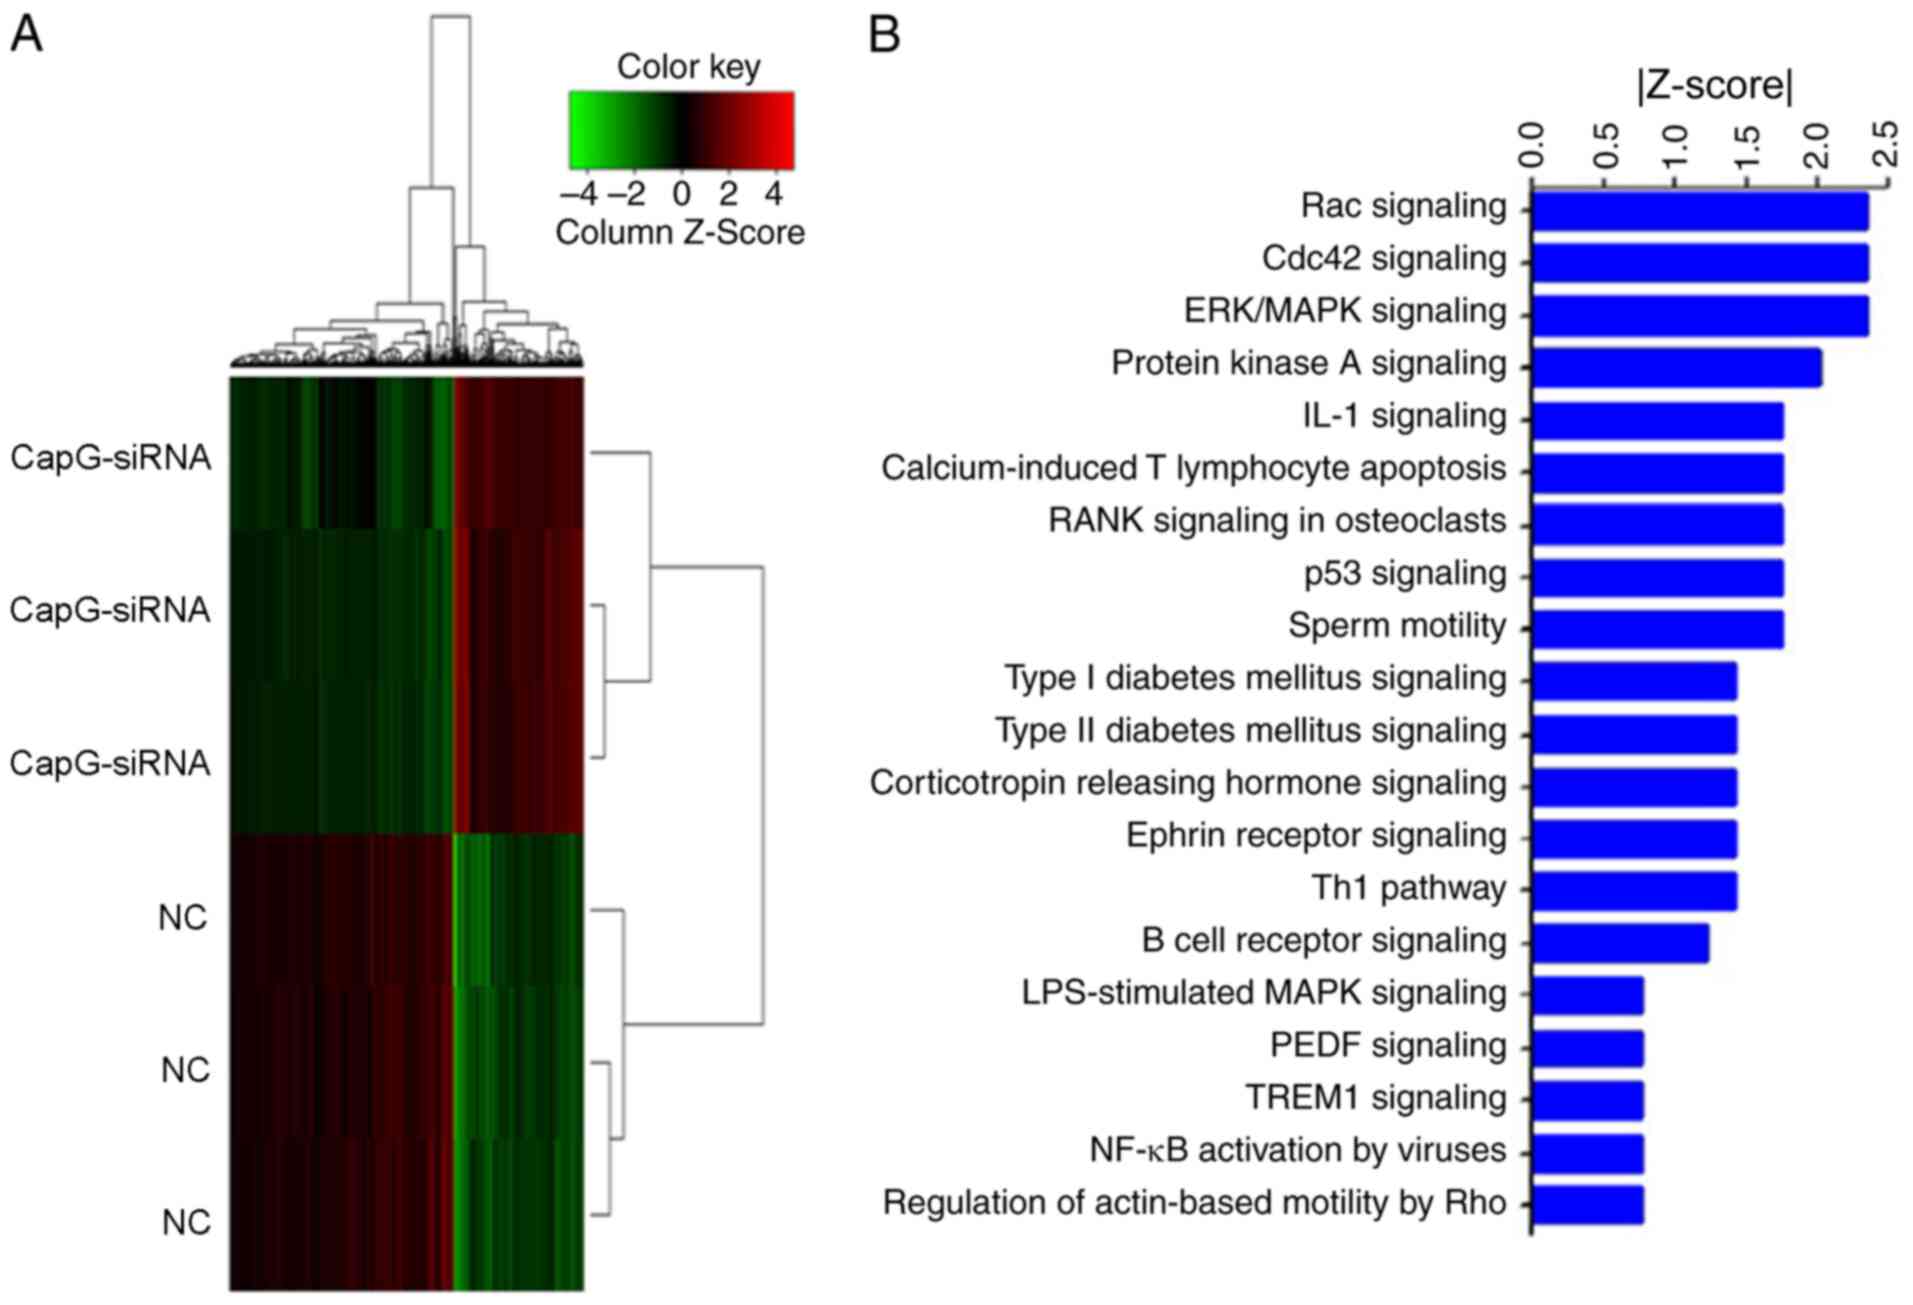
Disruption of critical pathways
involved in cancer development by CapG knockdown
The aforementioned results indicate that CapG is
critical for migration and invasion of ccRCC cells. However, the
mechanisms underlying the role of CapG and downstream pathways in
ccRCC have not been explored. In this study, global gene expression
profiles of 786-O cells transduced with CAPG-siRNA lentivirus or NC
lentivirus were examined using a microarray platform. A total of
510 genes showing significant differential expressions were
identified, including 179 upregulated genes and 331 downregulated
genes (Fig. 5A). IPA demonstrated
that the differentially expressed genes were enriched in canonical
pathways, and were therefore sorted according to their
-log(P-value). Some of the pathways were significantly inhibited
(Z-score<-2), including ‘Rac signaling’, ‘CDC42 signaling’,
‘ERK/MAPK signaling’ and ‘PKA signaling’ (Fig. 5B).
Discussion
ccRCC is one of the most common and aggressive types
of RCC. While chemotherapy and radiotherapy are ineffective,
targeted therapies can improve the outcomes of patients with ccRCC
(14). Therefore, identification of
the molecular mechanisms involved in ccRCC pathogenesis is critical
for the development innovative therapeutic strategies.
CapG was originally identified in the cytoplasm of
alveolar macrophages and is involved in cell motility and membrane
ruffling. CapG overexpression has been reported in several types of
cancer, including pancreatic, breast and gastric cancer (9–11).
However, the association of CapG with clinical characteristics and
prognosis in ccRCC has not been studied. In the present study, CapG
expression was increased in ccRCC tissue, compared with normal
tissue. In addition, CapG expression levels were associated with
tumor stage, histological grade, and lymph node metastasis.
Moreover, CapG was associated with poor prognosis and was an
independent predictor of OS in ccRCC. Consistent with our findings,
CapG is upregulated in patients with stage-III serous ovarian
adenocarcinoma, and high expression of CapG is correlated with
shorter survival (15).
Furthermore, high CapG expression has been found to be a
unfavorable prognostic factor in prostate cancer (16) and glioma (17). Collectively, these studies suggest
that CapG may represent a novel prognostic marker for ccRCC.
In the present study, CapG knockdown significantly
inhibited ccRCC cell proliferation in vitro and induced
G2/M arrest. Supporting our findings, recent studies
have indicated that CapG downregulation suppressed cell
proliferation in prostate cancer (16) and human glioma (17) in vitro. It was also observed
that CapG knockdown attenuated the migration and invasion of ccRCC
cells. Consistent with the present study, CapG knockdown is known
to inhibit the migration of invasive breast cancer cells (10), the invasion of gastric cancer cells
(11), and the migration and
invasion of glioma cells (17). The
present findings also suggested that CapG might promote metastasis
in ccRCC and could represent a target against ccRCC metastasis.
CapG is localize to both the nucleus and cytoplasm,
and increased levels in nuclear CapG promote cell invasion
(18). It has been demonstrated
that nuclear CapG can interfere with nuclear PI3-kinase (19). This suggests that CapG may be
involved in PI-driven chromatin remodeling (20) and could therefore play a role as a
regulator of gene transcription. Moreover, CapG could also act on
gene transcription by directly binding to DNA, as indicated by the
presence of a c-Myc-like DNA-binding domain (21). A recent study has demonstrated that
CapG enhances breast cancer metastasis through competition with
transcriptional repressor arginine methyltransferase 5 for binding
to the STC-1 promoter, leading to reduced histone H4R3 methylation
and enhanced STC-1 transcription (22). Our microarray analysis demonstrated
that 510 genes were significantly differentially expressed in
CapG-knockdown cells. The differentially expressed genes were
enriched in canonical signaling pathways, such as RAC, CDC42 and
ERK/MAPK signaling, which might be critical for ccRCC development
and progression.
CapG is a member of the gelsolin family. Notably,
gelsolin has also been shown to participate in cancer development
(23). Visapää et al
(24) have reported that decreased
gelsolin expression in RCC is associated with a poor patient
survival. Additionally, an in vitro study suggested that
overexpression of gelsolin inhibits the proliferation, adhesion,
and invasion ability of 786-O ccRCC cells, indicating a
tumor-suppressor role (25). By
contrast, Kankaya et al (26) have proposed that gelsolin expression
is correlated with high nuclear grade, metastasis, late stage, and
cancer death in RCC, suggesting an oncogenic function. These
findings suggested that the biological function of gelsolin in
tumorigenesis of RCC remains inconclusive. Nevertheless, as the
present study demonstrated that CapG played a tumorigenic role in
ccRCC, possible connections between gelsolin and CapG in renal
cancer should be evaluated.
To the best of our knowledge, the present study is
the first to suggest that CapG is upregulated in ccRCC, and is
associated with advanced tumor stage, histological grade, lymph
node metastasis, and poor overall survival. Moreover, CapG is an
independent predictor of OS in ccRCC. CapG silencing also inhibits
renal carcinoma cell proliferation, migration, and invasion. Taken
together, these results suggest that CapG may be an effective
biomarker and a potential therapeutic target for ccRCC.
Acknowledgements
Not applicable.
Funding
This work was financially supported by President
Foundation of Nanfang Hospital, Southern Medical University (grant
no. 2019B022).
Availability of data and materials
The datasets used and/or analyzed during the current
study are available from the corresponding author on reasonable
request.
Authors' contributions
TC and ZFC designed the study. ZFC, ZHH, SJC and YDJ
performed all of the assays and participated in data analysis. ZFC
wrote the manuscript. SBZ and ZKQ took part in analysis and
interpretation of the data, and edited the manuscript. All authors
reviewed the manuscript for important intellectual content. All
authors read and approved the final manuscript.
Ethics approval and consent to
participate
Ethical approval was obtained by Nanfang Hospital,
Southern Medical University. All participants signed informed
consent at the time of clinical intervention with knowledge that
their data and materials may be used for research purposes.
Patient consent for publication
Not applicable.
Competing interests
The authors declare that they have no competing
interests.
References
|
1
|
Hsieh JJ, Purdue MP, Signoretti S, Swanton
C, Albiges L, Schmidinger M, Heng DY, Larkin J and Ficarra V: Renal
cell carcinoma. Nat Rev Dis Primers. 3:170092017. View Article : Google Scholar : PubMed/NCBI
|
|
2
|
Ross K and Jones RJ: Immune checkpoint
inhibitors in renal cell carcinoma. Clin Sci (Lond). 131:2627–2642.
2017. View Article : Google Scholar : PubMed/NCBI
|
|
3
|
Dabestani S, Thorstenson A, Lindblad P,
Harmenberg U, Ljungberg B and Lundstam S: Renal cell carcinoma
recurrences and metastases in primary non-metastatic patients: A
population-based study. World J Urol. 34:1081–1086. 2016.
View Article : Google Scholar : PubMed/NCBI
|
|
4
|
Motzer RJ, Escudier B, McDermott DF,
George S, Hammers HJ, Srinivas S, Tykodi SS, Sosman JA, Procopio G,
Plimack ER, et al CheckMate 025 Investigators, : Nivolumab versus
everolimus in advanced renal-cell carcinoma. N Engl J Med.
373:1803–1813. 2015. View Article : Google Scholar : PubMed/NCBI
|
|
5
|
Lei C, Lv S, Wang H, Liu C, Zhai Q, Wang
S, Cai G, Lu D, Sun Z and Wei Q: Leukemia inhibitory factor
receptor suppresses the metastasis of clear cell renal cell
carcinoma through negative regulation of the yes-associated
protein. DNA Cell Biol. 37:659–669. 2018. View Article : Google Scholar : PubMed/NCBI
|
|
6
|
Chen ZF, Xiao YJ, Huang ZH, Chen T, Zhao
SC, Jiang YD, Wu P and Zheng SB: Quantitative and comparative
proteomics analysis in clear cell renal cell carcinoma and adjacent
noncancerous tissues by 2-D DIGE. Nan Fang Yi Ke Da Xue Xue Bao.
37:1517–1522. 2017.(In Chinese). PubMed/NCBI
|
|
7
|
Silacci P, Mazzolai L, Gauci C,
Stergiopulos N, Yin HL and Hayoz D: Gelsolin superfamily proteins:
Key regulators of cellular functions. Cell Mol Life Sci.
61:2614–2623. 2004. View Article : Google Scholar : PubMed/NCBI
|
|
8
|
Yu FX, Johnston PA, Südhof TC and Yin HL:
gCap39, a calcium ion- and polyphosphoinositide-regulated actin
capping protein. Science. 250:1413–1415. 1990. View Article : Google Scholar : PubMed/NCBI
|
|
9
|
Thompson CC, Ashcroft FJ, Patel S, Saraga
G, Vimalachandran D, Prime W, Campbell F, Dodson A, Jenkins RE,
Lemoine NR, et al: Pancreatic cancer cells overexpress gelsolin
family-capping proteins, which contribute to their cell motility.
Gut. 56:95–106. 2007. View Article : Google Scholar : PubMed/NCBI
|
|
10
|
Renz M, Betz B, Niederacher D, Bender HG
and Langowski J: Invasive breast cancer cells exhibit increased
mobility of the actin-binding protein CapG. Int J Cancer.
122:1476–1482. 2008. View Article : Google Scholar : PubMed/NCBI
|
|
11
|
Ichikawa H, Kanda T, Kosugi S, Kawachi Y,
Sasaki H, Wakai T and Kondo T: Laser microdissection and
two-dimensional difference gel electrophoresis reveal the role of a
novel macrophage-capping protein in lymph node metastasis in
gastric cancer. J Proteome Res. 12:3780–3791. 2013. View Article : Google Scholar : PubMed/NCBI
|
|
12
|
Livak KJ and Schmittgen TD: Analysis of
relative gene expression data using real-time quantitative PCR and
the 2-ΔΔCT method. Methods. 25:402–408. 2001. View Article : Google Scholar : PubMed/NCBI
|
|
13
|
Chen Z, Xiao K, Chen S, Huang Z, Ye Y and
Chen T: Circular RNA hsa_circ_001895 serves as a sponge of
microRNA-296-5p to promote clear cell renal cell carcinoma
progression by regulating SOX12. Cancer Sci. 111:713–726. 2020.
View Article : Google Scholar : PubMed/NCBI
|
|
14
|
Kitamura H, Takahashi A, Takei F, Hotta H,
Miyao N, Shindo T, Igarashi M, Tachiki H, Kunishima Y, Muranaka T,
et al Sapporo Medical University Urologic Oncology Consortium, :
Molecular-targeted therapy and surgery may prolong survival of
renal cell carcinoma patients with bone metastasis: a
multi-institutional retrospective study in Japan. Anticancer Res.
36:5531–5536. 2016. View Article : Google Scholar : PubMed/NCBI
|
|
15
|
Partheen K, Levan K, Osterberg L, Claesson
I, Fallenius G, Sundfeldt K and Horvath G: Four potential
biomarkers as prognostic factors in stage III serous ovarian
adenocarcinomas. Int J Cancer. 123:2130–2137. 2008. View Article : Google Scholar : PubMed/NCBI
|
|
16
|
Li T, Hong X, Zhao J, Teng Y, Zheng J,
Chen H, Chen H and Li H: Gelsolin-like actin-capping protein is
associated with patient prognosis, cellular apoptosis and
proliferation in prostate cancer. Biomarkers Med. 10:1251–1260.
2016. View Article : Google Scholar
|
|
17
|
Yun DP, Wang YQ, Meng DL, Ji YY, Chen JX,
Chen HY and Lu DR: Actin-capping protein CapG is associated with
prognosis, proliferation and metastasis in human glioma. Oncol Rep.
39:1011–1022. 2018.PubMed/NCBI
|
|
18
|
De Corte V, Van Impe K, Bruyneel E,
Boucherie C, Mareel M, Vandekerckhove J and Gettemans J: Increased
importin-beta-dependent nuclear import of the actin modulating
protein CapG promotes cell invasion. J Cell Sci. 117:5283–5292.
2004. View Article : Google Scholar : PubMed/NCBI
|
|
19
|
Lu PJ, Hsu AL, Wang DS, Yan HY, Yin HL and
Chen CS: Phosphoinositide 3-kinase in rat liver nuclei.
Biochemistry. 37:5738–5745. 1998. View Article : Google Scholar : PubMed/NCBI
|
|
20
|
Steger DJ, Haswell ES, Miller AL, Wente SR
and O'Shea EK: Regulation of chromatin remodeling by inositol
polyphosphates. Science. 299:114–116. 2003. View Article : Google Scholar : PubMed/NCBI
|
|
21
|
Pellieux C, Desgeorges A, Pigeon CH,
Chambaz C, Yin H, Hayoz D and Silacci P: Cap G, a gelsolin family
protein modulating protective effects of unidirectional shear
stress. J Biol Chem. 278:29136–29144. 2003. View Article : Google Scholar : PubMed/NCBI
|
|
22
|
Huang S, Chi Y, Qin Y, Wang Z, Xiu B, Su
Y, Guo R, Guo L, Sun H, Zeng C, et al: CAPG enhances breast cancer
metastasis by competing with PRMT5 to modulate STC-1 transcription.
Theranostics. 8:2549–2564. 2018. View Article : Google Scholar : PubMed/NCBI
|
|
23
|
Kim HL, Seligson D, Liu X, Janzen N, Bui
MHT, Yu H, Shi T, Figlin RA, Horvath S and Belldegrun AS: Using
protein expressions to predict survival in clear cell renal
carcinoma. Clin Cancer Res. 10:5464–5471. 2004. View Article : Google Scholar : PubMed/NCBI
|
|
24
|
Visapää H, Bui M, Huang Y, Seligson D,
Tsai H, Pantuck A, Figlin R, Rao JY, Belldegrun A, Horvath S, et
al: Correlation of Ki-67 and gelsolin expression to clinical
outcome in renal clear cell carcinoma. Urology. 61:845–850. 2003.
View Article : Google Scholar : PubMed/NCBI
|
|
25
|
Zhu X, Cai L, Meng Q and Jin X: Gelsolin
inhibits the proliferation and invasion of the 786-0 clear cell
renal cell carcinoma cell line in vitro. Mol Med Rep.
12:6887–6894. 2015. View Article : Google Scholar : PubMed/NCBI
|
|
26
|
Kankaya D, Kiremitci S, Tulunay O and
Baltaci S: Gelsolin, NF-κB, and p53 expression in clear cell renal
cell carcinoma: Impact on outcome. Pathol Res Pract. 211:505–512.
2015. View Article : Google Scholar : PubMed/NCBI
|