Introduction
Ovarian cancer is a malignant tumor of the female
reproductive system characterized by late detection, high risk of
drug resistance, and low 5-year survival rate (1). It was previously reported that the
mechanisms underlying the morbidity, metastasis, drug resistance
and recurrence of ovarian cancer are complex processes involving
multiple factors (2). One reason
for the poor prognosis of ovarian cancer is the lack of early
diagnosis and prognosis markers (2). In addition, the emergence of
chemoresistance in ovarian cancer is a major issue that requires
unique treatment strategies (1,2).
The Hedgehog (HH) signaling pathway is important for
organ and tissue development during embryogenesis (3). It is also involved in various aspects
of tumor formation, metastasis, self-renewal and drug resistance in
adults (3). Some studies have
demonstrated that cancer stem cells are involved in tumor
chemoresistance and recurrence, and the HH signaling pathway was
identified as an important pathway associated with cancer stem
cells in certain tumors (4–8). Gli is a key transcription factor of
the HH signaling pathway, and its expression is considered to
represent the activation of the HH signaling pathway. In the
canonical HH pathway, in the presence of the sonic HH ligand, the
HH signaling pathway is activated and Gli expression is increased
(9). HH pathway activation occurs
not only through canonical HH signaling, but also by
ligand-independent HH signaling, which is known as non-canonical HH
signaling (10). In ovarian cancer,
the role of the HH signaling pathway and the function of its key
members remains to be elucidated. While some studies have reported
that Gli1 is associated with platinum resistance in ovarian cancer
(11,12), others suggested that Gli2 has more
predictive value (13). Hence, the
present study aimed to clarify these controversial findings.
The mechanism underlying the regulation of cancer
stem cells by the HH signaling system is unclear, despite numerous
studies on this topic. Homeobox protein NANOG (NANOG) is
hypothesized to regulate cell self-renewal and chemotherapy
resistance in several tumors and serve as a marker for certain
cancer stem cells, such as hepatocellular carcinoma and head and
neck tumors (13–16). Additionally, a previous study
revealed that in myeloid leukemia tumors, NANOG is closely
associated with and is a downstream factor of Gli (16). However, little research has
investigated the association between Gli and NANOG in ovarian
cancer. Therefore, in the present study, clinical ovarian cancer
tissue samples and cultured ovarian cancer cells were employed to
explore whether the HH signaling pathway was involved in the tumor
development, platinum resistance and prognosis of ovarian cancer
and to clarify the relationship between NANOG and Gli.
Materials and methods
Specimen and clinical data
collection
Specimens from 61 cases of epithelial ovarian cancer
(EOC) were collected at The Third Hospital of Hebei Medical
University (Shijiazhuang, China) between January 2010 and January
2013. All cases were diagnosed as EOC via postoperative
pathological examination. The initial surgical procedure involved
ovarian cancer staging or cytoreductive surgery, followed by
platinum-based combination chemotherapy. Exclusion criteria
included the presence of other pathological types of ovarian
tumors, tumor recurrence and secondary surgery. The age ranges of
the patients was 24–84 years. Tumors were divided into serous
adenocarcinoma, mucinous adenocarcinoma and endometrioid carcinoma
according to the World Health Organization histological
classification system for ovarian tumors (17). Surgical pathological staging and
histopathological grading were performed according to the 2009
guidelines of the International Federation of Gynaecology and
Obstetrics (18). Among the 61
patients, 17 cases were platinum-resistant (recurred within 6
months of the initial withdrawal of platinum-based chemotherapy)
and 44 cases were platinum-sensitive (initial relapse with
platinum-based chemotherapy after ≥6 months).
The patients were followed up between July 2010 and
July 2019. The follow-up information included age, pathological
type, operative-pathological stage, degree of tissue
differentiation, lymph node metastasis status, and sensitivity of
postoperative platinum-based combination chemotherapy. For deceased
patients, the date of death was recorded. The date of the last
follow-up was recorded for patients who were lost to follow-up. All
patients provided written informed consent prior to inclusion in
the study. The ethics committee of The Third Hospital of Hebei
Medical University approved the study protocol (approval no.
W2020-081-1).
Immunohistochemistry
Tumor tissues were fixed in 10% formalin for 24 h at
room temperature, embedded in paraffin and serially sectioned (4-µm
thickness), then dried at 60°C. The sections were routinely dewaxed
in water. Antigen retrieval was performed by heating the section in
citrate buffer (pH 6.0), maintaining it at 92–98°C for 10 min and
then naturally cooling it to room temperature. The specimens were
then rinsed three times in PBS (pH 7.4) for 5 min. Sections were
incubated in 3% hydrogen peroxide solution for 10 min at room
temperature in the dark, then rinsed three times in PBS for 3 min,
followed by blocking in 5% goat serum (Wuhan Servicebio Technology
Co., Ltd.) for 10–15 min at room temperature. The sections were
incubated with primary antibodies against Gli1 (cat. no. ab151796;
1:500; Abcam), Gli2 (cat. no. 18989-1-AP; 1:500; ProteinTech Group,
Inc.) and NANOG (cat. no. ab109250; 1:500; Abcam) at 4°C overnight.
The sections were washed in PBS and incubated with HRP-conjugated
anti-rabbit (cat. no. GB23303; 1:200; Wuhan Servicebio Technology
Co., Ltd.) at 37°C for 20 min, then rinsed three times in PBS for 5
min. The specimens were incubated in horseradish-labeled
streptavidin-avidin working solution at 37°C for 20 min and rinsed
three times in PBS for 5 min, followed by the addition of
3′-diaminobenzidine solution and observation for staining under a
microscope for 5 min. The sections were then rinsed under tap water
and subjected to hematoxylin counterstaining for 3 min at room
temperature and hydrochloric acid alcohol differentiation. Positive
and negative controls were used during the staining process. Human
endometrial carcinoma tissue was used as a positive control. For
negative controls, the primary antibody was replaced with PBS.
Two double-blinded independent observers evaluated
the immunostaining results by light microscope. The stained
sections were assessed using the immunoreactive scoring method
recommended by Remmele and Stegner (19), with the intensity of staining scored
as follows: i) Negative result, 0 points; ii) light yellow
staining, 1 point; iii) light brown staining, 2 points; and iv)
brown staining, 3 points. The rating range was divided into the
following: i) No staining, 0 points in the entire film; ii) 1–10%
staining, 1 point; iii) 10–50% staining, 2 points; iv) 50–80%
staining, 3 points; and v) >80% staining, 4 points. The product
of intensity rating and range rating was taken as the total score
for analysis, and positivity was defined as a total score >3.
Positive nuclear staining was defined if >10% of cells stained
yellow or brown.
Cell culture
SKOV3 cells were donated by the Department of
Immunology, Hebei Medical University (Shijiazhuang, China), and
seeded at a density of 2–5×10⁵ cells/ml in RPMI-1640
medium (Gibco; Thermo Fisher Scientific, Inc.) containing 10% FBS
(Zeta-Life, Inc.), penicillin (100 U/ml) and streptomycin (100
µg/ml), in 5% carbon dioxide at 37°C. In the logarithmic growth
phase, the cells were digested using 0.25% trypsin and 0.02%
ethylenediaminetetraacetic acid, and passaged or collected for
experiments. Recombinant human sonic HH (SHH) protein (1,000 ng/ml;
PeproTech, Inc.) was exogenously added to activate the HH signaling
pathway. Conversely, to inhibit Gli, cells were treated with the
Gli antagonist GANT61 (50 µmol/l; Selleck Chemicals).
Reverse transcription-quantitative PCR
(RT-qPCR)
After treating the cells with SHH and GANT61 for 24
h according to the protocol described above, RNA was extracted with
TRIzol® (cat. no. 15596026; Invitrogen; Thermo Fisher
Scientific, Inc.), and the concentration and purity were determined
via spectrophotometry. The PrimeScript RT Reagent Kit with gDNA
Eraser (Takara Bio, Inc.) was used for RT to cDNA, according to the
manufacturer's instructions, and the amplification system was
configured according to the Takara TB Green Premix Ex Taq II
(Takara Bio, Inc.). Thermocycling conditions were as follows: 95°C
for 30 sec, then 95°C for 30 sec and 60–62°C for 30 sec for 40
cycles. The following primer pairs were used for qPCR: Gli1
forward, 5′-TGGAGAAGCCGAGCCGAGTATC-3′ and reverse,
5′-TGGAGCAGGACGGTCAGCAG-3′; Gli2 forward,
5′-CCTGCACGTCAGAGCCATCAAG-3′ and reverse,
5′-TCTCCACGCCACTGTCATTGTTG-3′; NANOG forward,
5′-GCCTCCAGCAGATGCAAGAACTC-3′ and reverse,
5′-CCAGGTCTGGTTGCTCCACATTG-3′; p-glycoprotein (MDR1) forward,
5′-GATTGCTCACCGCCTGTCCAC-3′ and reverse,
5′-CGTGCCATGCTCCTTGACTCTG-3′; and GADPH forward,
5′-CAGGAGGCATTGCTGATGAT-3′ and reverse, 5′-GAAGGCTGGGGCTCATTT-3′.
GAPDH was used as a reference gene. Gene expression was assessed
using the 2−ΔΔCq method (20).
Western blotting
Total protein extraction was performed using RIPA
buffer (cat. no. 89900; Thermo Fisher Scientific, Inc.), protein
concentration was detected using a BCA protein assay kit (cat. no.
23225; Pierce; Thermo Fisher Scientific, Inc.), and 50 µg protein
was loaded on a 10% polyacrylamide gel and separated. Separated
proteins were then transferred to nitrocellulose membranes (cat.
no. IPVH00010; EMD Millipore), and membranes were blocked with 5%
skimmed milk at room temperature for 1 h. Then, membranes were
incubated with the following primary antibodies for 12–16 h at 4°C:
Rabbit polyclonal anti-GLI1 (cat. no. ab151796; 1:1,000; Abcam),
rabbit polyclonal anti-GLI2 (cat. no. 18989-1-AP; 1:1,000;
ProteinTech Group, Inc.), rabbit polyclonal anti-NANOG (cat. no.
ab109250; 1:1,000; Abcam), anti-MDR1 (cat. no. BS-1468R; 1:2,000;
BIOSS) and mouse monoclonal anti-β actin (cat. no. GB12001;
1:3,000; Wuhan Servicebio Technology Co., Ltd.). Following which,
membranes were incubated for 30 min at 37°C with HRP-conjugated
anti-rabbit (cat. no. GB23303; 1:3,000; Wuhan Servicebio Technology
Co., Ltd.) and anti-mouse (cat. no. GB23301; 1:3,000; Wuhan
Servicebio Technology Co., Ltd.) secondary antibodies. Images of
the immunoblot bands were captured on X-ray film (Kodak) and then
scanned with an Epson scanner (Epson V300 Photo; Epson America,
Inc.). Bands were semi-quantified by densitometric analysis using
AlphaEaseFC™ software version 4.0 (Genetic Technologies, Inc.).
Proliferation assay
A single-cell suspension of SKOV3 cells was adjusted
to a density of 2–5×10⁴ cells/ml, plated into a 96-well
plate (100 µl/well, 3 replicate wells per condition) and the plates
were incubated for 24 h. Different groups were classified according
to the following treatments to activate the HH signaling pathway or
inhibit Gli: i) SHH at concentrations of 500, 1,000 and 1,500
ng/ml; ii) GANT61 at concentrations of 20, 50 and 100 µmol/l; iii)
the negative control group without any treatment; and iv) the blank
control in the form of cell-free medium. After 24, 48 or 72 h of
drug treatment, 10 µl Cell Counting Kit-8 (CCK-8) solution
(Zeta-Life, Inc.) was added to each well. The specimens were then
cultured at 37°C for 4 h, and the absorbance at a wavelength of 450
nm was measured.
Determination of the IC50
of cisplatin in SKOV3 cells
Cells were plated as described for the proliferation
assay. The drug concentrations were selected according to the
results of the proliferation assay and treatment groups were
prepared as follows: i) 1,000 ng/ml SHH for 24 h; ii) 50 µmol/l
GANT61 for 24 h; and iii) a negative control group without any
treatment. After 24 h, each treatment group was divided into six
subgroups, and cisplatin was added at concentrations of 0.1, 0.2,
0.4, 0.8, 1.5, 2.0, 3.0 and 4.0 µg/ml. The five concentrations in
each group were chosen based on the concentration range that
resulted in different survival rates. After 24, 48 or 72 h, 10 µl
CCK-8 solution was added to each well and the absorbance at a
wavelength of 450 nm was measured, after culturing at 37°C for 4 h.
The cell inhibition rate was calculated, and the IC50 of
different cisplatin concentrations on cells was determined via
Probit Analysis using SPSS version 17.0 (IBM Corp.).
Colony formation assay
SKOV3 cells (2–5×10⁵ cells/ml) were
prepared as a single-cell suspension and seeded into a six-well
plate. Once the cells were attached, the following treatments were
added: i) 1,000 ng/ml SHH for 24 h; ii) 50 µmol/l GANT61 for 24 h;
and iii) no treatment in the negative control group. After 24 h of
culture, they were digested into individual cells and re-suspended
in RPMI-1640 medium containing 10% fetal calf serum (Zeta-Life,
Inc.). The cells were seeded into a six-well plate at
1×10³ cells/well and gently rotated to disperse the
cells uniformly. The cells were incubated for 1–2 weeks at 37°C, 5%
carbon dioxide and saturated humidity. The solution was changed
every 2 days and cell growth was observed. After 2 weeks, the cells
were harvested for observation of colony formation. The cells were
fixed with formaldehyde for 30 min at room temperature, then
stained with 10% Giemsa stain for 15 min at room temperature. The
staining solution was then washed away slowly with running water
and cells were air-dried, observed with a light microscope
(magnification, ×200) and photographed. A colony was defined as
>50 cells.
Statistical analysis
Experimental data were analyzed using SPSS version
17.0 (SPSS, Inc.). Correlation analysis was performed using
Spearman's correlation coefficient. Quantitative results are
expressed as the mean ± SD, and differences between groups were
assessed using ANOVA followed by Tukey's post hoc test. The
association between protein expression and the
clinical-pathological diagnosis of EOC was assessed using the
χ2 or Fisher's exact test (for contingency tables that
contain cells with <6 individuals). Survival rates were analyzed
using Probit Analysis. Survival curves were plotted and compared
using the Kaplan-Meier method with a log-rank test, and
multi-factorial analysis was performed using Cox regression in
SSPS. P<0.05 was considered to indicate a statistically
significant difference.
Results
Expression of molecules in EOC and
association with clinicopathological features
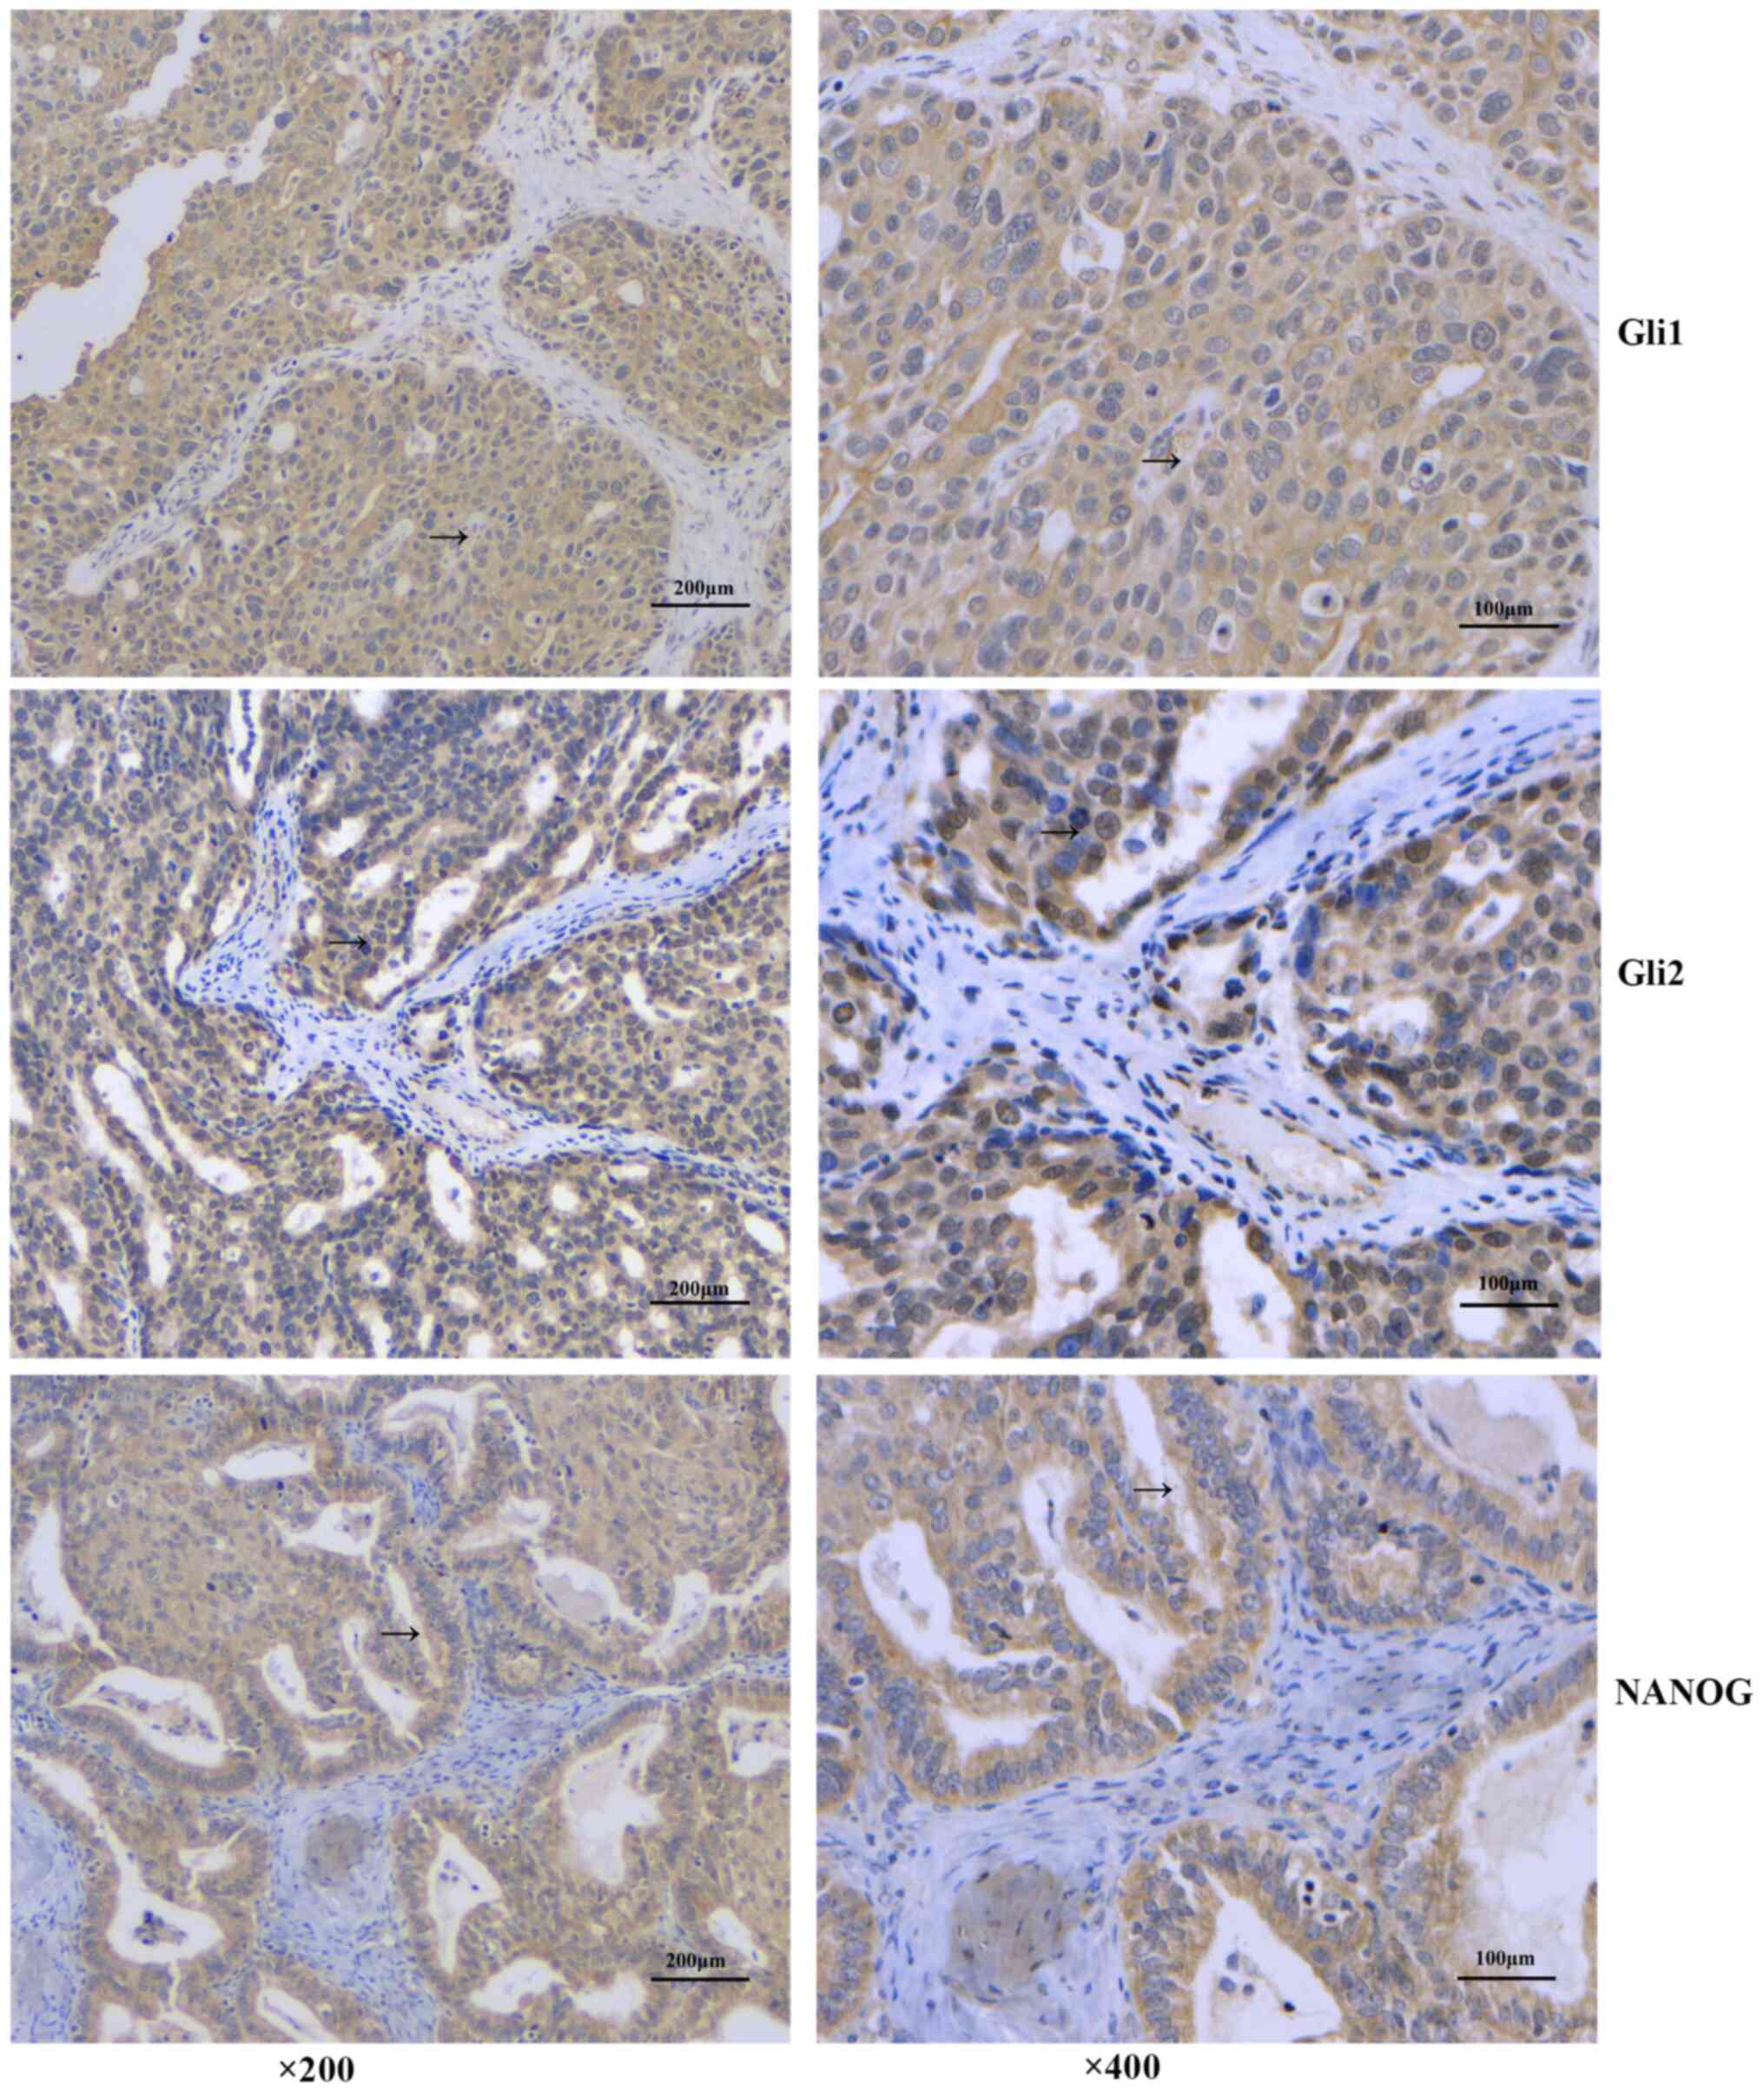
Gli1 and Gli2 expression in 61 cases of EOC were
detected by immunohistochemistry (Fig.
1). The results showed that Gli1 was mainly expressed in the
cytoplasm, and there were 38 cases positive for cytoplasmic Gli1
(62.3%). There were no significant associations between Gli1
expression and patient age, lymph node metastasis, pathological
tissue type and histopathological grade (P>0.05). The
cytoplasmic expression of Gli1 was significantly higher among
patients with platinum-resistant disease (P=0.009) and was
associated with the pathological surgical stage of the patients. In
advanced EOC, the proportion of Gli1+ cases was higher
compared with Gli1− cases (P=0.023) (Fig. 1; Table
I).
 | Table I.Association between Gli1 expression
and the clinical and pathological characteristics of patients with
EOC. |
Table I.
Association between Gli1 expression
and the clinical and pathological characteristics of patients with
EOC.
|
|
| Gli1
expression |
|
| Nuclear Gli1
expression |
|
|
|---|
|
|
|
|
|
|
|
|
|
|---|
| Parameter | n | Positive | Negative | χ2 | P-value | Positive | Negative | χ2 | P-value |
|---|
| Age, years |
|
|
| 0.752 | 0.386 |
|
| 0.411 | 0.734 |
|
<50 | 20 | 14 | 6 |
|
| 3 | 17 |
|
|
|
≥50 | 41 | 24 | 17 |
|
| 9 | 32 |
|
|
| Tissue type |
|
|
| 4.197 | 0.296 |
|
| 0.393 | 0.943 |
|
Serous | 38 | 24 | 14 |
|
| 7 | 31 |
|
|
|
Mucinous | 10 | 4 | 6 |
|
| 2 | 8 |
|
|
|
Endometrioid | 10 | 7 | 3 |
|
| 2 | 8 |
|
|
|
Other | 3 | 3 | 0 |
|
| 1 | 2 |
|
|
| Stage |
|
|
| 5.152 | 0.023 |
|
| 0.588 | 0.518 |
|
I–II | 21 | 9 | 12 |
|
| 3 | 18 |
|
|
|
III–IV | 40 | 29 | 11 |
|
| 9 | 31 |
|
|
| Histological
grade |
|
|
| 1.340 | 0.247 |
|
| 1.605 | 0.309 |
| G1 | 21 | 11 | 10 |
|
| 6 | 15 |
|
|
|
G2-G3 | 40 | 27 | 13 |
|
| 6 | 34 |
|
|
| Lymph node
metastasis |
|
|
| 0.831 | 0.362 |
|
| 2.706 | 0.182 |
|
Yes | 23 | 16 | 7 |
|
| 7 | 16 |
|
|
| No | 38 | 22 | 16 |
|
| 5 | 33 |
|
|
| Platinum
sensitivity |
|
|
| 6.752 | 0.009 |
|
| 1.415 | 0.287 |
|
Resistant | 17 | 15 | 2 |
|
| 5 | 7 |
|
|
|
Sensitive | 44 | 23 | 21 |
|
| 12 | 37 |
|
|
The nuclear expression of Gli1 was low, with only 12
cases (19.67%) exhibiting nuclear localization. Nuclear Gli1
expression was not significantly associated with any
clinicopathological features (P>0.05) (Table I).
By contrast, Gli2 was expressed in both the
cytoplasm and nucleus of EOC samples. A total of 34 cases tested
Gli2+ in the cytoplasm (55.74%). Unlike cytoplasmic
Gli1, cytoplasmic Gli2 expression was not associated with any
clinicopathological features (P>0.05) (Table II).
| Table II.Association between Gli2 expression
and the clinical and pathological characteristics of patients with
EOC. |
Table II.
Association between Gli2 expression
and the clinical and pathological characteristics of patients with
EOC.
|
|
| Gli2
expression |
|
| Nuclear Gli2
expression |
|
|
|---|
|
|
|
|
|
|
|
|
|
|---|
| Parameter | n | Positive | Negative | χ2 | P-value | Positive | Negative | χ2 | P-value |
|---|
| Age, years |
|
|
| 0.007 | 0.935 |
|
| 0.198 | 0.656 |
|
<50 | 20 | 11 | 9 |
|
| 11 | 9 |
|
|
|
≥50 | 41 | 23 | 18 |
|
| 25 | 16 |
|
|
| Tissue type |
|
|
| 3.684 | 0.298 |
|
| 2.443 | 0.486 |
|
Serous | 38 | 20 | 18 |
|
| 22 | 16 |
|
|
|
Mucinous | 10 | 4 | 6 |
|
| 6 | 4 |
|
|
|
Endometrioid | 10 | 8 | 2 |
|
| 5 | 5 |
|
|
|
Other | 3 | 2 | 1 |
|
| 3 | 0 |
|
|
| Stage |
|
|
| 0.856 | 0.355 |
|
| 3.457 | 0.063 |
|
I–II | 21 | 10 | 11 |
|
| 9 | 12 |
|
|
|
III–IV | 40 | 24 | 16 |
|
| 27 | 13 |
|
|
| Histological
grade |
|
|
| 0.556 | 0.355 |
|
| 0.583 | 0.445 |
| G1 | 21 | 10 | 11 |
|
| 11 | 10 |
|
|
|
G2-G3 | 40 | 24 | 16 |
|
| 25 | 15 |
|
|
| Lymph node
metastasis |
|
|
| 0.190 | 0.663 |
|
| 0.191 | 0.662 |
|
Yes | 23 | 12 | 11 |
|
| 14 | 9 |
|
|
| No | 38 | 22 | 16 |
|
| 22 | 16 |
|
|
| Platinum
sensitivity |
|
|
| 2.107 | 0.147 |
|
| 16.367 | <0.001 |
|
Resistant | 17 | 12 | 5 |
|
| 17 | 0 |
|
|
|
Sensitive | 44 | 22 | 22 |
|
| 19 | 25 |
|
|
There were 36 cases (59.02%) with positive nuclear
expression of Gli2, but there were no significant associations
between nuclear Gli2 expression and age, lymph node metastasis,
pathological tissue type, disease stage and histopathological grade
(P>0.05). However, nuclear Gli2 expression was significantly
associated with platinum resistance in patients with EOC (Table II). Among the platinum-resistant
cases, there were significantly more patients with nuclear
Gli2+ compared with nuclear Gli2− expression
(P<0.001).
Among the 61 patients with EOC, there were 36
NANOG+ cases (59.0%), and the protein was mainly
expressed in the cytoplasm (Fig.
1). There was no significant difference in expression between
different age groups (P>0.05). Although there was no significant
association with lymph node metastasis, tumor differentiation or
histological type (P>0.05), NANOG expression was associated with
disease staging and platinum resistance, and its expression rate
increased upon increasing stage (P<0.001). NANOG−
cases were more sensitive to platinum-based therapy, whereas
NANOG+ cases were significantly drug-resistant (P=0.021)
(Fig. 1; Table III).
| Table III.Association between NANOG expression
and the clinical and pathological characteristics of patients with
epithelial ovarian cancer. |
Table III.
Association between NANOG expression
and the clinical and pathological characteristics of patients with
epithelial ovarian cancer.
|
|
| NANOG
expression |
|
|
|---|
|
|
|
|
|
|
|---|
| Parameter | n | Positive | Negative | χ2 | P-value |
|---|
| Age, years |
|
|
| 0.440 | 0.507 |
|
<50 | 20 | 13 | 7 |
|
|
|
≥50 | 41 | 23 | 18 |
|
|
| Tissue type |
|
|
| 1.841 | 0.606 |
|
Serous | 38 | 24 | 14 |
|
|
|
Mucinous | 10 | 4 | 6 |
|
|
|
Endometrioid | 10 | 6 | 4 |
|
|
|
Other | 3 | 2 | 1 |
|
|
| Stage |
|
|
| 12.273 | <0.001 |
|
I–II | 21 | 6 | 15 |
|
|
|
III–IV | 40 | 30 | 10 |
|
|
| Histological
grade |
|
|
| 3.457 | 0.063 |
| G1 | 21 | 9 | 12 |
|
|
|
G2-G3 | 40 | 27 | 13 |
|
|
| Lymph node
metastasis |
|
|
| 1.699 | 0.192 |
|
Yes | 23 | 16 | 7 |
|
|
| No | 38 | 20 | 18 |
|
|
| Platinum
sensitivity |
|
|
| 5.307 | 0.021 |
|
Resistant | 17 | 14 | 3 |
|
|
|
Sensitive | 44 | 22 | 22 |
|
|
Correlation of Gli expression with
NANOG in EOC tissue
The protein expression of Gli1 in the cytoplasm was
significantly positively correlated with that of NANOG in EOC
tissues (r=0.796; P<0.001). Cytoplasmic Gli2 expression was also
significantly positively correlated with NANOG levels (r=0.264;
P=0.039). However, there was no statistically significant
correlation between nuclear Gli2 expression and NANOG levels
(r=0.187; P=0.145) (Table IV).
| Table IV.Correlation between Gli expression
and NANOG in EOC tissue. |
Table IV.
Correlation between Gli expression
and NANOG in EOC tissue.
|
| NANOG
expression |
|
|
|
|---|
|
|
|
|
|
|
|---|
| Gli expression | Positive, n
(%) | Negative, n
(%) | Total, n (%) | P-value | r-value |
|---|
| Cytoplasmic
Gli1 | 36 (59.0) | 25 (41.0) | 61 (100) |
<0.001a | 0.796 |
|
Positive | 34 (55.7) | 4 (6.5) | 38 (62.3) |
|
|
|
Negative | 2 (3.3) | 21 (34.4) | 23 (37.7) |
|
|
| Nuclear Gli1 | 36 (59.0) | 25 (41.0) | 61 (100) | 0.397 | 0.077 |
|
Positive | 8 (13.1) | 4 (6.6) | 12 (19.7) |
|
|
|
Negative | 28 (45.9) | 21 (34.4) | 49 (80.3) |
|
|
| Cytoplasmic
Gli2 | 36 (59.0) | 25 (41.0) | 61 (100) | 0.039a | 0.264 |
|
Positive | 24 (39.3) | 10 (16.4) | 34 (55.7) |
|
|
|
Negative | 12 (19.7) | 15 (24.6) | 27 (44.3) |
|
|
| Nuclear Gli2 | 12 (19.7) | 13 (21.3) | 25 (41.0) | 0.145 | 0.187 |
|
Positive | 24 (39.3) | 12 (19.7) | 36 (59.0) |
|
|
|
Negative | 36 (59.0) | 25 (41.0) | 61 (100) |
|
|
Gli and NANOG expression are
negatively associated with EOC patient survival
Kaplan-Meier analysis showed that the median
survival time of the cytoplasmic Gli1+ group was 32
months, and that of the cytoplasmic Gli1− group was 68
months. There was a significant difference in survival rates
between the two groups (χ2=8.892; P=0.003) (Fig. 2A). There was no significant
difference in survival rates between the nuclear Gli1+
and nuclear Gli1− groups (P=0.207) (data not shown).
The median survival time of the nuclear
Gli2+ group was 30 months, and that of the
Gli2− group was 68 months, which also showed a
significant difference (χ2=11.717; P=0.001) (Fig. 2B). No significant difference was
found in survival rates between the cytoplasmic Gli2+
and cytoplasmic Gli2− groups (P=0.302) (data not
shown).
Similar to the results of Gli1 and Gli2, the median
survival duration of the NANOG+ group was 32 months, and
that of the NANOG− group was 69 months. There was a
significant difference in survival between the two groups
(χ2=14.824; P<0.001) (Fig. 2C).
The effects of all three markers on survival were
further analyzed. Three groups were excluded due to low sample
numbers from the analysis. The remaining four groups (55 cases)
were analyzed, and the results showed that the median survival
duration of the cytoplasmic Gli1+, nuclear
Gli2+ and NANOG+ group was 26 months, the
cytoplasmic Gli1+, nuclear Gli2− and
NANOG+ group was 45 months, the cytoplasmic
Gli1−, nuclear Gli2+ and NANOG−
group was 48 months and the cytoplasmic Gli1−, nuclear
Gli2− and NANOG− group was 69 months.
Overall, Gli1, Gli2 and NANOG expression were significantly
associated with reduced survival of patients with EOC
(χ2=19.669; P<0.001) (Fig. 2D). Cox regression was applied to
analyze the effects of cytoplasmic Gli1, nuclear Gli2 and NANOG
expression on survival. The results showed that the expression of
nuclear Gli2 and NANOG are independent prognostic factors for the
survival time of patients. The survival time of nuclear
Gli2+ patients (P=0.001; HR, 2.896; 95% CI, 1.520–5.517)
and NANOG+ patients (P=0.002; HR, 2.857; 95% CI,
1.470–5.550) are shorter (Table
V).
| Table V.Effects of nuclear Gli2 and NANOG
expression on survival of patients with EOC determined by Cox
regression analysis. |
Table V.
Effects of nuclear Gli2 and NANOG
expression on survival of patients with EOC determined by Cox
regression analysis.
| Group | P-value | HR | 95% CI |
|---|
| Nuclear
Gli2+ | 0.001a | 2.896 | 1.520–5.517 |
|
NANOG+ | 0.002a | 2.857 | 1.470–5.550 |
Expression of molecules in ovarian
cancer cells after treatment with GANT61
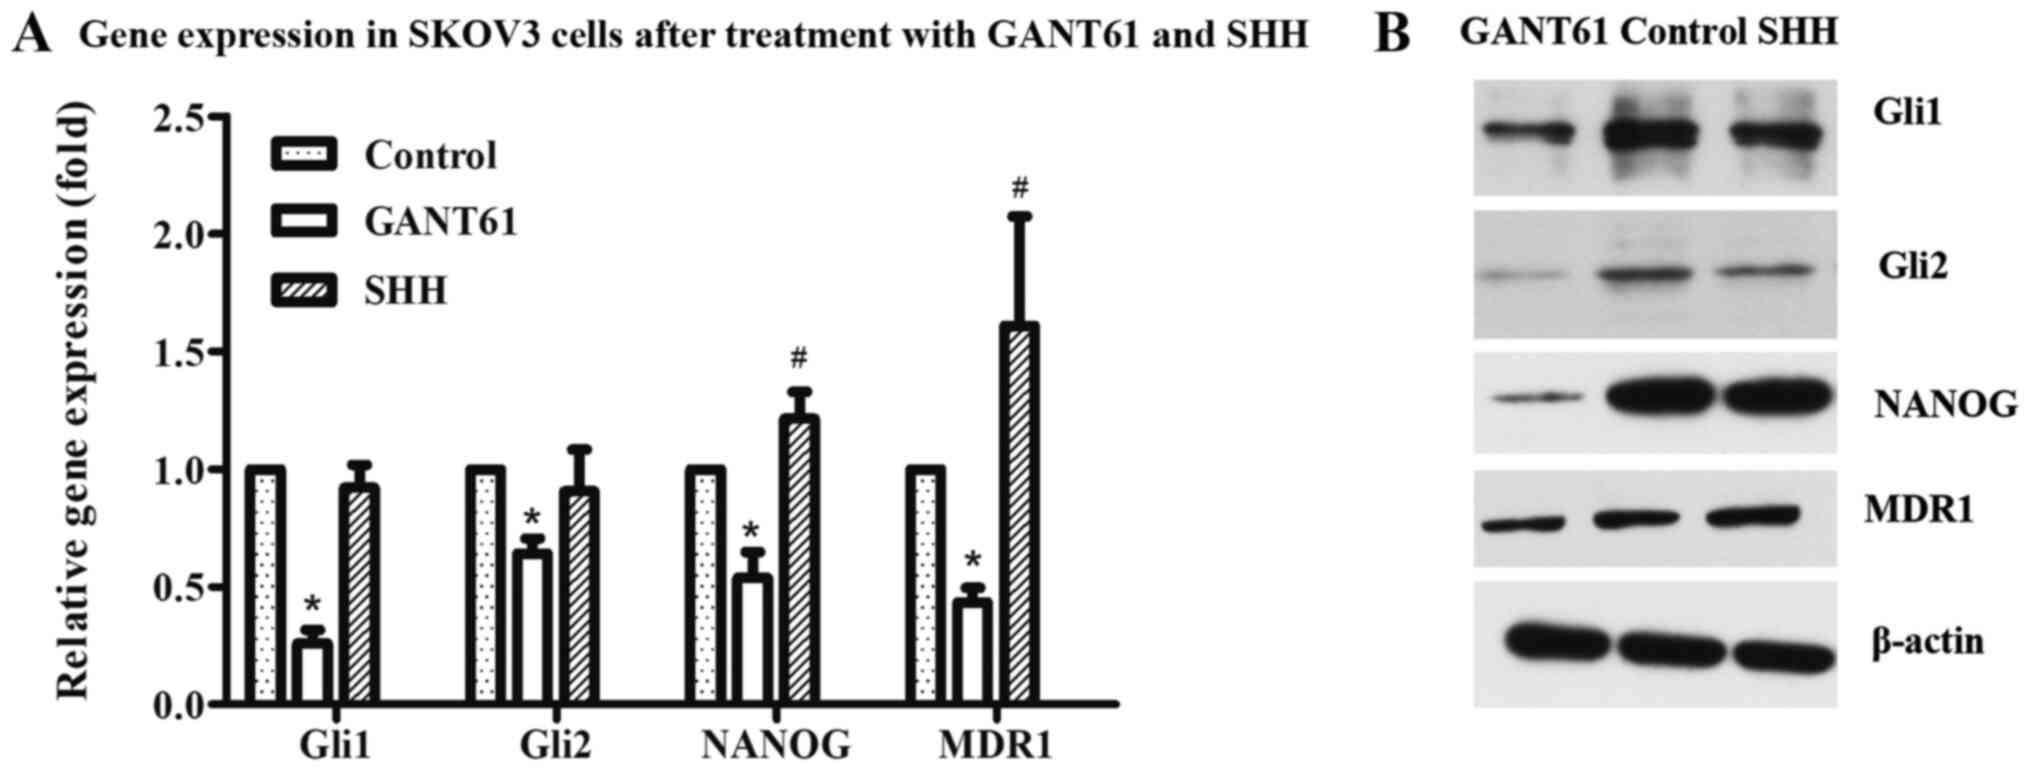
Following treatment with the Gli1 and Gli2 inhibitor
GANT61, the expression of Gli1, Gli2 and NANOG were detected via
RT-qPCR and western blotting in ovarian cancer cells. The results
showed that Gli1 and Gli2 expression significantly decreased as
expected, as did the levels of NANOG (Fig. 3A and B). In addition, after
treatment with GANT61 and SHH, the expression of the
drug-resistance associated transporter, MDR1, in SKOV3 cells was
also examined. GANT61 treatment resulted in a decrease in MDR1
levels (Fig. 3A and B).
Gli promotes ovarian cancer cell
proliferation
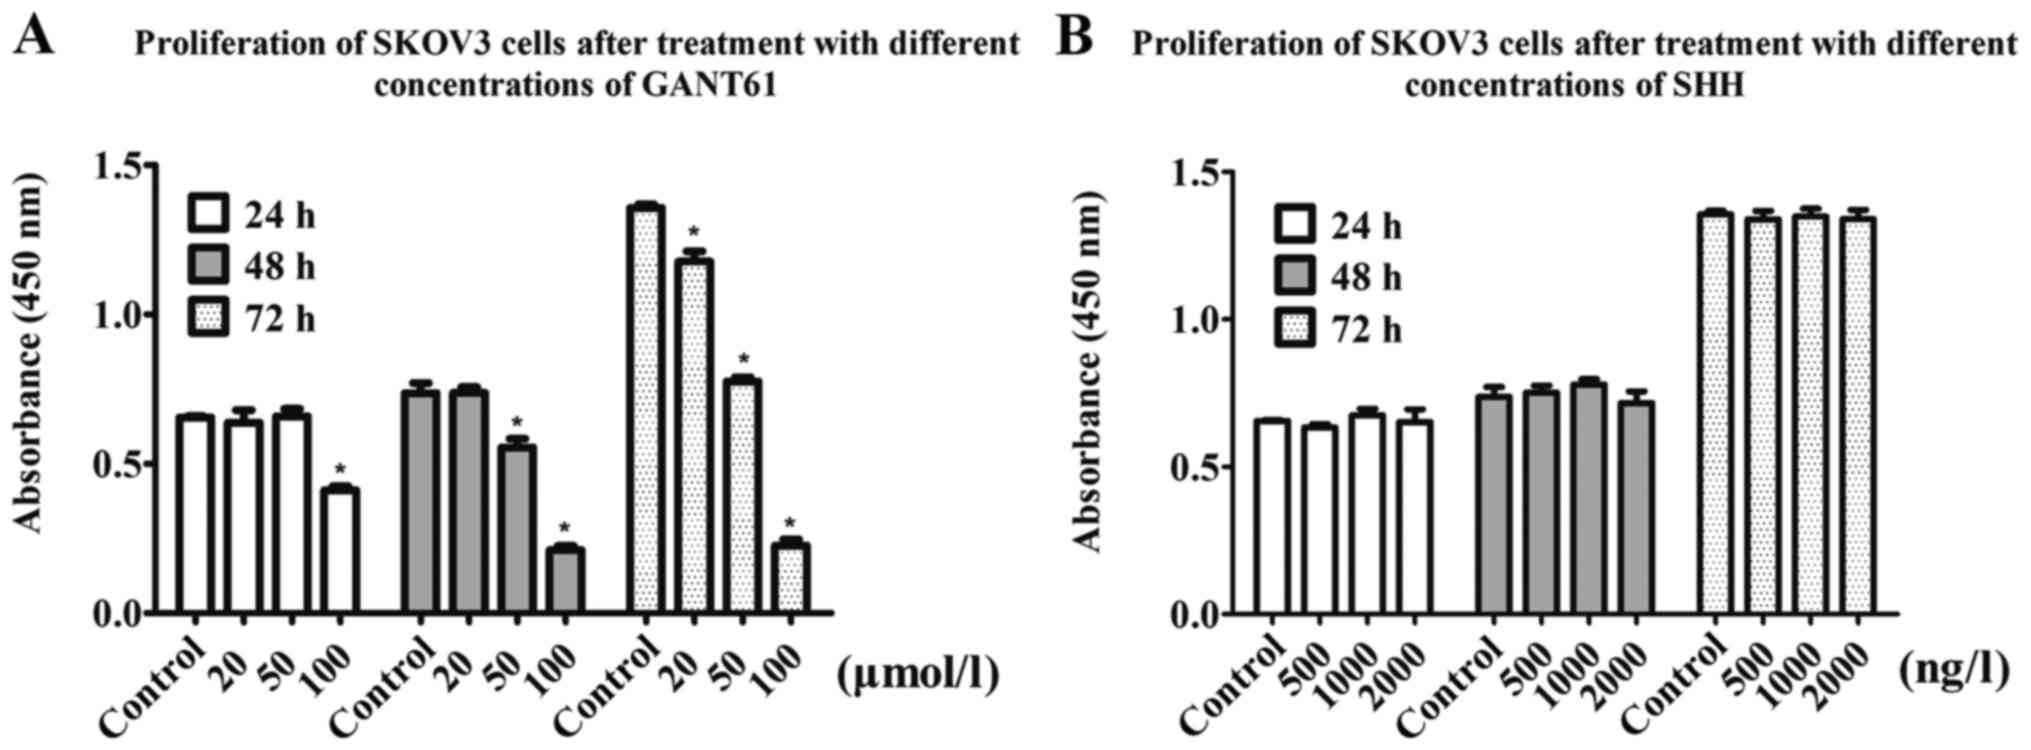
The results of the CCK-8 assays showed that the
proliferation rate of SKOV3 cells in the GANT61 treatment group
decreased in a time- and concentration-dependent manner. After 24
h, the 100 µmol/l group showed a 37.69% decrease in proliferation
compared with the control group. When cells were treated with 50
µmol/l GANT61 for 48 h, the optical density (OD) value decreased by
27%, while the 100 µmol/l group showed a 72% decrease in the OD
value. After 72 h, the 20, 50 and 100 µmol/l groups showed 12.6, 45
and 80% decreases in the OD value, respectively (Fig. 4A). Collectively, this suggested that
Gli inhibition via GANT61 treatment reduced ovarian cancer cell
proliferation.
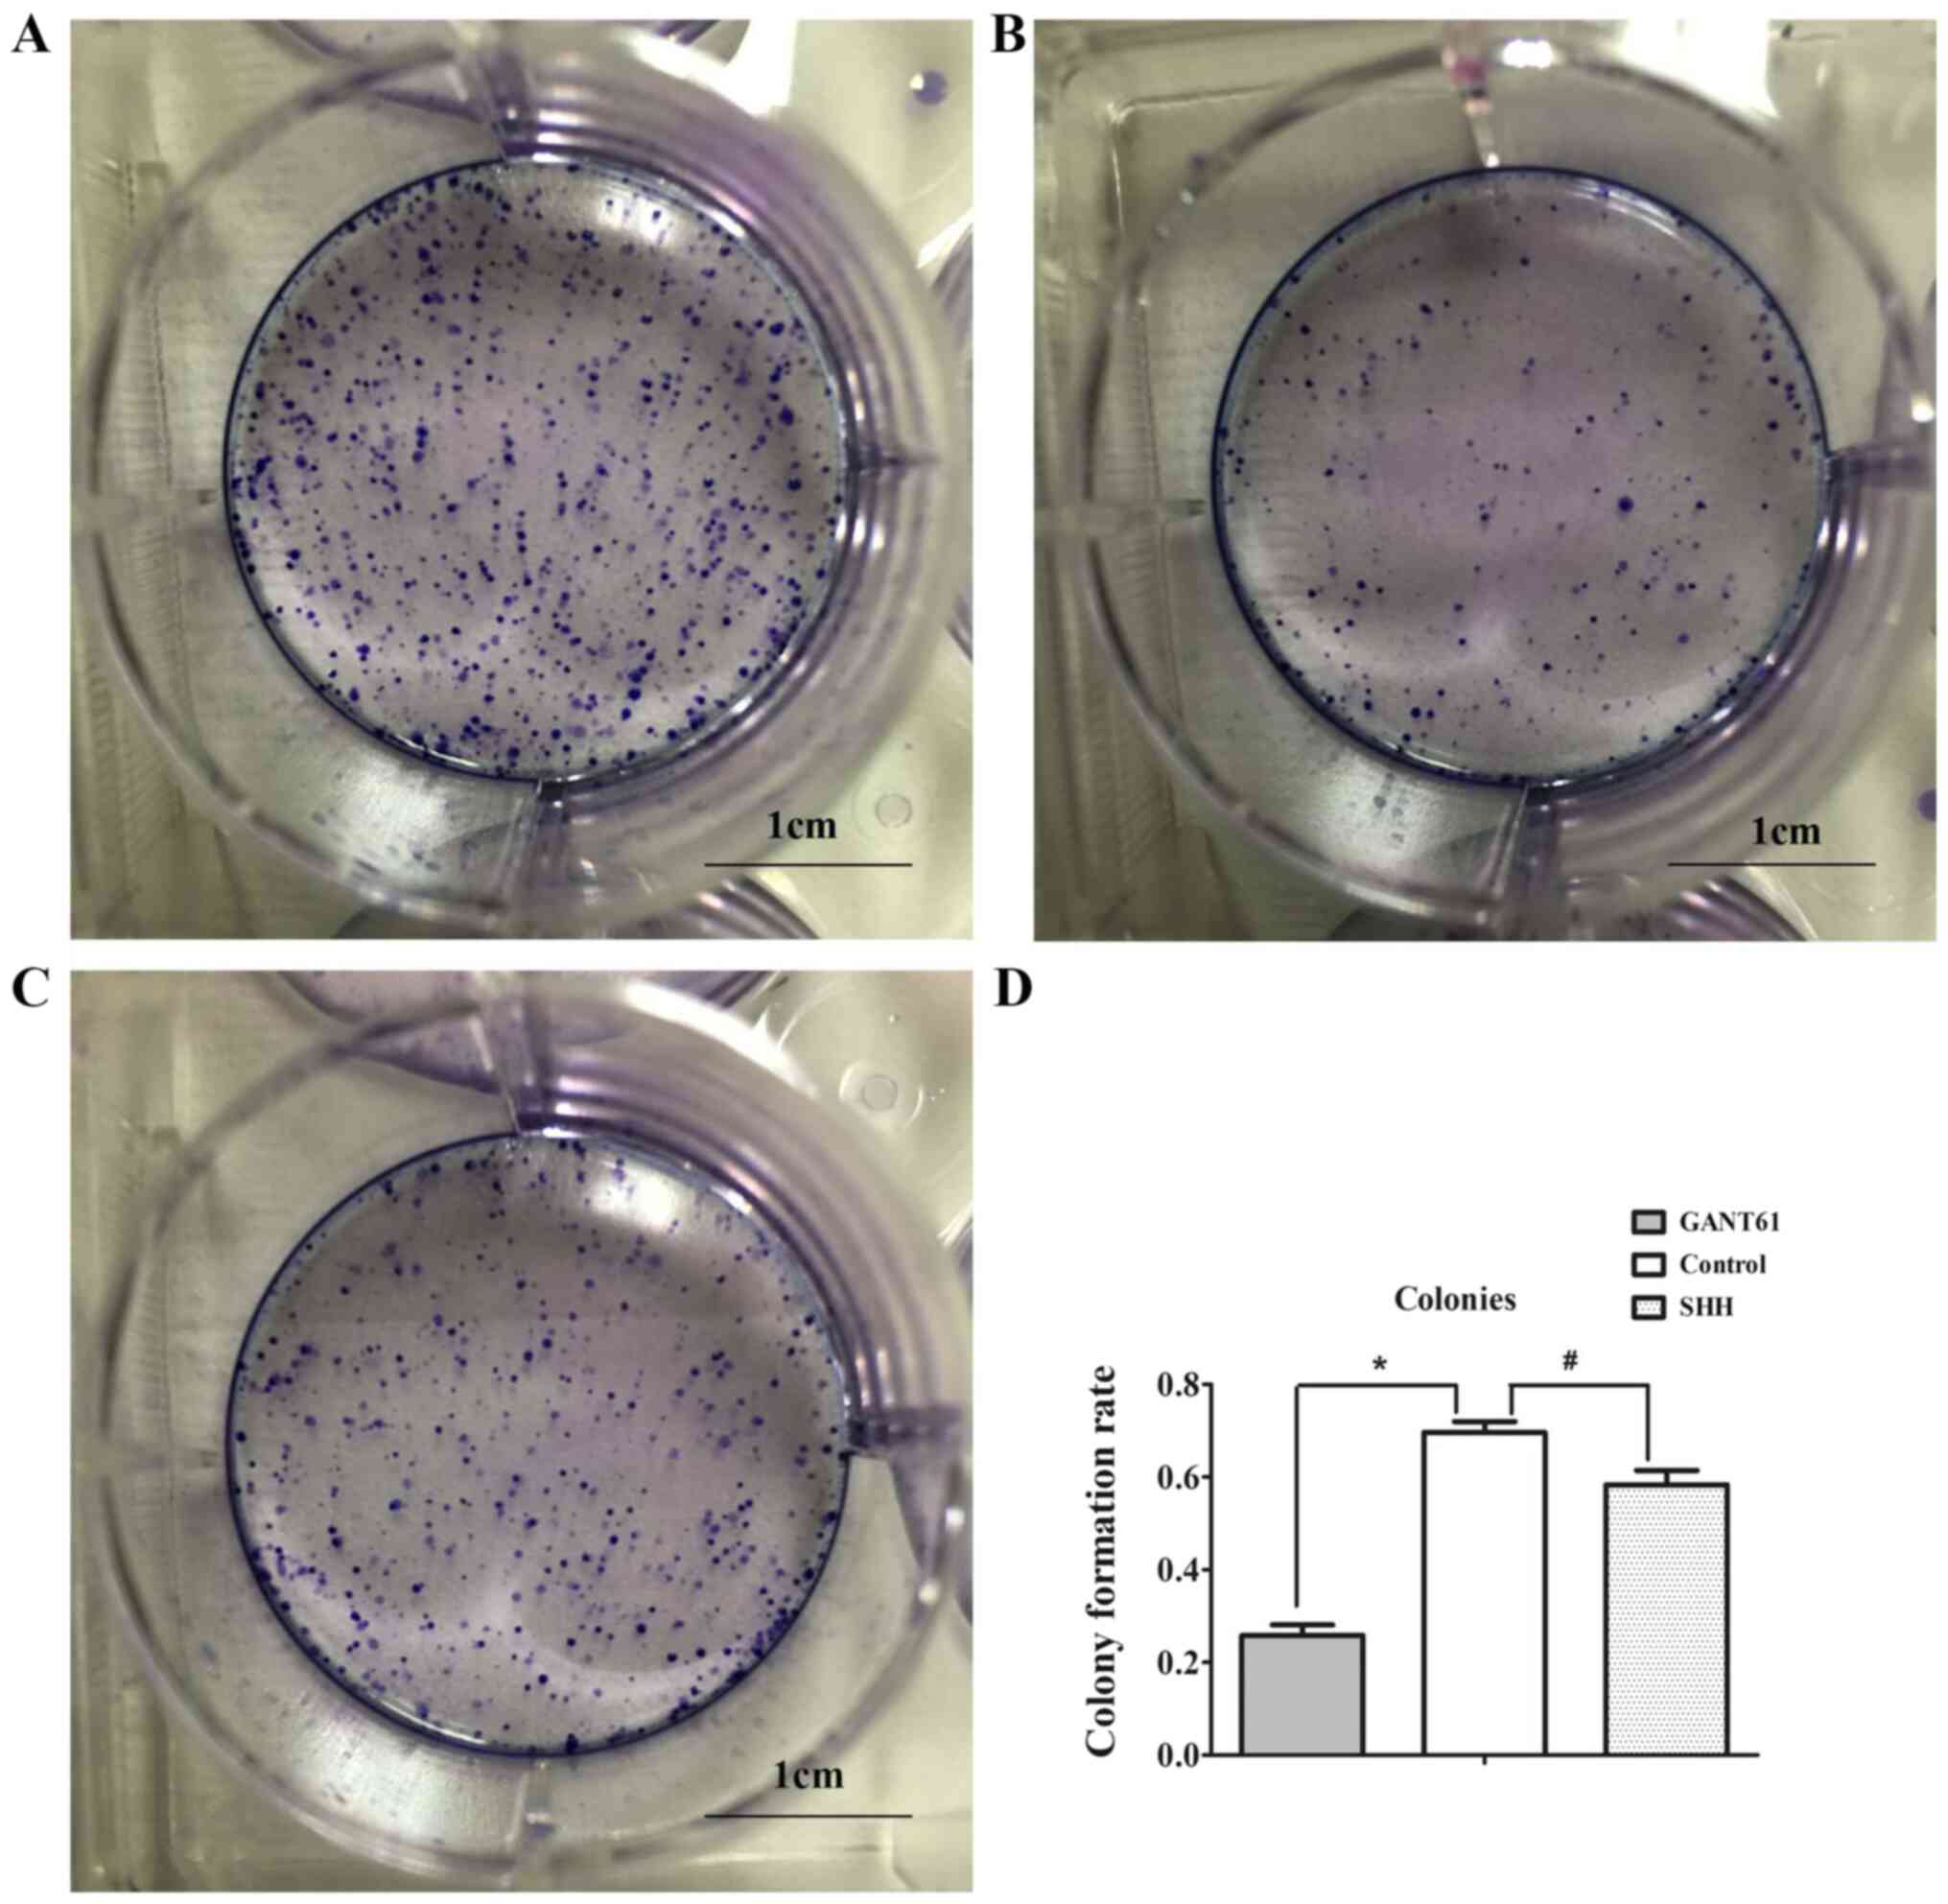
Gli promotes the colony-formation
ability of SKOV3 cells
The results of the plate colony formation assay
showed that the colony-forming ability of SKOV3 cells treated with
GANT61 was significantly lower compared with the control group
(69.6 vs. 25.1%; Fig. 5A, B and D),
indicating that Gli inhibition reduced colony formation of ovarian
cancer cells.
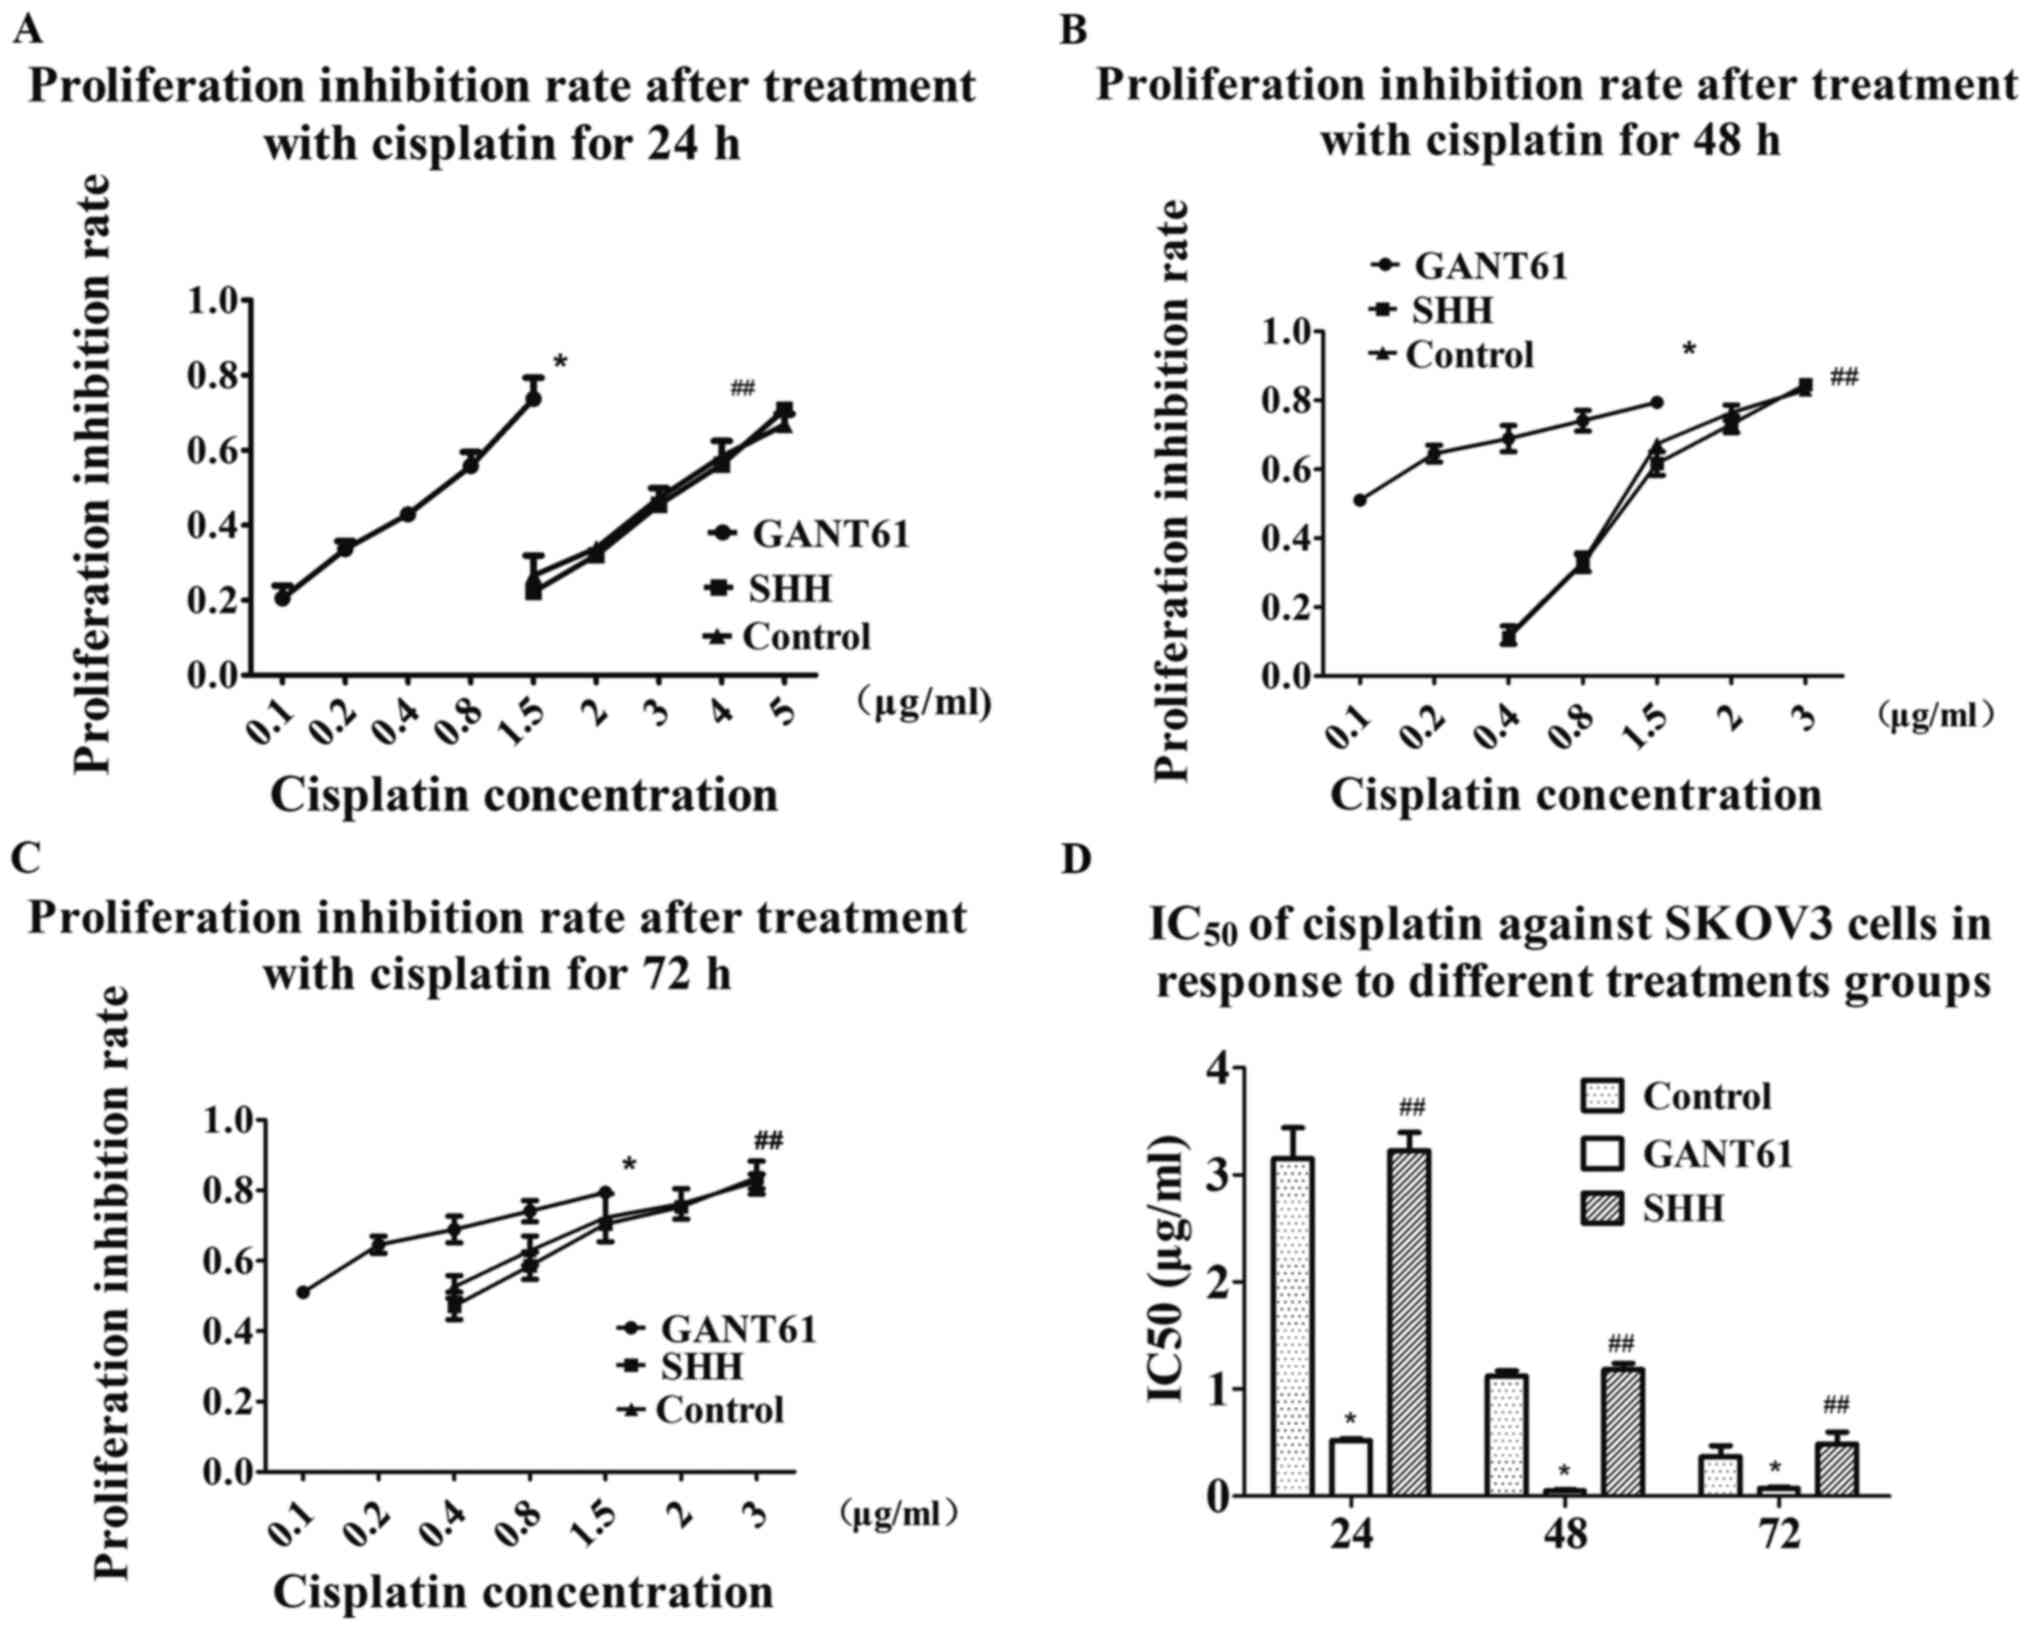
GANT61 reverses cisplatin resistance
in ovarian cancer cells
The IC50 of cisplatin against SKOV3 cells
in response to different treatments groups was assessed using the
CCK-8 assay. The results showed that the IC50 of
cisplatin after 24 h decreased from 3.151±0.289 to 0.517±0.022
µg/ml in the GANT61 group (Fig. 6A and
D). The IC50 further decreased from 1.121±0.050 to
0.050±0.012 µg/ml after 48 h of cisplatin treatment (Fig. 6B and D). The IC50
decreased from 0.368±0.102 to 0.073±0.012 µg/ml after GANT61
treatment for 72 h (Fig. 6C and D).
The results indicated that SKOV3 cells were significantly more
sensitive to cisplatin after inhibition of Gli1 and Gli2 (Fig. 6).
Exogenous SHH did not exert a
significant effect on Gli, cell proliferation and cisplatin
sensitivity in EOC
The present study exogenously added recombinant
human SHH protein to increase the expression of Gli by activation
of the HH signaling pathway. Compared with the control group, the
addition of exogenous SHH did not affect cell proliferation and
sensitivity to cisplatin, as expected (Figs. 4B and 6A-C). RT-qPCR and western blot analysis
showed that the addition of exogenous SHH did not result in an
increase in Gli1 and Gli2, and even caused a slight decrease in
these two proteins compared with the control group. SHH treatment
only resulted in a slight increase in NANOG and MDR1 levels
compared with the control group (Fig.
3A and B). Plate cloning experiments showed that the addition
of SHH slightly reduced the colony formation rate of the cells,
compared with the control group, from 69.6 to 58.3% (Fig. 5C and D).
Discussion
The HH signaling pathway is an evolutionarily
conserved signaling pathway (3). A
number of studies have demonstrated that HH signaling is closely
associated with the occurrence and development of numerous
malignant tumors (3–6). Although the medical community has made
a number of advances in the treatment of ovarian cancer,
chemoresistance is still an important issue that affects the
treatment and survival rate of patients (1). Despite investigation into HH signaling
in tumor chemoresistance, there is still controversy regarding the
role of Gli in platinum resistance. Some studies have reported that
Gli1 is closely associated with tumor resistance (11,12),
while other results suggested that Gli2, but not Gli1, may have
more predictive value (13). The
present results showed that Gli1 and Gli2 are both involved in
platinum resistance of ovarian cancer, but the nuclear expression
of Gli2 appears to be a more appropriate marker for predicting
platinum resistance. Since Gli is a transcription factor and thus
functions in the nucleus, nuclear protein expression is more likely
to represent active signaling (21). Therefore, nuclear expression of Gli1
and Gli2 was assessed in a separate statistical analysis. The
results showed that while the nuclear expression rate of Gli1 was
not high, Gli2 expression was much higher. There was also a
significant association between nuclear Gli2 expression and
platinum resistance. The results from the present study suggested
that positive nuclear expression of Gli2 may be a more appropriate
marker of platinum resistance in ovarian cancer. Previous studies
on the location of Gli expression in tumors have also found that
although nuclear expression may be activated in a stricter sense,
cytoplasmic expression is also associated with some
clinicopathological characteristics, but the reason is not clear
(21,22). It may be caused by the interaction
between Gli1 and Gli2, and the non-canonical pathway (10,23).
The present study also observed that the expression of Gli1 and
Gli2 in the cytoplasm is closely associated with the clinical and
pathological characteristics of drug resistance and stage, which
implies the importance of Gli1 and Gli2, as well as the
non-canonical HH pathway in EOC. Therefore, the determination of
Gli activation status requires further research to be fully
understood.
The present in vitro results showed that
after SKOV3 cells were treated with the HH inhibitor GANT61, the
sensitivity of the cells to cisplatin was significantly increased,
suggesting that Gli promoted platinum resistance in ovarian cancer
cells. MDR1 expression was also decreased, which supported the
effects of Gli on drug resistance of EOC. As a key factor in the HH
signaling pathway, Gli1 is associated with the stage,
differentiation and poor prognosis of a variety of tumors (23–26).
The results of the present study confirmed those of previous
studies. The present study showed that Gli1 expression was
associated with the stage of the disease, but no difference was
found according to different degrees of differentiation, and it was
speculated that there may be a bias caused by the small sample
size. The present in vitro results also demonstrated that
targeting Gli reduced cell proliferation and colony formation. The
stem cell theory of cancer proposes that cancer stem cells have
stronger drug resistance, proliferation and colony-forming ability,
and possess several unique markers, such as CD44, CD133, aldehyde
dehydrogenase (ALDH) and NANOG (4,5,7).
Previous studies have suggested using CD44, CD133 and ALDH as
ovarian cancer stem cell markers for experimental research and stem
cell identification (4,7). Thus far, only a few studies have
suggested using NANOG as an ovarian cancer stem cell marker
(27). NANOG is a pluripotent
factor, which is reported to regulate cell self-renewal and
chemotherapy resistance in some tumors (14,15).
NANOG was also reported to be a downstream target of Gli (16). The present immunohistochemistry
results showed that NANOG expression was associated with platinum
resistance and the stage of the disease stage. The results also
showed a significant correlation between NANOG and cytoplasmic Gli1
and Gli2 expression. In the present study, a corresponding decrease
in NANOG expression was observed following inhibition of Gli1 and
Gli2 expression in SKOV3 cells. The results of the present study
suggested that the stemness of ovarian cancer may be altered by
inhibiting the Gli-NANOG pathway, which may be one of the
mechanisms via which HH signaling is involved in tumor stem cells.
The application of targeted inhibition of Gli expression may
reverse proliferative capacity, chemoresistance and colony
formation rate of tumors by regulating tumor stem cell
formation.
Kaplan-Meier survival analysis showed that patients
with cytoplasmic Gli1, nuclear Gli2 and NANOG expression had worse
survival rates. Cox regression showed that nuclear Gli2 and NANOG
are independent prognostic factors for the survival time of
patients with EOC, suggesting that these three markers, especially
nuclear Gli2 and NANOG, can be used to predict patient
outcomes.
In the present study, SHH was used to activate HH
signaling and result in the expression of Gli, but the exogenous
addition of SHH did not cause significant changes in Gli1 and Gli2,
as expected. SHH did not cause changes in cell proliferation or
sensitivity to cisplatin, but resulted in a slight decrease in
colony formation rate. Several research groups reported that the
addition of exogenous SHH to different types of tumor cells can
result in malignant behaviors, such as cell proliferation, but some
have revealed that the addition of exogenous SHH does not cause
similar changes (23,28). This study showed that SKOV3 cells
treated with 3 ng/µl SHH did not show changes in proliferative
capacity or expression of related genes, and even caused a decrease
in Gli2. Sabol et al (28)
showed that estrogen receptor (ER)-positive cell lines do not
respond to SHH stimulation, suggesting that ERα regulation is not
caused by Gli1 regulation of transcription by SHH. The results from
the current study are consistent with the findings that the
addition of exogenous SHH does not regulate Gli and its related
cellular functions, suggesting the existence of a non-canonical HH
pathway in this model. Furthermore, following the addition of SHH,
the expression of NANOG and MDR1 increased slightly. As previous
studies have demonstrated, this also confirms the direct
participation of other factors and the coexistence of canonical and
non-canonical HH pathways (10,28,29).
Although this was the first study investigating the
role of Gli and NANOG in EOC and their possible association, it is
still necessary to understand the respective roles of Gli1 and Gli2
in the HH pathway and how they interact with NANOG. The interaction
of these molecules in other cell lines and their roles in
vivo experiments require further study. Additionally, in order
to elucidate the functions of Gli, more experiments should be
performed in the future to investigate the location of Gli. It is
hypothesized in the present study that Gli promotes the development
and drug resistance of ovarian cancer via NANOG, both of which are
prognostic markers of EOC, as well as indicators of platinum
resistance. NANOG may be the key point through which Gli affects
stem cell pathways in EOC. Gli inhibition may reverse malignant
phenotypes, such as drug resistance, proliferation and the
contribution of ovarian cancer stem cells, and may therefore
represent a new drug target for the treatment of EOC.
Acknowledgements
The authors would like to express their gratitude to
Dr Lian Weiguang (Department of Molecular Biology of Hebei Medical
University, Shijiazhuang, China) for her help during
experiments.
Funding
This study was funded by the Hebei Health Commission
(grant no. 20201011).
Availability of data and materials
The datasets used and/or analyzed during the current
study are available from the corresponding author on reasonable
request.
Authors' contributions
HZ, XW and YP conceived and designed the study. HZ
and NL performed the experiments and collected the data. NL and JZ
analyzed and interpreted the data. HZ and YP drafted the
manuscript. All authors read and approved the final manuscript.
Ethics approval and consent to
participate
All patients provided written informed consent prior
to inclusion in the present study. The ethics committee of The
Third Hospital of Hebei Medical University (Shijiazhuang, China)
approved the study protocol.
Patient consent for publication
Not applicable.
Competing interests
The authors declare that they have no competing
interests.
References
|
1
|
da Costa AABA and Baiocchi G: Genomic
profiling of platinum-resistant ovarian cancer: The road into
druggable targets. Semin Cancer Biol. 2020:30221–30222. 2020.
|
|
2
|
Kujawa KA and Lisowska KM: Ovarian
cancer-from biology to clinic. Postepy Hig Med Dosw (Online).
69:1275–1290. 2015.(In Polish). View Article : Google Scholar : PubMed/NCBI
|
|
3
|
Skoda AM, Simovic D, Karin V, Kardum V,
Vranic S and Serman L: The role of the hedgehog signaling pathway
in cancer: A comprehensive review. Bosn J Basic Med Sci. 18:8–20.
2018. View Article : Google Scholar : PubMed/NCBI
|
|
4
|
Wang F, Ma L, Zhang Z, Liu X, Gao H,
Zhuang Y, Yang P, Kornmann M, Tian X and Yang Y: Hedgehog signaling
regulates epithelial-mesenchymal transition in pancreatic cancer
stem-like cells. J Cancer. 7:408–417. 2016. View Article : Google Scholar : PubMed/NCBI
|
|
5
|
Sun M, Zhang N, Wang X, Li Y, Qi W, Zhang
H, Li Z and Yang Q: Hedgehog pathway is involved in nitidine
chloride induced inhibition of epithelial-mesenchymal transition
and cancer stem cells-like properties in breast cells. Cell Biosci.
6:442016. View Article : Google Scholar : PubMed/NCBI
|
|
6
|
Xu Y, Song S, Wang Z and Ajani JA: The
role of hedgehog signaling in gastric cancer: Molecular mechanisms,
clinical potential, and perspective. Cell Commun Signal.
17:1572019. View Article : Google Scholar : PubMed/NCBI
|
|
7
|
Levanat S, Sabol M, Musani V, Ozretic P
and Trnski D: Hedgehog signaling pathway as genetic and epigenetic
target in ovariantumors. Curr Pharm. 23:73–94. 2017.
|
|
8
|
Coffman LG, Choi YJ, McLean K, Allen BL,
di Magliano MP and Buckanovich RJ: Human carcinoma-associated
mesenchymal stem cells promote ovarian cancer chemotherapy
resistance via a BMP4/HH signaling loop. Oncotarget. 7:6916–6932.
2016. View Article : Google Scholar : PubMed/NCBI
|
|
9
|
Christensen ST and Ott CM: Cell signaling:
A ciliary signaling switch. Science. 317:330–331. 2007. View Article : Google Scholar : PubMed/NCBI
|
|
10
|
Blotta S, Jakubikova J, Calimeri T,
Roccaro AM, Amodio N, Azab AK, Foresta U, Mitsiades CS, Rossi M,
Todoerti K, et al: Canonical and noncanonical hedgehog pathway in
the pathogenesis of multiple nyeloma. Blood. 120:5002–5013. 2012.
View Article : Google Scholar : PubMed/NCBI
|
|
11
|
Song X, Yan L, Lu C, Zhang C, Zhu F, Yang
J, Jing H, Zhang Y, Qiao J and Guo H: Activation of hedgehog
signaling and its association with cisplatin resistance in ovarian
epithelial tumors. Oncol Lett. 15:5569–5576. 2018.PubMed/NCBI
|
|
12
|
Steg AD, Burke MR, Amm HM, Katre AA,
Dobbin ZC, Jeong DH and Landen CN: Proteasome inhibition reverses
hedgehog inhibitor and taxane resistance in ovarian cancer.
Oncotarget. 5:7065–7080. 2014. View Article : Google Scholar : PubMed/NCBI
|
|
13
|
Steg AD, Bevis KS, Katre AA, Ziebarth A,
Dobbin ZC, Alvarez RD, Zhang K, Conner M and Landen CN: Stem cell
pathways contribute to clinical chemoresistance in ovarian cancer.
Clin Cancer Res. 18:869–881. 2012. View Article : Google Scholar : PubMed/NCBI
|
|
14
|
Yu SS and Cirillo N: The molecular markers
of cancer stem cells in head and neck tumors. J Cell Physiol.
235:65–73. 2020. View Article : Google Scholar : PubMed/NCBI
|
|
15
|
Cao J, Zhao M, Liu J, Zhang X, Pei Y, Wang
J, Yang X, Shen B and Zhang J: RACK1 promotes self-renewal and
chemoresistance of cancer stem cells in human hepatocellular
carcinoma through stabilizing nanog. Theranostics. 9:811–828. 2019.
View Article : Google Scholar : PubMed/NCBI
|
|
16
|
Kakiuchi S, Minami Y, Miyata Y, Mizutani
Y, Goto H, Kawamoto S, Yakushijin K, Kurata K, Matsuoka H and
Minami H: NANOG expression as a responsive biomarker during
treatment with hedgehog signal inhibitor in acute myeloid leukemia.
Int J Mol Sci. 18:4862017. View Article : Google Scholar
|
|
17
|
Servo SF, Scully RE and Subin LH:
Histologic typing of ovarian tumors. WHO Geneva. 42–45. 1973.
|
|
18
|
Pecorelli S: Revised FIGO staging for
carcinoma of the vulva, cervix, and endometrium. Int J Gynaecol
Obstet. 105:103–104. 2009. View Article : Google Scholar : PubMed/NCBI
|
|
19
|
Remmele W and Stegner HE: Recommendation
for uniform definition of an immunoreactive score (IRS) for
immunohistochemical estrogen receptor detection (ER-ICA) in breast
cancer tissue. Pathologe. 8:138–140. 1987.(In German). PubMed/NCBI
|
|
20
|
Livak KJ and Schmittgen TD: Analysis of
relative gene expression data using real-time quantitative PCR and
the 2(-Delta Delta C(T)) method. Methods. 25:402–408. 2001.
View Article : Google Scholar : PubMed/NCBI
|
|
21
|
Kubo M, Nakamura M, Tasaki A, Yamanaka N,
Nakashima H, Nomura M, Kuroki S and Katano M: Hedgehog signaling
pathway is a new therapeutic target for patients with breast
cancer. Cancer Res. 64:6071–6074. 2004. View Article : Google Scholar : PubMed/NCBI
|
|
22
|
Feng YZ, Shiozawa T, Miyamoto T, Kashima
H, Kurai M, Suzuki A, Ying-Song J and Konishi I: Overexpression of
hedgehog signaling molecules and its involvement in the
proliferation of endometrial carcinoma cells. Clin Cancer Res.
13:1389–1398. 2007. View Article : Google Scholar : PubMed/NCBI
|
|
23
|
Ozretić P, Trnski D, Musani V, Maurac I,
Kalafatić D, Orešković S, Levanat S and Sabol M: Non-canonical
hedgehog signaling activation in ovarian borderline tumors and
ovarian carcinomas. Int J Oncol. 51:1869–1877. 2017. View Article : Google Scholar : PubMed/NCBI
|
|
24
|
Rokkam P, Gugalavath S, Gift Kumar DK,
Vempati RK and Malla RR: Prognostic role of hedgehog GLI1 signaling
pathway in aggressive and metastatic breast cancers. Curr Drug
Metab. 21:33–43. 2020. View Article : Google Scholar : PubMed/NCBI
|
|
25
|
Wang C, Cheng L, Song S, Wu S and Sun G:
Gli1 interacts with YAP1 to promote tumorigenesis in esophageal
squamous cell carcinoma. J Cell Physiol. 235:8224–8235. 2020.
View Article : Google Scholar : PubMed/NCBI
|
|
26
|
Ciucci A, De Stefano I, Vellone VG, Lisi
L, Bottoni C, Scambia G, Zannoni GF and Gallo D: Expression of the
glioma-associated oncogene homolog 1 (gli1) in advanced serous
ovarian cancer is associated with unfavorable overall survival.
PLoS One. 8:e601452013. View Article : Google Scholar : PubMed/NCBI
|
|
27
|
Schreiber L, Raanan C and Amsterdam A:
CD24 and Nanog identify stem cells signature of ovarian epithelium
and cysts that may develop to ovarian cancer. Acta Histochem.
116:399–406. 2014. View Article : Google Scholar : PubMed/NCBI
|
|
28
|
Sabol M, Trnski D, Uzarevic Z, Ozretic P,
Musani V, Rafaj M, Cindric M and Levanat S: Combination of
cyclopamine and tamoxifen promotes survival and migration of mcf-7
breast cancer cells-interaction of hedgehog-gli and estrogen
receptor signaling pathways. PLoS One. 9:e1145102014. View Article : Google Scholar : PubMed/NCBI
|
|
29
|
Ma Y, Yu W, Shrivastava A, Alemi F,
Lankachandra K, Srivastava RK and Shankar S: Sanguinarine inhibits
pancreatic cancer stem cell characteristics by inducing oxidative
stress and suppressing sonic hedgehog-Gli-Nanog pathway.
Carcinogenesis. 38:1047–1056. 2017. View Article : Google Scholar : PubMed/NCBI
|