Introduction
Esophageal cancer (EC) is one of the commonest
malignant tumors of the digestive system worldwide (1). In China, the most dominant
histological subtype is esophageal squamous cell carcinoma (ESCC).
According to the 2015 Chinese Cancer Statistics, ESCC is the fourth
most fatal disease in China (2).
ESCC is characterized by a high malignancy, uncomplicated
metastasis and poor survival rates (3). Given the difficulty in early stage
diagnosis of ESCC, a number of patients diagnosed with ESCC often
have advanced metastases. Moreover, the prognosis of patients with
ESCC remains very low; even after surgery and chemotherapy and
radiotherapy, the 5-year overall survival rate of patients with
ESCC is <25% (4).
Epithelial-mesenchymal transition (EMT) is a
critical physiological process that regulates invasion and
metastasis of cancer cells (5). It
enhances the invasion and metastasis of cancer cells by modulating
the expression of E-cadherin and overexpression of vimentin
(6). This underlines the integral
role EMT serves in metastasis of cancers. However, the molecular
mechanism underlying EMT in ESCC remains to be elucidated.
MicroRNAs (miRNAs/miRs) are small non-coding RNAs of
~19–25 nucleotides. They participate in post-transcriptional
regulation of gene expression for processes such as invasion,
migration, metastasis and EMT (7).
A previous study reported differential expression of 22 miRNA in
three pairs of ESCC and paracancerous tissues. In particular,
compared with adjacent tissues, the expression of 6 miRNAs was
upregulated, whereas the expression of the remaining 16 miRNAs was
significantly modulated. Notably, miR-181a was among the
upregulated miRNAs in the ESCC tissues. The overexpression of
miR-181a in ESCC tissues compared with adjacent tissues was further
validated by reverse transcription-quantitative polymerase chain
reaction (RT-qPCR) (8). EMT is
regulated by the TGF-β/Smad signaling pathway, which also mediates
a number of essential cancer processes (9–11).
Therefore, the present study explored the role of miR-181a in EMT
and the interaction between miR-181a, EMT and the TGF-β/Smad
signaling pathway in ESCC.
Materials and methods
Patients and samples
The protocol for the present study was approved by
the Ethics Review Committees of the Affiliated Hospital of North
Sichuan Medical College. Between February 2016 and June 2017, EC
and paired adjacent non-cancerous tissue samples were surgically
removed from patients attending The Affiliated Hospital of North
Sichuan Medical College (Sichuan, China). The average age of the
patients was 65 years (range 40–77 years). Together, 88
histopathologically confirmed ESCC tissues (66 males; 22 females)
and 21 adjacent non-cancerous tissues were collected and analyzed.
The adjacent non-cancerous tissues were obtained 5 cm from
boundaries of cancerous tissues. The following inclusion criteria
were used: i) ESCC was confirmed by pathological diagnosis after
surgery; ii) patients had no other tumors; iii) patients had not
received neoadjuvant chemotherapy, radiotherapy or other adjuvant
therapy; and iv) patients had complete clinicopathological data. No
exclusion criteria were used. After extraction, all samples were
immediately frozen and stored in liquid nitrogen at −80°C or fixed
in 10% formalin for future paraffin embedding.
Cell culture
The TE-1 cells were purchased from the Chinese
Academy of Sciences, HEEC and ECA109 were obtained from the
Institute of Molecular Biology, North Sichuan Medical College. All
cells were verified by using the short tandem repeat profiling
technique. The cells were then cultured in Dulbecco's modified
Eagle's medium (HyClone; Cytiva) supplemented with a mixture of 1%
penicillin-streptomycin (Wuhan Boster Biological Technology, Ltd.)
and 10% fetal bovine serum (Thermo Fisher Scientific, Inc.).
Incubation was performed for 3–5 days, at 37°C under 5%
CO2.
Immunohistochemistry
ESCC and non-cancerous tissues were fixed with 10%
paraformaldehyde for 12 h at room temperature, dehydrated using an
Excelsior ES automatic dehydrator (Thermo Shandon, Inc.), embedded
in paraffin using an automatic Biological Tissue Embedding machine
(Leica Microsystems, Inc.) and sliced into thin 4-µm thick
sections. The sections were then incubated with 3%
H2O2 for 30 min at 37°C to block endogenous
peroxidase activity, and incubated with primary anti-TGF-β1 mouse
3C11 (1:50; cat. no. sc-130348; Santa Cruz Biotechnology, Inc.) and
anti-Smad4 rabbit EP618Y (1:100; cat. no. ab40759; Abcam)
monoclonal antibodies according to the manufacturers' protocols for
12 h at 4°C. Following the primary antibody incubation, the
sections were incubated with anti-mouse or anti-rabbit IgG
molecules from the Maxvision™ 2 HRP-Polymer Anti-Mouse/Rabbit IHC
kit (MXB Biotechnologies) for 30 min at 37°C. Sections were then
stained with DAB from the kit for 2 min at room temperature to
reveal the expression of TGF-β1 in the cytoplasm and/or
cytomembrane and Smad4 in the cytoplasm and/or nucleus. The tissues
were then assessed by qualified pathologists. The expression
profile of 500 tumor cells (100 cells/field) in five fields was
observed under high power (magnification, ×200) using a light
microscope. The score for intensity of staining was based on the
degree of staining of the cancer cells: 0, the degree of stained
cancer cell <5%; 1, 5–25% cell staining; 2, 26–50% cell
staining; 3, 51–75% cell staining; and 4, >75% cell staining.
The average labeling index of TGF-β1 and Smad4 was assessed
according to the total scores in each field. Expression of TGF-β1
and Smad4 was graded as negative (−) for a score <2, weakly
positive (+) for a score 2–3, moderately positive (++) for a score
between 4–5 and strongly positive (+++) for a score between 6–7.
Overall, a score ≥2 was regarded as positive expression. The
scoring was performed by two independent, double blinded
pathologists.
Cell transfection
The miR-181a mimics, mimics negative control (mimics
NC), miR-181a inhibitor and inhibitor negative control (inhibitor
NC) were purchased from Sangon Biotech Co., Ltd. Details of the
miRNAs, their inhibitors and controls are shown in Table I. Briefly, ECA109 and TE-1 cells
were first seeded into 6-well plates (5×10⁵ cells/well).
After reaching 40–50% confluence, Lipofectamine 6000®
(Invitrogen; Thermo Fisher Scientific, Inc.) was used to transfect
with miR-181a mimics (20 µM), mimics NC (20 µM), miR-181a inhibitor
(20 µM) and inhibitor NC (20 µM) in DMEM supplemented with 10%
fetal bovine serum without 1% penicillin/streptomycin for 6 h at
37°C. Negative control (NC) served as the control group. The medium
was replaced after 6 h to remove the remaining liposomes. After 48
h transfection, cells were collected for RT-qPCR analysis and after
72 h for western blot analysis.
 | Table I.Sequence of the miR-181a mimics and
inhibitor and their negative controls. |
Table I.
Sequence of the miR-181a mimics and
inhibitor and their negative controls.
| miRNA | Sequence (5–3) |
|---|
| miR-181a | Sense:
AACAUUCAACGCUGUCGGUGAGU |
| mimics | Antisense:
ACUCACCGACAGCGUUGAAUGUU |
| mimics | Sense:
UUGUACUACACAAAAGUACUG |
| NC | Antisense:
GUACUUUUGUGUAGUACAAUU |
| miR-181a
inhibitor |
ACUCACCGACAGCGUUGAAUGUU |
| Inhibitor |
CAGUACUUUUGUGUAGUACAA |
| NC |
|
Wound healing assays
The ECA109 and TE-1 cells were seeded into 6-well
plates (5×10⁵ cells/well) and transfected as above;
after 48 h, when the cell density reached 90% confluence, the cells
were scratched using a 100-µl pipette tip. The cells were cultured
in 10% fetal bovine serum-free DMEM at 37°C and thereafter washed
twice using PBS. Images were captured at 0 and 24 h after
scratching using a light microscope at ×100 magnification (Nikon
Corporation). The wound zone distances were measured using ImageJ
1.51 software (National Institutes of Health).
Cell proliferation assays
Briefly, transfected Cells were cultured for 48 h in
6-well plates. Thereafter, 8×10³ cells (100 µl/well)
were seeded into 96-well plates and cultured overnight. Cells in
each group were divided into four sub-groups (0, 12, 24 and 48 h),
with each subgroup containing six duplicates. Culture medium
without cells served as the negative control. Cell viability was
assessed based on the Enhanced Cell Counting kit-8 (CCK-8; Beyotime
Institute of Biotechnology). Briefly, 10 µl of CCK-8 solution was
added in each well before a 2 h incubation at 37°C. The optical
density of the cells was measured using a microplate reader (Thermo
Fisher Scientific, Inc.) at a wavelength of 450 nm.
Flow cytometry
After 48 h transfection, the inter-cellular collagen
in ECA109 and TE-1 cells was digested using 0.25% pancreatic
enzymes (without EDTA; Beijing Solarbio Science & Technology
Co., Ltd.), centrifuged (39.5925 × g) for 5 min at room temperature
and washed twice with cold PBS. The PBS was discarded after
centrifugation. The cells were stained for 15 min in the dark and
at room temperature based on Annexin V-FITC/PI Apoptosis Detection
kit (Nanjing KeyGen Biotech Co., Ltd.). was used to stain cells at
room temperature for 15 min in the dark. Early (Annexin V-positive,
PI-negative) and late (Annexin V-positive and PI-positive)
apoptosis of the cells were assessed using a NovoCyte 3130 flow
cytometer (ACEA Biosciences. Inc.; Agilent Technologies, Inc.).
Analysis was performed using 10,000 cells per sample using FlowJo
10.5 software (FlowJo LLC).
RNA extraction and mRNA expression
analysis
Total RNA was extracted from cultured cells based on
the manufacturer's protocols with an EASYspin Plus tissue/cell RNA
extraction kit (Aidlab Biotechnologies Co., Ltd.). Reverse
transcription and amplification of the RNA (1 µg) were performed
based on the all-in-One™ miRNA qRT-PCR Detection kit (GeneCopoeia,
Inc.); cDNA synthesis was performed at 37°C for 60 min and at 85°C
for 5 min. The resultant cDNA was diluted 5 times before
amplification with qPCR (20 µl of cDNA), which was performed at
95°C for 10 min for the initial denaturation, followed by 40 cycles
of denaturation at 95°C for 10 sec, elongation at 60°C for 20 sec
and final extension at 72°C for 10 sec. For mRNA, reverse
transcription was performed based on the Thermo Scientific
RevertAid First Strand cDNA Synthesis kit (Thermo Fisher
Scientific, Inc.). cDNA was synthesized from 1 µg of total RNA
through reaction conditions of 65°C for 5 min, 25°C for 5 min, 42°C
for 60 min and 70°C for 5 min. The resultant cDNA was diluted 20
times before qPCR; qPCR (25 µl total volume) was performed using
the Bestar Sybr Green qPCR Master mix (DBI Bioscience) under the
following temperature conditions: Initial denaturation for 2 min at
95°C, followed by 40 cycles of denaturation at 95°C for 10 sec,
primer annealing for 30 sec at 55°C and extension for 30 sec at
72°C. U6 and GAPDH were used as controls for endogenous miRNA and
mRNA. All experiments were performed in triplicate. The relative
gene expression levels between experimental set ups and controls
were analyzed using an automated computer based on the
2−ΔΔCq equation (12).
The primers (Sangon Biotech Co., Ltd.) used in the present study
are listed in Table II.
| Table II.Primer sequences of reverse
transcription-quantitative PCR products. |
Table II.
Primer sequences of reverse
transcription-quantitative PCR products.
| Gene | Primer sequence
(5–3) |
|---|
| miR-181a | F:
CGGTAACATTCAACGCTGTCG |
|
| R:
GTGCAGGGTCCGAGGT |
| TGF-β1 | F:
ATGGTGGAAACCCACAACGAA |
|
| R
TGCTGAGGTATCGCCAGGAAT |
| Smad4 | F:
CCATTTCCAATCATCCTGCTC |
|
| R:
GAAGGGTCCACGTATCCATCA |
| E-cadherin | F:
TTGTGGCAGAGTGTAATGCTG |
|
| R:
GTCCCTGGTCTTCTTGGTCA |
| Vimentin | F:
AGAGAACTTTGCCGTTGAAGC |
|
| R:
ACGAAGGTGACGAGCCATT |
| U6 | F:
CGCTTCGGCAGCACATATA |
|
| R:
TTCACGAATTTGCGTGTCAT |
| GAPDH | F:
CATGAGAAGTATGACAACAGCCT |
|
| R:
AGTCCTTCCACGATACCAAAGT |
Western blot analysis
Total proteins of transfected cells were extracted,
separated and solubilized in lysis buffer (Beyotime Institute of
Biotechnology). The concentration of proteins of interest
(E-cadherin, Vimentin, TGF-β1, Smad4 and GAPDH) was measured based
on the Bradford Protein Assay kit (Tiangen Biotech Co., Ltd.).
Briefly, equivalent amounts of protein (55 µg/lane) per sample were
separated using 10% SDS-PAGE and transferred onto PVDF membranes
(EMD Millipore; 0.22 µm). The membranes were blocked by 3 h
incubation at room temperature in 5% skimmed milk dissolved in
TBS-0.1% Tween. The membranes were then incubated with primary
antibodies (Wuhan Boster Biological Technology, Ltd.) against
E-cadherin (Rabbit; cat. no. PB9561; dilution, 1:500-1:2,000),
vimentin (Rabbit; cat. no. PB9359; dilution, 1:500-1:2,000), TGF-β1
(Rabbit; cat. no. BM4876; dilution, 1:100-1:400), Smad4 (Rabbit;
cat. no. BA1397; dilution, 1:100-1:400) and GAPDH (Rabbit; cat. no.
BA2913; dilution, 1:500-1:2,000) at 4°C overnight. Second
incubation with secondary antibodies (Wuhan Boster Biological
Technology, Ltd.) anti-rabbit IgG (H+L)-HRP (Rabbit; cat. no.
BA1054; dilution, 1:5,000-1:10,000) goat antibodies was performed
for 1 h at room temperature. Chemiluminescence of the protein bands
was performed based on the BeyoECL Star kit (Beyotime Institute of
Biotechnology). The images for the protein bands were captured
using the gel imaging equipment (Bio-Rad Laboratories, Inc.). The
expression level of the proteins was assessed using ImageJ (v1.51;
National Institutes of Health). GAPDH was used as an endogenous
control. Antibody dilution were as follows: E-cadherin (1:1,000),
vimentin (1:1,000), TGF-β1 (1:300), Smad4 (1:300), GAPDH (1:500)
and goat anti-rabbit IgG (H+L)-HRP (1:5,000).
Statistical analysis
Analyses were performed using GraphPad Prism 5.0 and
SPSS v23.0 (IBM Corp.). Continuous data were expressed as mean ±
standard deviation. Comparison between groups was performed using
χ2 and t-test. One-way ANOVA followed by Tukey's post
hoc test was performed for multiple group comparisons. P<0.05
was considered to indicate a statistically significant
difference.
Results
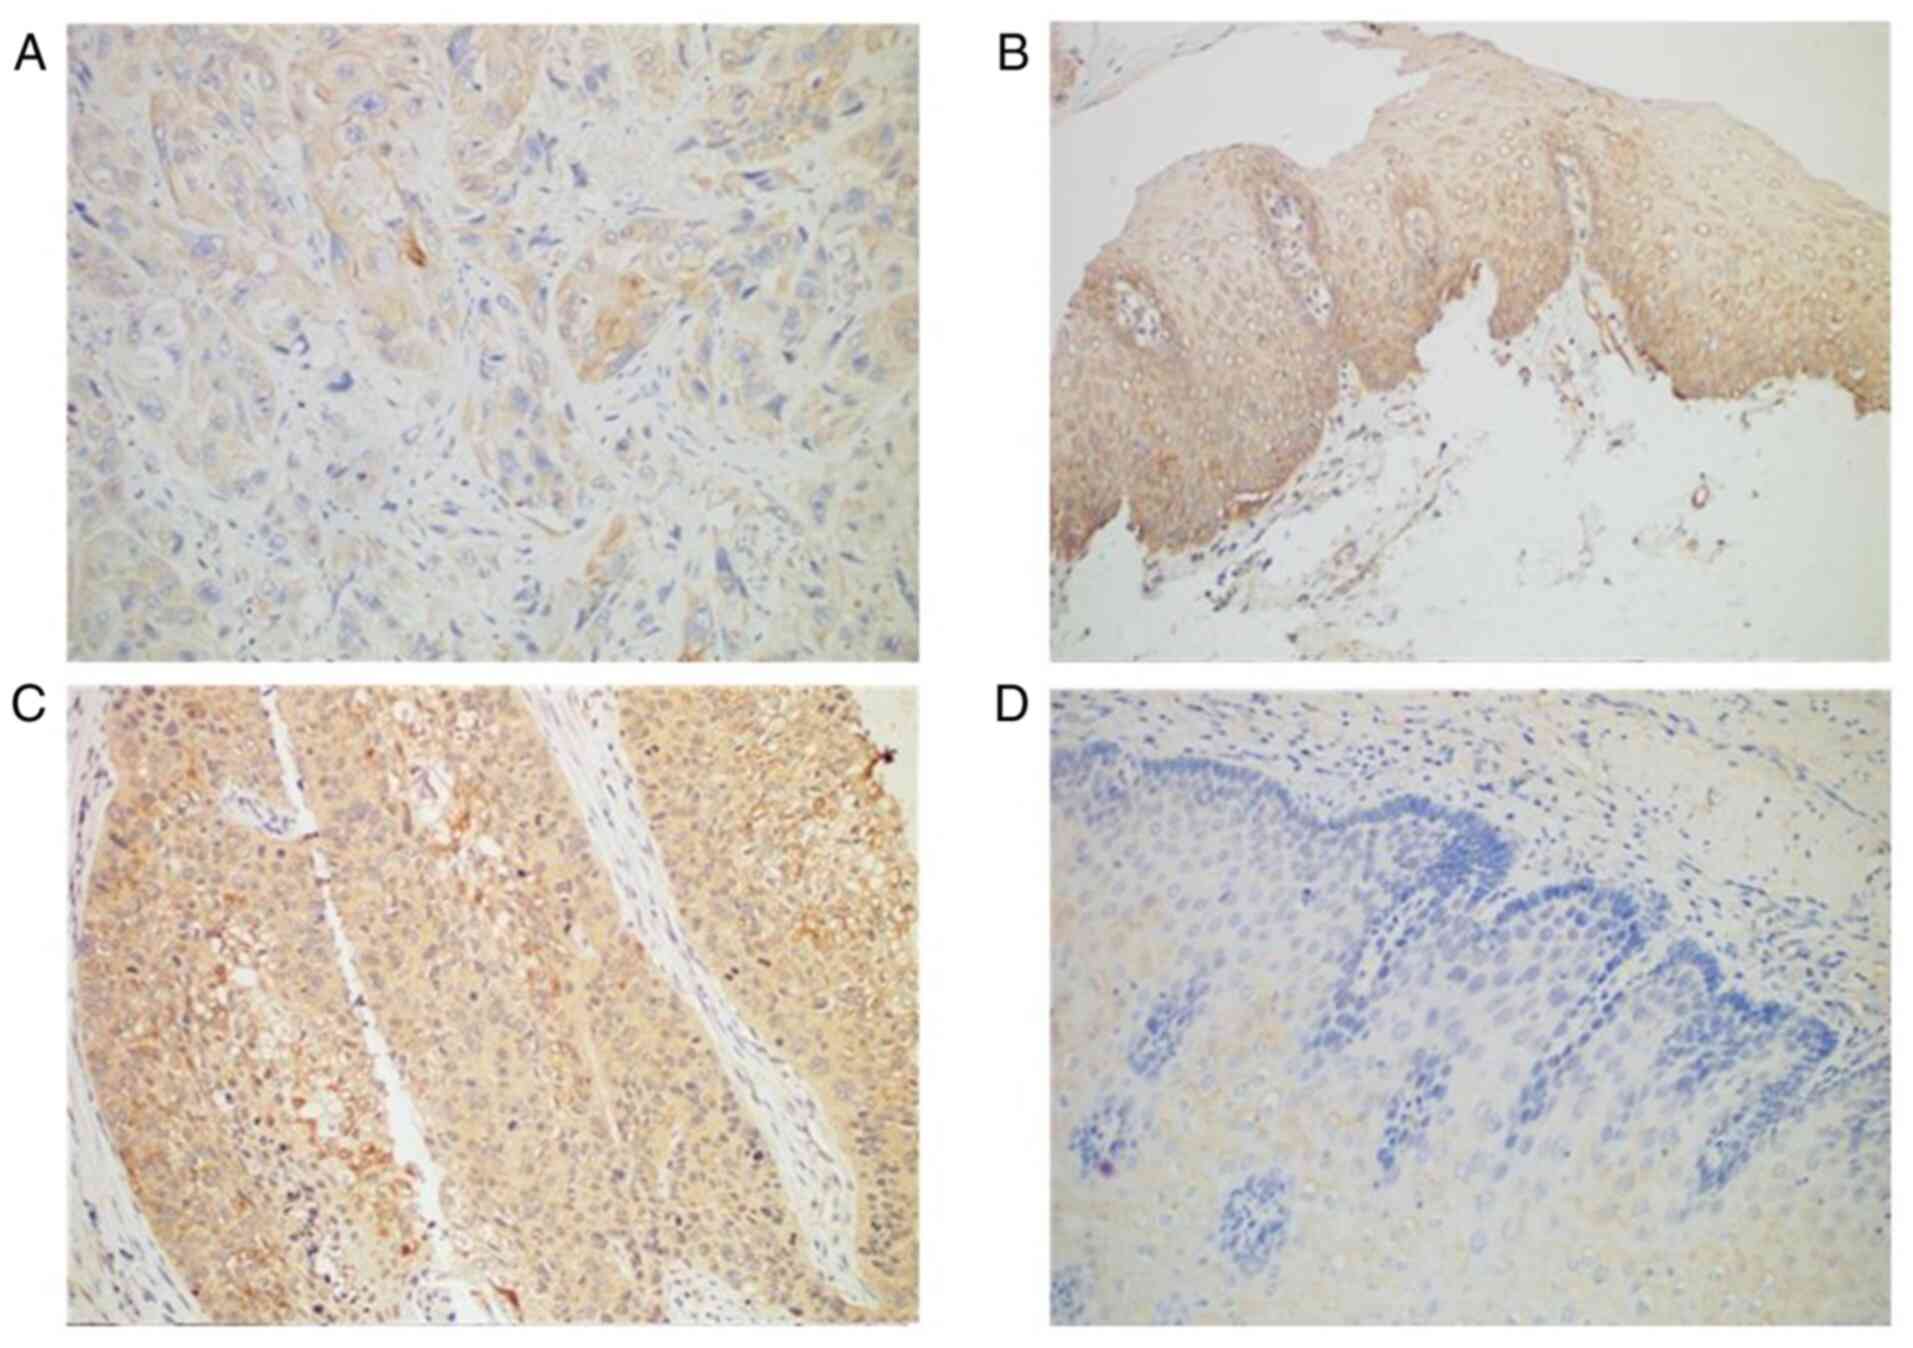
Expression of TGF-β1 and Smad4 in ESCC
tissues
Immunohistochemistry revealed Smad4 protein was
expressed in all normal tissues but only in 89.77% of ESCC tissues
(Table III; Fig. 1A and B). TGF-β1 protein was
expressed in most (72.73%) patients with ESCC (64 of 88 patients),
compared with normal adjacent tissues in which TGF-β1 was negative
(Table III; Fig. 1C and D). The expression profile of
TGF-β1 and Smad4 was not associated with any of the
clinicopathological factors (Table
IV).
| Table III.TGF-β1 and Smad4 expression in ESCC
tissues and non-cancerous tissues. |
Table III.
TGF-β1 and Smad4 expression in ESCC
tissues and non-cancerous tissues.
|
|
| TGF-β1 |
|
| Smad4 |
|
|
|---|
|
|
|
|
|
|
|
|
|
|---|
| Tissue type | Cases | Positive (%) | Negative (%) | χ2 | P-value | Positive (%) | Negative (%) | χ2 | P-value |
|---|
| Tissue |
|
|
| 20.8188 | 0.05 |
|
| 13.3134 | 0.05 |
| Cancer | 88 | 64 (72.73) | 24 (27.27) |
|
| 79
(89.77) | 9 (10.23) |
|
|
| Non-cancerous | 21 | 4
(19.05) | 17 (80.95) |
|
| 21 (100) | 0 (0) |
|
|
| Table IV.TGF-β1 and Smad4 expression in
relation to clinicopathological findings in ESCC. |
Table IV.
TGF-β1 and Smad4 expression in
relation to clinicopathological findings in ESCC.
|
Characteristics | Number (n=88) | TGF-β1
expression | P-value | Smad4
expression | P-value |
|---|
| Age (years) |
|
| 0.75848 |
| 0.69893 |
|
>65 | 49 | 35 |
| 45 |
|
|
≤65 | 39 | 29 |
| 34 |
|
| Sex |
|
| 0.60701 |
| 0.75139 |
|
Male | 66 | 49 |
| 60 |
|
|
Female | 22 | 15 |
| 19 |
|
| Histological
grade |
|
| 0.61817 |
| 0.56364 |
| Well
diff. | 37 | 29 |
| 33 |
|
|
Moderately diff. | 45 | 32 |
| 40 |
|
| Poorly
diff. | 6 | 3 |
| 6 |
|
| Depth of
invasion |
|
| 0.72166 |
| 0.7216 |
|
Upper | 8 | 5 |
| 7 |
|
|
Middle | 30 | 22 |
| 28 |
|
|
Lower | 50 | 37 |
| 44 |
|
| Lymphatic
invasion |
|
| 0.28511 |
| 0.41298 |
|
Yes | 37 | 27 |
| 34 |
|
| No | 51 | 37 |
| 45 |
|
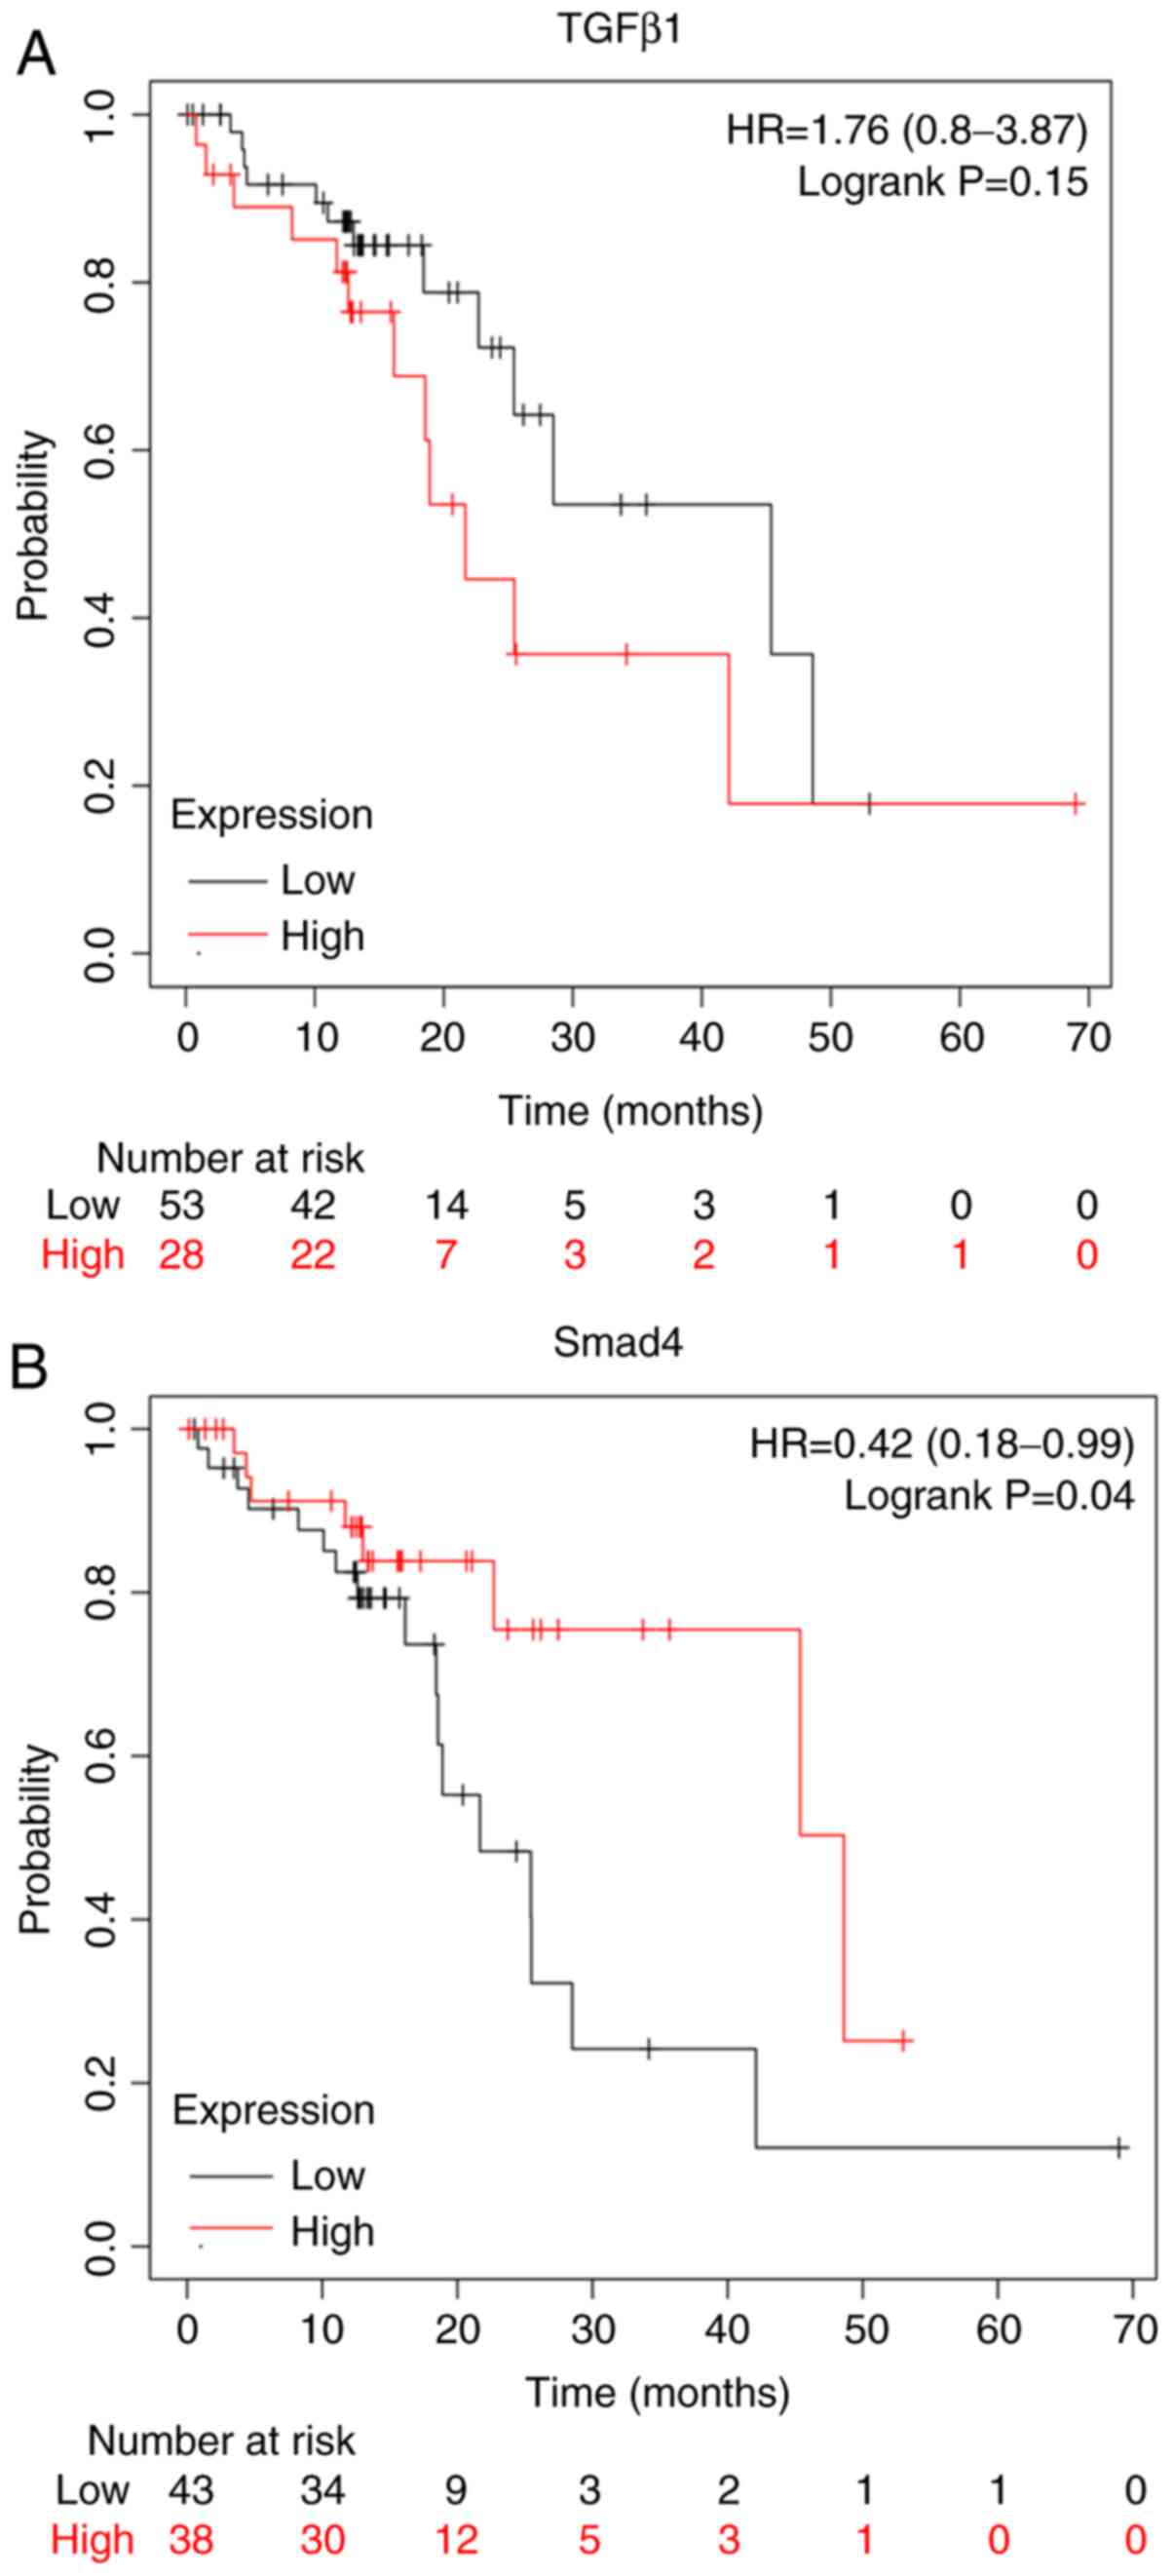
Expression of TGF-β1 and Smad4 is
associated with the survival of patients
The Kaplan-Meier plot (www.kmplot.com/analysis/) for the expression of TGF-β1
and Smad4 proteins assessed the role of these proteins in the
prognosis of patients with ESCC. Overexpression of TGF-β1 proteins
conferred worse survival rates for patients with ESCC (Fig. 2A). On the other hand, the
overexpression of Smad4 conferred better survival rates for
patients with ESCC (Fig. 2B).
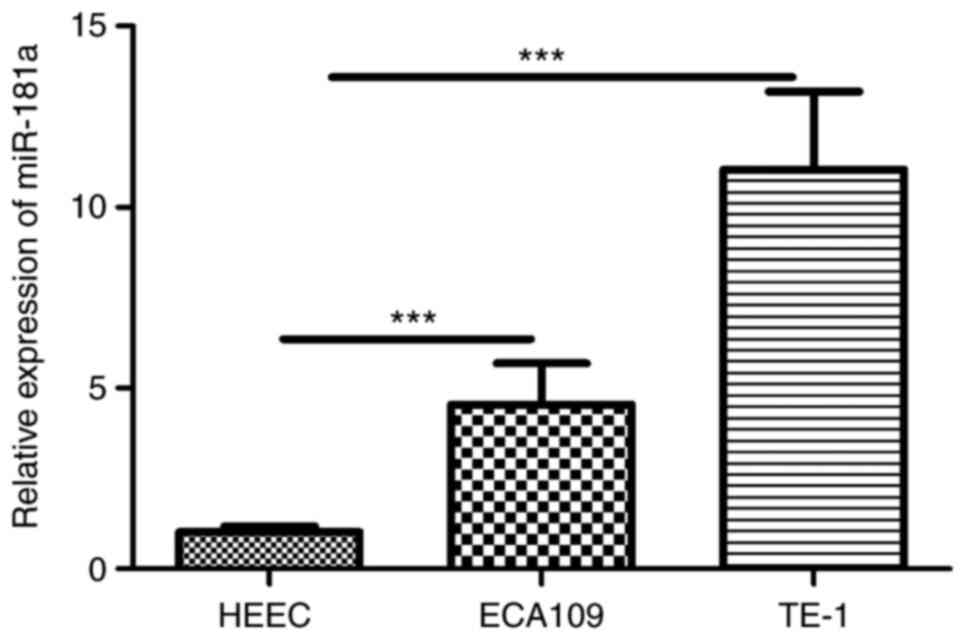
Overexpression of miR-181a promotes
migration, proliferation but inhibits apoptosis of ESCC cells
RT-qPCR revealed miR-181a was overexpressed in ESCC
cells (Fig. 3). To explore the
potential role of miR-181a in ESCC cells, miR-181a expression was
modulated by miR-181a mimics and inhibitor (Fig. 4A and B). Wound healing assay
revealed that miR-181a promoted migration of ECA109 and TE-1 cells.
Consequently, inhibition of miR-181a expression (Fig. 4C and D) markedly disrupted migration
of ECA109 and TE-1 cells. CCK-8 assay further revealed that
compared with controls, overexpression of miR-181a promoted
proliferation of ECA109 and TE-1 cells (Fig. 4E and F). Flow cytometry part
revealed inhibition of miR-181a enhanced apoptosis of ECA109 and
TE-1 cells (Fig. 4G and H).
Therefore, miR-181a potentially promoted tumorigenesis.
 | Figure 4.Overexpression of miR-181a promotes
the migration, proliferation and inhibitors apoptosis of ESCC cells
although downregulation of miR-181a shows the opposite effects.
ECA109 and TE-1 cells were transfected with mimics, inhibitor and
negative control. Cells were divided into four groups: miR-181a
mimics, mimics NC, miR-181a inhibitor and inhibitor NC. (A) The
relative expression of miR-181a of ECA109 was assessed using
RT-qPCR 48 h after transfection. (B) The relative expression of
miR-181a of TE-1 was assessed using RT-qPCR 48 h after
transfection. (C) The migration abilities of ECA109 cells were
detected by wound healing assays (magnification, ×100). (D) The
migration abilities of TE-1 cells were detected by wound healing
assays (magnification, ×100). (E) The proliferation of ECA109 cells
was determined by the CCK-8 assay. (F) The proliferation of TE-1
cells was determined by the CCK-8 assay. (G) The apoptosis rate of
ECA109 cells was measured by flow cytometry. (H) The apoptosis rate
of TE-1 cells was measured by flow cytometry. The date is expressed
at the means ± standard deviation (n=3) of one representative
experiment. *P<0.05, **P<0.01, ***P<0.001. miR, microRNA;
ESCC, esophageal squamous cell carcinoma; NC., negative control;
RT-qPCR, reverse transcription-quantitative PCR; OD, optical
density; PI, propidium iodide. |
miR-181a may promote EMT in ECA109 and
TE-1 cells via the TGF-β/Smad pathway
To explore the mechanism underlying EMT by miR-181a,
the expression of E-cadherin and vimentin proteins in ECA109 and
TE-1 cells transfected with miR-181a mimics or miR-181a inhibitor
was evaluated. E-cadherin and vimentin proteins are markers for EMT
(13). Compared with controls,
E-cadherin mRNA was underexpressed in miR-181a mimics group,
compared with the upregulated expression of vimentin mRNA in the
same group of cells, while the miR-181a inhibitor group exhibited
the opposite effect (Fig. 5A, B, D and
E). The miR-181a mimics group showed a reduction of E-cadherin
protein and enhancement of vimentin protein, while miR-181a
inhibitor group exhibited the opposite effect in ECA109 and TE-1
cells (Fig. 5C and F). These
findings demonstrated that miR-181a regulates EMT in ECA109 and
TE-1 cells.
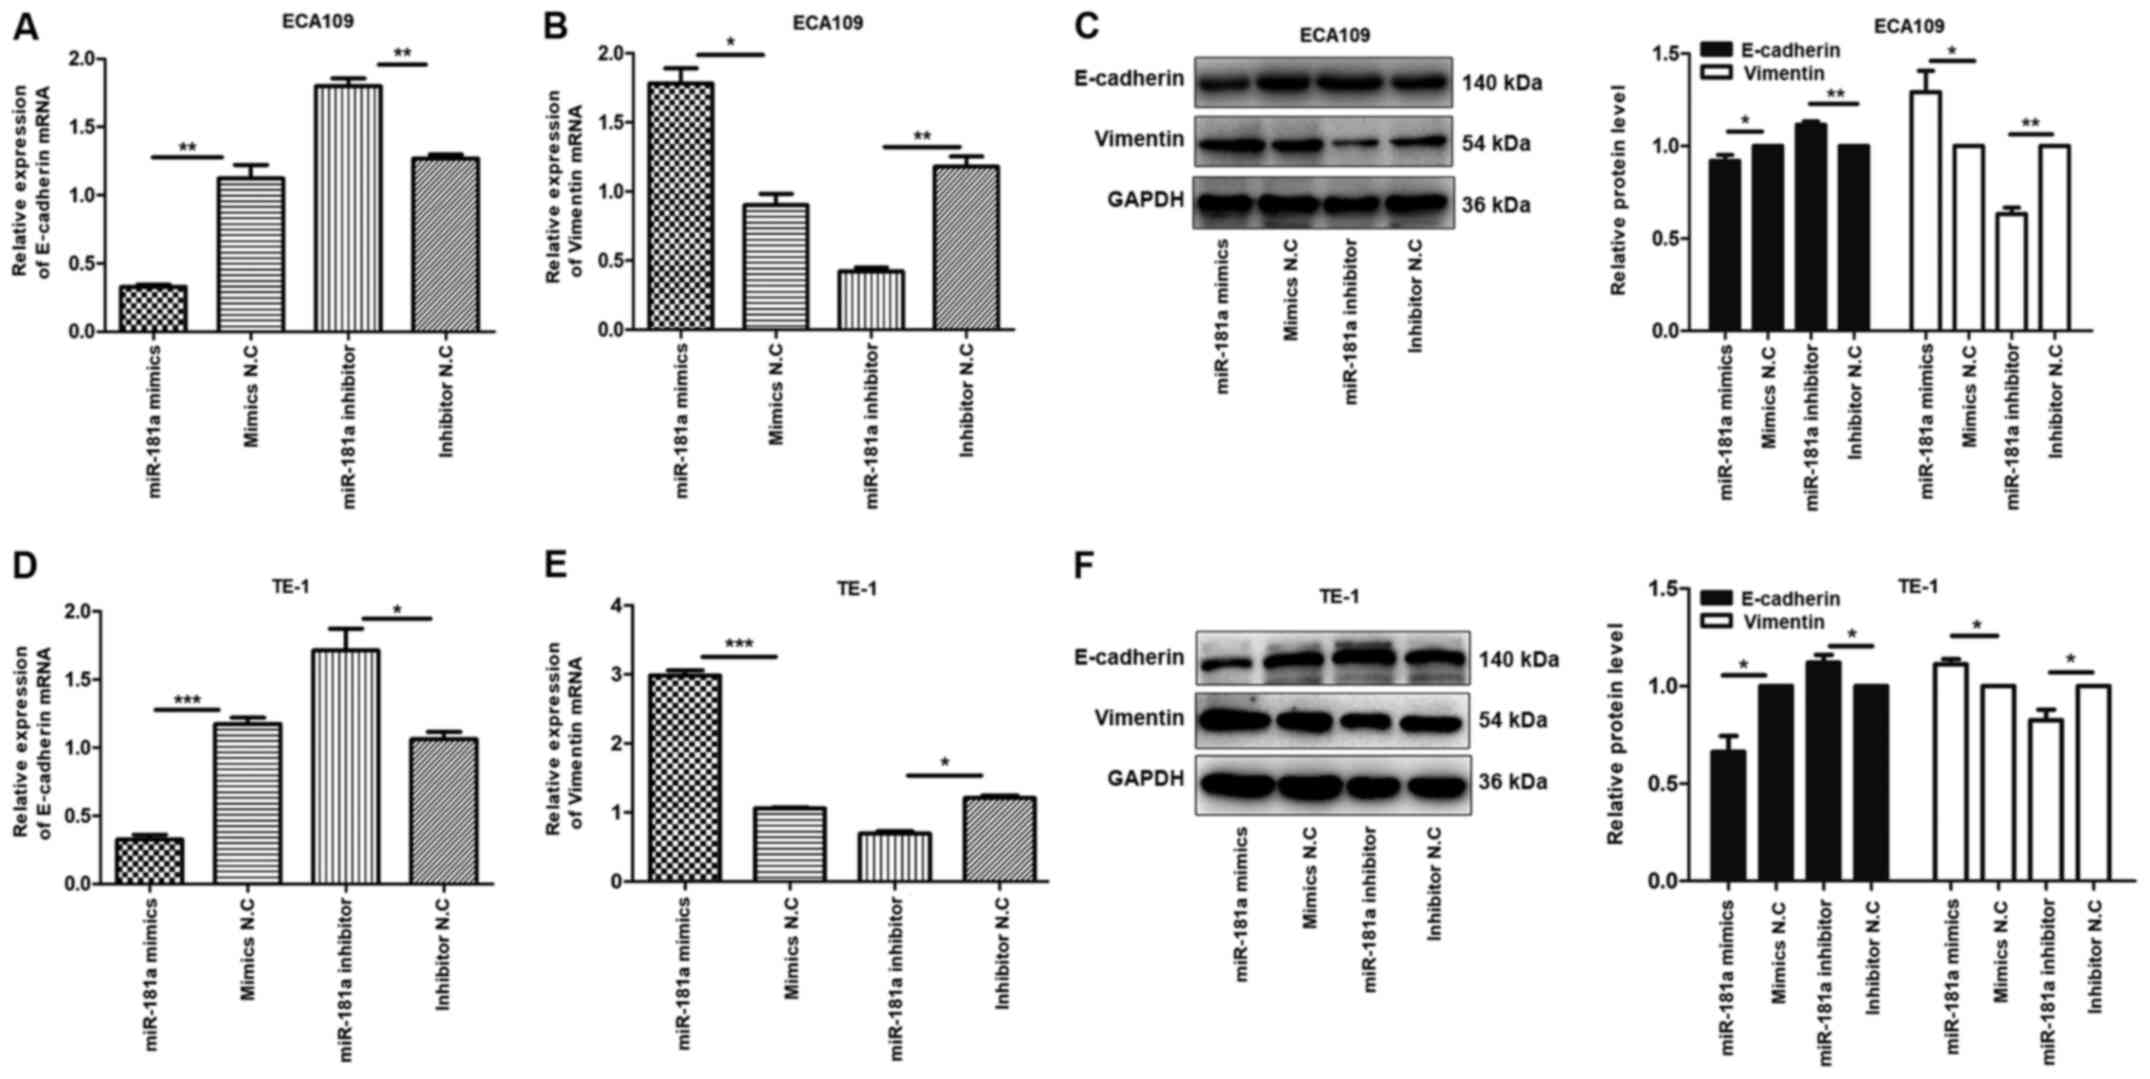 | Figure 5.Overexpression of miR-181a promotes
the EMT of ESCC cells. Instead, the deregulation of miR-181a
suppressed EMT of ESCC cells. The relative mRNA and protein
expression of E-cadherin, Vimentin was detected in ECA109 and TE-1
cells following transfection with mimics, inhibitor and negative
control by RT-qPCR and western blot. GAPDH was used as an internal
control. Values are standardized to an average of 1.0 in the
negative control samples. Cells were divided into four groups:
miR-181a mimics, mimics NC, miR-181a inhibitor, inhibitor NC. (A-C)
The relative mRNA and protein expression of E-cadherin, Vimentin in
ECA109 were assessed using RT-qPCR and western blotting. (D-F) The
relative mRNA and protein expression of E-cadherin, Vimentin in
TE-1 were assessed using RT-qPCR and western blotting. Data were
presented as the means ± standard error of three experimental
results. The t-test was applied to compare differences between
groups where appropriate. *P<0.05, **P<0.01 and
***P<0.001. miR, microRNA; EMT, Epithelial-mesenchymal
transition; ESCC, esophageal squamous cell carcinoma; NC, negative
control; RT-qPCR, reverse transcription-quantitative PCR. |
Research shows that TGF-β/Smad pathway
serves a critical role in EMT (14)
To explore this hypothesis, the expression of TGF-β1
and Smad4 mRNAs and proteins in transfected ECA109 and TE-1 cells
were evaluated. It was found that, compared with controls, the
expression of TGF-β1 mRNA and protein was high in the miR-181a
mimics group, compared with Smad4 mRNA and protein which were
underexpressed. Conversely, miR-181a inhibition modulated the
expression of TGF-β1 mRNA and protein but upregulated that of Smad4
mRNA and protein in ECA109 and TE-1 cells (Fig. 6). Overall, miR-181a promoted EMT in
ESCC via the TGF-β/Smad4 pathway.
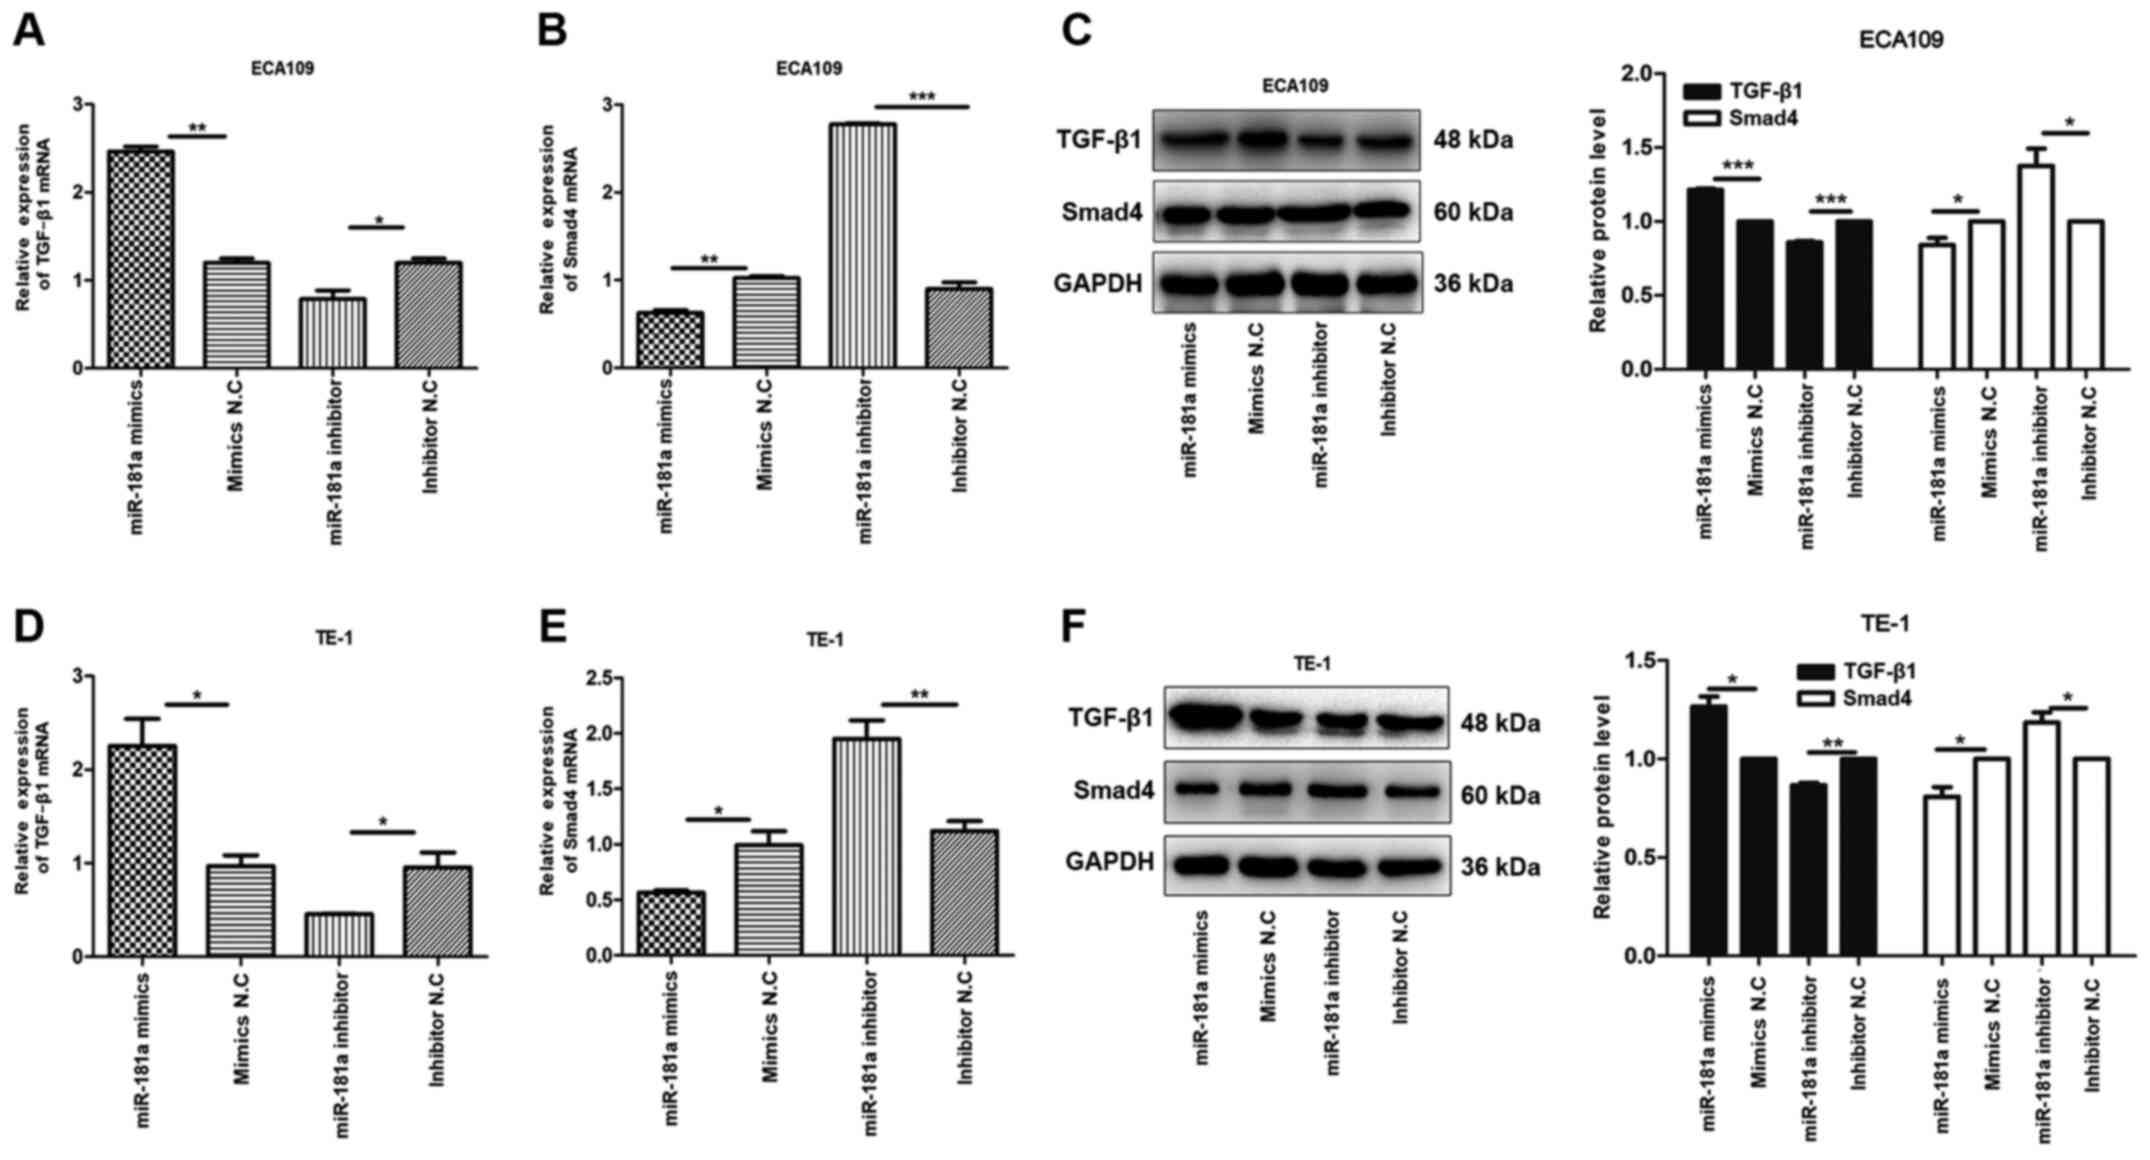 | Figure 6.miR-181a alters the expression of
TGF-β1 and Smad4 of ESCC cells. The relative mRNA and protein
expression of TGF-β1, Smad4 were detected in ECA109 and TE-1 cells
following transfection with mimics, inhibitor and negative control
by RT-qPCR and western blotting. GAPDH was used as an internal
control. Values are standardized to an average of 1.0 in the
negative control samples. Cells were divided into four groups:
miR-181a mimics, mimics NC, miR-181a inhibitor, inhibitor NC. (A-C)
The relative mRNA and protein expression of TGF-β1 and Smad4 in
ECA109 were assessed using RT-qPCR and western blotting. (D-F) The
relative mRNA and protein expression of TGF-β1 and Smad4 in TE-1
were assessed using RT-qPCR and western blotting. Data were
presented as the means ± standard error of three experimental
results. The t-test was applied to compare differences between
groups where appropriate. *P<0.05, **P<0.01, ***P<0.001.
miR, microRNA; ESCC, esophageal squamous cell carcinoma; RT-qPCR,
reverse transcription-quantitative PCR; NC, negative control. |
Discussion
The present study explored the role of miR-181a in
ESCC. Our previous study (8) found
that, compared with adjacent non-cancerous tissues, miR-181a was
upregulated in ESCC. The present study further validated the
overexpression of miR-181a in ESCC cells. Further analyses revealed
that miR-181a promoted migration and proliferation but inhibited
apoptosis of the ESCC cells, consistent with a previous study
(15).
The TGF-β signaling pathway serves a significant
role in cancer progression, mediated by three ligands: TGF-β1,
TGF-β2 and TGF-β3. Binding of TGF-β on TβRII initiates activation
and transphosphorylation of TβRI, which activates downstream
mediators (16). Overexpression of
TGF-β promotes EMT by enhancing migration and invasion of cancer
cells (17). The present study
found the expression of TGF-β1 was upregulated in cancer tissues,
compared with the modulated Smad4. Furthermore, in contrast to
TGF-β1, Smad4 was associated with the survival of patients with
ESCC. However, the expression of both TGF-β1 and Smad4 had no
bearing on any of the clinicopathological factors.
Upregulated expression of miR-181a in pancreatic
cancer tissues promotes EMT by downregulating RKIP (18). miR-181a also accelerates
proliferation, invasion and EMT in gastric cancer by inhibiting
RASSF6 via the MAPK signaling pathway (19). Overexpression of miR-181a also
promotes proliferation, migration and metastasis of prostate cancer
cells by suppressing TGIF2 (20).
In ovarian cancer, upregulated miR-181a expression promotes EMT and
modulates cell apoptosis by inducing paclitaxel resistance
(21). miR-181a also induces
invasion and migration and promotes EMT of lung cancer cells by
disrupting PTEN expression (22).
The present study found miR-181a promotes EMT via TGF-β/Smad
pathway. In particular, miR-181a modulates expression of E-cadherin
in ESCC, compared with vimentin, a mesenchymal marker, which was
upregulated. Thus, in ESCC, upregulation of miR-181a transforms
epithelial cells to mesenchymal phenotype. Overexpression of
miR-181a disrupted expression of Smad4. Even though overwhelming
evidence strongly underlines the oncogenic property of miR-181a,
one study (23) reported that
upregulation of miR-181a expression inhibited proliferation and
induced apoptosis of leukemia cells. miRNAs are both tumor
suppressor genes and oncogenic genes, so miR-181a may serve a
different role in different types of cancer. Future studies will
further investigate the role of miRNA-181a in different types of
cancer to resolve the above conflicting findings.
Overall, the present study revealed that miR-181a
was overexpressed in ESCC cancer cells, where it promoted EMT by
inhibiting Smad4 via the TGF-β/Smad pathway. Consequently, miR-181a
is a potential target for the treatment of ESCC cancer.
Acknowledgements
Not applicable.
Funding
No funding was received.
Availability of data and materials
The datasets used and/or analyzed during the current
study are available from the corresponding author on reasonable
request.
Authors' contributions
RX, XMZ and YSL performed the experiments. RX, XMZ,
YSL and LR performed the data analysis and data validation. RX and
XRH prepared and wrote the original draft and reviewed and edited
the manuscript. RX and XRH designed and conceived the study. XRH
contributed experimental materials. All authors read and approved
the final manuscript. RX and XRH confirm the authenticity of all
the raw data.
Ethics approval and consent to
participate
The present study was approved by the Ethics Review
Committee of The Affiliated Hospital of North Sichuan Medical
College.
Patient consent for publication
Not applicable.
Competing interests
The authors declare that they have no competing
interests.
References
|
1
|
Chen W, Zheng R, Zuo T, Zeng H, Zhang S
and He J: National cancer incidence and mortality in China, 2012.
Chin J Cancer Res. 28:1–11. 2016. View Article : Google Scholar : PubMed/NCBI
|
|
2
|
Chen W, Zheng R, Baade PD, Zhang S, Zeng
H, Bray F, Jemal A, Yu XQ and He J: Cancer statistics in China,
2015. CA Cancer J Clin. 66:115–132. 2016. View Article : Google Scholar : PubMed/NCBI
|
|
3
|
Cui Y, Zhang L, Wang W, Ma S, Liu H, Zang
X, Zhang Y and Guan F: Downregulation of nicotinamide
N-methyltransferase inhibits migration and epithelial-mesenchymal
transition of esophageal squamous cell carcinoma via Wnt/β-catenin
pathway. Mol Cell Biochem. 460:93–103. 2019. View Article : Google Scholar : PubMed/NCBI
|
|
4
|
Zeng H, Zheng R, Zhang S, Zuo T, Xia C,
Zou X and Chen W: Esophageal cancer statistics in China, 2011:
Estimates based on 177 cancer registries. Thorac Cancer. 7:232–237.
2016. View Article : Google Scholar : PubMed/NCBI
|
|
5
|
Haslehurst AM, Koti M, Dharsee M, Nuin P,
Evans K, Geraci J, Childs T, Chen J, Li J, Weberpals J, et al: EMT
transcription factors snail and slug directly contribute to
cisplatin resistance in ovarian cancer. BMC Cancer. 12:912012.
View Article : Google Scholar : PubMed/NCBI
|
|
6
|
Feng H, Liu Q, Zhang N, Zheng L, Sang M,
Feng J, Zhang J, Wu X and Shan B: Leptin promotes metastasis by
inducing an epithelial-mesenchymal transition in A549 lung cancer
cells. Oncol Res. 21:165–171. 2013. View Article : Google Scholar : PubMed/NCBI
|
|
7
|
Inui M, Martello G and Piccolo S: MicroRNA
control of signal transduction. Nat Rev Mol Cell Biol. 11:252–263.
2010. View
Article : Google Scholar : PubMed/NCBI
|
|
8
|
Li YH, Li YS, Zhang RJ, Zhou XM and He XR:
Expression of miR-181a-5p, miR-320a and TGF-β1 in esophageal
squamous cell carcinoma. J Cancer Control Treat. 32:395–401.
2019.
|
|
9
|
Shukla SK, Khatoon J, Prasad KN, Rai RP,
Singh AK, Kumar S, Ghoshal UC and Krishnani N: Transforming growth
factor beta 1 (TGF-β1) modulates Epstein-Barr virus reactivation in
absence of Helicobacter pylori infection in patients with gastric
cancer. Cytokine. 77:176–179. 2016. View Article : Google Scholar : PubMed/NCBI
|
|
10
|
Sun NF, Xue Y, Dai T and Li X: D. and
Zheng NX: Tripartite motif containing 25 promotes proliferation and
invasion of colorectal cancer cells through TGF-β signaling. Biosci
Rep. Jul 12–2017.(Epub ahead of print). doi: 10.1042/BSR20170805.
View Article : Google Scholar
|
|
11
|
Chang H, Kim N, Park JH, Nam RH, Choi YJ,
Park SM, Choi YJ, Yoon H, Shin CM and Lee DH: Helicobacter
pylori might induce TGF-β1-mediated EMT by means of cagE.
Helicobacter. 20:438–448. 2015. View Article : Google Scholar : PubMed/NCBI
|
|
12
|
Livak KJ and Schmittgen TD: Analysis of
relative gene expression data using real-time quantitative PCR and
the 2(-Delta Delta C(T)) method. Methods. 25:402–408. 2001.
View Article : Google Scholar : PubMed/NCBI
|
|
13
|
Serrano-Gomez SJ, Maziveyi M and Alahari
SK: Regulation of epithelial-mesenchymal transition through
epigenetic and post-translational modifications. Mol Cancer.
15:182016. View Article : Google Scholar : PubMed/NCBI
|
|
14
|
Xu J, Lamouille S and Derynck R:
TGF-beta-induced epithelial to mesenchymal transition. Cell Res.
19:156–172. 2009. View Article : Google Scholar : PubMed/NCBI
|
|
15
|
Zhu D, Yu Y, Qi Y, Wu K, Liu D, Yang Y,
Zhang C and Zhao S: Long non-coding RNA CASC2 enhances the
antitumor activity of cisplatin through suppressing the Akt pathway
by inhibition of miR-181a in esophageal squamous cell carcinoma
cells. Front Oncol. 9:3502019. View Article : Google Scholar : PubMed/NCBI
|
|
16
|
Yang L, Pang Y and Moses HL: TGF-beta and
immune cells: An important regulatory axis in the tumor
microenvironment and progression. Trends Immunol. 31:220–227. 2010.
View Article : Google Scholar : PubMed/NCBI
|
|
17
|
Morikawa M, Derynck R and Miyazono K:
TGF-β and the TGF-β family: Context-dependent roles in cell and
tissue physiology. Cold Spring Harb Perspect Biol. 8:82016.
View Article : Google Scholar
|
|
18
|
Kang H, Ma D, Zhang J, Zhao J and Yang M:
MicroRNA-18a induces epithelial-mesenchymal transition like cancer
stem cell phenotype via regulating RKIP pathway in pancreatic
cancer. Ann Transl Med. 8:4332020. View Article : Google Scholar : PubMed/NCBI
|
|
19
|
Mi Y, Zhang D, Jiang W, Weng J, Zhou C,
Huang K, Tang H, Yu Y, Liu X, Cui W, et al: miR-181a-5p promotes
the progression of gastric cancer via RASSF6-mediated MAPK
signalling activation. Cancer Lett. 389:11–22. 2017. View Article : Google Scholar : PubMed/NCBI
|
|
20
|
Zhiping C, Shijun T, Linhui W, Yapei W,
Lianxi Q and Qiang D: MiR-181a promotes epithelial to mesenchymal
transition of prostate cancer cells by targeting TGIF2. Eur Rev Med
Pharmacol Sci. 21:4835–4843. 2017.PubMed/NCBI
|
|
21
|
Li L, Xu QH, Dong YH, Li GX, Yang L, Wang
LW and Li HY: MiR-181a upregulation is associated with
epithelial-to-mesenchymal transition (EMT) and multidrug resistance
(MDR) of ovarian cancer cells. Eur Rev Med Pharmacol Sci.
20:2004–2010. 2016.PubMed/NCBI
|
|
22
|
Li H, Zhang P, Sun X, Sun Y, Shi C, Liu H
and Liu X: MicroRNA-181a regulates epithelial-mesenchymal
transition by targeting PTEN in drug-resistant lung adenocarcinoma
cells. Int J Oncol. 47:1379–1392. 2015. View Article : Google Scholar : PubMed/NCBI
|
|
23
|
Wang JJ and Yu JP: miR-181a down-regulates
MAP2K1 to enhance adriamycin sensitivity in leukemia HL-60 cells.
Eur Rev Med Pharmacol Sci. 23:2497–2504. 2019.PubMed/NCBI
|