Introduction
Hepatocellular carcinoma is responsible for >90%
of liver cancer (LC) cases and is the second most common cause of
cancer-associated death worldwide (1,2). The
main risk factors for LC include viral infection, excessive alcohol
consumption, non-alcoholic fatty liver disease and toxins, such as
aflatoxin-B found in contaminated food (3,4).
Unfortunately, most patients are diagnosed at a late stage, given
the asymptomatic nature of LC, and advanced LC is not amenable to
curative strategies (5). Therefore,
identifying alternative and innovative therapeutic strategies for
the systematic treatment of LC is important.
Altered energy metabolism has been accepted as one
of the typical hallmarks of cancer cells (5). The Warburg effect is defined as a
phenomenon in which glucose is preferentially utilized by
glycolysis, rather than by oxidative phosphorylation, and is
characterized by high rates of lactate production and glucose
uptake even in the presence of oxygen (6,7).
Phosphofructokinase-1, pyruvate kinase M2, pyruvate dehydrogenase
kinase-1, lactate dehydrogenase and hexokinase-2 (HK2) have emerged
as indispensable glycolytic enzymes that catalyze the Warburg
effect (8). Among these glycolytic
enzymes, HKs catalyze the irreversible first step of the glycolytic
pathway in which glucose is phosphorylated to glucose-6-phosphate
with the concomitant dephosphorylation of adenosine triphosphate
(9). Notably, HK2 has been
identified as a central player in the Warburg effect and has been
proposed as a metabolic target for the development of cancer
therapies (10). Therefore,
understanding how the Warburg effect is regulated in cancer is
particularly relevant for identifying novel therapeutic
interventions.
Some traditional Chinese medicines have attracted
increasing attention due to their potent antitumor activities and
potential as candidates for the advancement of new antitumor drugs
(11,12). Extracted from the roots of
Glycyrrhiza glabra, glycyrrhizin (GA) has been reported to
possess numerous pharmacological effects, including
anti-inflammatory and anti-viral activities (13). Furthermore, it has recently been
demonstrated that GA has a markedly hepatoprotective effect
(13–15); however, the association between GA
and the regulation of cellular metabolism in LC remains largely
unexplored.
The aim of the present study was to investigate the
regulatory association between GA and glycolytic enzyme HK2 in
order to improve the current understanding of the mechanisms
underlying LC progression.
Materials and methods
Short tandem repeat (STR) analysis of
the LC HepG2 cell line
DNA was extracted using a genome extraction kit
(Axygen; Corning, Inc.) and amplified by the 21-STR amplification
protocol. The STR locus and amelogenin gene were examined on an ABI
3730XL DNA analyzer (Applied Biosystems; Thermo Fisher Scientific,
Inc.).
Cell culture
The LC HepG2 cell line was obtained from The Cell
Bank of Type Culture Collection of The Chinese Academy of Sciences.
Cells were cultured in Dulbecco's modified Eagle's medium (DMEM;
Gibco; Thermo Fisher Scientific, Inc.) supplemented with 10% fetal
bovine serum (FBS; Gibco; Thermo Fisher Scientific, Inc.) in an
atmosphere containing 5% CO2 at 37°C. Small interfering
(si)-HK2 (ACGACAGCATCATTGTTAA), si-negative control (NC),
pCDNA3.1-HK2 vector and pCDNA3.1 vector were synthesized by
Shanghai GenePharma Co., Ltd. The cells were seeded in 6-well
plates at a density of 3×10⁵ cells/well and underwent
cell transfection once cell confluence reached 40–60%. Cell
transfection was conducted using Lipofectamine® 2000
(Invitrogen; Thermo Fisher Scientific, Inc.) according to the
manufacturer's instructions. The transfection dose of si-HK2 and
pcDNA3.1-HK2 was 2 µg and transfection time was 24 h. After 24 h,
the cells were assigned to the following nine groups accordingly:
GA group (exposed to 100 µg/ml GA for 24 h; Tokyo Chemical Industry
Co., Ltd.), si-HK2 group (transfected with si-HK2), si-NC group
(transfected with si-NC), pCDNA3.1-HK2 group (transfected with
pCDNA3.1-HK2), pCDNA3.1 group (transfected with pCDNA3.1),
pCDNA3.1-HK2 + GA group (transfected with pCDNA3.1-HK2 followed by
24 h treatment with 100 µg/ml GA), SC79 group (exposed to 4 µg/ml
AKT agonist SC79 for 6 h; Calbiochem; Merck KgaA), SC79 + GA group
(exposed to 4 µg/ml SC79 for 6 h and 100 µg/ml GA for 24 h) and
control group (untreated).
Cell Counting Kit-8 assay
Cells were seeded into 96-well plates (5,000
cells/well). A total of three replicates were set for each sample.
LC cells HepG2 were treated with different concentrations of GA
solution (0, 25, 50, 75, 100 and 125 µg/ml) for 24 h. Then, cells
were analyzed daily for 4 consecutive days to assess cell
proliferation by CCK-8 assay. Briefly, 10 µl CCK-8 solution (Thermo
Fisher Scientific, Inc.) was added to each well and the plates were
incubated at 37°C for 2 h. The absorbance of the wells was
determined at a 450-nm wavelength using a microplate absorbance
reader. Cell viability (%) = (average OD value of the experimental
group - average OD value of the Blank group)/(average OD value of
the Control group - average OD value of the Blank group) ×
100%.
EdU staining
Cells (1×10⁵/well) were seeded into
96-well plates and 100 µl EdU (50 µM; Sigma-Aldrich; Merck KGaA)
was added to each well for 2-h incubation at 37°C. Subsequently,
cells were fixed for 30 min at room temperature with 50 µl fixation
buffer (4% paraformaldehyde; Beyotime Institute of Biotechnology).
Following removal of the fixation buffer from the plates, the cells
were incubated with 50 µl 2 mg/ml glycine at room temperature for 5
min, prior to washing with 100 µl PBS, exposure to 100 µl
permeabilization buffer (phosphate-buffered saline containing 0.3%
Triton X-100; Beyotime Institute of Biotechnology) and further
washing with 100 µl PBS. The cells were then incubated with 100 µl
1X Apollo solution (Sigma-Aldrich; Merck KGaA) for 30 min at 37°C
in the dark. Subsequently, the cells were incubated with 100 µl 1X
DAPI solution (Sigma-Aldrich; Merck KGaA) at room temperature for
30 min and washed with 100 µl PBS prior to observation under a
fluorescence microscope (Olympus Corporation).
Analysis of glucose uptake
capacity
Glucose uptake was measured using a glucose uptake
colorimetric assay kit (cat. no. ab136955; Abcam) according to the
manufacturer's instructions. Briefly, the cells (5,000 cells/well)
were serum-starved overnight in a 96-well plate with DMEM, and were
then cultured with Krebs-Ringer-Phosphate-HEPES buffer (20 mM
HEPES, 5 mM KH2PO4, 1 mM MgSO4, 1
mM CaCl2, 136 mM NaCl, 4.7 mM KCl; pH 7.4) containing 2%
bovine serum albumin (Sigma-Aldrich; Merck KGaA) at room
temperature for 40 min. The cells were incubated in normal or
high-glucose DMEM, and were treated with 10 µl 2-deoxy-glucose
(2-DG; Abcam) for 20 min at 37°C. The concentration of high-glucose
DMEM was 25 mM. The substrate oxidation reaction was measured at a
wavelength of 412 nm with a microplate absorbance reader (Thermo
Fisher Scientific, Inc.), and the data were organized by Microsoft
Excel (Microsoft Office 2003).
Measurement of lactic acid
formation
The levels of lactic acid were determined using a
lactate assay kit (BioVision, Inc.). Cells (5×10⁶/well)
were incubated with the reaction mixture in a 96-well plate at room
temperature in the dark for 30 min. The lactate level was examined
using a microplate reader (Thermo Fisher Scientific, Inc.) at a
wavelength of 450 nm before analysis by Microsoft Excel.
Determination of extracellular
acidification rate (ECAR) and oxygen consumption rate (OCR)
The ECAR and OCR were determined every 7 min for 77
min using a Seahorse XFe96 analyzer (Seahorse Bioscience; Agilent
Technologies, Inc.). Cells (1×10⁴/well) were seeded in
Seahorse XFe96 plates. After measuring the basal ECAR, the cells
were incubated with 10 mM glucose/well to test the capacity of
glycolysis, followed by the addition of 1 µM oligomycin for
inhibition of oxidative phosphorylation to inspect the maximum
glycolytic ability of the cells. Finally, the glycolysis inhibitor
2-DG (50 mM) was added to determine acid production by
non-glycolytic pathways. All reagents were added at 0 min and the
incubation temperature was maintained at 38.5°C. Cells were
detected every 7 min following continuous administration of 10 mM
glucose and inhibitors (1 µM oligomycin and 50 mM 2-DG). For the
OCR examination, the basal OCR was first evaluated, after which the
oxygen consumption for ATP synthesis was assessed after exposure to
2 µM oligo, an ATP synthase inhibitor. The maximum oxygen
consumption capacity of the cells was assessed after cells were
given 2 µM mitochondrial uncoupler (FCCP), and the cells were then
treated with mitochondrial respiratory chain inhibitors antimycin A
(0.5 µM) and oligomycin to prevent oxygen consumption by the
mitochondria. All reagents were added at 0 min and the incubation
temperature was maintained at 38.5°C. Cells were measured every 7
min following continuous administration of 2.0 oligomycin, 2.0 FCCP
and 0.5 µM antimycin A. All reagents in this experiment were
purchased from Sigma-Aldrich (Merck KGaA).
Reverse transcription-quantitative PCR
(RT-qPCR)
Total RNA was extracted from the cells using
TRIzol® (Invitrogen; Thermo Fisher Scientific, Inc.)
according to the manufacturer's protocol. After quantification
using a spectrophotometer (Shimadzu Corporation), RNA samples were
reverse transcribed into cDNA using a universal cDNA synthesis kit
(Toyobo Life Science). The RT conditions were as follows: 37°C for
15 min, 85°C for 5 sec and 4°C. A SYBR Green PCR kit (Toyobo Life
Science) was employed to perform RT-qPCR on the cDNA, and mRNA
expression levels were detected using a PRISM 7300 real-time PCR
system (Applied Biosystems; Thermo Fisher Scientific, Inc.).
Samples underwent predenaturation at 95°C for 5 min, followed by 40
cycles consisting of a 10-sec denaturing step at 95°C, a 10-sec
annealing step at 60°C and a 20-sec extension step at 72°C. The
final extension was at 72°C for 10 min. The reference gene of mRNA
was set as GAPDH. Results were analyzed using the 2−ΔΔCq
method (16) and the primers for
GAPDH and HK2 are shown in Table
I.
 | Table I.Primer sequences of HK2 and GAPDH. |
Table I.
Primer sequences of HK2 and GAPDH.
| Name | Primer sequence |
|---|
| HK2 | F:
5′-AATGCTTCCATCTTATGCCCC-3′ |
|
| R:
5′-CCACGAACACCAGGTTCAGG-3′ |
| GAPDH | F:
5′-TCTTGTGCAGTGCCAGCCT-3′ |
|
| R:
5′-TGAGGTCAATGAAGGGGTCG-3′ |
Western blotting
Cells were lysed with RIPA lysis buffer (Beyotime
Institute of Biotechnology) to obtain the protein samples. The
protein concentration was measured using a BCA kit (Pierce; Thermo
Fisher Scientific, Inc.). Proteins (100 µg/well) were separated by
8% SDS-PAGE and transferred onto PVDF membranes. Subsequently, the
membranes were blocked in 5% non-fat dry milk at room temperature
for 1 h, followed by incubation with primary antibodies against
rabbit-derived GAPDH (1:10,000; cat. no. ab181602), HK2 (1:1,000;
cat. no. ab209847), AKT (1:10,000; cat. no. ab179463) and
phosphorylated (p)-AKT (1:1,000; cat. no. ab38449) (all Abcam)
overnight at 4°C. The membranes were then washed with 0.1%
TBS-Tween-20 (TBST) and incubated with a goat anti-rabbit IgG
secondary antibody (1:5,000; cat. no. CW0103; Beijing ComWin
Biotech Co., Ltd.) at room temperature for 2 h. After washing with
TBST three times, blots were visualized in a Gel imaging system (GE
Healthcare) using an Efficient chemiluminescence kit (Proandy).
ImageJ software (version1 46; National Institutes of Health) was
used to analyze the gray level of blots.
Statistical analysis
Statistical analysis was conducted using GraphPad
Prism 7.0 software (GraphPad Software, Inc.). Data are expressed as
the mean ± SD (n=3). Student's unpaired t-test was employed to
compare between two groups. Comparisons among multiple groups were
analyzed by one-way ANOVA followed by Dunnett's multiple comparison
test. P<0.05 was considered to indicate a statistically
significant difference.
Results
GA suppresses the Warburg effect and
proliferation in LC cells and hinders activation of the PI3K/AKT
pathway
The LC cell line HepG2 was exposed to different
concentrations of GA (0, 25, 50, 75, 100 and 125 µg/ml) for 24 h
and incubated with CCK-8 solution to measure cell viability. It was
revealed that the viability of HepG2 cells decreased with the
increase in GA concentration, and the inhibitory effect of GA on
cell viability was ~50% when the concentration of GA was 100 µg/ml
(Fig. 1A). GA at the concentration
of 100 µg/ml exerted ~50% inhibitory effect. Therefore, the
concentration of GA at 100 µg/ml was selected for subsequent
experiments. Subsequently, the CCK-8 assay was utilized to
determine LC cell proliferation after HepG2 cells were exposed to
100 µg/ml GA. The results demonstrated that GA treatment
significantly inhibited LC cell proliferation compared with that in
the control group (Fig. 1A; GA vs.
control group; P<0.05), and the results of EdU staining
corroborated this finding, in that a lower percentage of
EdU-positive cells was detected in the GA group compared with the
percentage detected in the control group (Fig. 1B; P<0.01). These findings
demonstrated the ability of GA to suppress cell proliferation. To
investigate whether GA affects cell metabolism, glucose uptake
capacity and lactic acid content were assessed in HepG2 cells; the
results revealed that the glucose uptake capacity (Fig. 1C) and lactic acid content (Fig. 1D) of cells in the GA group were
significantly lower than those in the control group
(P<0.01).
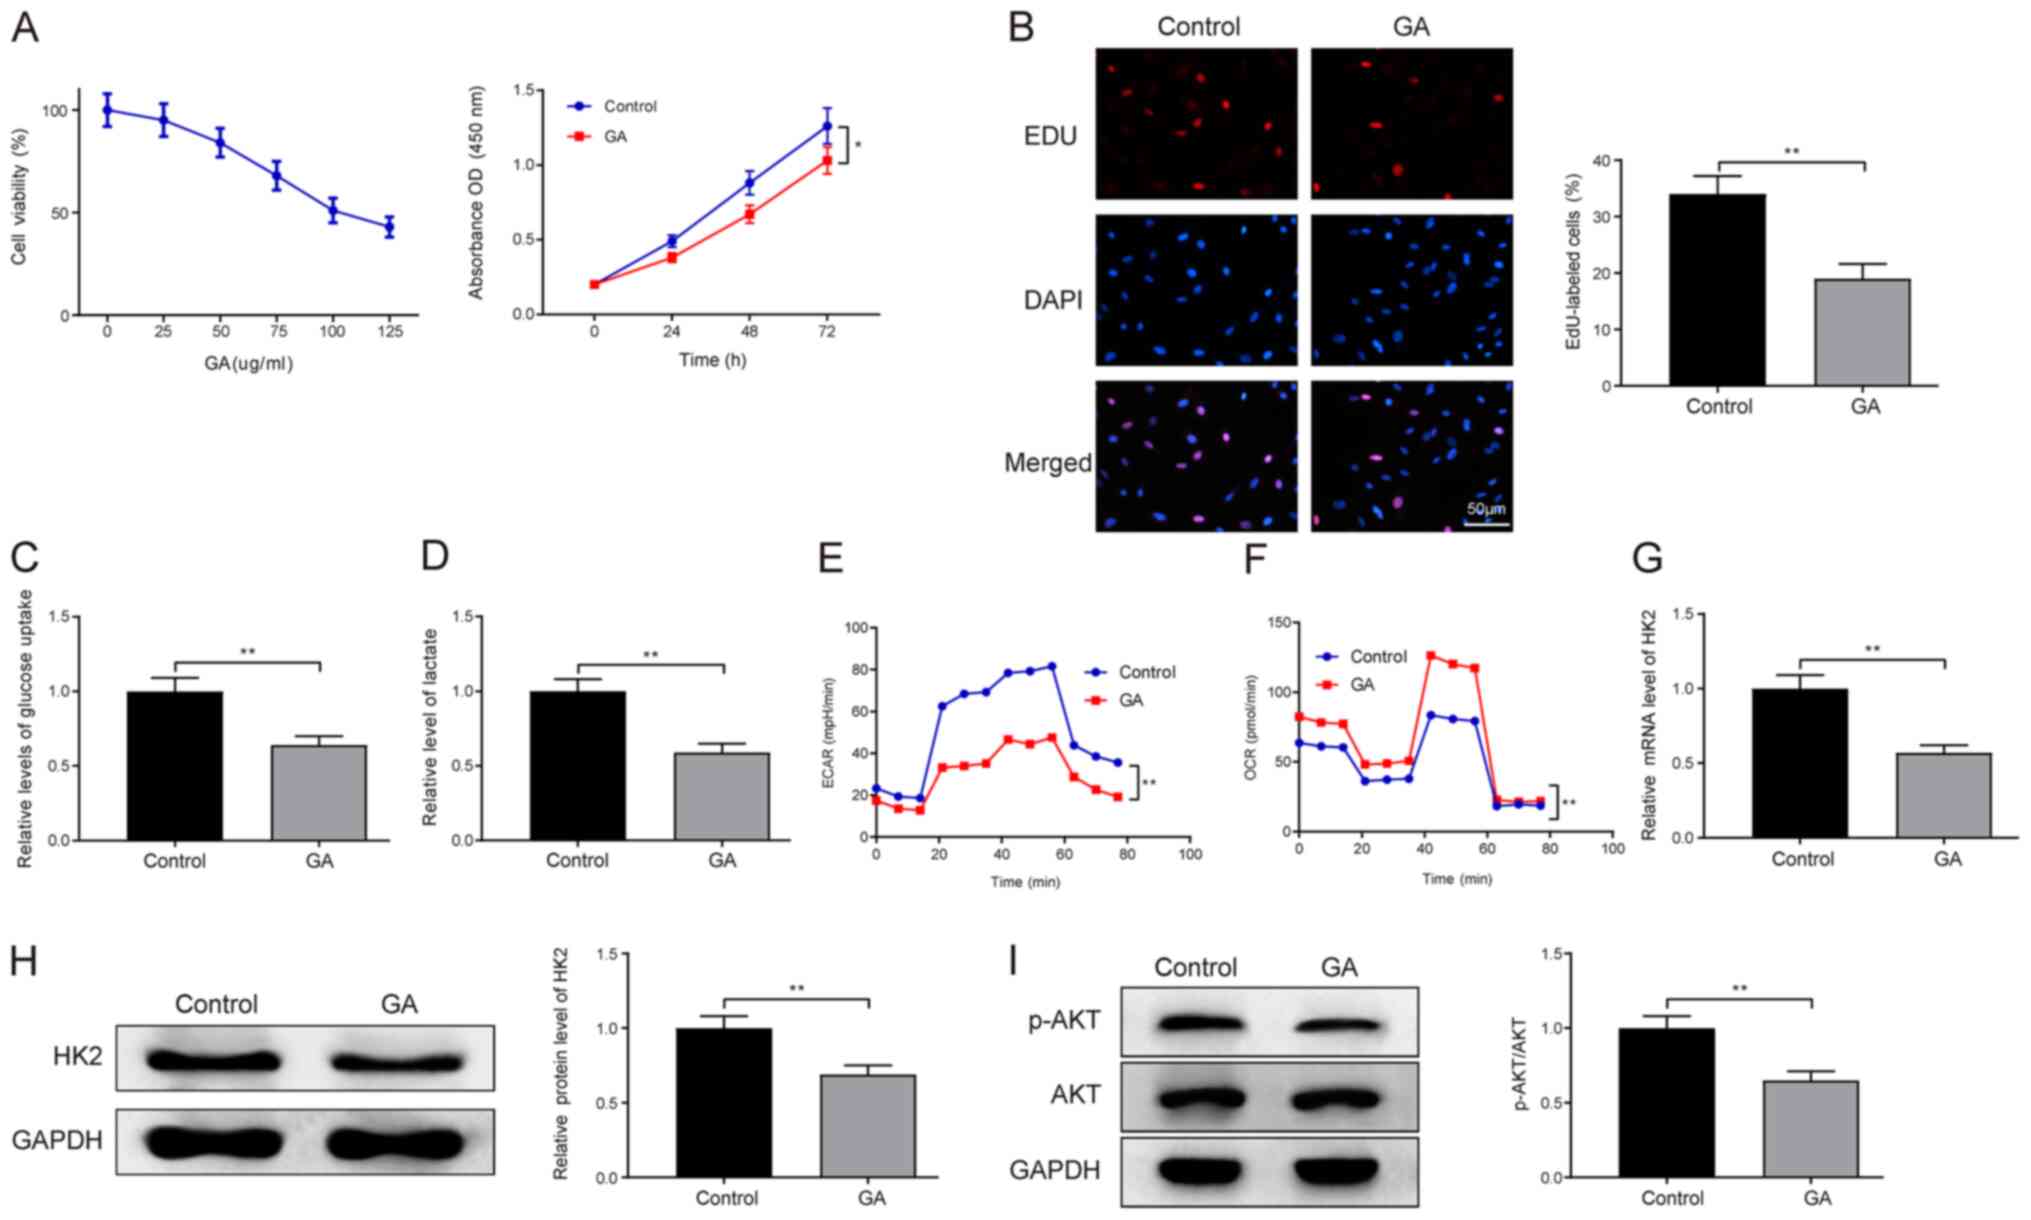 | Figure 1.GA impedes LC cell proliferation and
the Warburg effect, and blocks the PI3K/AKT pathway. The LC HepG2
cell line was treated with different concentrations of GA (0, 25,
50, 75, 100 and 125 µg/ml) for 24 h, followed by analysis of cell
viability using the CCK-8 assay. Subsequently, 100 µg/ml GA was
chosen for the following experiments. (A) CCK-8 assay and (B) EdU
staining were used to assess cell proliferation. (C) A glucose
uptake colorimetric assay kit was used to measure glucose uptake
capacity and (D) a lactate assay kit was used to assess lactic acid
content. A Seahorse XFe96 analyzer was used to detect (E) ECAR and
(F) OCR. (G) mRNA and (H) protein expression levels of HK2, and (I)
the phosphorylation level of AKT, were analyzed by reverse
transcription-quantitative PCR and western blotting. Data are
presented as the mean ± standard deviation. *P<0.05,
**P<0.01. LC, liver cancer; CCK-8, Cell Counting Kit-8; ECAR,
extracellular acidification rate; OCR, oxygen consumption rate;
HK2, hexokinase-2; GA, glycyrrhizin; p-AKT, phosphorylated-AKT. |
Evaluation of the ECAR in glycolytic flux and the
OCR in mitochondrial respiration demonstrated that LC cells in the
GA group had an elevated OCR (Fig.
1F; GA vs. control group; P<0.01) and a suppressed ECAR
(Fig. 1E; GA vs. control group;
P<0.01), indicating the suppressive role of GA on the Warburg
effect. RT-qPCR (Fig. 1G; GA vs.
control group) and western blotting (Fig. 1H; GA vs. control group) revealed
that the expression levels of HK2 were diminished in HepG2 cells
following GA exposure, illustrating that GA may hamper HK2
expression (P<0.01).
To further study the mechanism underlying the
effects of GA on LC, the phosphorylation level of AKT in the
PI3K/AKT signaling pathway was measured by western blotting. The
results revealed that the phosphorylation level of AKT was
decreased in the cells of the GA group compared with that in the
control group (Fig. 1I; P<0.01),
indicating that GA may interfere with the PI3K/AKT signaling
pathway. Taken together, these observations suggested that GA may
hinder the Warburg effect, cell proliferation and HK2 expression in
LC cells. In addition, GA could block the PI3K/AKT pathway in LC
cells.
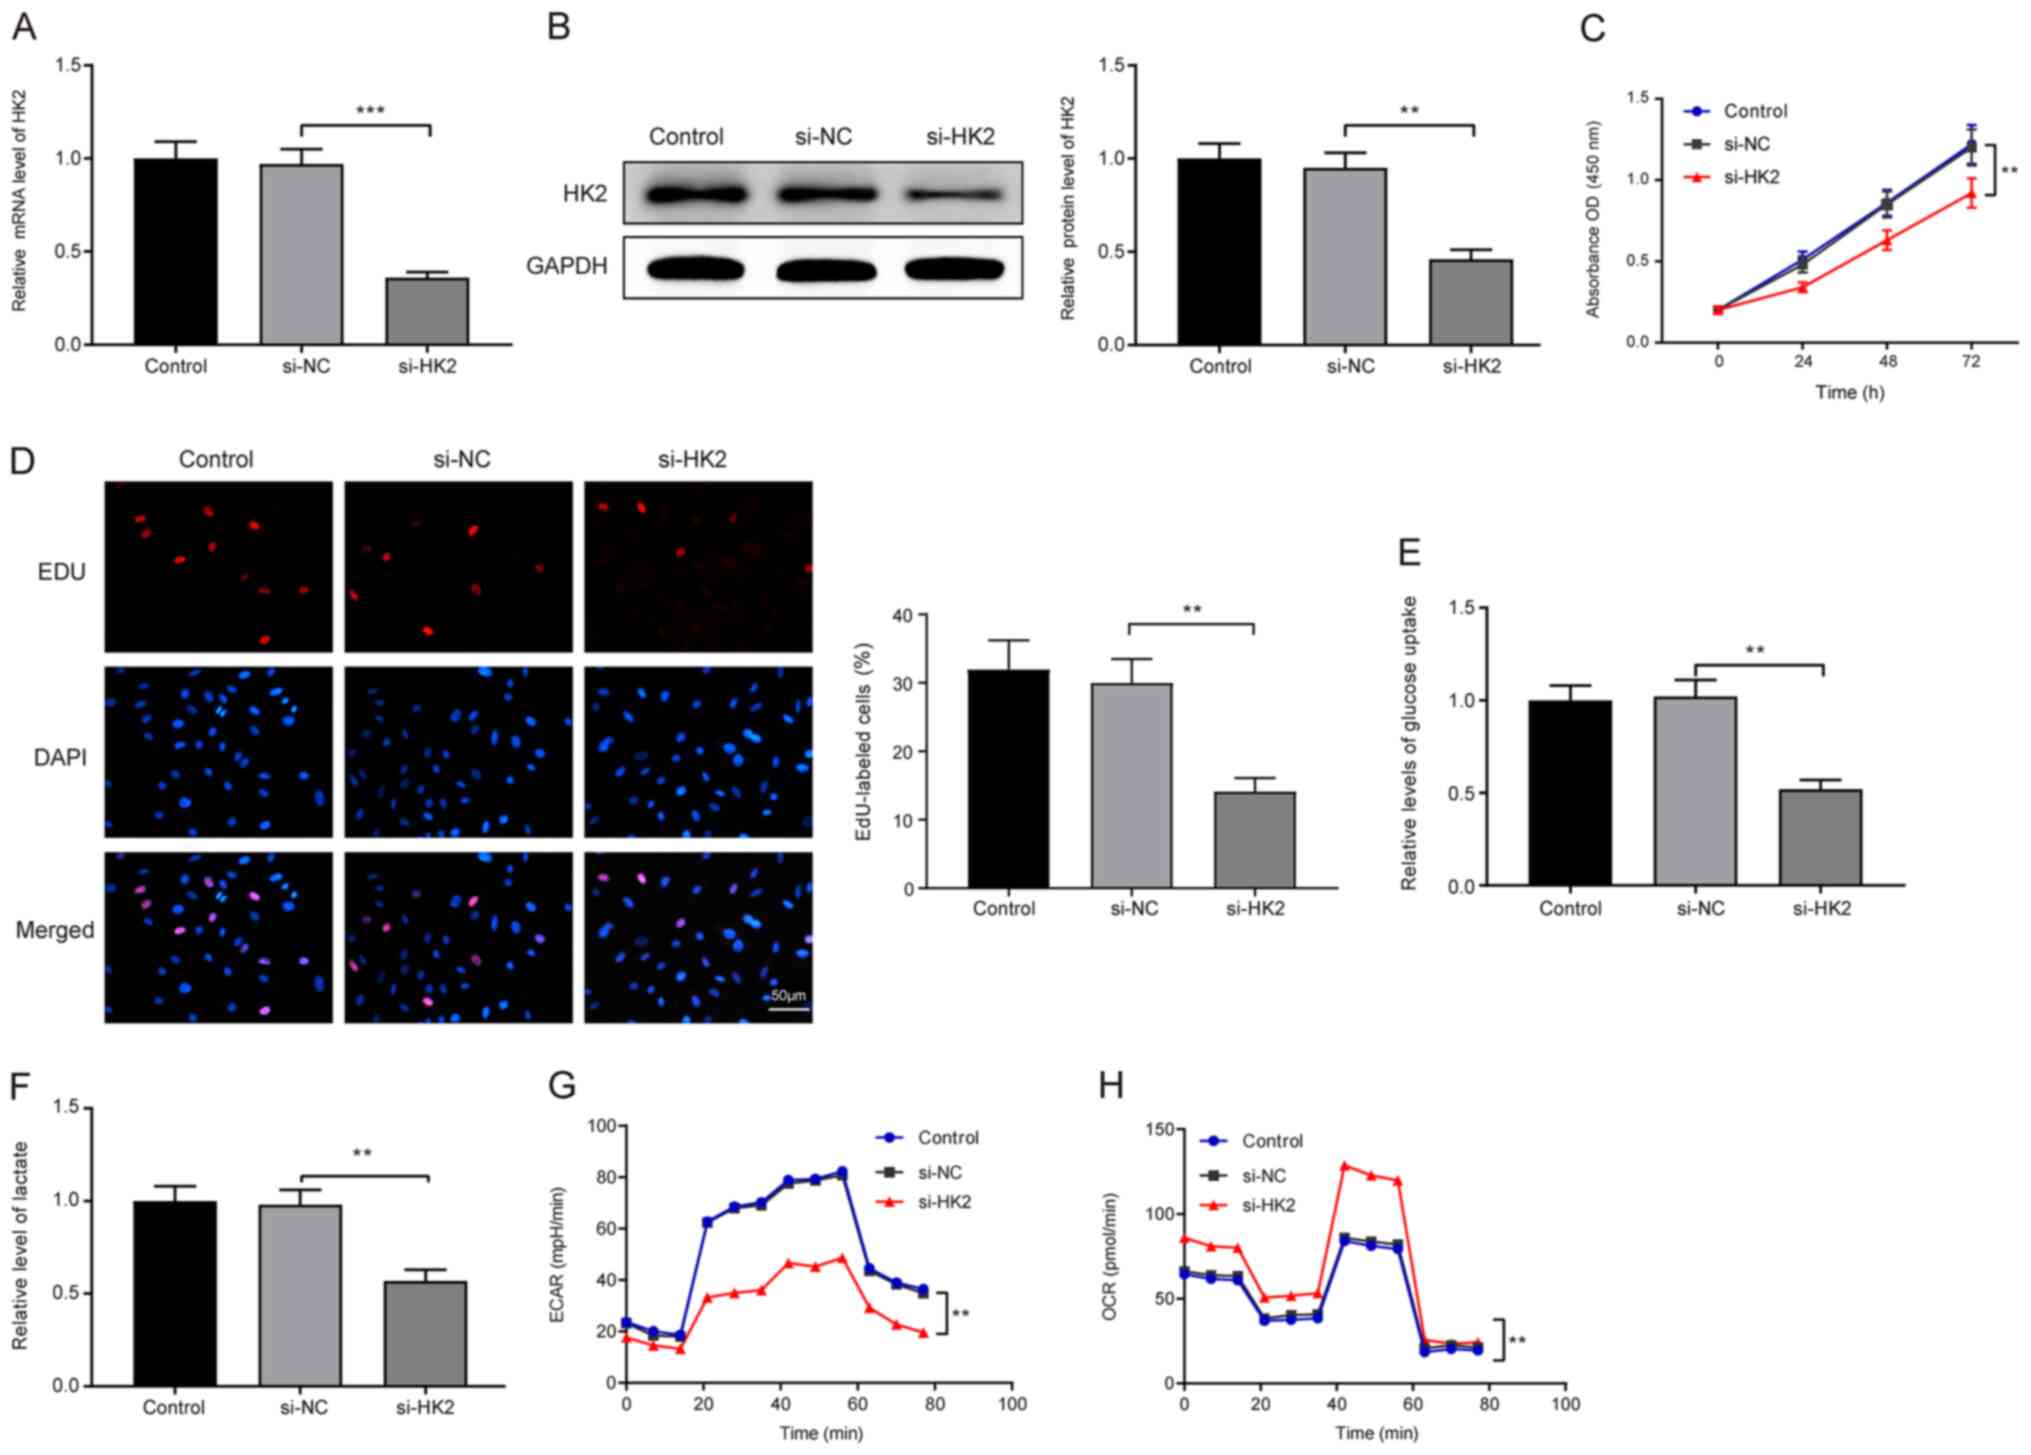
HK2 facilitates LC cell proliferation
and the Warburg effect
Considering the suppressive effects of GA on
proliferation and HK2 expression in LC cells, it may be
hypothesized that HK2 serves a possible regulatory role in the
proliferation of LC cells. si-HK2 was transfected into HepG2 cells,
and RT-qPCR (Fig. 2A) and western
blotting (Fig. 2B) were utilized to
examine the transfection efficiency; HK2 was found to be
successfully silenced in HepG2 cells (P<0.001 and P<0.01). A
CCK-8 assay revealed that transfection with si-HK2 suppressed LC
cell proliferation (Fig. 2C; si-HK2
vs. si-NC group; P<0.01). In addition, EdU staining revealed
that there was a lower percentage of EdU-positive cells in the
si-HK2 group compared with in the si-NC group (Fig. 2D; P<0.01). These data suggested
that HK2 may promote LC cell proliferation.
Glucose uptake capacity (Fig. 2E) and lactic acid content (Fig. 2F) were inhibited in the si-HK2 group
compared with those in the si-NC group (P<0.01). Additionally,
exposure to si-HK2 enhanced mitochondrial respiration (Fig. 2H; si-HK2 vs. si-NC group; P<0.01)
and lessened glycolytic flux (Fig.
2G; si-HK2 vs. si-NC group; P<0.01), which confirms the
promotive role of HK2 in the Warburg effect. The aforementioned
indicators remained unchanged in the si-NC group and the control
group. Collectively, HK2 may promote the proliferation of LC cells
and facilitate the Warburg effect to regulate cell metabolism.
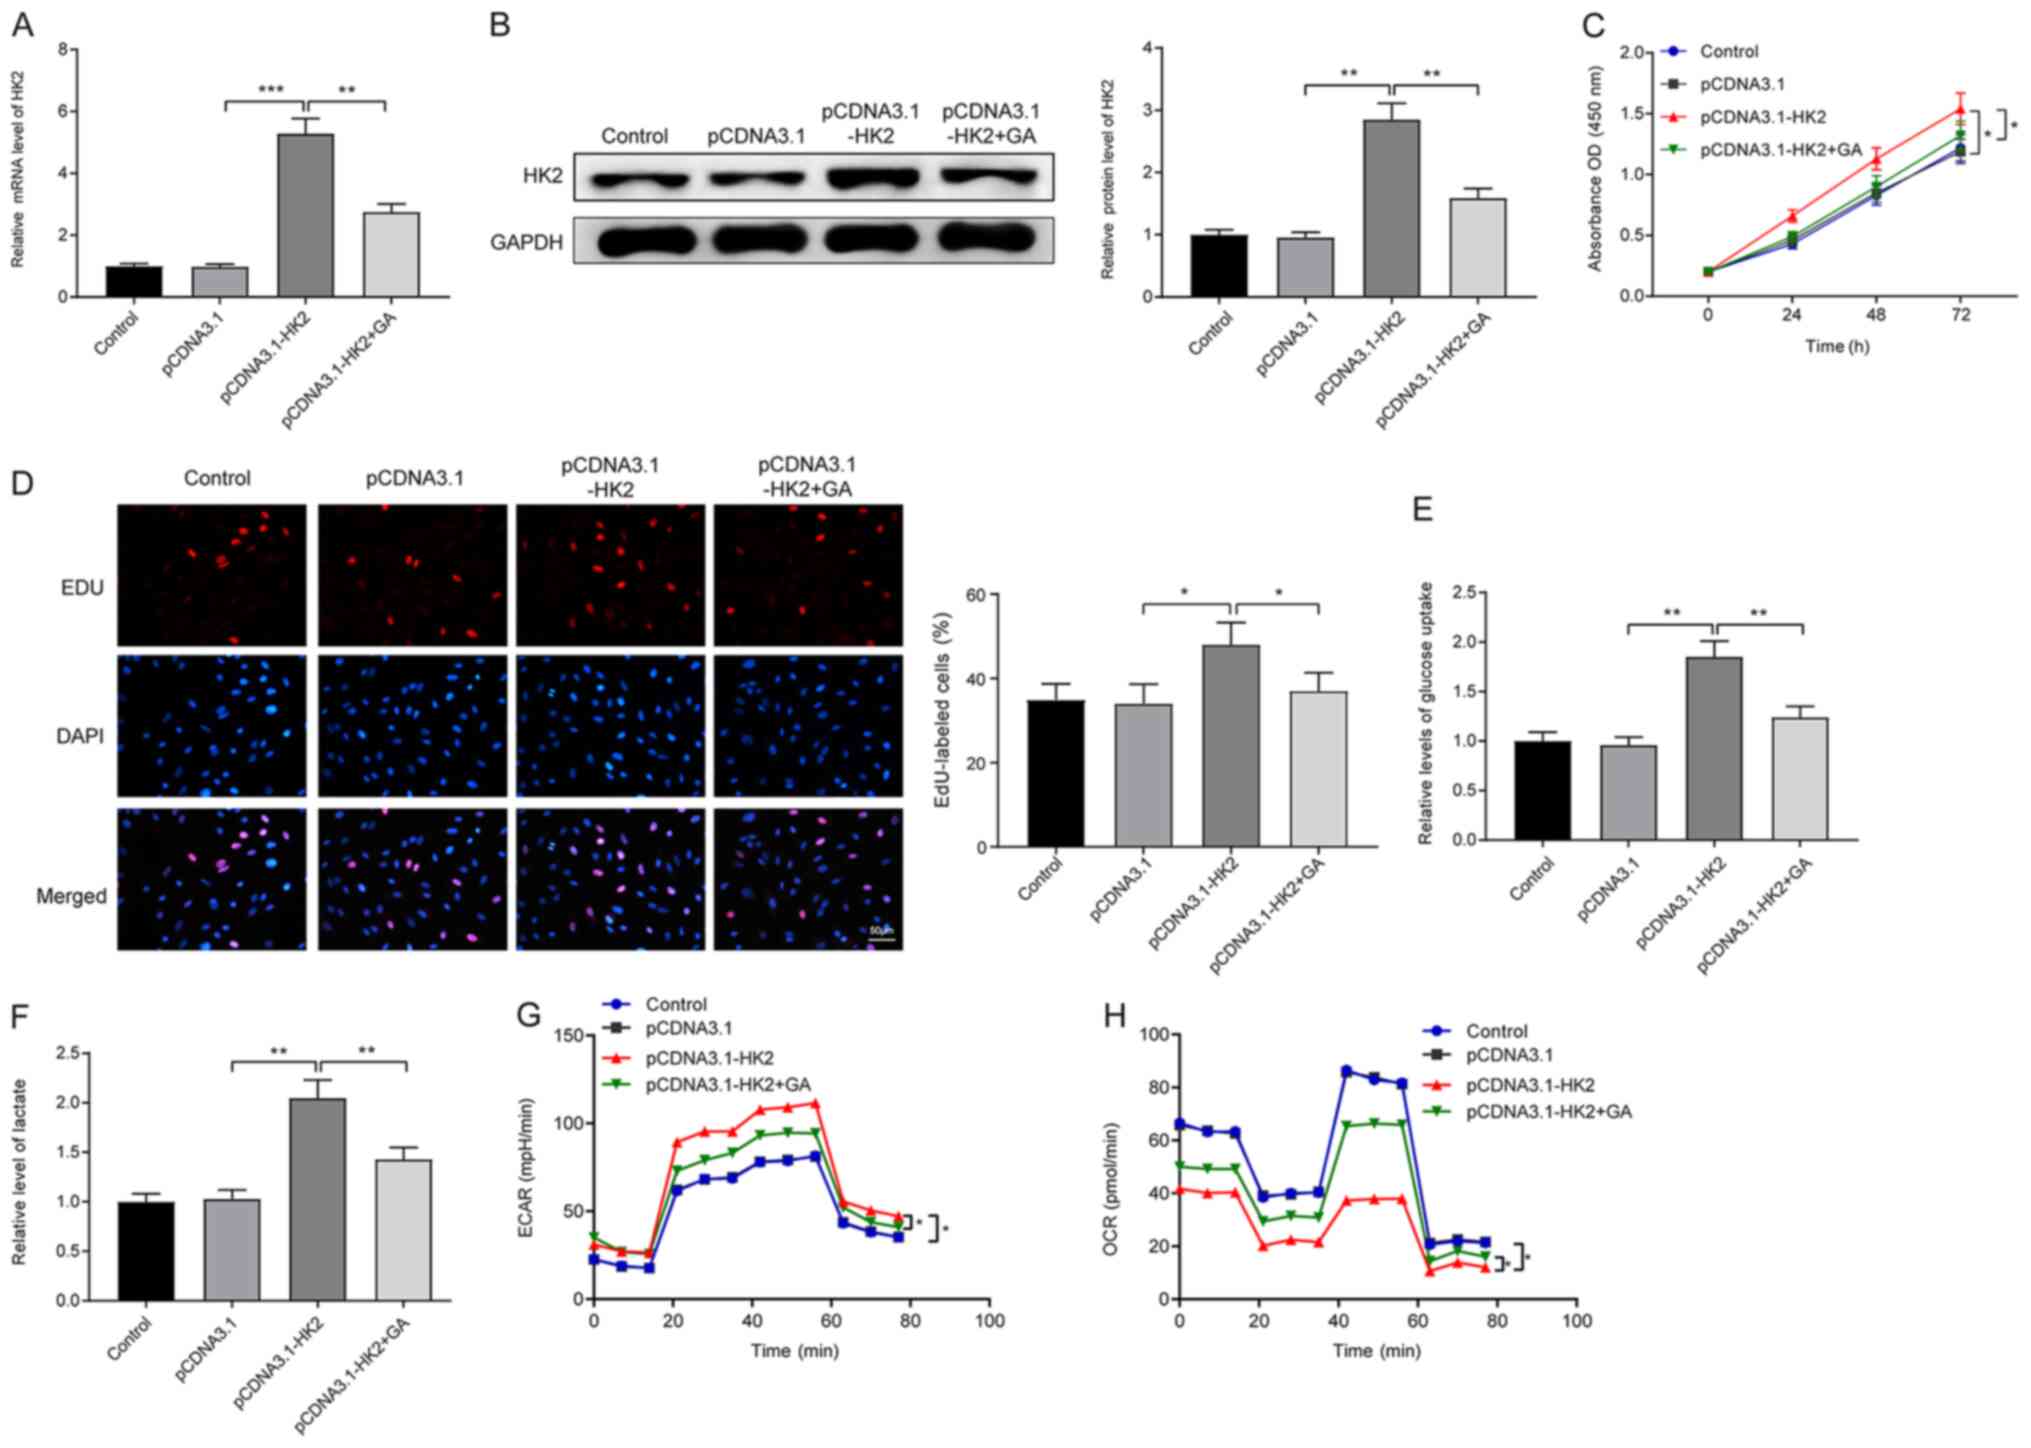
HK2 suppresses the effect of GA on LC
cell proliferation and the Warburg effect
Following transfection with pCDNA3.1-HK2, HepG2
cells were treated with GA. RT-qPCR (Fig. 3A) and western blotting (Fig. 3B) analyses revealed that
transfection with pCDNA3.1-HK2 significantly increased the mRNA and
protein expression levels of HK2 (pDNA3.1-HK2 group vs. pCDNA3.1
group; P<0.001 and P<0.01), whereas HK2 expression was
suppressed following GA treatment (pCDNA3.1-HK2 + GA group vs.
pDNA3.1-HK2 group; P<0.01). A CCK-8 assay (Fig. 3C) and EdU staining (Fig. 3D) illustrated that transfection with
pCDNA3.1-HK2 significantly stimulated LC cell proliferation
(pDNA3.1-HK2 vs. pCDNA3.1 group; P<0.05 and P<0.05); however,
following GA exposure, cell proliferation was inhibited
(pCDNA3.1-HK2 + GA group vs. pDNA3.1-HK2 group; P<0.05 and
P<0.05), demonstrating that GA can suppress LC cell
proliferation by HK2 reduction.
Progressive increases in glucose uptake capacity
(Fig. 3E) and lactic acid content
(Fig. 3F) were detected in the
pCDNA3.1-HK2 group compared with those in the pCDNA3.1 and
pCDNA3.1-HK2+GA groups (P<0.01). In addition, ECAR and OCR
analyses demonstrated that cells in the pCDNA3.1-HK2 group had a
higher ECAR (Fig. 3G; P<0.05)
and a lower OCR (Fig. 3H;
P<0.05) compared with those in the pCDNA3.1 group. However,
compared with the pCDNA3.1-HK2 group, the pCDNA3.1-HK2 + GA group
exhibited an elevated OCR and a decreased ECAR (P<0.05). Taken
together, these findings suggested that GA may suppress the Warburg
effect and proliferation of LC cells through the suppression of
HK2.
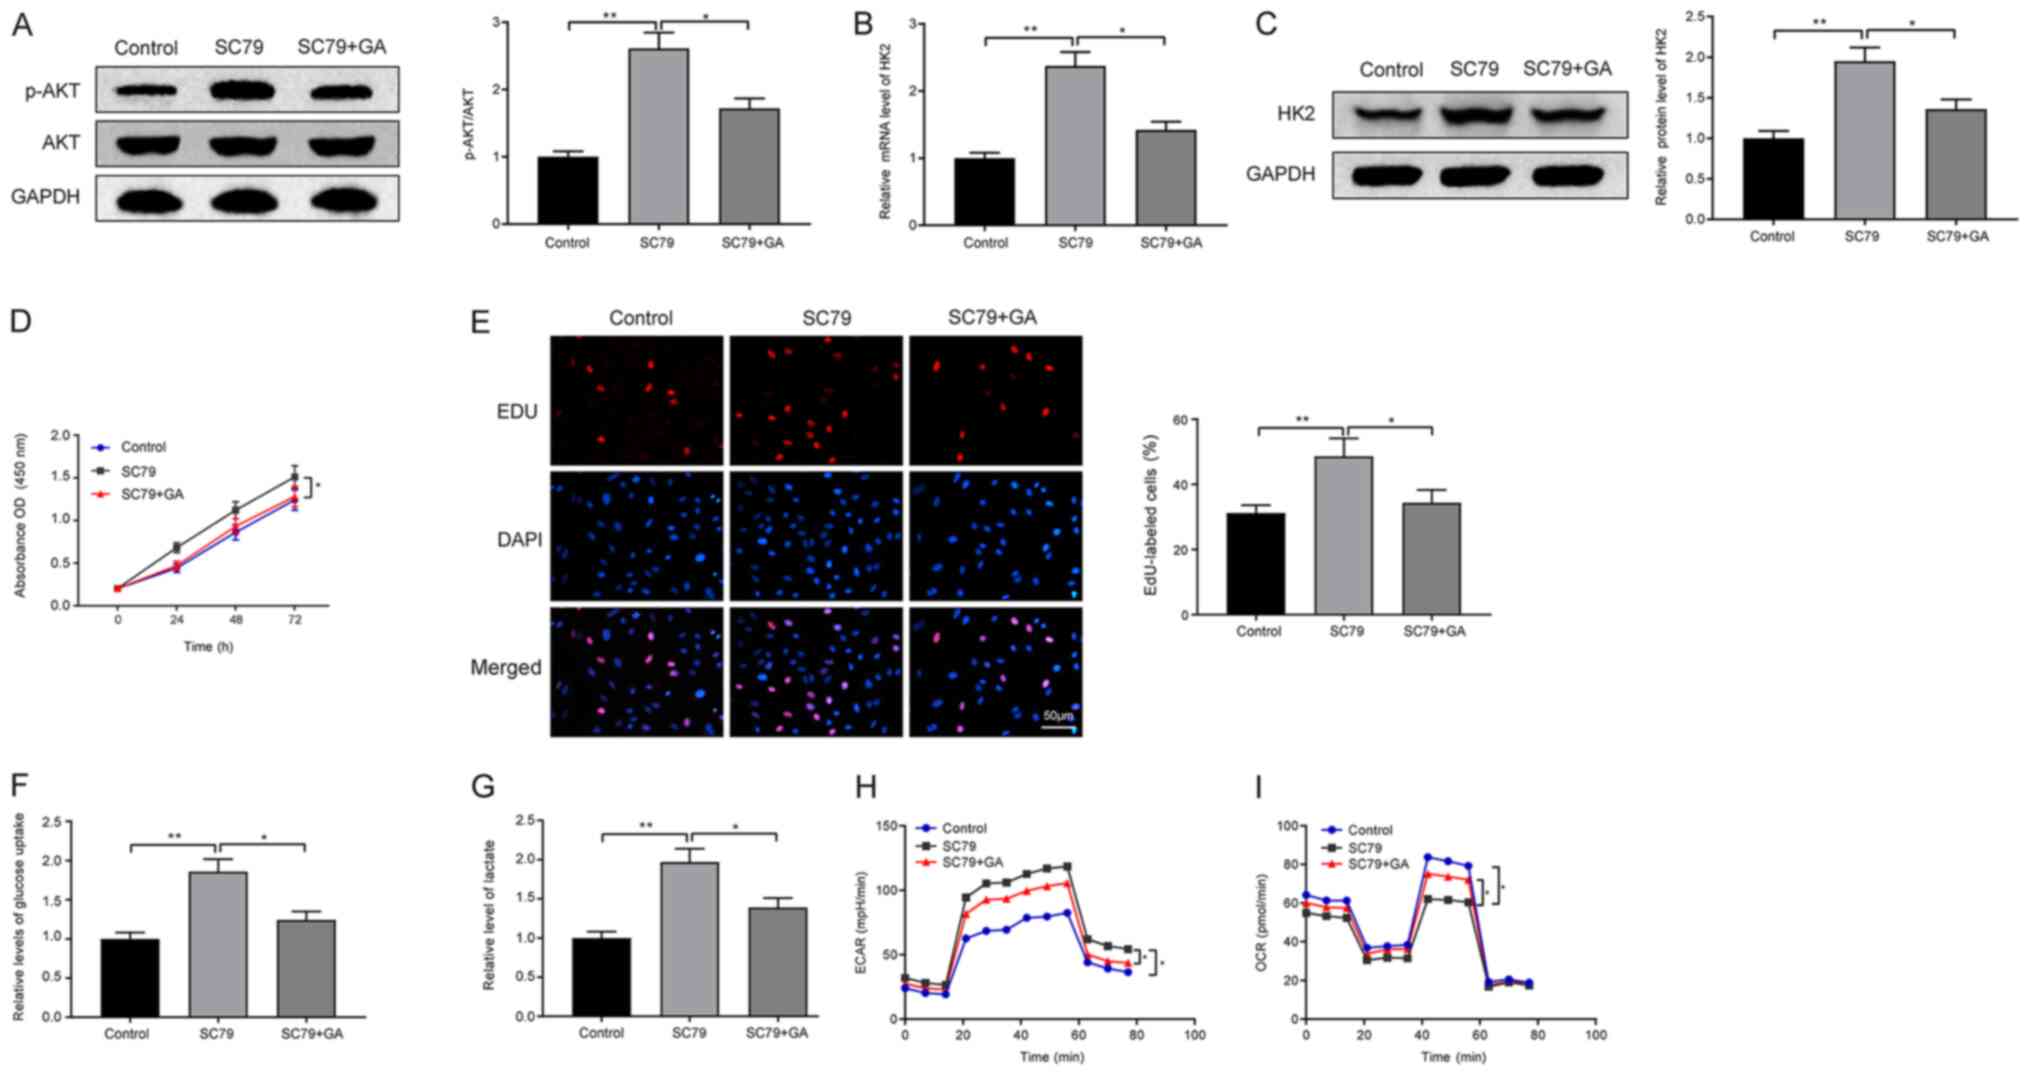
GA mediates its effects on HK2 through
the PI3K/AKT pathway to inhibit proliferation and the Warburg
effect in LC cells
HepG2 cells were incubated with the AKT agonist SC79
and GA to investigate the specific mechanism underlying the effects
of GA on LC. Western blotting results on the phosphorylation level
of AKT revealed that treatment with the AKT agonist SC79 increased
the phosphorylation level of AKT (SC79 vs. control group;
P<0.01), whereas the phosphorylation of AKT was decreased
following exposure to GA (Fig. 4A;
SC79 + GA vs. SC79 group; P<0.05). In addition, significant
increases in the mRNA and protein expression levels of HK2 were
detected in the SC79 group compared with those in the control and
SC79 + GA groups (Fig. 4B and C;
P<0.01 and P<0.05), indicating that the PI3K/AKT pathway was
associated with the effects of GA on HK2 expression. Additionally,
SC79 promoted LC cell proliferation (SC79 vs. control group),
whereas this effect was reversed by GA (Fig. 4D and E; SC79 + GA vs. SC79 group;
P<0.05 and P<0.01).
Elevated glucose uptake capacity (Fig. 4F) and lactic acid content (Fig. 4G) were detected in the SC79 group
compared with those in the control and SC79 + GA groups (P<0.01
and P<0.05). Furthermore, exposure to SC79 elevated the ECAR and
suppressed the OCR (SC79 vs. control group), whereas treatment with
a combination of SC79 and GA reversed these trends (Fig. 4H and I; SC79 + GA vs. SC79 group;
P<0.05).
Discussion
At present, therapeutic options for the treatment of
LC are principally composed of radiological intervention, tumor
resection, liver transplant and chemotherapy, all of which are
limited to patients with early stage disease (17). Cancer cell metabolism has emerged as
a field of biology that provides novel access to cancer treatments
(18). Therefore, a better
understanding of the molecular basis of LC formation and cell
metabolism is essential for improvements in prognosis. In the
present study, HepG2 cells were exposed to GA to determine the
potential functions and possible mechanism of GA on cell
proliferation and the Warburg effect. The present findings
demonstrated that GA could suppress cell proliferation and
metabolism through suppressing HK2 expression via blockade of the
PI3K/AKT signaling pathway.
The Warburg effect confers a growth advantage on
cancer cells and HK2 has a vital role in this process (9,19).
High expression levels of HK2 have been observed in LC cells
(20,21). HK2 was here revealed to accelerate
LC cell proliferation and glycolytic metabolism, as evidenced by an
increase in mitochondrial respiration, and decreases in glucose
uptake capacity, lactic acid content, glycolytic flux and
proliferation in HepG2 cells following transfection with si-HK2.
The present findings are supported by a study by Zhang et al
(22), which reported that the
Polygonatum cyrtonema lectin suppressed tumor cell
glycolysis in PC3 cells by silencing HK2 and combining with
epidermal growth factor receptor. As the extensively studied
sweet-tasting constituent of licorice, GA is a natural triterpenoid
saponin glycoside obtained from licorice roots (23). GA was previously shown to suppress
cell proliferation in human leukemia and markedly reduced the
growth of leukemia cells via inhibition of the AKT/mTOR/STAT3
signaling pathway (24). It has
also been reported that GA may exert protective effects against
high glucose-induced cell proliferation and oxidative stress in
NRK-52E cells (25). A significant
finding of the present study was the observation that GA was a
crucial mediator of LC cell proliferation and the Warburg effect,
and that it affected the expression levels of HK2. These results
prompted analysis of whether GA elicits a suppressive effect on LC
through regulation of HK2. HepG2 cells were treated with
pCDNA3.1-HK2 and GA, and the findings of the CCK-8 assay, EdU
staining, ECAR, OCR, RT-qPCR and western blotting demonstrated that
overexpression of HK2 elevated cell proliferation, glucose uptake
capacity, lactic acid content and glycolytic flux, and suppressed
mitochondrial respiration. Conversely, following exposure to GA,
these effects were reversed. Collectively, these data confirmed
that GA may suppress proliferation and the Warburg effect in LC
cells through inhibition of HK2.
Following the confirmation that GA hampered LC
progression, the aim of the present study shifted to determining
the specific signaling pathway implicated in this protection. AKT
is one of the primary downstream targets of the PI3K signaling
pathway and a key cell survival factor (26). The PI3K/AKT signaling pathway, which
is involved in the regulation of cell proliferation and the Warburg
effect, has been documented to serve a major role not only in tumor
development but also in the potential response of tumors to cancer
treatment (27–29). To assess the effect of the PI3K/AKT
signaling pathway on LC cells, the PI3K/AKT signaling pathway was
activated, after which the LC cells were treated with GA to observe
its effect. These results revealed that activation of the PI3K/AKT
signaling upregulated HK2 expression and facilitated LC cell
proliferation and the Warburg effect, whereas GA could reverse the
effects exerted by the PI3K/AKT pathway.
In conclusion, the findings of the present study
revealed that GA exerted an inhibitory effect on the Warburg effect
and proliferation of LC cells. GA was able to silence HK2 through
the PI3K/AKT pathway, in order to inhibit LC cell proliferation and
glycolytic metabolism. The specific role of GA in the Warburg
effect in LC determined in the present study may improve the
theoretical understanding of glucose metabolism reprogramming in
human LC and could indicate potential therapeutic targets to treat
the disease. Nonetheless, these results must be interpreted with
caution and further investigation is required to focus on the
issues emerging from the present study.
Acknowledgements
Not applicable.
Funding
This research was funded by the Foundation of Hunan
Provincial Health Commission (grant no. 20200179) and the Changsha
Bureau of Science and Technology Planning Foundation (grant no.
kq1706032).
Availability of data and materials
The datasets used and/or analyzed during the current
study are available from the corresponding author on reasonable
request.
Authors' contributions
ZS and CP conceptualized and supervised the study,
designed the experiments and analyzed the data. ZS, ZT and WY
performed the experiments and wrote the manuscript. ZS and WY
provided critical materials. ZS and CP authenticated all the raw
data. All authors read and approved the final manuscript.
Ethics approval and consent to
participate
Not applicable.
Patient consent for publication
Not applicable.
Competing interests
The authors declare that they have no competing
interests.
References
|
1
|
Anwanwan D, Singh SK, Singh S, Saikam V
and Singh R: Challenges in liver cancer and possible treatment
approaches. Biochim Biophys Acta Rev Cancer. 1873:1883142020.
View Article : Google Scholar : PubMed/NCBI
|
|
2
|
Salvatore M, Jeon J and Meza R: Changing
trends in liver cancer incidence by race/ethnicity and sex in the
US: 1992–2016. Cancer Causes Control. 30:1377–1388. 2019.
View Article : Google Scholar : PubMed/NCBI
|
|
3
|
Pittala S, Krelin Y and Shoshan-Barmatz V:
Targeting Liver Cancer and Associated Pathologies in Mice with a
Mitochondrial VDAC1-Based Peptide. Neoplasia. 20:594–609. 2018.
View Article : Google Scholar : PubMed/NCBI
|
|
4
|
Tran KT, McMenamin UC, Coleman HG,
Cardwell CR, Murchie P, Iversen L, Lee AJ and Thrift AP: Statin use
and risk of liver cancer: Evidence from two population-based
studies. Int J Cancer. 146:1250–1260. 2020. View Article : Google Scholar : PubMed/NCBI
|
|
5
|
Guo Z, Zhou Y, Yang J and Shao X:
Dendrobium candidum extract inhibits proliferation and induces
apoptosis of liver cancer cells by inactivating Wnt/β-catenin
signaling pathway. Biomed Pharmacother. 110:371–379. 2019.
View Article : Google Scholar : PubMed/NCBI
|
|
6
|
Nie H, Li J, Yang XM, Cao QZ, Feng MX, Xue
F, Wei L, Qin W, Gu J, Xia Q, et al: Mineralocorticoid receptor
suppresses cancer progression and the Warburg effect by modulating
the miR-338-3p-PKLR axis in hepatocellular carcinoma. Hepatology.
62:1145–1159. 2015. View Article : Google Scholar : PubMed/NCBI
|
|
7
|
Xu F, Yan JJ, Gan Y, Chang Y, Wang HL, He
XX and Zhao Q: miR-885-5p Negatively Regulates Warburg Effect by
Silencing Hexokinase 2 in Liver Cancer. Mol Ther Nucleic Acids.
18:308–319. 2019. View Article : Google Scholar : PubMed/NCBI
|
|
8
|
Zhou Y, Zheng X, Lu J, Chen W, Li X and
Zhao L: Ginsenoside 20(S)-Rg3 Inhibits the Warburg Effect Via
Modulating DNMT3A/miR-532-3p/HK2 Pathway in Ovarian Cancer Cells.
Cell Physiol Biochem. 45:2548–2559. 2018. View Article : Google Scholar : PubMed/NCBI
|
|
9
|
Lin G, Wu Y, Cai F, Li Z, Su S, Wang J,
Cao J and Ma L: Matrine Promotes Human Myeloid Leukemia Cells
Apoptosis Through Warburg Effect Mediated by Hexokinase 2. Front
Pharmacol. 10:10692019. View Article : Google Scholar : PubMed/NCBI
|
|
10
|
Jin F, Wang Y, Zhu Y, Li S, Liu Y, Chen C,
Wang X, Zen K and Li L: The miR-125a/HK2 axis regulates cancer cell
energy metabolism reprogramming in hepatocellular carcinoma. Sci
Rep. 7:30892017. View Article : Google Scholar : PubMed/NCBI
|
|
11
|
Kong ZL, Kuo HP, Johnson A, Wu LC and
Chang KLB: Curcumin-Loaded Mesoporous Silica Nanoparticles Markedly
Enhanced Cytotoxicity in Hepatocellular Carcinoma Cells. Int J Mol
Sci. 20:202019. View Article : Google Scholar
|
|
12
|
Zhang P, Wang Q, Lin Z, Yang P, Dou K and
Zhang R: Berberine Inhibits Growth of Liver Cancer Cells by
Suppressing Glutamine Uptake. OncoTargets Ther. 12:11751–11763.
2019. View Article : Google Scholar
|
|
13
|
Liang B, Guo XL, Jin J, Ma YC and Feng ZQ:
Glycyrrhizic acid inhibits apoptosis and fibrosis in
carbon-tetrachloride-induced rat liver injury. World J
Gastroenterol. 21:5271–5280. 2015. View Article : Google Scholar : PubMed/NCBI
|
|
14
|
Cao ZY, Liu YZ, Li JM, Ruan YM, Yan WJ,
Zhong SY, Zhang T, Liu LL, Wu R, Wang B, et al: Glycyrrhizic acid
as an adjunctive treatment for depression through
anti-inflammation: A randomized placebo-controlled clinical trial.
J Affect Disord. 265:247–254. 2020. View Article : Google Scholar : PubMed/NCBI
|
|
15
|
Li JY, Cao HY, Liu P, Cheng GH and Sun MY:
Glycyrrhizic acid in the treatment of liver diseases: Literature
review. BioMed Res Int. 2014:8721392014.PubMed/NCBI
|
|
16
|
Livak KJ and Schmittgen TD: Analysis of
relative gene expression data using real-time quantitative PCR and
the 2(-Delta Delta C(T)) Method. Methods. 25:402–408. 2001.
View Article : Google Scholar : PubMed/NCBI
|
|
17
|
Lee NCW, Carella MA, Papa S and Bubici C:
High Expression of Glycolytic Genes in Cirrhosis Correlates With
the Risk of Developing Liver Cancer. Front Cell Dev Biol.
6:1382018. View Article : Google Scholar : PubMed/NCBI
|
|
18
|
Wang Z, Deng M, Liu Z and Wu S:
Hypoxia-induced miR-210 promoter demethylation enhances
proliferation, autophagy and angiogenesis of schwannoma cells.
Oncol Rep. 37:3010–3018. 2017. View Article : Google Scholar : PubMed/NCBI
|
|
19
|
Guo W, Qiu Z, Wang Z, Wang Q, Tan N, Chen
T, Chen Z, Huang S, Gu J, Li J, et al: miR-199a-5p is negatively
associated with malignancies and regulates glycolysis and lactate
production by targeting hexokinase 2 in liver cancer. Hepatology.
62:1132–1144. 2015. View Article : Google Scholar : PubMed/NCBI
|
|
20
|
Jiao L, Zhang HL, Li DD, Yang KL, Tang J,
Li X, Ji J, Yu Y, Wu RY, Ravichandran S, et al: Regulation of
glycolytic metabolism by autophagy in liver cancer involves
selective autophagic degradation of HK2 (hexokinase 2). Autophagy.
14:671–684. 2018. View Article : Google Scholar : PubMed/NCBI
|
|
21
|
Zhuang X, Chen Y, Wu Z, Xu Q, Chen M, Shao
M, Cao X, Zhou Y, Xie M, Shi Y, et al: Mitochondrial miR-181a-5p
promotes glucose metabolism reprogramming in liver cancer by
regulating the electron transport chain. Carcinogenesis.
41:972–983. 2020. View Article : Google Scholar : PubMed/NCBI
|
|
22
|
Zhang H, Du X, Sun TT, Wang CL, Li Y and
Wu SZ: Lectin PCL inhibits the Warburg effect of PC3 cells by
combining with EGFR and inhibiting HK2. Oncol Rep. 37:1765–1771.
2017. View Article : Google Scholar : PubMed/NCBI
|
|
23
|
Khan R, Rehman MU, Khan AQ, Tahir M and
Sultana S: Glycyrrhizic acid suppresses
1,2-dimethylhydrazine-induced colon tumorigenesis in Wistar rats:
Alleviation of inflammatory, proliferation, angiogenic, and
apoptotic markers. Environ Toxicol. 33:1272–1283. 2018. View Article : Google Scholar : PubMed/NCBI
|
|
24
|
He SQ, Gao M, Fu YF and Zhang YN:
Glycyrrhizic acid inhibits leukemia cell growth and migration via
blocking AKT/mTOR/STAT3 signaling. Int J Clin Exp Pathol.
8:5175–5181. 2015.PubMed/NCBI
|
|
25
|
Hou S, Zheng F, Li Y, Gao L and Zhang J:
The protective effect of glycyrrhizic acid on renal tubular
epithelial cell injury induced by high glucose. Int J Mol Sci.
15:15026–15043. 2014. View Article : Google Scholar : PubMed/NCBI
|
|
26
|
Liu W, Jing ZT, Xue CR, Wu SX, Chen WN,
Lin XJ and Lin X: PI3K/AKT inhibitors aggravate death
receptor-mediated hepatocyte apoptosis and liver injury. Toxicol
Appl Pharmacol. 381:1147292019. View Article : Google Scholar : PubMed/NCBI
|
|
27
|
Fresno Vara JA, Casado E, de Castro J,
Cejas P, Belda-Iniesta C and González-Barón M: PI3K/Akt signalling
pathway and cancer. Cancer Treat Rev. 30:193–204. 2004. View Article : Google Scholar : PubMed/NCBI
|
|
28
|
Hu F, He Z, Sun C and Rong D: Knockdown of
GRHL2 inhibited proliferation and induced apoptosis of colorectal
cancer by suppressing the PI3K/Akt pathway. Gene. 700:96–104. 2019.
View Article : Google Scholar : PubMed/NCBI
|
|
29
|
Liu J, Pan C, Guo L, Wu M, Guo J, Peng S,
Wu Q and Zuo Q: A new mechanism of trastuzumab resistance in
gastric cancer: MACC1 promotes the Warburg effect via activation of
the PI3K/AKT signaling pathway. J Hematol Oncol. 9:762016.
View Article : Google Scholar : PubMed/NCBI
|