Introduction
Malignant pleural mesothelioma (MPM) is an
aggressive cancer of the mesothelial cells lining the pleural
surface of the chest wall and lung (1). The main cause of carcinogenesis of
this disease is thought to be exposure to an environmental
carcinogen, asbestos (2);
furthermore, the involvement of SV40 and exposure to radiation have
been suggested as cofactors (3,4). The
MPM patient prognosis is very poor and available therapies have
still a limited impact on MPM progression (5). Until recently, antifolate and platinum
combination chemotherapy was the only established treatment
(6,7). These days, the development of
immune-checkpoint inhibitors has contributed to the improvement of
MPM treatment. The data from the phase III trial (NCT02899299)
designed to evaluate nivolumab plus ipilimumab compared with
conventional chemotherapy (pemetrexed and cisplatin or carboplatin)
showed a statistically significant overall survival (OS) benefit in
patients with previously untreated, unresectable MPM, and, only
recently, the FDA has finally approved nivolumab plus ipilimumab
for previously untreated unresectable MPM (8). Although the nivolumab and ipilimumab
combination has extended the OS (a median OS of 18.1 months
compared to 14.1 months for platinum-based standard of
chemotherapy) (8), the prognosis is
still poor, and research such as identification of new biomarkers
in invasive mesothelioma (9), and
search for new drugs for MPM (10)
have been actively conducted for further improvement of MPM care.
In particular, the development of drugs through different
mechanisms of action will continue to be required in the
future.
A major focus in cancer research is the development
of new therapeutic agents that induce cell death in malignant
neoplasms but do not increase inflammation or have significant side
effects in normal tissue. Cytotoxic ribonucleases (RNases) are a
new field of anticancer drug candidates that target RNA and several
cytotoxic RNases have been reported to have antitumor effects
(11,12). The vertebrate-secreted RNase
superfamily, also called the RNase A superfamily, includes several
cytotoxic RNases, such as onconase (ONC) from Rana pipience
(13) and a variant of human
pancreatic ribonuclease carrying a nuclear localization signal
(PE5) (14). Unlike clinically used
chemotherapeutic drugs that target DNA synthesis and transcription,
cytotoxic RNases are believed to be non-mutagenic because they
target RNA functions, such as RNA translation or gene regulation
(15).
Sialic acid-binding lectin from Rana
catesbeiana (cSBL), also known as RC-RNase, is a
multifunctional protein that binds carbohydrates and has a
ribonuclease activity (16–18). It was originally identified as a
lectin that recognizes sialic acid-containing complexes (17), and protein sequence analysis
revealed that it belonged to the vertebrate-secreted RNase
superfamily (19). It has
previously been identified that cSBL has remarkable antitumor
activity against many types of cancer cells and low toxicity in
normal cells (20–25). This effect was observed in not only
in vitro experiments but also in vivo studies
(18,20,26).
Our own recent studies revealed that cSBL induced apoptosis in
cancer cells via the intrinsic pathway (27,28),
and that the RNase activity of cSBL was essential for its antitumor
effect (29). The effectiveness of
cSBL has also been studied for in MPM. We reported that although
cSBL had very low cytotoxicity in the normal pleural mesothelial
cell line Met5A, it efficiently reduced the viability of MPM cells
including H28, Meso-1, Meso-4, H2452 and MSTO cells (30,31).
We found that pemetrexed + cSBL exhibited a strong synergistic
effect that was even superior to the standard regimen of pemetrexed
+ cisplatin (31). Furthermore,
in vivo study revealed that cSBL showed a significant tumor
growth inhibitory effect in multiple MPM xenograft models without
any adverse effects, even under conditions where previously
established pemetrexed administration had little or no effect
(26). However, the antitumor
mechanism of cSBL is still unclear, especially when the response of
cancer cells to cSBL application is concerned.
Despite the potential of RNases in cancer treatment,
few studies have identified genes whose expression was altered by
cytotoxic RNases. This may be because the RNA extracted from
cytotoxic RNase-treated cells is likely to be degraded by the
RNA-catabolizing action of the RNase. Therefore, it is technically
difficult to assess differentially expressed genes (DEGs) in
cytotoxic RNase-treated cells. In recent years, some remarkable
research breakthroughs have been made in studies using microarray
analysis. Previous studies using microarray technology have been
able to determine that ONC caused upregulation of activating
transcription factor 3 (ATF3), which was important for its
antitumor effect of ONC (32,33),
and that PE5 caused pleiotropic effects, including gene expression
changes mainly related to metabolism (34). These studies pioneered the study of
gene expression after treatment with cytotoxic RNases. However,
these findings were reported only in conditions in which there was
little RNA degradation, that is, there was very little antitumor
effect. Moreover, no gene expression studies have involved
cSBL.
To further understand the antitumor effects of cSBL,
we treated cSBL-sensitive MPM cells with cSBL to establish
cSBL-resistant (cSR) cells. Then, microarray analysis was performed
to identify significantly altered genes in the cSBL-sensitive and
cSR cell lines.
Materials and methods
Reagents
cSBL was isolated from acetone-dried powder of
unfertilized bullfrog body-cavity eggs using sequential
chromatography with Sephadex G75, DEAE-cellulose, hydroxyapatite,
and SP-Sepharose (Cytiva), as previously described (17). For the preparation of ONC, ONC cDNA
was cloned into the pET-11d plasmid (Merck KGaA) in conjunction
with the pelB sequence. BL21 (DE3) pLysS cells (Promega)
were transformed with the plasmid, and its expression was induced
by adding isopropyl β-D-1-thiogalactopyranoside (0.2 mM) at 34°C
for 72 h. ONC recombinant protein was purified from the culture
liquid by sequential chromatography with Sephadex G75,
DEAE-cellulose, hydroxyapatite, and SP-Sepharose. Doxorubicin (DOX)
was purchased from Sigma-Aldrich. The anti-caspase-3 antibody (cat.
no. #9662), peroxidase-conjugated anti-mouse IgG and anti-rabbit
IgG antibodies (cat. no. #7074 and #7076, respectively) were
purchased from Cell Signaling Technology. The anti-aldo-keto
reductase (AKR) 1B10 antibody (cat. no. ab96417) was purchased from
Abcam (Cambridge, UK) The anti-β-actin antibody (clone AC-74, cat.
no. A2228) was purchased from Sigma-Aldrich.
Establishment of cSBL-resistant cell
lines
H28 cells were purchased from the American Type
Culture Collection. For the establishment of cSR cell lines, cells
were cultured with complete medium containing stepwise increasing
concentrations of cSBL. The starting concentration was 0.01 µM in
which H28 cells could manage to survive, and the final
concentration was set as 0.5 µM, which is 50 times higher than the
initial concentration. The cells were passaged approximately 50
times to reach the final concentration. These resistant cells were
proven to be stably resistant even after at least 10 passages in
drug-free complete medium. After that, cells were cloned using
limiting dilution. We confirmed five resistant clones, which were
designated cSR-A1, -A2, -B1, -B2 and -C1. To ensure that these
clones were permanent and stable, they were cultured for five
passages in the presence of 0.5 µM cSBL. For the analyses described
here, cultures of less than 20 passages after the cloning were
used. All cell lines were cultured in RPMI 1640 medium (Nissui)
supplemented with 10% fetal bovine serum, penicillin-G (100 U/ml),
and streptomycin (100 g/ml) (Thermo Fisher Scientific, Inc.). Cells
were maintained in a 5% CO2 incubator at 37°C under
humidified conditions. Cell morphology was observed using an IX71
microscope (Olympus).
Colony formation assay
Cells were seeded in 6-well plates (Corning, cat.
no. 353046, 1×10³ cells per well). After 24 h, cells
were treated with medium alone or with cSBL (1, 5, 10, 25, or 50
nM) for 12 days. Then, cells were fixed with paraformaldehyde for
15 min and stained with crystal violet for 10 min. Colonies were
photographed by Gel Doc XR system (Bio-Rad Laboratories, Inc.) and
counted using Quantity One software (Bio-Rad Laboratories, Inc.).
Each experiment was performed in triplicate.
WST-8 assay
The WST-8 assay was performed to determine the cell
viability. Cells (5×10⁴ cells/ml) cultured in 96-well
plates (Corning, cat. no. 353072, 100 µl/well) were treated with
cSBL, ONC, or DOX at the indicated concentrations for 72 h. Then,
the cells were incubated with Cell Count Reagent SF (Nacalai Tesque
Inc.) for 1–4 h. The absorbance of the resulting product at 450 nm
was measured, and the background absorbance at 650 nm was
subtracted. Experiments were conducted in triplicate.
Western blotting
Cells (5×10⁴ cells/ml) were cultured in
6-well plates (Corning, cat. no. 353046, 4 ml/well) and treated
with cSBL or control. Whole cell lysates were prepared using
extraction buffer [150 mM NaCl, 10 mM Tris-HCl (pH 7.4), 5 mM EDTA,
1% Nonidet P-40, 0.1% sodium deoxycholate, and 0.1% sodium dodecyl
sulfate] supplemented with complete™ Mini EDTA-free protease
inhibitor cocktail tablets (one tablet/10 ml; Roche Applied
Science). Soluble proteins were collected, and the protein
concentration was measured using a BCA protein assay kit (Thermo
Fisher Scientific, Inc., cat. no. 23227) according to the
manufacturer's instructions. Proteins were separated using 10 or
14% SDS-PAGE and transferred onto Immobilon-P transfer membranes
(Thermo Fisher Scientific, Inc.). The membranes were sequentially
incubated with primary and secondary antibodies diluted in Can Get
Signal solution (Toyobo Co., Ltd.). Protein bands were detected
using ECL Prime Western Blotting Detection Reagent (Cytiva). The
relative density of the protein bands was measured using ImageJ
1.51s software (National Institutes of Health). Experiments were
repeated in triplicates.
Total RNA isolation
Total RNA was isolated from cells using TRI Reagent
(Molecular Research Center) and purified using the SV Total RNA
Isolation System (Promega) according to the manufacturer's
instructions. RNA samples were quantified using an ND-1000
spectrophotometer (NanoDrop Technologies), and the quality was
confirmed using a 2200 TapeStation (Agilent Technologies). The RNA
integrity number equivalent (RINe), which was an index
of RNA degradation, was calculated from the 28S and 18S ribosomal
RNA band peak values and other band peak values in the
electrophoretic image. For the subsequent cDNA labeling, the
Agilent Low-Input QuickAmp Labeling kit (Agilent Technologies, cat.
no. 5190-2305) was used.
Gene expression microarrays
cDNA was amplified, labeled, and hybridized to a 60K
Agilent 60-mer oligomicroarray according to the manufacturer's
instructions. All hybridized microarray slides were scanned using
an Agilent scanner. Relative hybridization intensities and
background hybridization values were calculated using Agilent
Feature Extraction Software (9.5.1.1).
Data analysis and filter criteria
Raw signal intensities and flags for each probe were
calculated from hybridization intensities (gProcessedSignal) and
spot information (gIsSaturated, etc.), according to the procedures
recommended by Agilent. [Flag criteria on GeneSpring Software was
as follows: Absent (A): ‘Feature is not positive and significant’
and ‘Feature is not above background;’ Marginal (M): ‘Feature is
not Uniform,’ ‘Feature is Saturated,’ and ‘Feature is a population
outlier;’ and Present (P): others.]. The raw signal intensities of
two samples were log2-transformed and normalized by quantile
algorithm with the Bioconductor preprocessCore library package
(35,36). We selected probes that called the P
flag in at least two samples. To identify up- and downregulated
genes, we calculated Z-scores (37)
and ratios (non-log scaled fold-change) from the normalized signal
intensities of each probe to compare control and experimental
samples. Then, we established the following criteria for
differentially regulated genes: Upregulated genes: Z-score ≥2.0 and
ratio ≥1.5-fold and downregulated genes: Z-score ≤-2.0 and ratio
≤0.66. Data have been deposited in NCBI's Gene Expression Omnibus
repository (38) (http://www.ncbi.nih.gov/geo) under the accession
number: GSE 162286.
Functional annotation of DEGs in cSR
cell lines
DEGs in cSR cells were characterized functionally
using a hypergeometric test to find overrepresented gene ontology
terms in the three main broad ontologies (biological process,
molecular function, and cellular component) (39,40).
DEGs were also mapped to the Kyoto Encyclopedia of Genes and
Genomes (KEGG) (41), which assigns
proteins to pathways, to find overrepresented pathways. The
analyses were done using the Database for Annotation,
Visualization, and Integrated Discovery online tool (42).
Network analysis
GeneMANIA (43), an
online database that identifies other proteins associated with a
set of input genes, was used to generate protein-protein
interaction (PPI) network images. The associations between
co-expression, colocalization, predicted related genes, shared
protein domains, genetic interactions, and physical interactions
were determined using GeneMANIA.
Reverse transcription quantitative
polymerase chain reaction (RT-qPCR)
mRNA expression of the top five downregulated genes
(THY1, AKR1B15, AKR1B10, SLC47A2, and CBR1) were
examined using RT-qPCR. Cells (2×10⁵) were cultured for
48 h, and total RNA was extracted using an AllPrep RNA/Protein kit
(Qiagen, cat. no. 80404). cDNA was synthesized from total RNA (1
µg) using a SuperScript VILO cDNA Synthesis Kit (Invitrogen, cat.
no. 11754050). RT-qPCR was performed using a LightCycler 480 system
with the LightCycler 480 Probes Master Kit (Roche Diagnostics, cat.
no. 04707494001). PCR primers using a TaqMan/probe library assay
were designed by the Universal Probe Library Assay Design Center
(https://www.roche-applied-science.com/sis/rtpcr/upl/acenter.jsp).
The expression levels of these genes were standardized relative to
the mRNA expression level of GAPDH (as a housekeeping gene)
based on their average cycle threshold values.
Statistical analysis
The results from three or more independent
experiments were expressed as the mean ± standard deviation.
Statistical analyses were conducted using GraphPad Prism 5.0
(GraphPad Software, Inc.), and comparisons were made using one-way
analysis of variance followed by Bonferroni's post hoc test.
P<0.05 was considered statistically significant.
Results
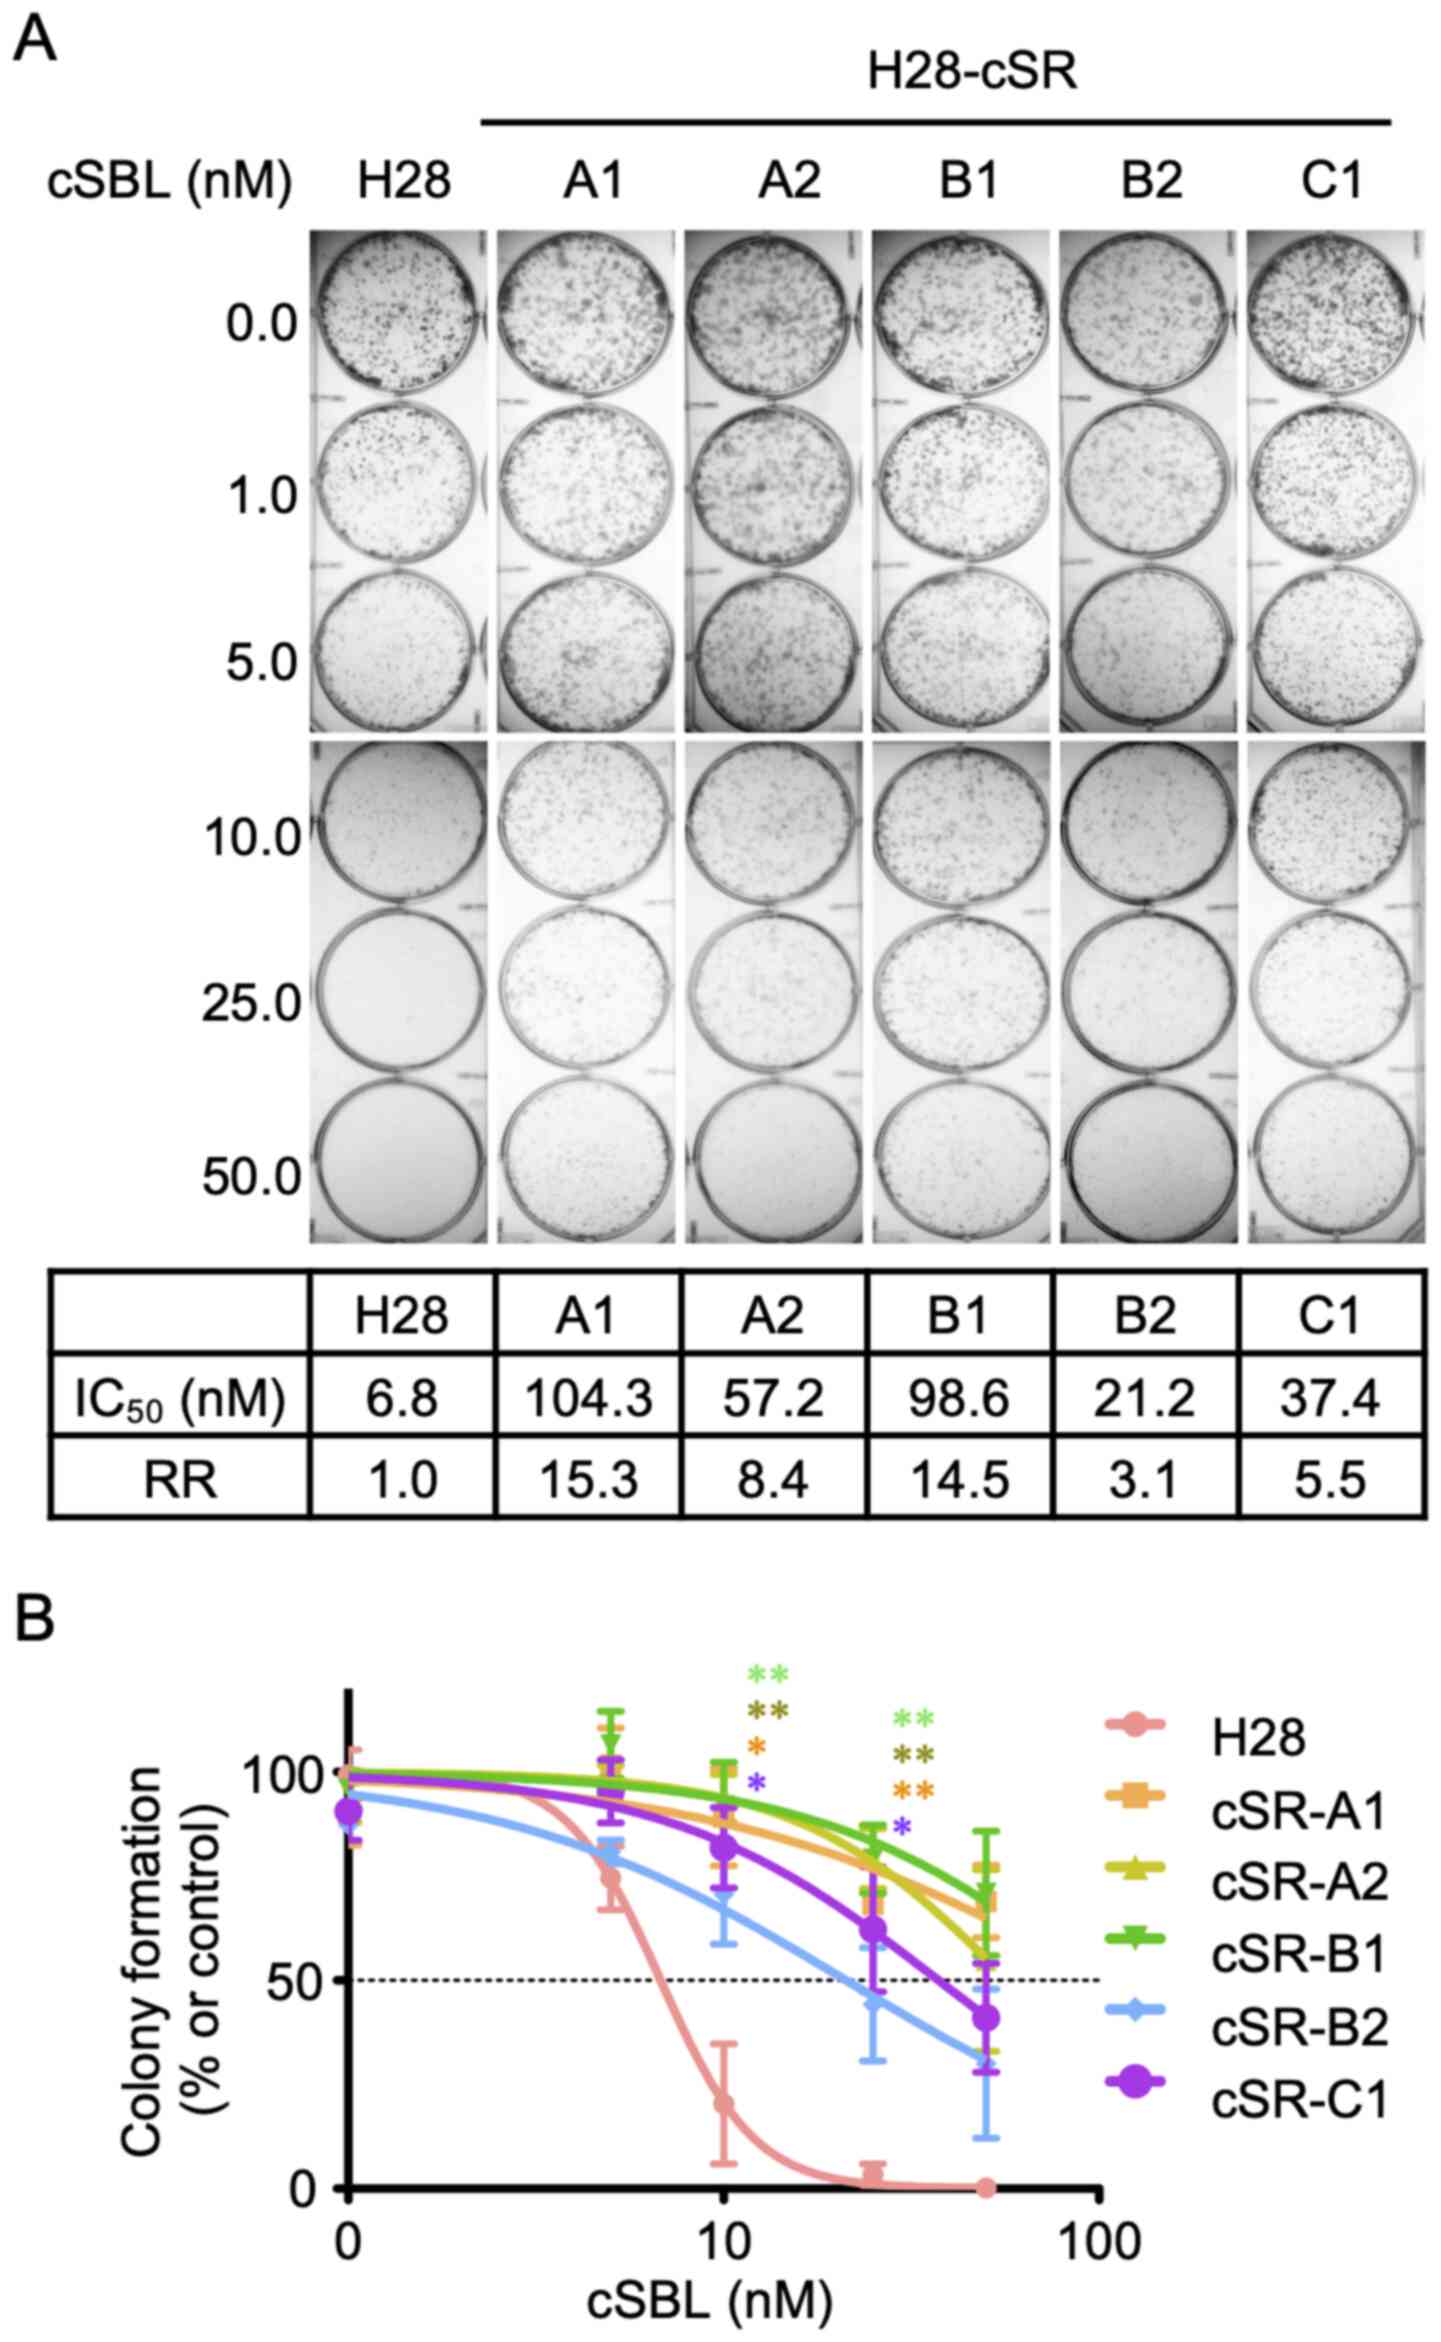
Establishment of cSR cells
cSR cells were established by adding different cSBL
concentrations at the low range to the culture medium. Five clones
were obtained by limiting-dilution cloning. The sensitivity of the
clones to cSBL was assessed using colony formation assay. As shown
in Fig. 1A (upper panel), no
colonies were found in parental H28 cells treated with cSBL at
concentrations of 25 nM or higher. In contrast, all five clones
showed resistance to cSBL. We calculated IC50 values
from dose-response curves (Fig.
1B). The resistant rate (RR) represented the ratio of the
IC50 value in cSR cells to the IC50 value in
H28 cells (Fig. 1A, lower panel).
cSR-A1 and cSR-B1 had the highest RRs (15.3 and 14.5,
respectively); therefore, these two clones were utilized in
subsequent experiments.
Analysis of cSR cell lines
characteristics
The growth curves of H28, cSR-A1, and cSR-B1 cells
were examined (Fig. 2A). There was
no significant difference in the growth rates among these three
cell lines. However, cSR cells tended to show shrunken morphology
in low-density culture conditions, even though no difference was
observed in high-density culture conditions (Fig. 2B). The cSBL resistance was then
evaluated. After treating cells with cSBL, ONC, or DOX for 72 h,
the cell viability was measured using the WST-8 assay,
dose-response curves were prepared, and the IC50 values
and RRs were calculated (Fig. 2C).
The RRs of cSR cells to cSBL in the WST-8 assay were 4.4 (A1) and
4.6 (B1), which were lower than those obtained in the colony
formation assay. Further, the RRs to ONC and DOX were lower than to
cSBL; the RRs to ONC for cSR-A1 and cSR-B1 were 1.6 and 2.0,
respectively, and the corresponding RRs to DOX were 0.7 and 1.0,
respectively. Similar to what we observed for cSBL, cSR cells
tended to show some resistance to RNA-targeted ONC. However, for
DOX, a DNA-damaging anticancer drug, the RRs of cSR cells did not
exceed 1, i.e., the effect of DOX was not different between parent
H28 and cSR cells. Since it has been shown that the antitumor
effect of cSBL was due to the induction of apoptosis, we examined
whether the cSR cells had reduced apoptosis after cSBL treatment.
Cells were treated with cSBL (1 or 5 µM) for 72 h, and protein was
extracted to examine the levels of cleaved caspase-3 (Fig. 2D). There was less cleaved caspase-3
in cSBL-treated cSR-B1 cells than in H28 cells, but the difference
was not significant. Taken together, our results indicate that cSR
cells become resistant to cSBL after long-term treatment with low
concentrations, but they have relatively weak resistance to
short-term treatment with high concentrations. In addition, there
was no significant difference between H28 and cSR cells in terms of
proliferation, morphology, or apoptosis after treatment with high
cSBL concentrations.
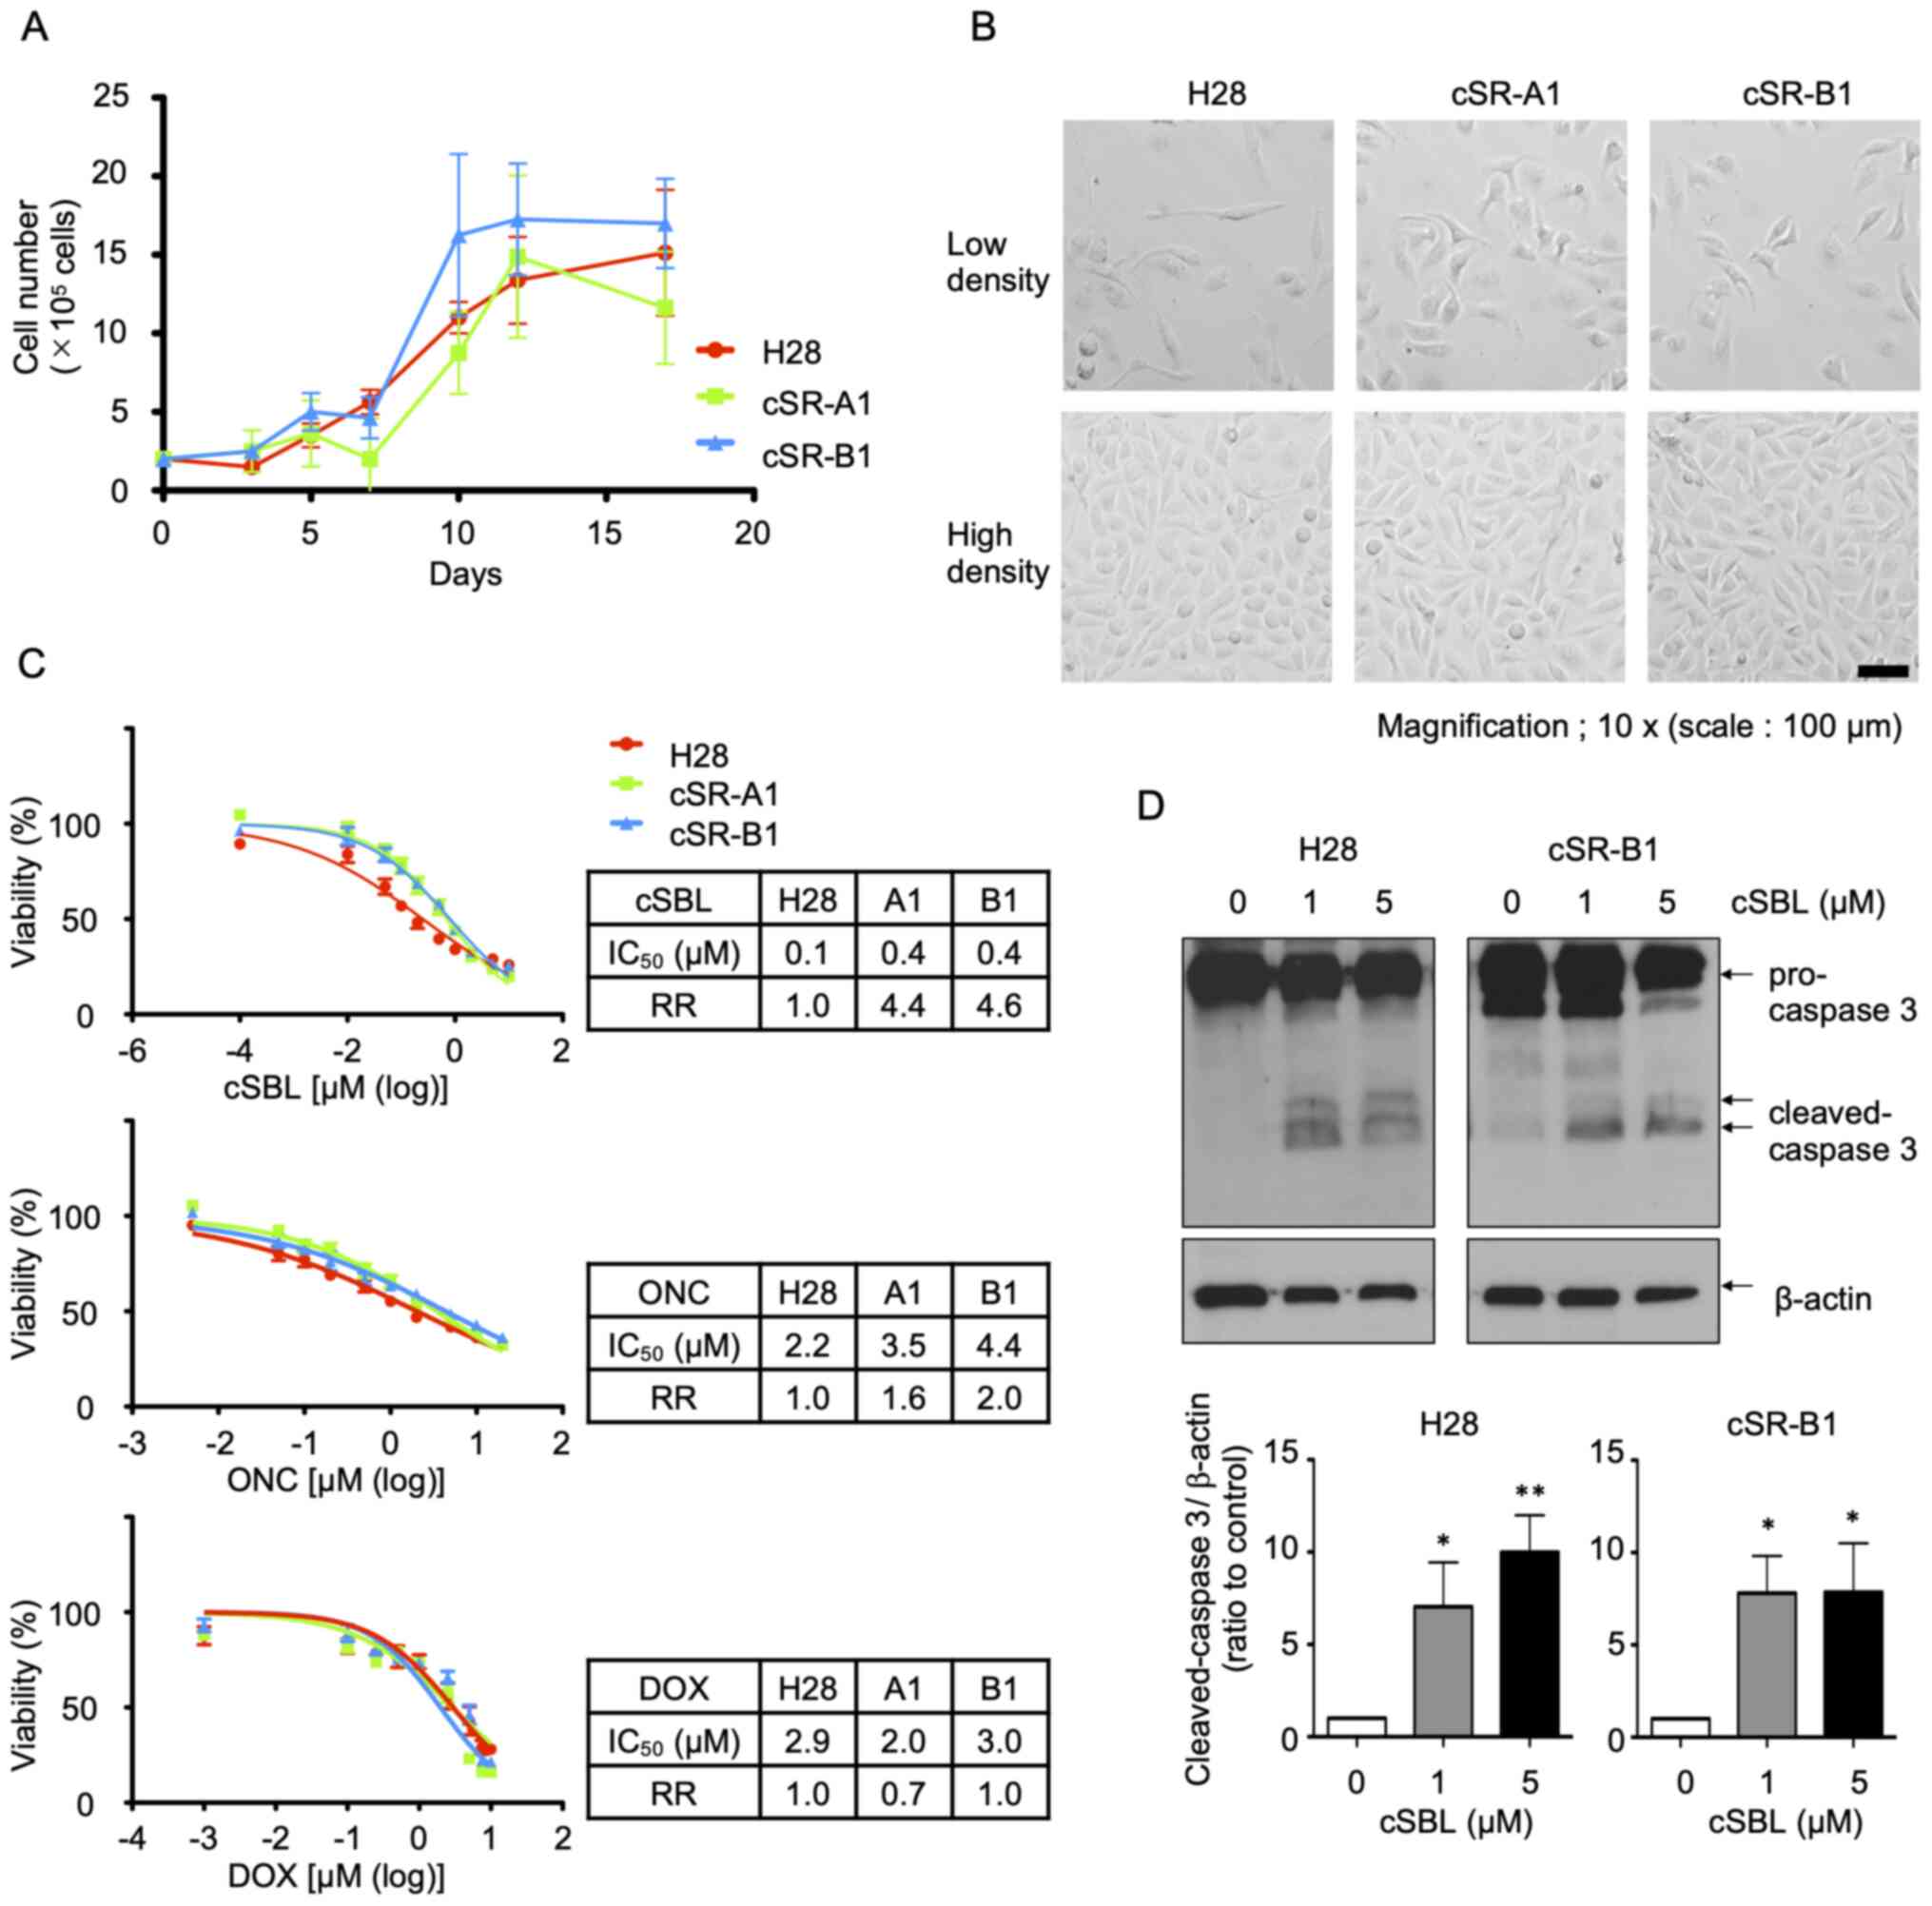 | Figure 2.Analysis of cSR cell line
characteristics. (A) Growth of H28 and cSR cells. Cells are seeded
at 2×10⁵ cells/well and counted at the timepoints (3 to
17 days) as indicated. Each data point represents the mean ± SD of
three independent experiment. (B) Morphology of H28 and cSR cells.
Cells are seeded at 1×10⁵ cells/well. After 24 h (low
density) or 72 h (high density), cell morphology is observed. Scale
bar, 100 µm. (C) Effect of cSBL, ONC, and DOX on H28 and cSR cells.
Viability of cells treated with the drugs are measured by the WST-8
assay. IC50 values and RRs are calculated from the
depicted dose-response curves. Each data point represents the mean
± SD of three independent experiment performed in triplicates. (D)
Apoptosis induction in H28 and cSR-B1 cells treated with cSBL.
Cells are treated with cSBL (1 or 5 µM), and the expression of
cleaved caspase-3 is detected using western blotting. Densitometric
quantification is performed using the results of three independent
experiments (mean ± SD). The statistical significance of the bands
compared to the non-treated control were shown. *P<0.05,
**P<0.01 vs. 0 µM cSBL. cSR, cSBL-resistant; cSBL, bullfrog
sialic acid-binding lectin; ONC, onconase; DOX, doxorubicin; RR,
resistance rate; SD, standard deviation. |
Altered gene expression in cSR cell
lines
Total RNA was extracted from H28, cSR-A1, and cSR-B1
cells and RNA quality was evaluated. All samples had
RINe values of 10.0 (Fig.
S1), indicating that RNA could be extracted in a condition when
it was hardly degraded. Therefore, these samples were used for
microarray analyses. A comparison of the expression profiles in the
cSR-A1, cSR-B1, and parental H28 cell lines revealed that 1254
genes (623 upregulated and 631 downregulated) were dysregulated in
cSR-A1 cells and 1,225 genes (608 upregulated and 617
downregulated) were dysregulated in cSR-B1 cells compared to H28
cells. Among them, 927 genes (440 upregulated and 487
downregulated) were common DEGs out of 37,756 known coding
transcripts on the microarray (2.46%). The fold change ranged from
1.5- to 934.8-fold for upregulated genes and 1.5- to 755.7-fold for
downregulated genes. The top 20 up- and downregulated genes in cSR
cell lines are listed in Table
SI.
GO enrichment analysis
To further understand the functional relevance of
DEGs in cSR cell lines, we performed gene ontology analysis. The
927 DEGs were used to extract the associated ontologies based on
three broad ontology categories: ‘biological process,’ ‘molecular
function,’ and ‘cellular component.’ In all cases, a P-value ≤0.05
was considered statistically significant. The 20 most enriched GO
terms for the DEGs are listed in Table
SII. There were 123 significantly enriched GO terms in the
biological process category. The most significant term was
oxidation-reduction process (GO:0055114). Interestingly, the GO
terms included not only terms related to cancer characteristics,
such as cell proliferation (GO:0008284, GO:0008285), adhesion
(GO:0007155, GO:0007162), migration (GO:0016477), and apoptosis
(GO:0006915), but also several metabolic processes related to
lipids (GO:0006869), cellular protein (GO:0044267), and drugs
(GO:00171449). In the molecular function category, 36 functions
were enriched, and the most significantly enriched term was
integrin binding (6.87E-07). There were several other binding
functions, including growth factors [IGF (GO:0005520), FGF
(GO:0017134), TGF (GO:0050431), and EGF (GO:0005154)] and other
cell membrane molecules such as receptors (GO:0005102), heparin
(GO:0005102), and syndecan (GO:0045545). Thirty-two components were
enriched in the cellular component category. The top four GO terms
in cellular component included ‘extracellular’ [extracellular space
(GO:0005615), extracellular exosome (GO:0070062), extracellular
matrix (GO:0031012), and extracellular region (GO:0005576)]. They
were followed by terms related to the cell membrane, such as cell
surface (GO:0009986), basement membrane (GO:0005604), and plasma
membrane (GO:0005886). Altogether, it appears that there are many
differences between parental H28 cells and cSR cells in cellular
functions, especially in association with cancer characteristics
and metabolic processes. Extracellular- and cell
membrane-associated GO terms were highly enriched in the DEGs of
cSR cell lines.
Pathway analysis
To analyze the signaling pathways affected by DEGs
in cSR cell lines, we analyzed DEGs using the KEGG database.
Table SIII shows the 18
significantly affected pathways in cSR cell lines. Among the
significantly enriched pathways (determined by a hypergeometric
test where P<0.05), ‘metabolism of xenobiotics by cytochrome
P450’ was the most significant. Additionally, there were several
pathways involved in various metabolic processes. Fifty-seven genes
were involved in metabolic pathways, all related to lipid and
carbohydrate metabolism. These results prompted our interest in
further analysis of the interactions among these DEGs.
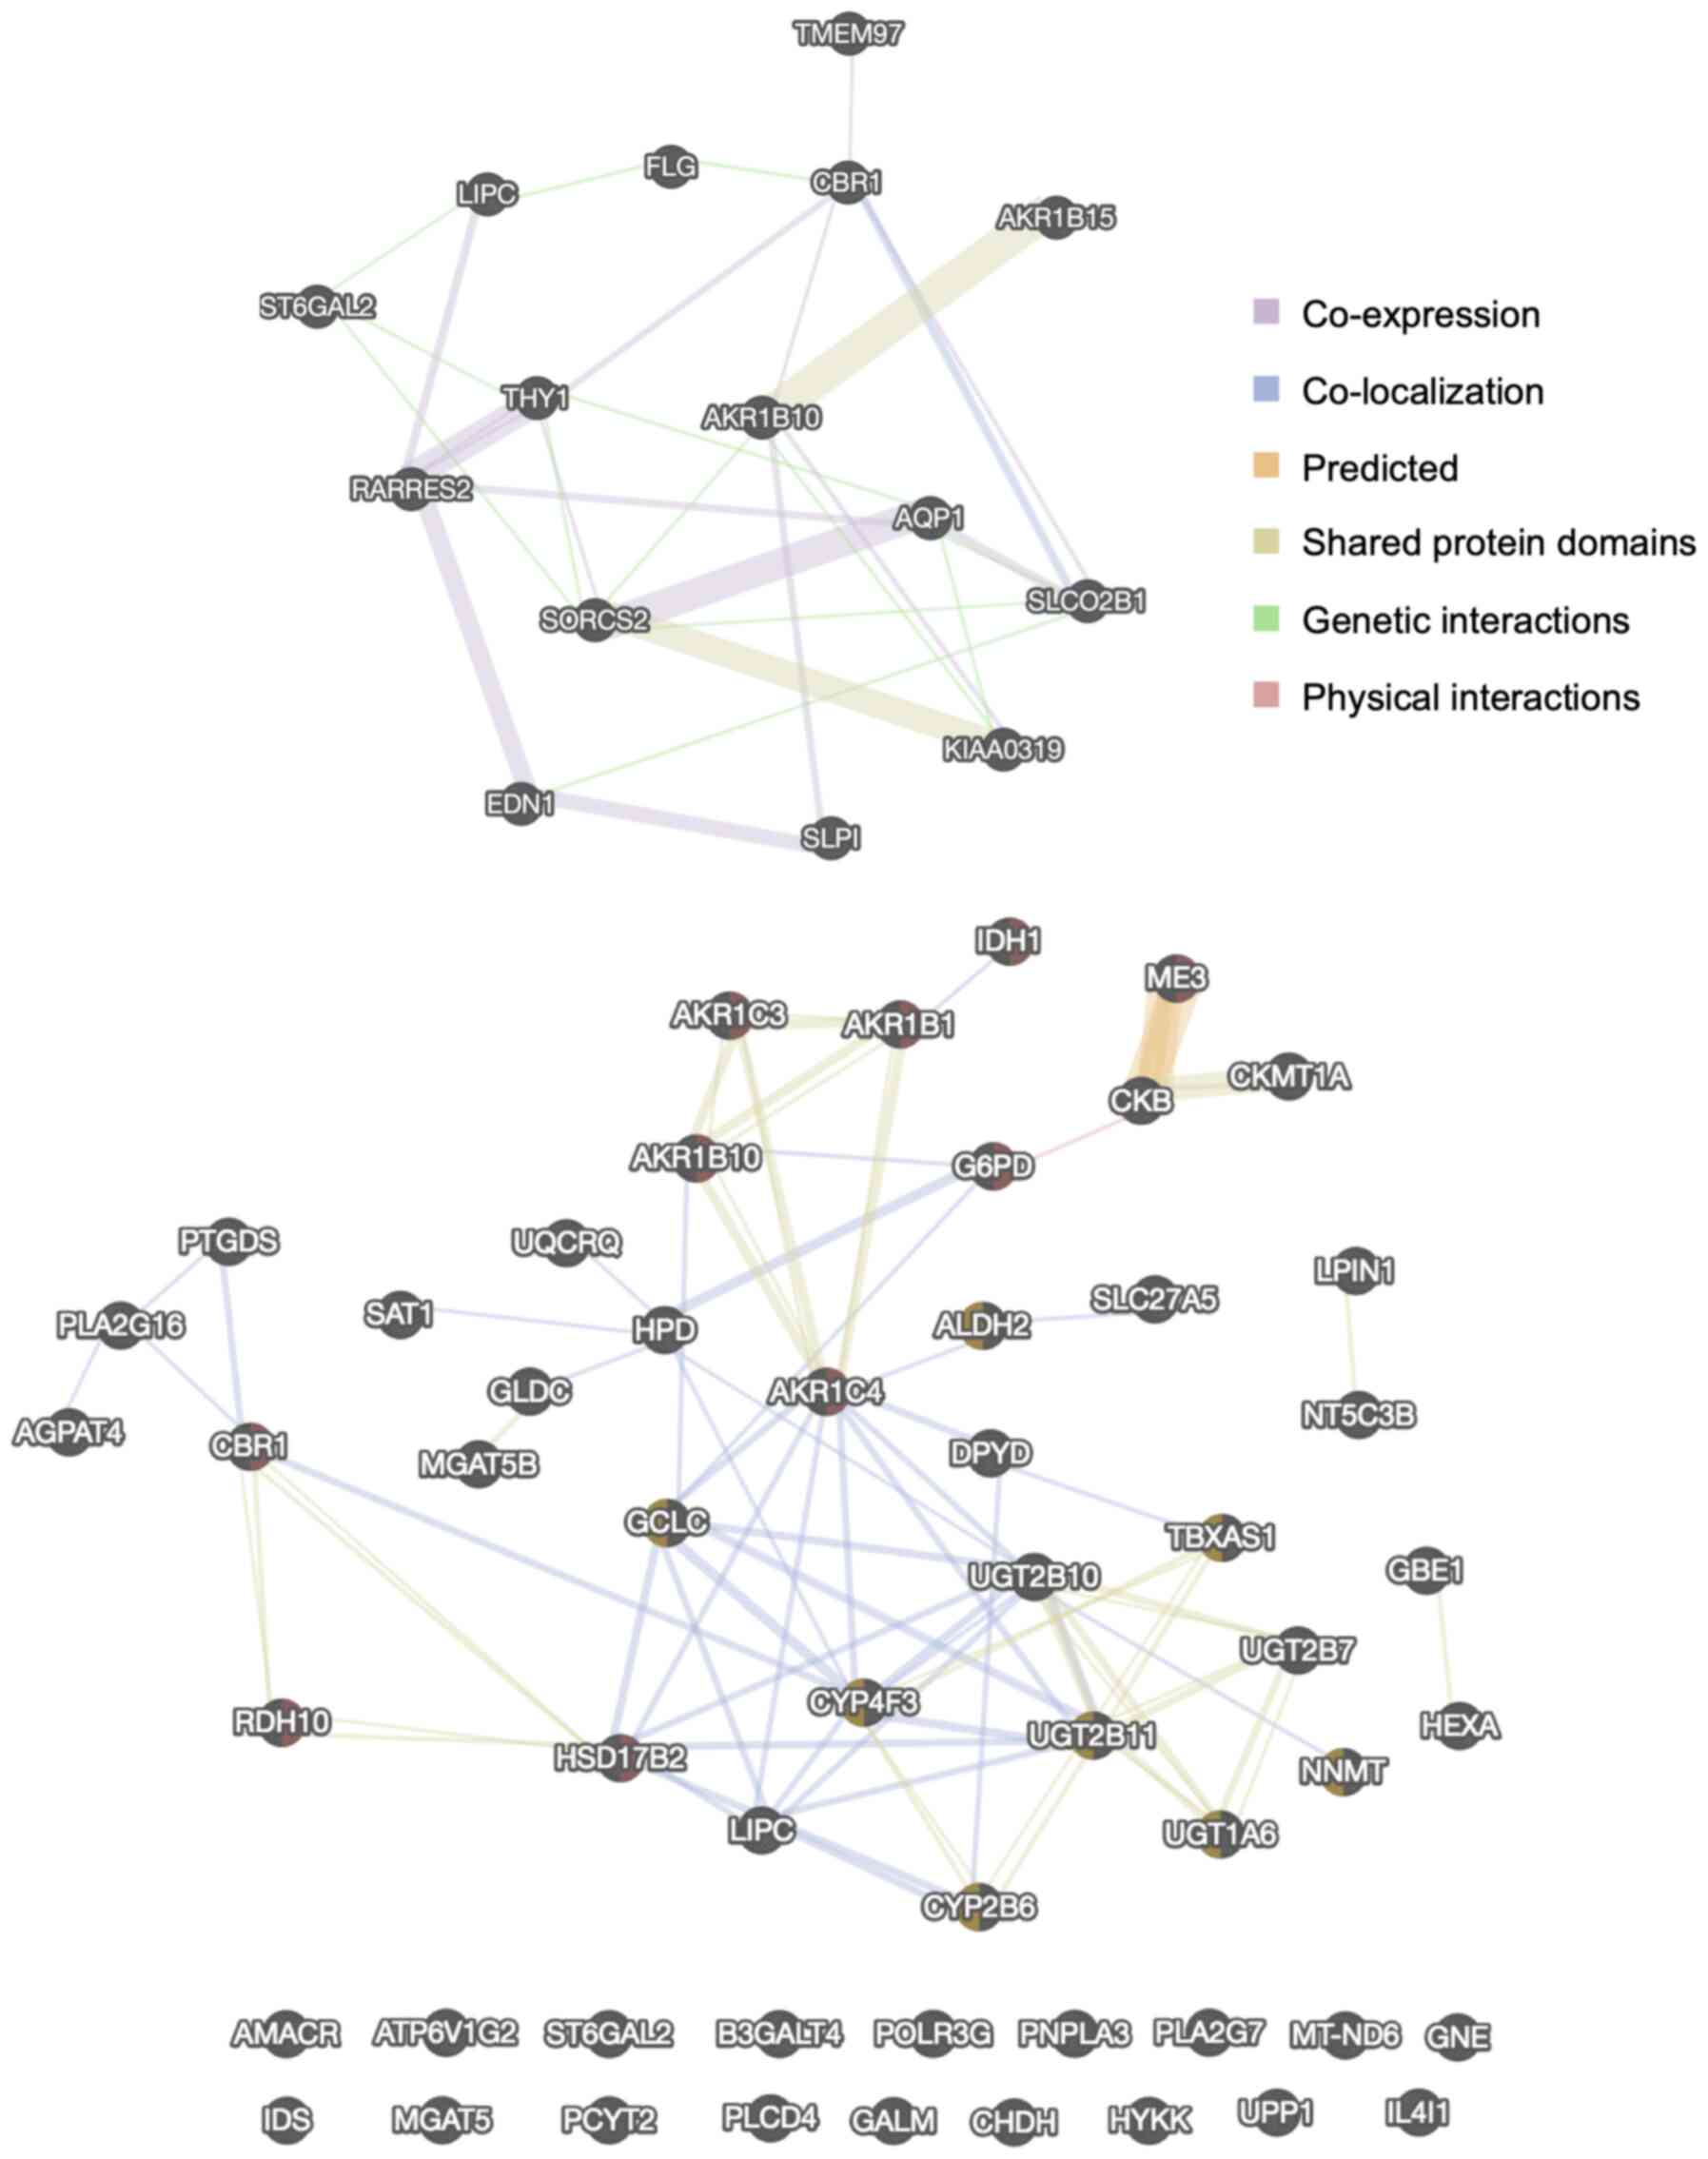
PPI network analysis
The networks of proteins encoded by the top 10 up-
and downregulated DEGs and the 57 genes in the KEGG metabolic
pathways were identified using the GeneMANIA PPI network (Fig. 3). The color of the line represents
the type of interaction, and the size of the node indicates the
degree of interaction in the PPI, where larger nodes have more
interactions. These data demonstrated there were some protein
families whose expression was affected in cSR cells, such as AKR or
UDP-glucuronosyltransferase. However, there were no significant hub
proteins in either PPI network, suggesting that long-term exposure
of cSBL affected gene expression in a pleiotropic fashion.
RT-qPCR analysis
As indicated above, we found that the expressions of
some AKR family members were affected in cSR cells (Fig. 3). Two of these genes, AKR1B15
and AKR1B10, were among the top three most downregulated
genes in cSR cells (Table SI).
Therefore, we were interested in the AKR family, which has been
reported to be associated with cancer, and conducted subsequent
studies focusing on highly downregulated genes in cSR cells. In
order to confirm the reproducibility of the microarray, we compared
gene expression patterns between parental and cSR cells using
RT-qPCR. As shown in Fig. 4,
THY1, AKR1B15, AKR1B10, SCL47A2, and CBR1 all had
reduced expression in cSR-A1 and cSR-B1 cells. These genes had
22.8- to 483.2-fold decreased expression, and this downregulation
was similar in both cSR-A1 and cSR-B1 cells. Although these fold
changes were different from those observed in the microarray
analysis, they were in the same direction. Therefore, RT-qPCR
confirmed that the microarray experiments were valid and showed
that the changes were highly significant.
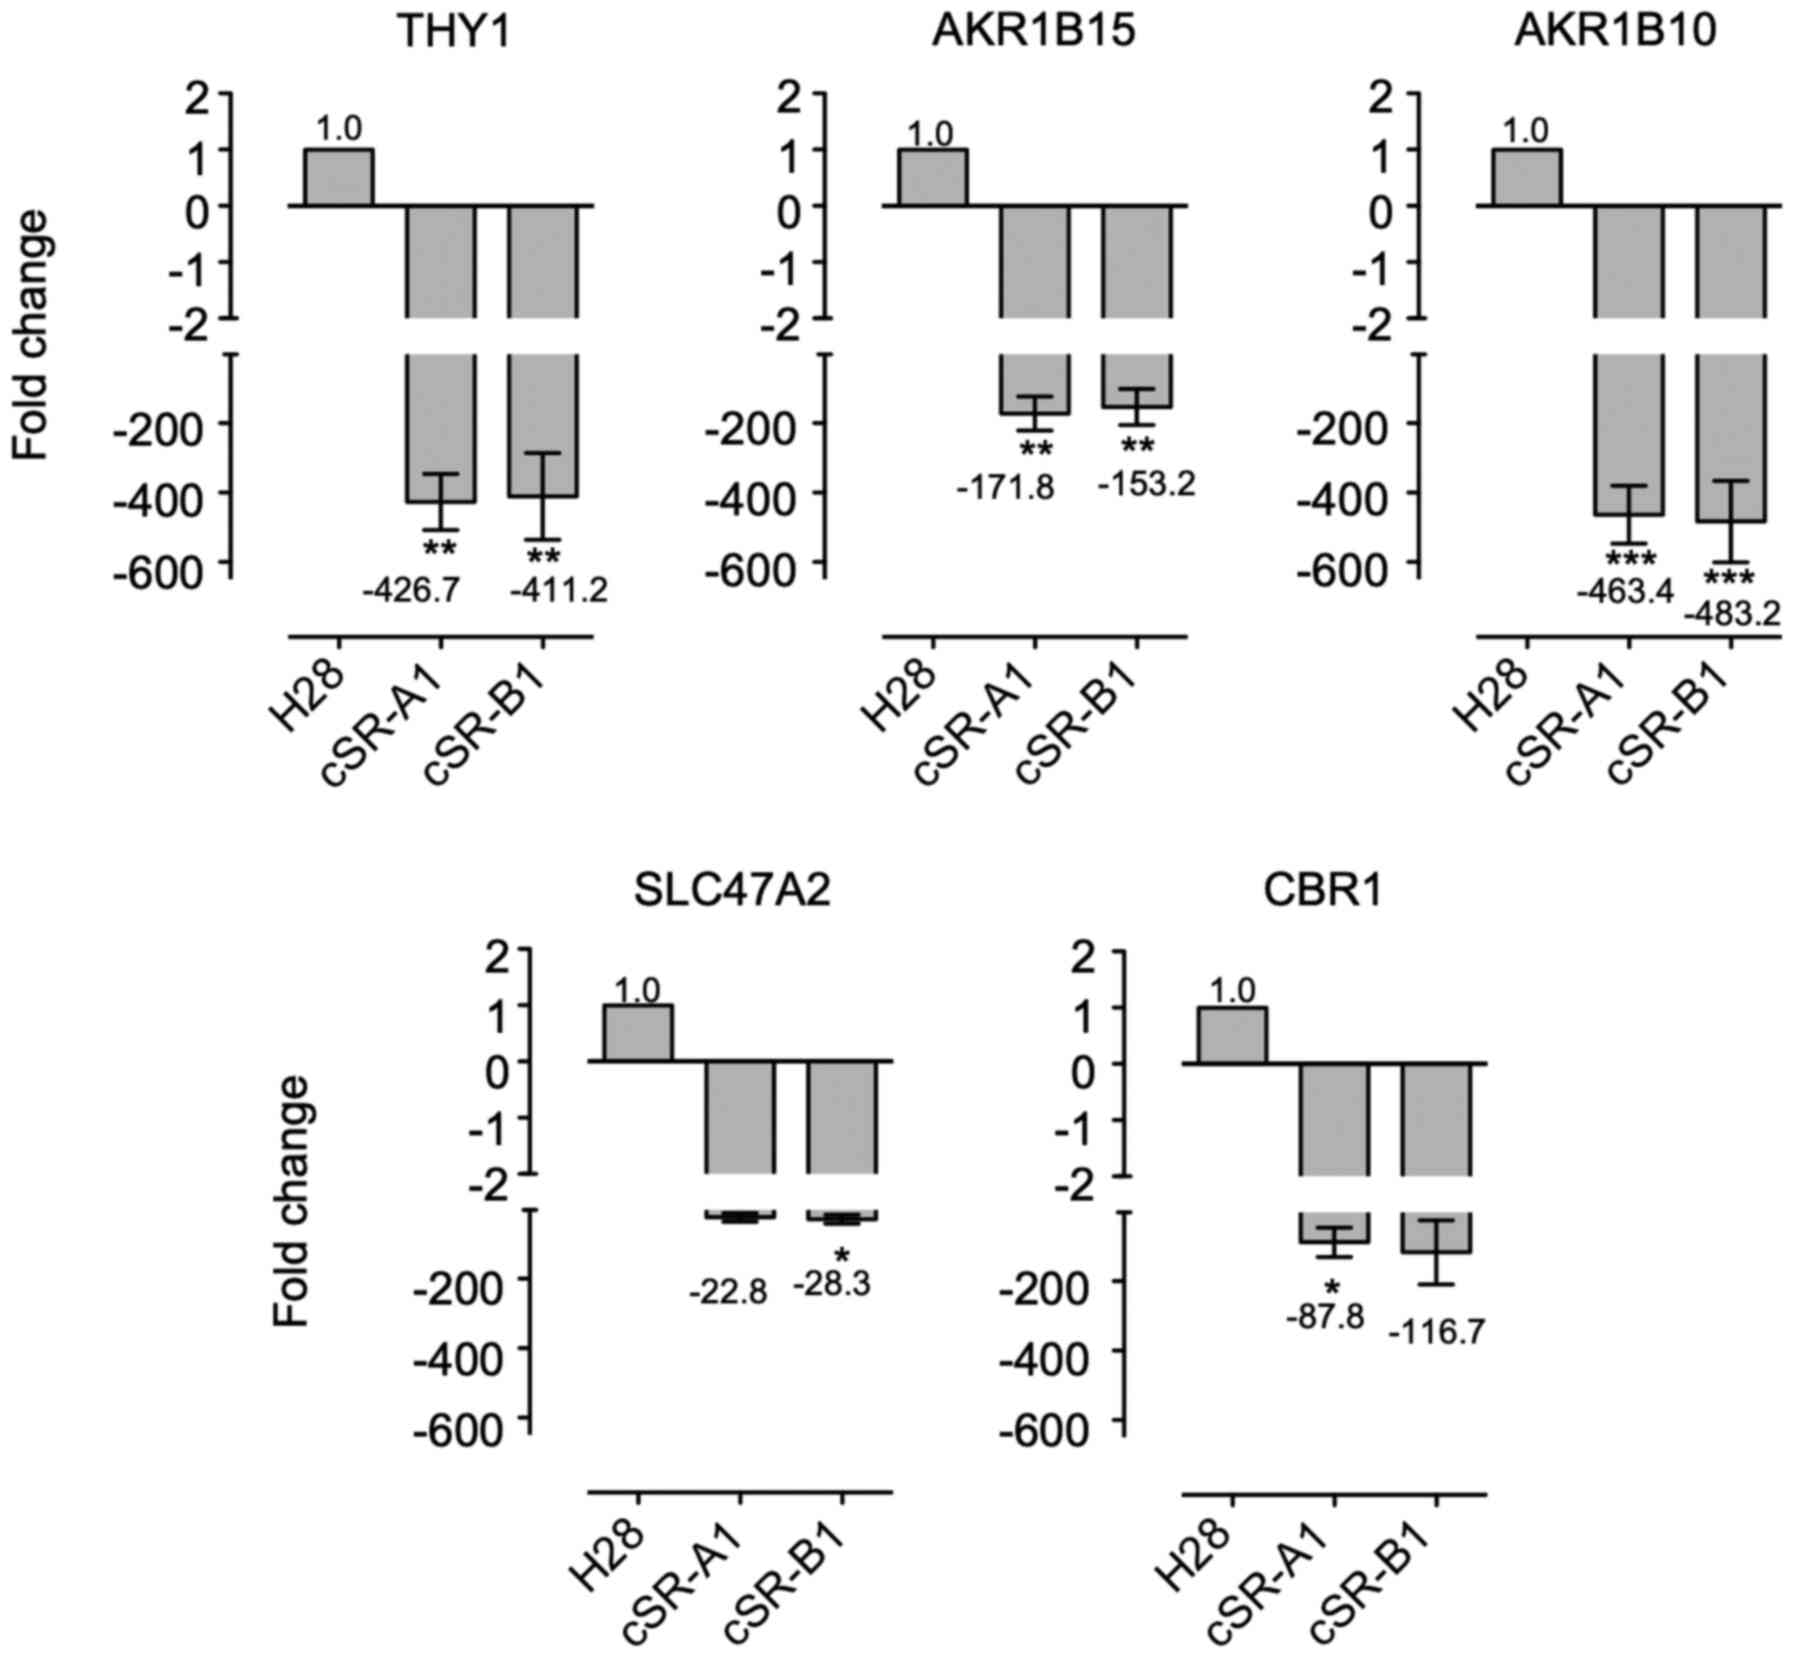 | Figure 4.Expression of THY1, AKR1B15,
AKR1B10, SLC47A2, and CBR1 mRNA in H28 and cSR cells.
Quantitative RT-PCR is performed using specific primers and
GAPDH (control gene). The expression levels of genes are
normalized to the level of GAPDH, and the level of the
corresponding gene in H28 cells (control cell line) is set at 1.
Data are presented as mean ± SD of three independent experiment
performed in triplicates, and the mean values are indicated on the
X axis titles. *P<0.05, **P<0.01, ***P<0.001 vs. H28. cSR,
bullfrog sialic acid-binding lectin-resistant; RT-PCR, reverse
transcription polymerase chain reaction; SD, standard deviation;
THY1, Thy-1 Cell Surface Antigen (CD90); AKR, aldo-keto reductase;
SLC47A2, solute carrier family 47 member 2; CBR1, carbonyl
reductase; GAPDH, glyceraldehyde-3-phosphate dehydrogenase. |
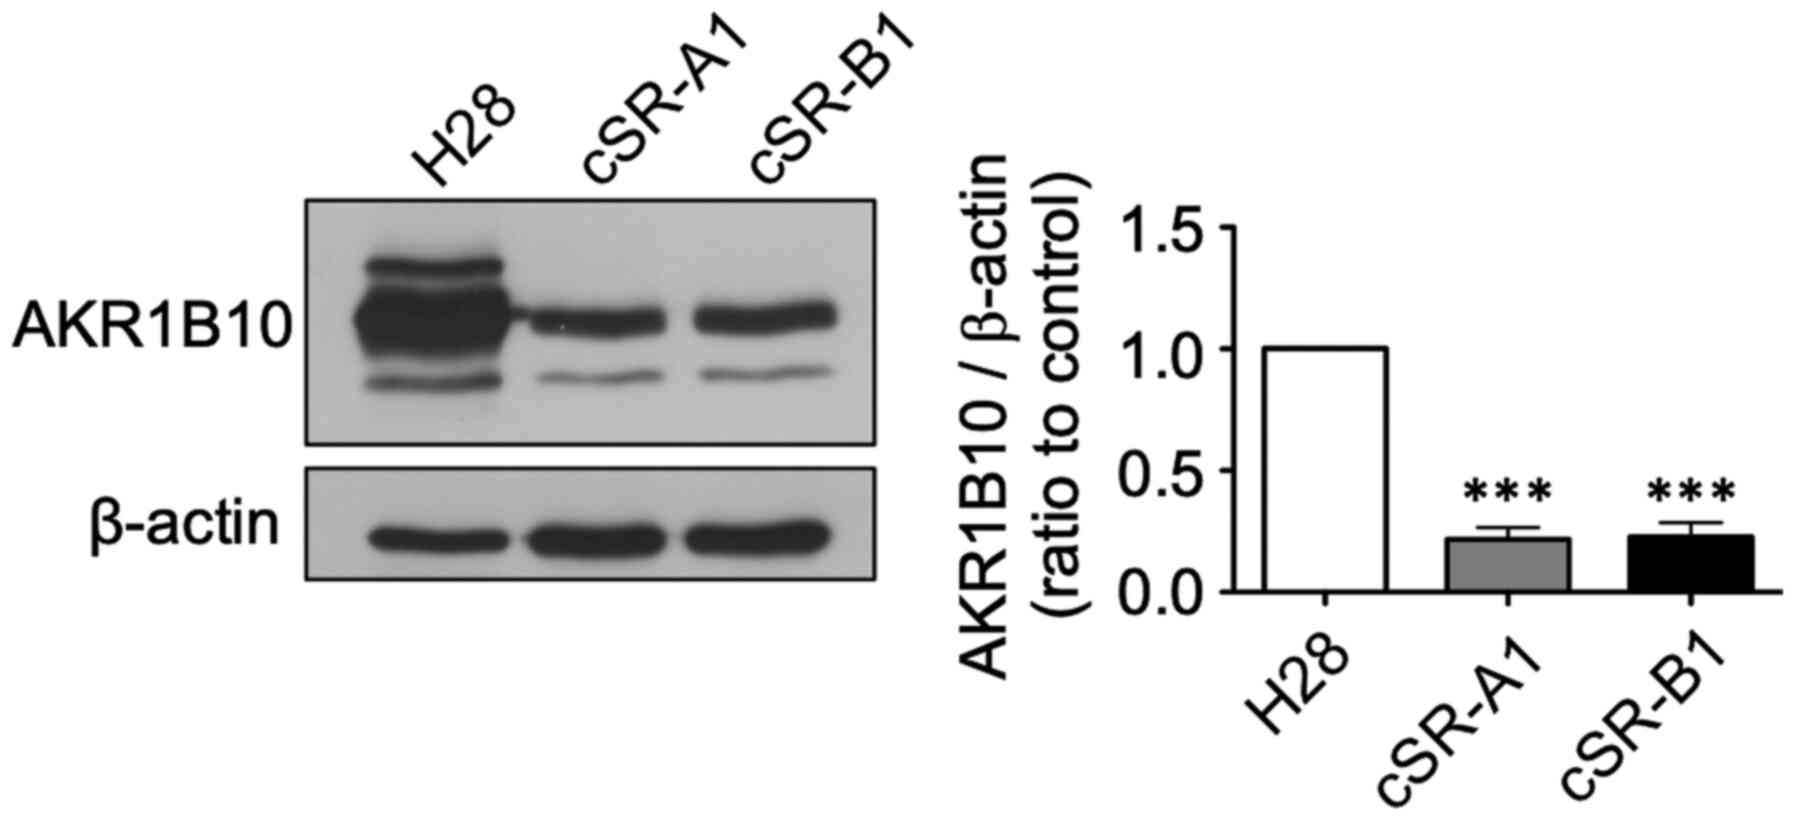
Confirmation of AKR1B10 downregulation
using western blot
Next, we further examined protein expression of the
AKR family members that were downregulated in cSR cells. We found
that the expression of six AKR family genes were decreased from
9.1- to 562.0-fold in the microarray analysis (Table I). We focused on AKR1B10, which has
been reported to be associated with cancer (44) and whose antibody was commercially
available. The expression of AKR1B10 at the protein level was
confirmed using western blotting. A significant decrease in AKR1B10
expression was observed in cSR-A1 and cSR-B1 cells compared to H28
cells (Fig. 5). Therefore, the
decreased expression of AKR1B10 as detected by the microarray
analysis was also observed at the protein level.
 | Table I.Gene expression changes of AKR family
in cSR cells. |
Table I.
Gene expression changes of AKR family
in cSR cells.
| Gene symbol | Fold
changea |
|---|
| AKR1B15 | −562.0 |
| AKR1B10 | −548.5 |
| AKR1C1 | −54.0 |
| AKR1C4 | −24.7 |
| AKR1B1 | −11.4 |
| AKR1C3 | −9.1 |
Further investigation of DEGs other
than the AKR family in cSR cells
Finally, we further investigated genes that showed
expression fluctuations based on the results of microarray
analysis. We found that the expression of some members of
ATP-binding cassette (ABC) transporter superfamily was decreased in
cSR cells (Table SIV). The
expression of ABCC2 was −17.3 times lower and ABCA1
was −4.7 times lower in cSR cells.
Discussion
In this study, we produced cSR cells by treating
sensitive H28 cells with low doses of cSBL over a long period. We
also succeeded in identifying genes whose expression was altered in
cSR cells (Table SI). The GO
analysis and pathway analysis indicated that these genes were
related to cell proliferation and cell membrane, as well as sugar
and lipid metabolism (Tables SII
and SIII). We also found that
AKR1B10 was significantly reduced in cSR cells at the protein level
(Fig. 5). These findings indicate
that long-term treatment of cancer cells with cSBL alters many
metabolic genes and reduces the expression of AKR family genes,
revealing a new aspect of the antitumor effect of cSBL.
Analysis of cSR cell lines characteristics revealed
that although cSR cells tended to exhibit shrunken morphology in
low-density culture conditions, we could not detect significant
differences in morphology in high-density culture conditions,
proliferation or apoptosis after treatment with high cSBL
concentrations (Fig. 2). The reason
for the morphological change observed in low-density culture
conditions is unclear, but we speculate that this change may have
been caused by changes in expression of genes related to the
morphology, adhesion or migration. Indeed, GO enrichment analysis
showed there were some enriched GO terms such as cell surface and
plasma membrane in cellular component category or integrin binding
in molecular function category. The RRs to cSR were high (15.3 and
14.5 for cSR-A1 and -B1, respectively) in the colony assay but low
(4.4 and 4.6 for cSR-A1 and -B1, respectively) in the WST-8 assay
(Figs. 1 and 2). By the nature of the experiment, the
colony assay observed colony forming ability for a relatively long
time (12 days) in the presence of low concentrations of cSBL (1-50
nM) and the WST-8 assay monitored survival changes in the presence
of high concentrations of cSBL (0.01–10 µM) for a short period of
time (72 h). This indicates that cSR cells are resistant to
long-term treatment with low concentrations of cSBL, but under
short-term treatment conditions with relatively high
concentrations, the apoptosis-inducing effect of cSBL is also
observed in cSR cells. In other words, it is suggested that even in
cSR cells that have acquired resistance by some mechanism in this
long-term treatment, intracellular RNA is cleaved and apoptosis is
induced by cSBL treatment exceeding a certain concentration. The
dramatic mechanism of action that involves RNA cleavage may
interfere with the ability of cancer cells to develop high
resistance to cSBL.
Experiments that require RNA extracted from
cytotoxic RNase-treated cells, such as RNA expression analysis, are
difficult to perform. Such experiments often have low accuracy
because the extracted RNA is presumably not intact in the cells
that are treated with cytotoxic doses of RNase, and the RNase may
degrade RNA even during the cell lysing step. However, several
recent reports identified DEGs in cytotoxic RNase-treated cells
using microarray technology. These experiments were carried out in
very strict conditions, such as including only RNA with acceptable
concentrations and A260/280 ratios or high RIN values,
as it was done in this experiment (32–34).
Some of the identified genes whose expression was affected by cSBL
treatment were also identified in a microarray examining cells
treated with PE5. Since we used resistant cells, the identified
DEGs may have include genes involved in the resistance to cSBL.
However, the decrease in the AKR family detected here was also
observed in the short-term treatment of PE5; PE5 is known to reduce
the expression of AKR1A1, a member of the AKR family
(34). Therefore, the
downregulation of AKR family members might be a universal response
of cancer cells to cytotoxic RNase or involved in the antitumor
effects of cytotoxic RNases. The microarray analyses revealed that
there were significant pleiotropic changes including those in the
expression of multiple genes involved in metabolic pathways in
cSBL-resistant cells (Table SIII).
Some of these metabolic pathway related genes are listed among the
top 20 list of genes up- or down-regulated in cSR cells (Table SI). Among the up-regulated genes,
the increase in expression of LIPC which catalyzes the
hydrolysis of triglycerides and phospholipids (45), was the highest (934.8 fold higher in
cSR cells, Table SI).
ST6GAL2, which showed the third largest change (126.7 fold
higher in cSR cells, Table SI), is
an enzyme that transfers sialic acid from the donor of substrate
CMP-sialic acid to galactose containing acceptor substrates
(46). It is interesting to note
that the expression level of this enzyme was elevated, because the
presence of sialic acids at the cell surface is thought to be
important for the effect of cSBL (20). In this study, because we found that
the expressions of some AKR family members were affected in cSR
cells, further investigations were focused mainly on strongly
downregulated genes in cSR cells.
The AKR superfamily is a family of enzymes that
reversibly reduce carbonyl groups (47). These proteins catalyze a variety of
metabolic oxidation-reduction reactions, including reduction of
glucose, glucocorticoids, small carbonyl metabolites, glutathione
conjugates, and phospholipid aldehydes (48). More than 150 proteins belonging to
this superfamily are classified into 15 families (AKR1 to AKR15)
based on the similarity of amino acid sequences. Each family is
further subdivided into subfamilies, which have 60% or higher
similarity at the amino acid level (47). The largest family, AKR1, is
subdivided into six subfamilies (AKR1A, AKR1B, AKR1C, AKR1D, AKR1E,
and AKR1G). In humans, there are 14 AKR superfamily proteins, nine
of which belong to the AKR1 family (49). Our microarray analysis revealed that
multiple AKR genes were downregulated in cSR cells. In addition,
when we focused on AKR1B10, which is involved in resistance to
anticancer drugs and has attracted attention as a new target in
cancer therapy (49), we found that
its expression was significantly reduced at the protein level in
cSR cells. AKR1B10 has been reported to be overexpressed in lung
cancer (50), liver cancer
(51,52), breast cancer (50), pancreatic cancer (53), and oral squamous cell carcinoma
(54). One of the roles of AKR1B10
in cancer cells is to suppress the production of retinoic acid, a
cell differentiation-promoting factor. Retinoic acid is produced
from retinol via retinal and binds to the nuclear receptors,
retinoic acid receptor and retinoid X receptor, to promote cell
differentiation (55). AKR1B10 is
thought to promote cancer cell proliferation and survival by
reducing retinal to retinol, thereby decreasing intracellular
retinoic acid production (56,57).
In addition, AKR1B10 promotes cancer cell survival by reducing
cytotoxic aldehydes produced by lipid peroxidation, such as
4-hydroxynonenal (58,59), and is involved in resistance to
anticancer drugs such as cisplatin, mitomycin C, anthracyclines
(doxorubicin and idarubicin), and docetaxel (60–62).
Therefore, AKR1B10 has potential not only as a cancer biomarker but
also as a novel therapeutic target for cancer treatment and may
promote chemosensitization. Although reports on AKR1B10 in MPM are
very limited, AKR1B10 may also be associated with malignancy in
MPM, as in the other cancer cases indicated above. A study aimed to
search for novel biomarkers in malignant mesothelioma performed by
Mundt et al (63),
identified that AKR1B10 was one of the prognostic mesothelioma
biomarker candidates. Patients with high AKR1B10 levels had a mean
survival time that was 5.5 months shorter than that in patients
with low AKR1B10 expression levels (5.5 vs. 11.0 months,
respectively; N=14 for high and 13 for low expression level). Usami
et al (64) established two
morphologically distinct MPM cell lines, Y-MESO-8A
(epithelial-like) and Y-MESO-8D (spindle-like) from the same
patient. Microarray analysis to determine differences in gene
expression in these cells showed that the expression of
AKR1B10 and AKR1C3 in Y-MESO-8D were 17.8 and 6.35
times higher, respectively, than that of Y-MESO-8A (64). Another report showed that under
serum starvation conditions, AKT was phosphorylated in Y-MESO-8D
but not in Y-MESO-8A (65).
However, there are no reports related to the function of AKR1B10 in
those cells. Detailed investigations focusing on the function of
AKR1B10 in MPM are needed. It is interesting to note that decreased
AKR1B10 expression was observed at the protein level in cells
established by long-term exposure to cSBL. It is possible that cSBL
could be used to promote chemosensitivity to anticancer drugs.
Indeed, Toyooka and Hayakawa's group has succeeded in developing a
novel AKR1B10 inhibitor that suppressed cisplatin resistance in
non-small cell lung cancer cells. It also blocked the proliferative
and metastatic potential in these cells (66). Now we are working on the
comprehensive investigation of the effect of cSBL on AKR family
including impact of several anticancer drugs in cSR cells,
In addition to AKR1B10, the expression levels
of AKR1B1, AKR1C1, AKR1C3 and AKR1C4 were reduced in
cSR, and it has also been reported that they were involved in
resistance to cisplatin, daunorubicin or DOX (52,67,68).
Furthermore, we found that the expression of some members of the
ATP-binding cassette (ABC) transporter superfamily, which
contributed to chemotherapeutic resistance, was reduced in cSR
cells (Table SIV). In humans,
there are 49 known ABC genes classified into seven different
families (A-G) depending on their amino acid sequence (68). They serve a variety of functions
other than drug resistance and can be expressed as channels,
receptors and transporters (69).
The members involved in drug efflux from human cells do not belong
to one particular family (69).
Among the ABC transporters found to be reduced in cSR cells, ABCC2
has been reported to contribute to resistance against methotrexate,
doxorubicin, cisplatin (68), and
ABCA1 is responsible for transporting cholesterol and phospholipids
(70), but has also been reported
to contribute to resistance to Nitidine, a cytotoxic
benzophenanthridine alkaloid (71).
Shukla et al reported that several ABC transporter genes
were endogenously overexpressed in three MPM cell lines as compared
to untransformed LP9/TERT1 mesothelial cells (ABCB1 in MO, ABCC3 in
ME-26, and ABCA2, ABCC5 and ABCA7 in HMESO cells) (9). Hudson et al (72) compared expression of genes involved
in the response to chemotherapy between II-45 rat MPM cells and
normal 4/4 RM.4 mesothelial cells, and between established
chemo-resistant cell lines and parental II-45 cells, respectively.
They found that ABCB1 and ABCG2 were endogenously overexpressed in
II-45 MPM cells compared to 4/4 RM.4 normal cells; furthermore,
levels of ABCB1 in cisplatin resistant II-45 cells, and ABCC2 in
pemetrexed or combination (cisplatin plus pemetrexed) resistant
II-45 cells were significantly increased compared to parental II-45
cells. Those reports indicate that although the molecular species
which are involved in the chemoresistance differ depending on the
cell type, ABC transporter superfamily members are associated with
inherent and acquired drug resistance in MPM. Furthermore, ABCB5 is
now considered as one of a therapeutic target in MPM, because ABCB5
is upregulated in MPM-initiating cells generated from primary MPM
samples (73). Our previous studies
have shown that cSBL had a stronger apoptosis-inducing effect on
multidrug resistant K562 leukemia cells that overexpressed ABCB1
than on their parent K562 cells (27). Since we found that the expression of
ABCC2 was reduced in cSR, it was suggested that cSBL was
effective against MPM regardless of intrinsic drug resistance and
may be able to reduce MPM resistance to chemotherapeutic agents
that are substrates for ABCC2. Indeed, although the difference was
not statistically significant in our experimental conditions,
cSR-A1 tended to be more sensitive to DOX (Fig. 2).
In conclusion, we found that long-term treatment
with cSBL affected malignant mesothelioma cells by dysregulating
multiple genes. The detected DEGs may include genes other than
those directly affected by the cSBL application. Currently,
examinations of the direct effect of cSBL treatment and combination
research with other drugs are being conducted. Because cSBL
significantly reduced the expression of AKR family members,
especially AKR1B10, it may offer new possibilities for cancer
therapy. We believe that investigation of other genes whose
expression was changed in cSR cells will further elucidate the
antitumor effect of cSBL. Furthermore, by enhancing the effect of
cSBL itself and searching for effective concomitant drugs using
information obtained in this study, our results can be expected to
lead to the establishment of novel, more effective cancer
treatments.
Supplementary Material
Supporting Data
Acknowledgements
Not applicable.
Funding
This research was funded by a Grant-in-Aid for Young
Scientists (B) (grant no. 17K15029) to Takeo Tatsuta.
Availability of data and materials
The datasets used and/or analyzed in the current
study are available from the corresponding author on reasonable
request.
Authors' contributions
TT and MH conceived and designed the study. TT, AN
and SS acquired and analyzed the data. TT and MH confirmed the
authenticity of all the raw data. TT prepared the draft of the
manuscript, including the figures. All authors read and approved
the final manuscript.
Ethics approval and consent to
participate
Not applicable.
Patient consent for publication
Not applicable.
Competing interests
The authors declare that they have no competing
interests.
Glossary
Abbreviations
Abbreviations:
|
RNase
|
ribonuclease
|
|
ONC
|
onconase
|
|
cSBL
|
bullfrog sialic acid-binding
lectin
|
|
DEG
|
differentially expressed gene
|
|
ATF3
|
activating transcription factor 3
|
|
cSR
|
cSBL-resistant
|
|
DOX
|
doxorubicin
|
|
AKR
|
aldo-keto reductase
|
|
KEGG
|
Kyoto Encyclopedia of Genes and
Genomes
|
|
RT-qPCR
|
reverse transcription quantitative
polymerase chain reaction
|
|
PPI
|
protein-protein interaction
|
|
SLC47A2
|
solute carrier family 47 member 2
|
|
CBR
|
carbonyl reductase
|
|
GAPDH
|
glyceraldehyde-3-phosphate
dehydrogenase
|
|
RR
|
resistance rate
|
|
RINe
|
RNA integrity number equivalent
|
|
GO
|
Gene Ontology
|
References
|
1
|
Cakiroglu E and Senturk S: Genomics and
functional genomics of malignant pleural mesothelioma. Int J Mol
Sci. 21:63422020. View Article : Google Scholar : PubMed/NCBI
|
|
2
|
Cugell DW and Kamp DW: Asbestos and the
pleura: A review. Chest. 125:1103–1117. 2004. View Article : Google Scholar : PubMed/NCBI
|
|
3
|
Thanh TD, Van Tho N, Lam NS, Dung NH,
Tabata C and Nakano Y: Simian virus 40 may be associated with
developing malignant pleural mesothelioma. Oncol Lett.
11:2051–2056. 2016. View Article : Google Scholar : PubMed/NCBI
|
|
4
|
Farioli A, Ottone M, Morganti AG,
Compagnone G, Romani F, Cammelli S, Mattioli S and Violante FS:
Radiation-induced mesothelioma among long-term solid cancer
survivors: A longitudinal analysis of SEER database. Cancer Med.
5:950–959. 2016. View
Article : Google Scholar : PubMed/NCBI
|
|
5
|
Yap TA, Aerts JG, Popat S and Fennell DA:
Novel insights into mesothelioma biology and implications for
therapy. Nat Rev Cancer. 17:475–488. 2017. View Article : Google Scholar : PubMed/NCBI
|
|
6
|
Van Meerbeeck JP, Gaafar R, Manegold C,
Van Klaveren RJ, Van Marck EA, Vincent M, Legrand C, Bottomley A,
Debruyne C, Giaccone G, et al: Randomized phase III study of
cisplatin with or without raltitrexed in patients with malignant
pleural mesothelioma: An intergroup study of the European
organisation for research and treatment of cancer lung cancer group
and the National Cancer Institute. J Clin Oncol. 23:6881–6889.
2005. View Article : Google Scholar : PubMed/NCBI
|
|
7
|
Vogelzang NJ, Rusthoven JJ, Symanowski J,
Denham C, Kaukel E, Ruffie P, Gatzemeier U, Boyer M, Emri S,
Manegold C, et al: Phase III study of pemetrexed in combination
with cisplatin versus cisplatin alone in patients with malignant
pleural mesothelioma. J Clin Oncol. 21:2636–2644. 2003. View Article : Google Scholar : PubMed/NCBI
|
|
8
|
Wright K: FDA approves nivolumab plus
ipilimumab for the treatment of advanced HCC. Oncology (Willist
Park). 34:6936062020.
|
|
9
|
Shukla A, Hillegass JM, MacPherson MB,
Beuschel SL, Vacek PM, Pass HI, Carbone M, Testa JR and Mossman BT:
Blocking of ERK1 and ERK2 sensitizes human mesothelioma cells to
doxorubicin. Mol Cancer. 9:3142010. View Article : Google Scholar : PubMed/NCBI
|
|
10
|
Pouliquen DL, Nawrocki-Raby B, Nader J,
Blandin S, Robard M, Birembaut P and Grégoire M: Evaluation of
intracavitary administration of curcumin for the treatment of
sarcomatoid mesothelioma. Oncotarget. 8:57552–57573. 2017.
View Article : Google Scholar : PubMed/NCBI
|
|
11
|
Makarov AA and Ilinskaya ON: Cytotoxic
ribonucleases: Molecular weapons and their targets. FEBS Lett.
540:15–20. 2003. View Article : Google Scholar : PubMed/NCBI
|
|
12
|
Fang EF and Ng TB: Ribonucleases of
different origins with a wide spectrum of medicinal applications.
Biochim Biophys Acta. 1815:65–74. 2011.PubMed/NCBI
|
|
13
|
Wus Y, Mikulskiq SM, Ardeltll W, Rybakt SM
and Youlet RJ: A cytotoxic ribonuclease. J Biol Chem.
268:10686–10693. 1993. View Article : Google Scholar : PubMed/NCBI
|
|
14
|
Bosch M, Benito A, Ribó M, Puig T,
Beaumelle B and Vilanova M: A nuclear localization sequence endows
human pancreatic ribonuclease with cytotoxic activity.
Biochemistry. 43:2167–2177. 2004. View Article : Google Scholar : PubMed/NCBI
|
|
15
|
Balandin TG, Edelweiss E, Andronova NV,
Treshalina EM, Sapozhnikov AM and Deyev SM: Antitumor activity and
toxicity of anti-HER2 immunoRNase scFv 4D5-dibarnase in mice
bearing human breast cancer xenografts. Invest New Drugs. 29:22–32.
2011. View Article : Google Scholar : PubMed/NCBI
|
|
16
|
Nitta K, Ozaki K, Tsukamoto Y, Hosono M,
Ogawakonno Y, Kawauchi H, Takayanagi Y, Tsuiki S and Hakomori S:
Catalytic lectin (leczyme) from bullfrog (Rana catesbeiana)
eggs: Mechanism of tumoricidal activity. Int J Oncol. 9:19–23.
1996.PubMed/NCBI
|
|
17
|
Nitta K, Takayanagi G, Kawauchi H and
Hakomori S: Isolation and characterization of Rana
catesbeiana lectin and demonstration of the lectin-binding
glycoprotein of rodent and human tumor cell membranes. Cancer Res.
47:4877–83. 1987.PubMed/NCBI
|
|
18
|
Nitta K, Ozaki K, Tsukamoto Y, Furusawa S,
Ohkubo Y, Takimoto H, Murata R, Hosono M, Hikichi N, Sasaki K, et
al: Characterization of a Rana catesbeiana lectin-resistant
mutant of leukemia P388 cells. Cancer Res. 54:928–934.
1994.PubMed/NCBI
|
|
19
|
Titani K, Takio K, Kuwada M, Nitta K,
Sakakibara F, Kawauchi H, Takayanagi G and Hakomori S: Amino acid
sequence of sialic acid binding lectin from frog (Rana
catesbeiana) eggs. Biochemistry. 26:2189–2194. 1987. View Article : Google Scholar : PubMed/NCBI
|
|
20
|
Nitta K, Ozaki K, Ishikawa M, Furusawa S,
Hosono M, Kawauchi H, Sasaki K, Takayanagi Y, Tsuiki S and Hakomori
S: Inhibition of cell proliferation by Rana catesbeiana and
Rana japonica lectins belonging to the ribonuclease
superfamily. Cancer Res. 54:920–927. 1994.PubMed/NCBI
|
|
21
|
Tatsuta T, Sugawara S, Takahashi K, Ogawa
Y, Hosono M and Nitta K: Cancer-selective induction of apoptosis by
leczyme. Front Oncol. 4:1392014. View Article : Google Scholar : PubMed/NCBI
|
|
22
|
Tatsuta T, Hosono M, Ogawa Y, Inage K,
Sugawara S and Nitta K: Downregulation of Hsp70 inhibits apoptosis
induced by sialic acid-binding lectin (leczyme). Oncol Rep.
31:13–18. 2014. View Article : Google Scholar : PubMed/NCBI
|
|
23
|
Tatsuta T, Sugawara S, Takahashi K, Ogawa
Y, Hosono M and Nitta K: Leczyme: A new candidate drug for cancer
therapy. Biomed Res Int. 2014:4214152014. View Article : Google Scholar : PubMed/NCBI
|
|
24
|
Chen JN, Yiang GT, Lin YF, Chou PL, Wu TK,
Chang WJ, Chen C and Yu YL: Rana catesbeiana ribonuclease
induces cell apoptosis via the caspase-9/-3 signaling pathway in
human glioblastoma DBTRG, GBM8901 and GBM8401 cell lines. Oncol
Lett. 9:2471–2476. 2015. View Article : Google Scholar : PubMed/NCBI
|
|
25
|
Tatsuta T, Sato S, Sato T, Sugawara S,
Suzuki T, Hara A and Hosono M: Sialic acid-binding lectin from
bullfrog eggs exhibits an anti-tumor effect against breast cancer
cells including triple-negative phenotype cells. Molecules.
23:27142018. View Article : Google Scholar : PubMed/NCBI
|
|
26
|
Tatsuta T, Satoh T, Sugawara S, Hara A and
Hosono M: Sialic acid-binding lectin from bullfrog eggs inhibits
human malignant mesothelioma cell growth in vitro and in vivo. PLoS
One. 13:e01906532018. View Article : Google Scholar : PubMed/NCBI
|
|
27
|
Tatsuta T, Hosono M, Sugawara S, Kariya Y,
Ogawa Y, Hakomori S and Nitta K: Sialic acid-binding lectin
(leczyme) induces caspase-dependent apoptosis-mediated
mitochondrial perturbation in Jurkat cells. Int J Oncol.
43:1402–1412. 2013. View Article : Google Scholar : PubMed/NCBI
|
|
28
|
Tatsuta T, Hosono M, Miura Y, Sugawara S,
Kariya Y, Hakomori S and Nitta K: Involvement of ER stress in
apoptosis induced by sialic acid-binding lectin (leczyme) from
bullfrog eggs. Int J Oncol. 43:1799–1808. 2013. View Article : Google Scholar : PubMed/NCBI
|
|
29
|
Kariya Y, Tatsuta T, Sugawara S, Kariya Y,
Nitta K and Hosono M: RNase activity of sialic acid-binding lectin
from bullfrog eggs drives antitumor effect via the activation of
p38 MAPK to caspase3/7 signaling pathway in human breast cancer
cells. Int J Oncol. 49:1334–1342. 2016. View Article : Google Scholar : PubMed/NCBI
|
|
30
|
Tatsuta T, Hosono M, Takahashi K, Omoto T,
Kariya Y, Sugawara S, Hakomori S and Nitta K: Sialic acid-binding
lectin (leczyme) induces apoptosis to malignant mesothelioma and
exerts synergistic antitumor effects with TRAIL. Int J Oncol.
44:377–384. 2014. View Article : Google Scholar : PubMed/NCBI
|
|
31
|
Satoh T, Tatsuta T, Sugawara S, Hara A and
Hosono M: Synergistic anti-tumor effect of bullfrog sialic
acid-binding lectin and pemetrexed in malignant mesothelioma.
Oncotarget. 8:42466–42477. 2017. View Article : Google Scholar : PubMed/NCBI
|
|
32
|
Altomare DA, Rybak SM, Pei J, Maizel JV,
Cheung M, Testa JR and Shogen K: Onconase responsive genes in human
mesothelioma cells: Implications for an RNA damaging therapeutic
agent. BMC Cancer. 10:342010. View Article : Google Scholar : PubMed/NCBI
|
|
33
|
Vert A, Castro J, Ribó M, Benito A and
Vilanova M: Activating transcription factor 3 is crucial for
antitumor activity and to strengthen the antiviral properties of
Onconase. Oncotarget. 8:11692–11707. 2017. View Article : Google Scholar : PubMed/NCBI
|
|
34
|
Vert A, Castro J, Ribó M, Benito A and
Vilanova M: A nuclear-directed human pancreatic ribonuclease (PE5)
targets the metabolic phenotype of cancer cells. Oncotarget.
7:18309–18324. 2016. View Article : Google Scholar : PubMed/NCBI
|
|
35
|
Bolstad BM, Irizarry RA, Astrand M and
Speed TP: A comparison of normalization methods for high density
oligonucleotide array data based on variance and bias.
Bioinformatics. 19:185–193. 2003. View Article : Google Scholar : PubMed/NCBI
|
|
36
|
Gentleman R, Carey V, Bates D, Bolstad B,
Dettling M, Dudoit S, Ellis B, Gautier L, Ge Y, Gentry J, et al:
Bioconductor: Open software development for computational biology
and bioinformatics. Genome Biol. 5:R802004. View Article : Google Scholar : PubMed/NCBI
|
|
37
|
Dudoit S, Gentleman RC and Quackenbush J:
Open source software for the analysis of microarray data.
Biotechniques. 34:496–501. 2003. View Article : Google Scholar : PubMed/NCBI
|
|
38
|
Edgar R, Domrachev M and Lash AE: Gene
Expression Omnibus: NCBI gene expression and hybridization array
data repository. Nucleic Acids Res. 30:207–210. 2002. View Article : Google Scholar : PubMed/NCBI
|
|
39
|
Ashburner M, Ball CA, Blake JA, Botstein
D, Butler H, Cherry JM, Davis AP, Dolinski K, Dwight SS, Eppig JT,
et al: Gene ontology: Tool for the unification of biology. The Gene
Ontology Consortium. Nat Genet. 25:25–29. 2000. View Article : Google Scholar : PubMed/NCBI
|
|
40
|
The Gene Ontology Consortium, . The Gene
Ontology Resource: 20 years and still GOing strong. Nucleic Acids
Res. 47:D330–D338. 2019. View Article : Google Scholar : PubMed/NCBI
|
|
41
|
Kanehisa M: KEGG: Kyoto encyclopedia of
genes and genomes. Nucleic Acids Res. 28:27–30. 2000. View Article : Google Scholar : PubMed/NCBI
|
|
42
|
Dennis G Jr, Sherman BT, Hosack DA, Yang
J, Gao W, Lane HC and Lempicki RA: DAVID: Database for annotation,
visualization, and integrated discovery. Genome Biol. 4:R602003.
View Article : Google Scholar
|
|
43
|
Warde-Farley D, Donaldson SL, Comes O,
Zuberi K, Badrawi R, Chao P, Franz M, Grouios C, Kazi F, Lopes CT,
et al: The GeneMANIA prediction server: Biological network
integration for gene prioritization and predicting gene function.
Nucleic Acids Res. 38((Web Server issue)): W214–W220. 2010.
View Article : Google Scholar : PubMed/NCBI
|
|
44
|
Balendiran GK, Martin HJ, El-Hawari Y and
Maser E: Cancer biomarker AKR1B10 and carbonyl metabolism. Chem
Biol Interact. 178:134–137. 2009. View Article : Google Scholar : PubMed/NCBI
|
|
45
|
Thuren T: Hepatic lipase and HDL
metabolism. Curr Opin Lipidol. 11:277–283. 2000. View Article : Google Scholar : PubMed/NCBI
|
|
46
|
Takashima S, Tsuji S and Tsujimoto M:
Characterization of the second type of human beta-galactoside alpha
2,6-sialyltransferase (ST6Gal II), which sialylates Galβ1,4GlcNAc
structures on oligosaccharides preferentially: Genomic analysis of
human sialyltransferase genes. J Biol Chem. 277:45719–45728. 2002.
View Article : Google Scholar : PubMed/NCBI
|
|
47
|
Jez JM, Flynn TG and Penning TM: A
nomenclature system for the aldo-keto reductase superfamily. Adv
Exp Med Biol. 414:579–589. 1997. View Article : Google Scholar : PubMed/NCBI
|
|
48
|
Barski OA, Tipparaju SM and Bhatnagar A:
The aldo-keto reductase superfamily and its role in drug metabolism
and detoxification. Drug Metab Rev. 40:553–624. 2008. View Article : Google Scholar : PubMed/NCBI
|
|
49
|
Mindnich RD and Penning TM: Aldo-keto
reductase (AKR) superfamily: Genomics and annotation. Hum Genomics.
3:362–370. 2009. View Article : Google Scholar : PubMed/NCBI
|
|
50
|
Fukumoto SI, Yamauchi N, Moriguchi H,
Hippo Y, Watanabe A, Shibahara J, Taniguchi H, Ishikawa S, Ito H,
Yamamoto S, et al: Overexpression of the aldo-keto reductase family
protein AKR1B10 is highly correlated with smokers' non-small cell
lung carcinomas. Clin Cancer Res. 11:1776–1785. 2005. View Article : Google Scholar : PubMed/NCBI
|
|
51
|
Cao D, Fan ST and Chung SSM:
Identification and characterization of a novel human aldose
reductase- like gene. J Biol Chem. 273:11429–11435. 1998.
View Article : Google Scholar : PubMed/NCBI
|
|
52
|
Distefano JK and Davis B: Diagnostic and
prognostic potential of akr1b10 in human hepatocellular carcinoma.
Cancers (Basel). 11:4862019. View Article : Google Scholar : PubMed/NCBI
|
|
53
|
Chung YT, Matkowskyj KA, Li H, Bai H,
Zhang W, Tsao MS, Liao J and Yang GY: Overexpression and oncogenic
function of aldo-keto reductase family 1B10 (AKR1B10) in pancreatic
carcinoma. Mod Pathol. 25:758–766. 2012. View Article : Google Scholar : PubMed/NCBI
|
|
54
|
Fang CY, Lin YH and Chen CL:
Overexpression of AKR1B10 predicts tumor recurrence and short
survival in oral squamous cell carcinoma patients. J Oral Pathol
Med. 48:712–719. 2019. View Article : Google Scholar : PubMed/NCBI
|
|
55
|
Huang P, Chandra V and Rastinejad F:
Retinoic acid actions through mammalian nuclear receptors. Chem
Rev. 114:233–254. 2014. View Article : Google Scholar : PubMed/NCBI
|
|
56
|
Huang L, He R, Luo W, Zhu YS, Li J, Tan T,
Zhang X, Hu Z and Luo D: Aldo-Keto reductase family 1 member B10
inhibitors: Potential drugs for cancer treatment. Recent Pat
Anticancer Drug Discov. 11:184–196. 2016. View Article : Google Scholar : PubMed/NCBI
|
|
57
|
Ruiz FX, Porté S, Parés X and Farrés J:
Biological role of aldo-keto reductases in retinoic acid
biosynthesis and signaling. Front Pharmacol. 3:582012. View Article : Google Scholar : PubMed/NCBI
|
|
58
|
Wang C, Yan R, Luo D, Watabe K, Liao DF
and Cao D: Aldo-keto reductase family 1 member B10 promotes cell
survival by regulating lipid synthesis and eliminating carbonyls. J
Biol Chem. 284:26742–26748. 2009. View Article : Google Scholar : PubMed/NCBI
|
|
59
|
Shen Y, Zhong L, Johnson S and Cao D:
Human aldo-keto reductases 1B1 and 1B10: A comparative study on
their enzyme activity toward electrophilic carbonyl compounds. Chem
Biol Interact. 191:192–198. 2011. View Article : Google Scholar : PubMed/NCBI
|
|
60
|
Matsunaga T, Suzuki A, Kezuka C, Okumura
N, Iguchi K, Inoue I, Soda M, Endo S, El-Kabbani O, Hara A and
Ikari A: Aldo-keto reductase 1B10 promotes development of cisplatin
resistance in gastrointestinal cancer cells through down-regulating
peroxisome proliferator-activated receptor-γ-dependent mechanism.
Chem Biol Interact. 256:142–153. 2016. View Article : Google Scholar : PubMed/NCBI
|
|
61
|
Matsunaga T, Yamane Y, Iida K, Endo S,
Banno Y, El-Kabbani O and Hara A: Involvement of the aldo-keto
reductase, AKR1B10, in mitomycin-c resistance through reactive
oxygen species-dependent mechanisms. Anticancer Drugs. 22:402–408.
2011. View Article : Google Scholar : PubMed/NCBI
|
|
62
|
Zhong L, Shen H, Huang C, Jing H and Cao
D: AKR1B10 induces cell resistance to daunorubicin and idarubicin
by reducing C13 ketonic group. Toxicol Appl Pharmacol. 255:40–47.
2011. View Article : Google Scholar : PubMed/NCBI
|
|
63
|
Mundt F, Johansson HJ, Forshed J, Arslan
S, Metintas M, Dobra K, Lehtiö J and Hjerpe A: Proteome screening
of pleural effusions identifies galectin 1 as a diagnostic
biomarker and highlights several prognostic biomarkers for
malignant mesothelioma. Mol Cell Proteomics. 13:701–715. 2014.
View Article : Google Scholar : PubMed/NCBI
|
|
64
|
Usami N, Fukui T, Kondo M, Taniguchi T,
Yokoyama T, Mori S, Yokoi K, Horio Y, Shimokata K, Sekido Y and
Hida T: Establishment and characterization of four malignant
pleural mesothelioma cell lines from Japanese patients. Cancer Sci.
97:387–394. 2006. View Article : Google Scholar : PubMed/NCBI
|
|
65
|
Suzuki Y, Murakami H, Kawaguchi K,
Tanigushi T, Fujii M, Shinjo K, Kondo Y, Osada H, Shimokata K,
Horio Y, et al: Activation of the PI3K-AKT pathway in human
malignant mesothelioma cells. Mol Med Rep. 2:181–188.
2009.PubMed/NCBI
|
|
66
|
Endo S, Xia S, Suyama M, Morikawa Y, Oguri
H, Hu D, Ao Y, Takahara S, Horino Y, Hayakawa Y, et al: Synthesis
of potent and selective inhibitors of Aldo-Keto reductase 1B10 and
their efficacy against proliferation, metastasis, and cisplatin
resistance of lung cancer cells. J Med Chem. 60:8441–8455. 2017.
View Article : Google Scholar : PubMed/NCBI
|
|
67
|
Plebuch M, Soldan M, Hungerer C, Koch L
and Maser E: Increased resistance of tumor cells to daunorubicin
after transfection of cDNAs coding for anthracycline inactivating
enzymes. Cancer Lett. 255:49–56. 2007. View Article : Google Scholar : PubMed/NCBI
|
|
68
|
Shiiba M, Yamagami H, Yamamoto A, Minakawa
Y, Okamoto A, Kasamatsu A, Sakamoto Y, Uzawa K, Takiguchi Y and
Tanzawa H: Mefenamic acid enhances anticancer drug sensitivity via
inhibition of aldo-keto reductase 1C enzyme activity. Oncol Rep.
37:2025–2032. 2017. View Article : Google Scholar : PubMed/NCBI
|
|
69
|
Vasiliou V, Vasiliou K and Nebert DW:
Human ATP-binding cassette (ABC) transporter family. Hum Genomics.
3:281–290. 2009. View Article : Google Scholar : PubMed/NCBI
|
|
70
|
Pasello M, Giudice AM and Scotlandi K: The
ABC subfamily A transporters: Multifaceted players with incipient
potentialities in cancer. Semin Cancer Biol. 60:57–71. 2020.
View Article : Google Scholar : PubMed/NCBI
|
|
71
|
Iwasaki H, Okabe T, Takara K, Yoshida Y,
Hanashiro K and Oku H: Down-regulation of lipids transporter ABCA1
increases the cytotoxicity of nitidine. Cancer Chemother Pharmacol.
66:953–959. 2010. View Article : Google Scholar : PubMed/NCBI
|
|
72
|
Hudson AL, Weir C, Moon E, Harvie R, Klebe
S, Clarke SJ, Pavlakis N and Howell VM: Establishing a panel of
chemo-resistant mesothelioma models for investigating
chemo-resistance and identifying new treatments for mesothelioma.
Sci Rep. 4:61522014. View Article : Google Scholar : PubMed/NCBI
|
|
73
|
Milosevic V, Kopecka J, Salaroglio IC,
Libener R, Napoli F, Izzo S, Orecchia S, Ananthanarayanan P,
Bironzo P, Grosso F, et al: Wnt/IL-1β/IL-8 autocrine circuitries
control chemoresistance in mesothelioma initiating cells by
inducing ABCB5. Int J Cancer. 146:192–207. 2020. View Article : Google Scholar : PubMed/NCBI
|