Introduction
Wilms' tumor (WT) is the most common renal
malignancy in children, ranking second among all primary abdominal
malignancies in European children and fifth among all childhood
malignancies in terms of incidence; notably, it accounts for 95% of
pediatric renal tumors (1,2). According to statistics, WT accounts
for 8–10% of all pediatric tumors worldwide (3). Although a comprehensive treatment
approach has been developed for WT and refined for patients with an
overall good prognosis, the prognosis is poor for patients with
tumors that develop embryonic phenotypes after preoperative
chemotherapy, and 13% of patients with WT relapse within 2 years of
diagnosis (1,4). In addition, malignant metastasis can
occur in late-stage disease, and the mortality rate of WT is still
5% (5). Therefore, exploring the
molecular mechanism underlying WT cell proliferation, metastasis
and invasion to identify a method to intervene in tumor development
and improve the treatment approach is important.
T-cell factor (TCF) 3 is an important member of the
TCF/lymphoid enhancer-binding factor (LEF) family, which includes
TCF1, TCF3, TCF4 and LEF1 (6,7). It
was previously reported that loss of the TCF3 gene could lead to
the death of early embryos (8).
Furthermore, TCF3 is expressed in some poorly differentiated
malignant tumors (9); however, the
role and mechanism of TCF3 in malignant tumors have been less well
studied. Kehl et al (10)
demonstrated that TCF3 is a potential master regulator in blastemal
WT, and that TCF3 and other regulators serve a central role in
drug-resistant chemotherapeutic blastemal WT. The Wnt/β-catenin
signaling pathway is a highly conserved key signaling pathway in
mammalian cells, which is closely related to the occurrence and
development of renal carcinoma (11,12).
TCF3 is one of the effector molecules of the classical Wnt
signaling pathway (13), which
regulates cell proliferation and activation, and is closely related
to tumor occurrence and development (14). Previous studies have shown that TCF3
plays an important role in the development of human tumors, such as
renal carcinoma (15), embryonal
carcinoma (9) and breast cancer
(16). However, few studies have
examined the role and mechanism of TCF3 in WT, and the relationship
between the Wnt signaling pathway and WT is not clear.
The present study preliminarily measured TCF3
expression in WT, and then silenced TCF3 expression in G401 kidney
tumor cells in vitro via small interfering RNA
(siRNA)-mediated knockdown. Subsequently, the present study
assessed the effect of TCF3 knockdown on the viability, apoptosis,
migration and invasion of G401 cells in vitro, and
investigated the possible molecular mechanisms. Furthermore, to
illuminate its regulatory mechanism in kidney tumor cells in
vitro, TCF3 in the regulation of the Wnt pathway was studied.
The aim of the present study was to provide a theoretical basis for
development of a drug targeting TCF3 for WT.
Materials and methods
WT samples
WT tissues (n=10) and adjacent tissues (n=10) were
obtained from five girls and five boys (age range, 1–8 years) with
resection surgery between June 2018 and September 2020 from Kunming
Children's Hospital (Kunming, China). The mean distance between WT
and adjacent tissue was ~2 cm. Written informed consent for the use
of tissue samples in the present study was obtained from the
parents/guardians of the patients. The present study was approved
by the Medical Ethics Committee of Kunming Children's Hospital
(approval no. 2020-03-105-K01). None of the patients received any
medication, radiotherapy or chemotherapy before the operation. The
tissue samples were quickly separated from the surgical specimen,
rinsed with sterile saline and fixed with 4% paraformaldehyde (cat.
no. P1110; Beijing Solarbio Science & Technology Co., Ltd.) for
48 h at room temperature. Unfixed tissue samples were frozen in
liquid nitrogen in a cryopreservation tube and then stored in a
−80°C freezer for reverse transcription-quantitative (RT-q)PCR and
western blotting.
Hematoxylin & eosin (HE)
staining
The WT and adjacent tissue samples were dehydrated,
embedded in paraffin, sliced (5 µm), dewaxed with xylene, washed
with a series of ethanol solutions and rinsed with 1X
phosphate-buffered saline (PBS). For HE staining (cat. no. G1120;
Beijing Solarbio Science & Technology Co., Ltd.), the tissue
sections were stained with hematoxylin solution for 10 min at room
temperature, washed with running water, differentiated with 0.5%
hydrochloric acid ethanol solution for 3–10 sec, stained with eosin
solution for 2 min, and then sealed after dehydration and clearing.
Sections were observed under a light microscope (Nikon
Corporation).
Immunohistochemistry (IHC)
The sections (5 µm) were fixed, paraffin embedded,
dewaxed and washed as aforementioned and subjected to antigen
retrieval with 0.01 M citric acid buffer (pH 6.0) for 15 min at
100°C and 80 kPa, then cooled at room temperature. Subsequently,
the cells were blocked with 5% goat serum (cat. no. SL038; Beijing
Solarbio Science & Technology Co., Ltd.) for 15 min at room
temperature. The sections were incubated with anti-TCF3 antibody
(1:100 dilution; cat. no. 67140-1-Ig; Wuhan Sanying Biotechnology)
at 4°C overnight. The slices were washed with PBS-0.05% Tween-20
(PBST) and incubated with horseradish peroxidase (HRP)-conjugated
goat anti-mouse antibody (1:200 dilution; cat. no. SA00001-1; Wuhan
Sanying Biotechnology) for 2 h at room temperature. Staining of the
sections was detected using an Elivision™ super HRP IHC kit (cat.
no. KIT-9922; MXB Biotechnologies) and the sections were observed
under a light microscope (Nikon Corporation). The mean optical
density (MOD) of each section was measured using ImageJ2 software
(National Institutes of Health).
Cell culture and cell
transfection
The G401 kidney tumor cell line was purchased from
the Cell Bank of Kunming, Type Culture Collection of The Chinese
Academy of Sciences. Cells were authenticated using STR profiling.
The cells were cultured in McCoy's 5A (modified) medium (cat. no.
16600082; Gibco; Thermo Fisher Scientific, Inc.) containing 10% FBS
(cat. no. S9020; Beijing Solarbio Science & Technology Co.,
Ltd.) at 37°C in a 5% CO2 cell incubator. The G401 cells
were seeded into a 6-well plate at 3×10⁵ cells/well.
When the cells were well adhered and had reached ~70% confluence,
they were transfected with 30 pmol TCF3 siRNA
(5′-AAGCAACAAAACATACACT-3′) or negative control (NC) siRNA
(5′-TTCTCCGAACGTGTCACGT-3′) synthesized by the Invitrogen company
using Lipofectamine® 2000 (cat. no. 11668019;
Invitrogen; Thermo Fisher Scientific, Inc.) according to the
manufacturer's instructions. The cells were divided into three
groups for subsequent experiments: The control group, which did not
undergo transfection and the cells grew normally; the NC group,
which was transfected with NC siRNA; and the TCF3 siRNA group,
which was transfected with TCF3 siRNA. After transfection for 48 h,
the cells were collected for subsequent experiments.
RT-qPCR
Total RNA was extracted from tissues and from cells
48 h post-transfection using an RNA Simple kit (Tiangen Biotech,
Co., Ltd.), and the RNA concentration and purity were determined
using a micro nucleic acid quantitative analyzer. Subsequently, RNA
was reverse transcribed into cDNA using the PrimeScript RT Reagent
kit (cat. no. RR036Q; Takara Biotechnology Co., Ltd.) according to
the manufacturer's instructions, and cDNA was amplified via qPCR
using TB Green Premix Ex Taq II (cat. no. RR420A; Takara
Biotechnology Co., Ltd.) as follows: 95°C for 5 min; followed by 40
cycles of 95°C for 15 sec and 60°C for 60 sec. The primers were
synthesized by Shanghai Sangon Biotech Co., Ltd., and the sequences
were as follows: TCF3, forward 5′-AGGAGAAGGAGGACGAGGAG-3′ and
reverse, 5′-AAAGGCCTCGTTGATGTCAC-3′; Wnt1 forward,
5′-CGGCGTTTATCTTCGCTATC-3′ and reverse, 5′-GCCTCGTTGTGAAGGTT-3′;
β-catenin forward, 5′-GAAACGGCTTTCAGTTGAGC-3′ and reverse,
5′-CTGGCCATATCCACCAGAGT-3′; c-myc forward,
5′-AAAGGCCCCCAAGGTAGTTA-3′ and reverse, 5′-GCACAAGAGTTCCGTAGCTG-3′;
and β-actin forward, 5′-GCTCTTTTCCAGCCTTCCTT-3′ and reverse,
5′-GAGCCAGAGCAGTGATCTCC-3′. β-actin served as the internal control
for RT-qPCR. Relative expression levels were calculated using the
2−ΔΔCq method (17).
Western blotting
After transfection for 48 h, total protein was
extracted from tissue and cells using RIPA lysis buffer (cat. no.
P0013B; Beyotime Institute of Biotechnology), and the total protein
concentration was determined using a BCA kit (cat. no. P0012;
Beyotime Institute of Biotechnology). Each protein sample (30 µg)
was separated on a 10% gel using SDS-PAGE and then transferred onto
a PVDF membrane (cat. no. FFP36; Beyotime Institute of
Biotechnology). The membranes were blocked with 5% non-fat milk in
1X PBST (cat. no. P0216; Beyotime Institute of Biotechnology) for 2
h at 4°C and incubated with primary antibodies against TCF3
(1:1,000; cat. no. 67140-1-Ig), Wnt1 (1:2,000 dilution; cat. no.
27935-1-AP), β-catenin (1:1,000 dilution; cat. no. 51067-2-AP),
c-myc (1:1,000 dilution; cat. no. 10828-1-AP) and β-actin (1:1,000
dilution; cat. no. 66009-1-Ig) (all from Wuhan Sanying
Biotechnology) overnight at 4°C. After washing with 1X PBST (cat.
no. P1031; Beijing Solarbio Science & Technology Co., Ltd.),
the membranes were probed with goat anti-rabbit IgG-HRP secondary
antibodies (1:5,000 dilution; cat. no. SA00001-2) or goat
anti-mouse IgG-HRP secondary antibodies (1:5,000 dilution; cat. no.
SA00001-1) (both from Wuhan Sanying Biotechnology) for 1 h at room
temperature. Subsequently, protein bands were observed using an
enhanced chemiluminescence kit (cat. no. P0018S; Beyotime Institute
of Biotechnology) on a Bio-Rad Gel Imaging Analysis system (GelDoc
XR+ IMAGELAB; Bio-Rad Laboratories, Inc.). β-actin served as an
internal control. ImageJ 2× software was used to semi-quantify the
protein bands.
MTT assay
After transfection for 48 h, MTT solution (cat. no.
M1020; Beijing Solarbio Science & Technology Co., Ltd.) was
added to each well and cultured with the cells (5×10⁴)
for 4 h at 37°C. The culture solution was discarded and then 150 µl
DMSO was added to each well. The culture plate was placed on an
oscillator and shaken for 10 min at room temperature to fully
dissolve the purple crystals. The absorbance values of each well
were measured at 570 nm using a microplate reader (Bio-Rad
Laboratories, Inc.) and the cells optical density (OD) value was
recorded.
Flow cytometry
After transfection for 48 h, an Annexin
V-fluorescein isothiocyanate (FITC)/propidium iodide (PI) detection
kit (cat. no. C1062L; Beyotime Institute of Biotechnology) was used
to analyze cell apoptosis. After transfection, the cells
(1×10⁶) were harvested with 0.25% trypsin, incubated
with 10 µl Annexin V-FITC at 4°C for 30 min and then incubated with
5 µl PI solution for 15 min at 4°C in the dark. The stained cells
were detected using BD FACSCanto II flow cytometry (BD Biosciences)
with CellQuest software (version 5.1; BD Biosciences). Early
apoptotic cells were Annexin V-FITC-positive and PI-negative, and
late apoptotic cells were Annexin V-FITC-positive and PI-positive.
The cell apoptosis rate is presented as the percentage of cells in
the early and late apoptotic phases.
A cell cycle analysis kit (cat. no. C1052; Beyotime
Institute of Biotechnology) was used to analyze cell cycle
progression according to the manufacturer's instructions. After
transfection for 48 h, the cells (1×10⁶) were harvested
with 0.25% trypsin. Subsequently, the cells were fixed with 1 ml
precooled 70% ethanol at 4°C for 2 h. Subsequently, 0.5 ml PI
staining solution was added to each cell sample, and the cells were
incubated at 37°C for 30 min in the dark. Red fluorescence was
detected via BD FACSCanto II flow cytometry (BD Biosciences) with
CellQuest software (version 5.1; BD Biosciences) at an excitation
wavelength of 488 nm.
Cell invasion assay
The cell invasion assay was performed using
Transwell chambers (8 µm; cat. no. 3422; Corning, Inc.) coated with
Matrigel (cat. no. 356234; Corning, Inc.) at 37°C for 30 min.
Briefly, 300 µl of a 5×10⁵ cells/ml suspension (McCoy's
5A medium without FBS) was added into the upper chamber and 500 µl
medium (with 10% FBS) was added to the lower chamber. After
transfected for 48 h in the Transwell chambers, the invaded cells
were fixed in 90% alcohol at room temperature for 10 min, stained
with 0.1% crystal violet at room temperature for 30 min and
observed under a light microscope (Olympus Corporation).
Cell migration assay
Cell migration was detected using a cell
wound-healing assay. When cell confluence reached 90%, 1-ml sterile
pipette tips were used to draw a straight vertical line across each
plate. The plates were washed with PBS three times to remove the
suspended cells, and 2 ml medium with 10% FBS (cat. no. S9020;
Beijing Solarbio Science & Technology Co., Ltd.) was added.
Subsequently, images of the cells were captured and assessed under
a light microscope, and cells were then transfected with TCF3 siRNA
or NC siRNA. After transfection for 48 h, images of the cells were
captured and assessed under a light microscope, the migration
distance was measured using ImageJ (version 2) software, and the
migration ratio of the cells in each group was calculated.
Statistical analysis
Each experiment was repeated three times
independently. Data are expressed as the mean ± standard error of
the mean. Using GraphPad Prism 5.0 software (GraphPad Software
Inc.), differences between two groups were compared using Student's
t-test (paired), and differences among three or more groups were
compared using one-way ANOVA followed by Tukey's post hoc test.
P<0.05 was considered to indicate a statistically significant
difference.
Results
TCF3 expression in WT tissues and
adjacent tissues
To measure the expression levels of TCF3 in patients
with WT, WT and adjacent tissues were assessed via IHC, RT-qPCR and
western blotting. HE staining was used to detect histopathological
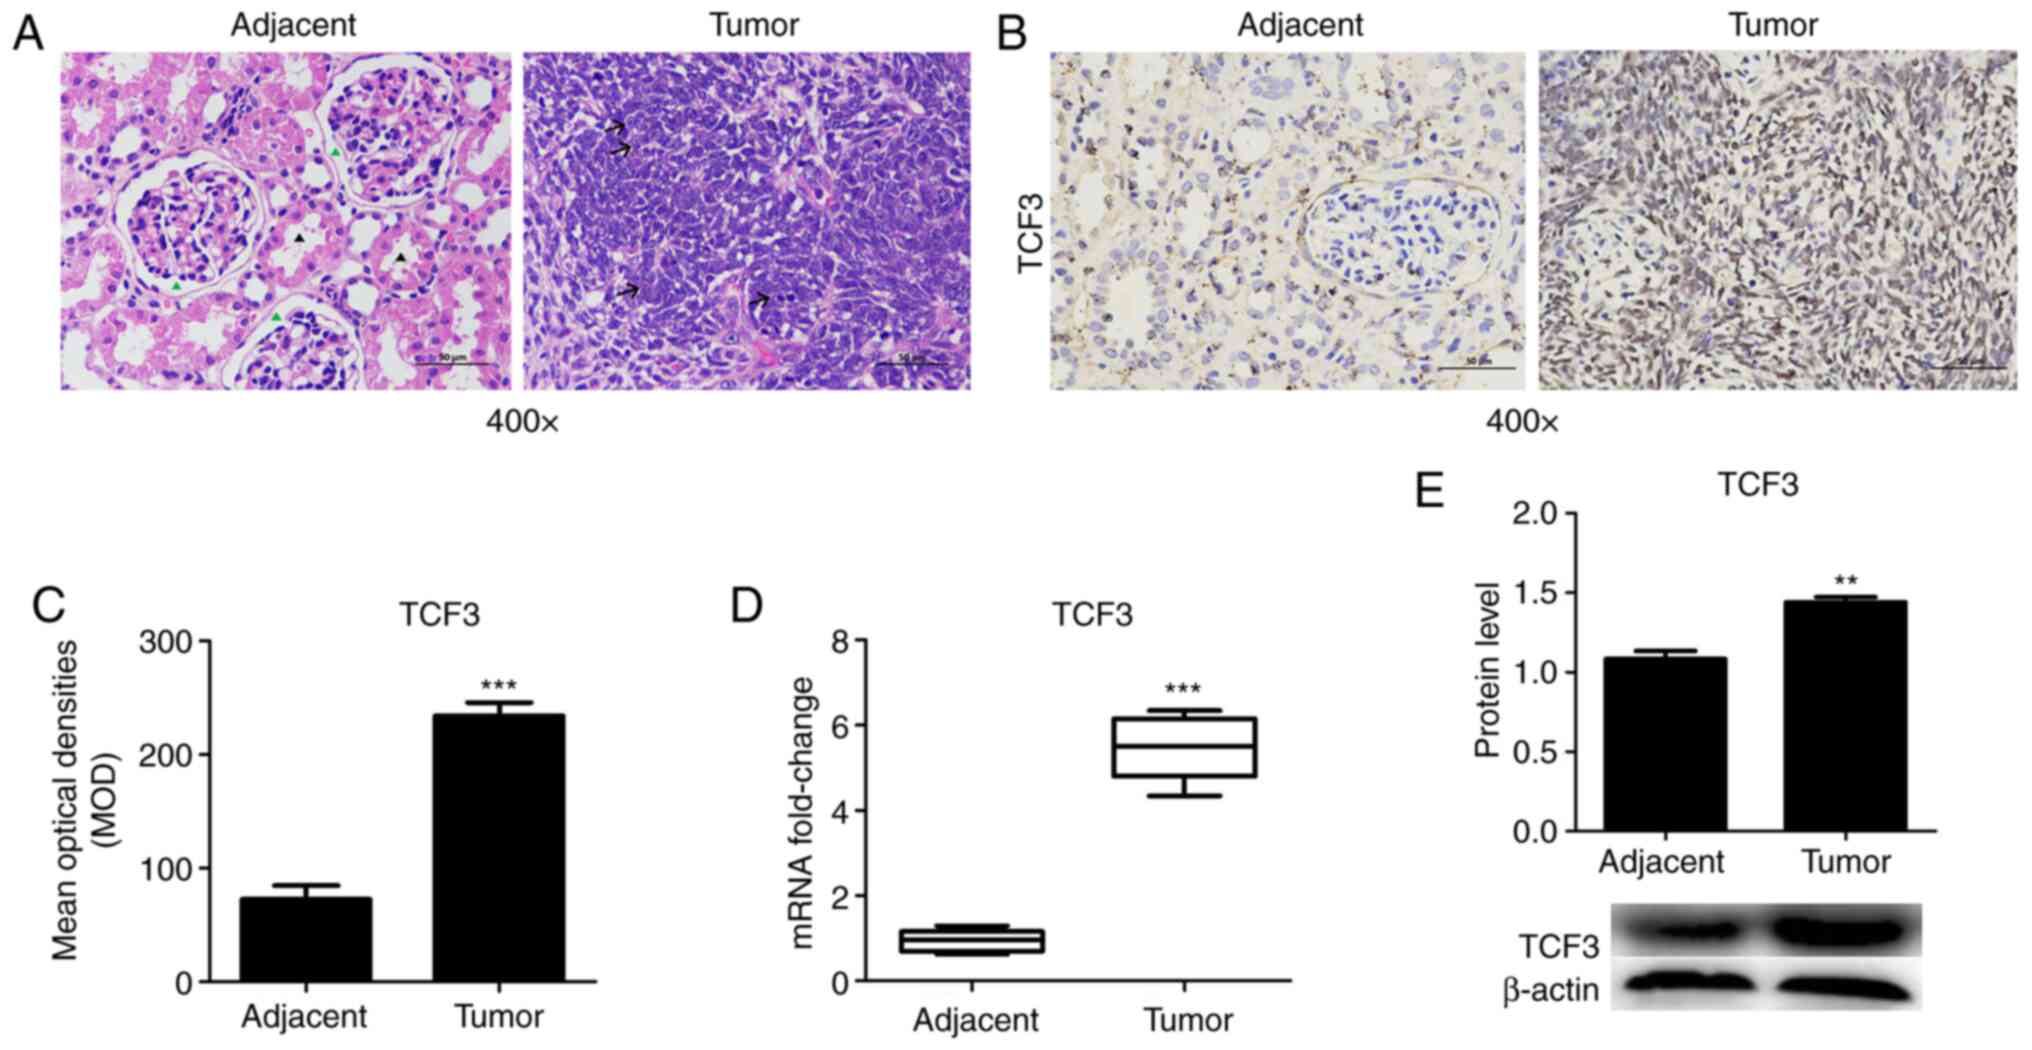
tissue morphology. The HE staining results revealed that the
glomerulus (green arrowhead) and kidney tubules (black arrowhead)
were intact in the adjacent tissue group, whereas the tumor cells
in the WT tissues were diffuse or patchy, cells appear short
fusiform or elliptical, partially deviated nucleoli and
pathological mitoses (arrow; Fig.
1A). TCF3 protein was mainly localized in the nuclei of the
kidney tumor cells (Fig. 1B). TCF3
protein expression was detected via IHC, and the results revealed
that TCF3 expression was much higher in WT tissues compared with
that in adjacent tissues (Fig. 1B).
The MOD of TCF3 expression was significantly increased in WT
tissues compared with that in adjacent tissues (Fig. 1C). Furthermore, RT-qPCR (Fig. 1D) and western blotting (Fig. 1E) revealed that the mRNA and protein
expression levels of TCF3 were significantly increased in WT
tissues compared with those in adjacent tissues. The results
demonstrated that changes in TCF3 were consistent at the protein
and mRNA levels (Fig. 1D and E).
These results suggested that patients with WT may exhibit high TCF3
expression.
Effect of TCF3 silencing on the
viability, cell cycle progression and apoptosis of G401 kidney
tumor cells
To investigate the effect of TCF3 silencing on G401
kidney tumor cell viability, cell cycle progression and apoptosis,
the cells were transfected with TCF3 siRNA or NC siRNA, RT-qPCR and
western blotting were performed to detect the transfection
efficiency and expression levels of TCF3, MTT assays were performed
to assess cell viability, and flow cytometry was performed to
assess cell cycle distribution and apoptosis. RT-qPCR (Fig. 2A) and western blotting (Fig. 2B and C) revealed that the mRNA and
protein expression levels of TCF3 were significantly decreased in
the TCF3 siRNA group compared with those in the control and NC
groups. As shown in Fig. 2D, the OD
value in the TCF3 siRNA group was lower than that in the control
and NC groups. The cell cycle analysis results showed an increase
in G2/M-phase cells, which was accompanied by a decrease
in G0/G1- and G2/M-phase cells, in
the TCF3 siRNA group compared with the control and NC groups
(Fig. 2B and C). The apoptosis
assay results revealed that the percentage of apoptotic cells was
higher in the TCF3 siRNA group than that in the control and NC
groups (Fig. 2D and E). These
results indicated that silencing TCF3 expression could inhibit the
viability and promote the apoptosis of G401 kidney tumor cells.
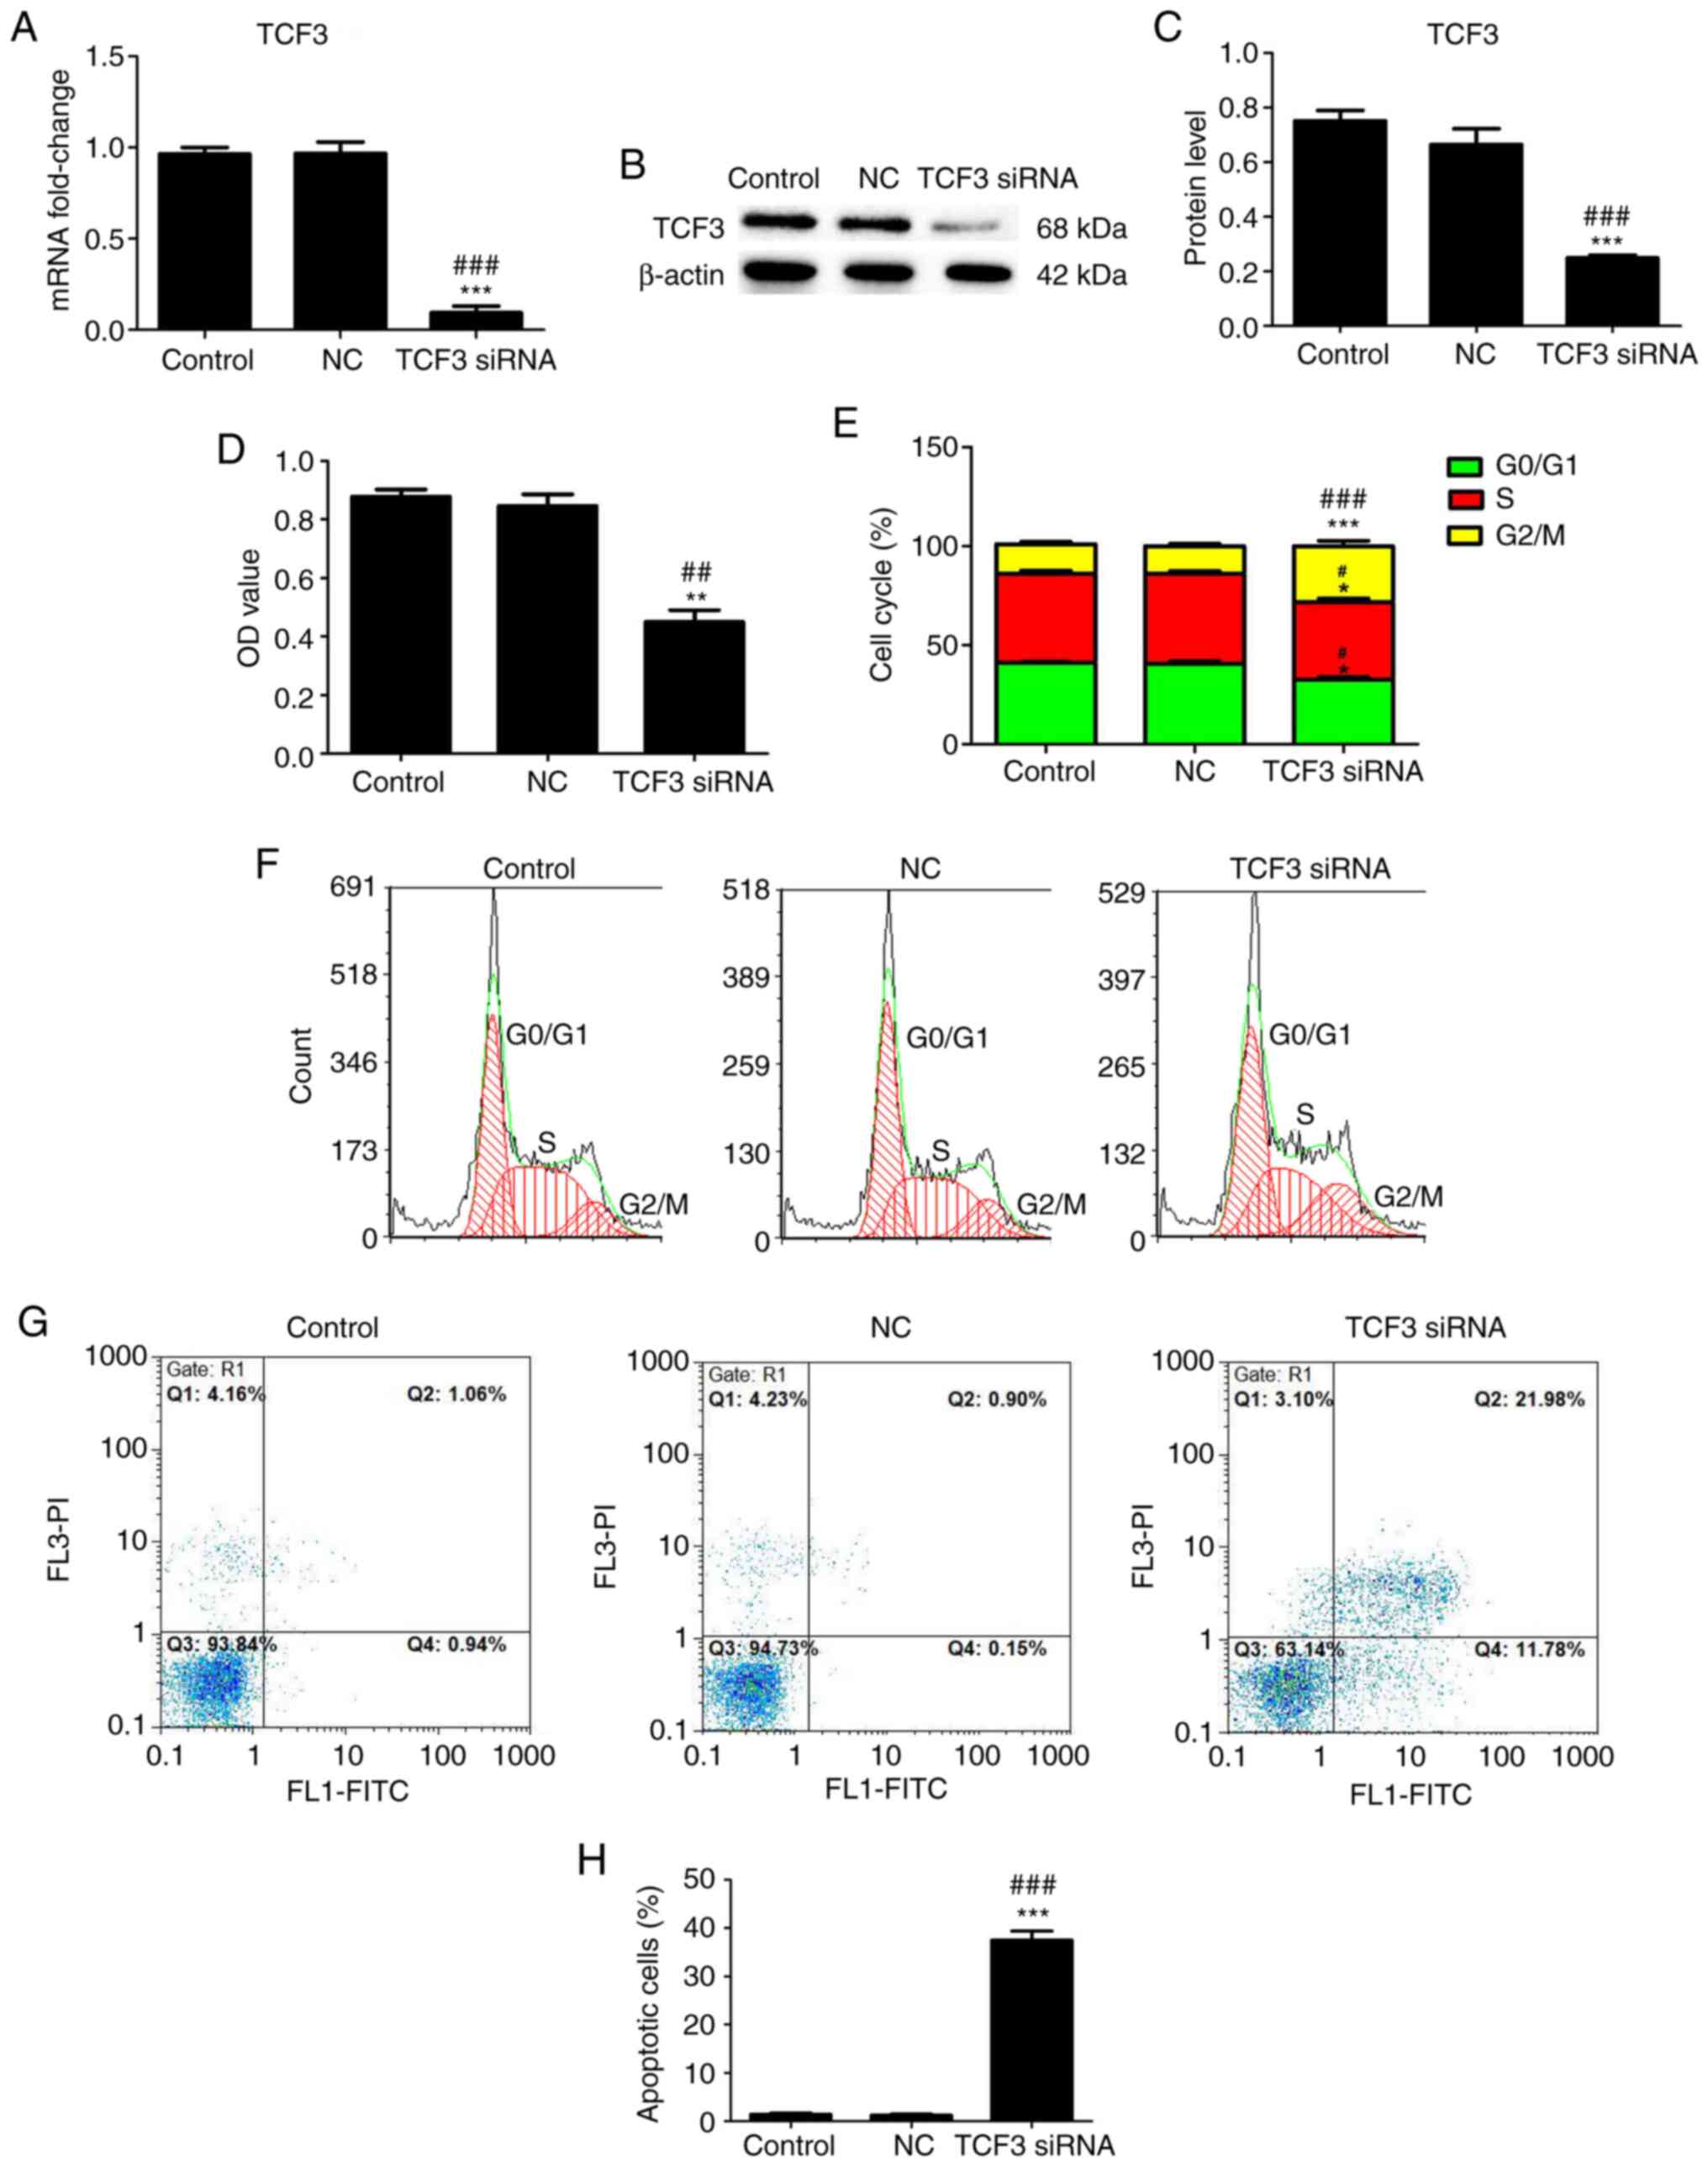 | Figure 2.Effect of TCF3 silencing on the
viability, cell cycle progression and apoptosis of G401 kidney
tumor cells. Reverse transcription-quantitative PCR (A) and western
blotting (B) were performed to detect the mRNA and protein
expression levels of TCF3 in all groups. (C) Semi-quantification of
western blotting was performed using ImageJ2 software. (D) MTT
assays were performed to detect viability. (E) Cell cycle
distribution was determined. The effect of TCF3 silencing on the
(F) cell cycle progression and (G) apoptosis of G401 kidney tumor
cells were examined via flow cytometry. (H) Percentage of apoptotic
cells was quantified. Control group, untransfected cells; NC group,
cells transfected with NC siRNA; TCF3 siRNA group, cells
transfected with TCF3 siRNA. All experiments were repeated at least
three times. Data are presented as the mean ± standard error of the
mean and were analyzed via one-way ANOVA with Tukey's post hoc
test. *P<0.05, **P<0.01 and ***P<0.001 compared with the
control group; #P<0.05, ##P<0.01 and
###P<0.001 compared with the NC group. FITC,
fluorescein isothiocyanate; NC, negative control; OD, optical
density; PI, propidium iodide; siRNA, small interfering RNA; TCF3,
T-cell factor 3. |
Effect of TCF3 silencing on the
migration and invasion of G401 kidney tumor cells
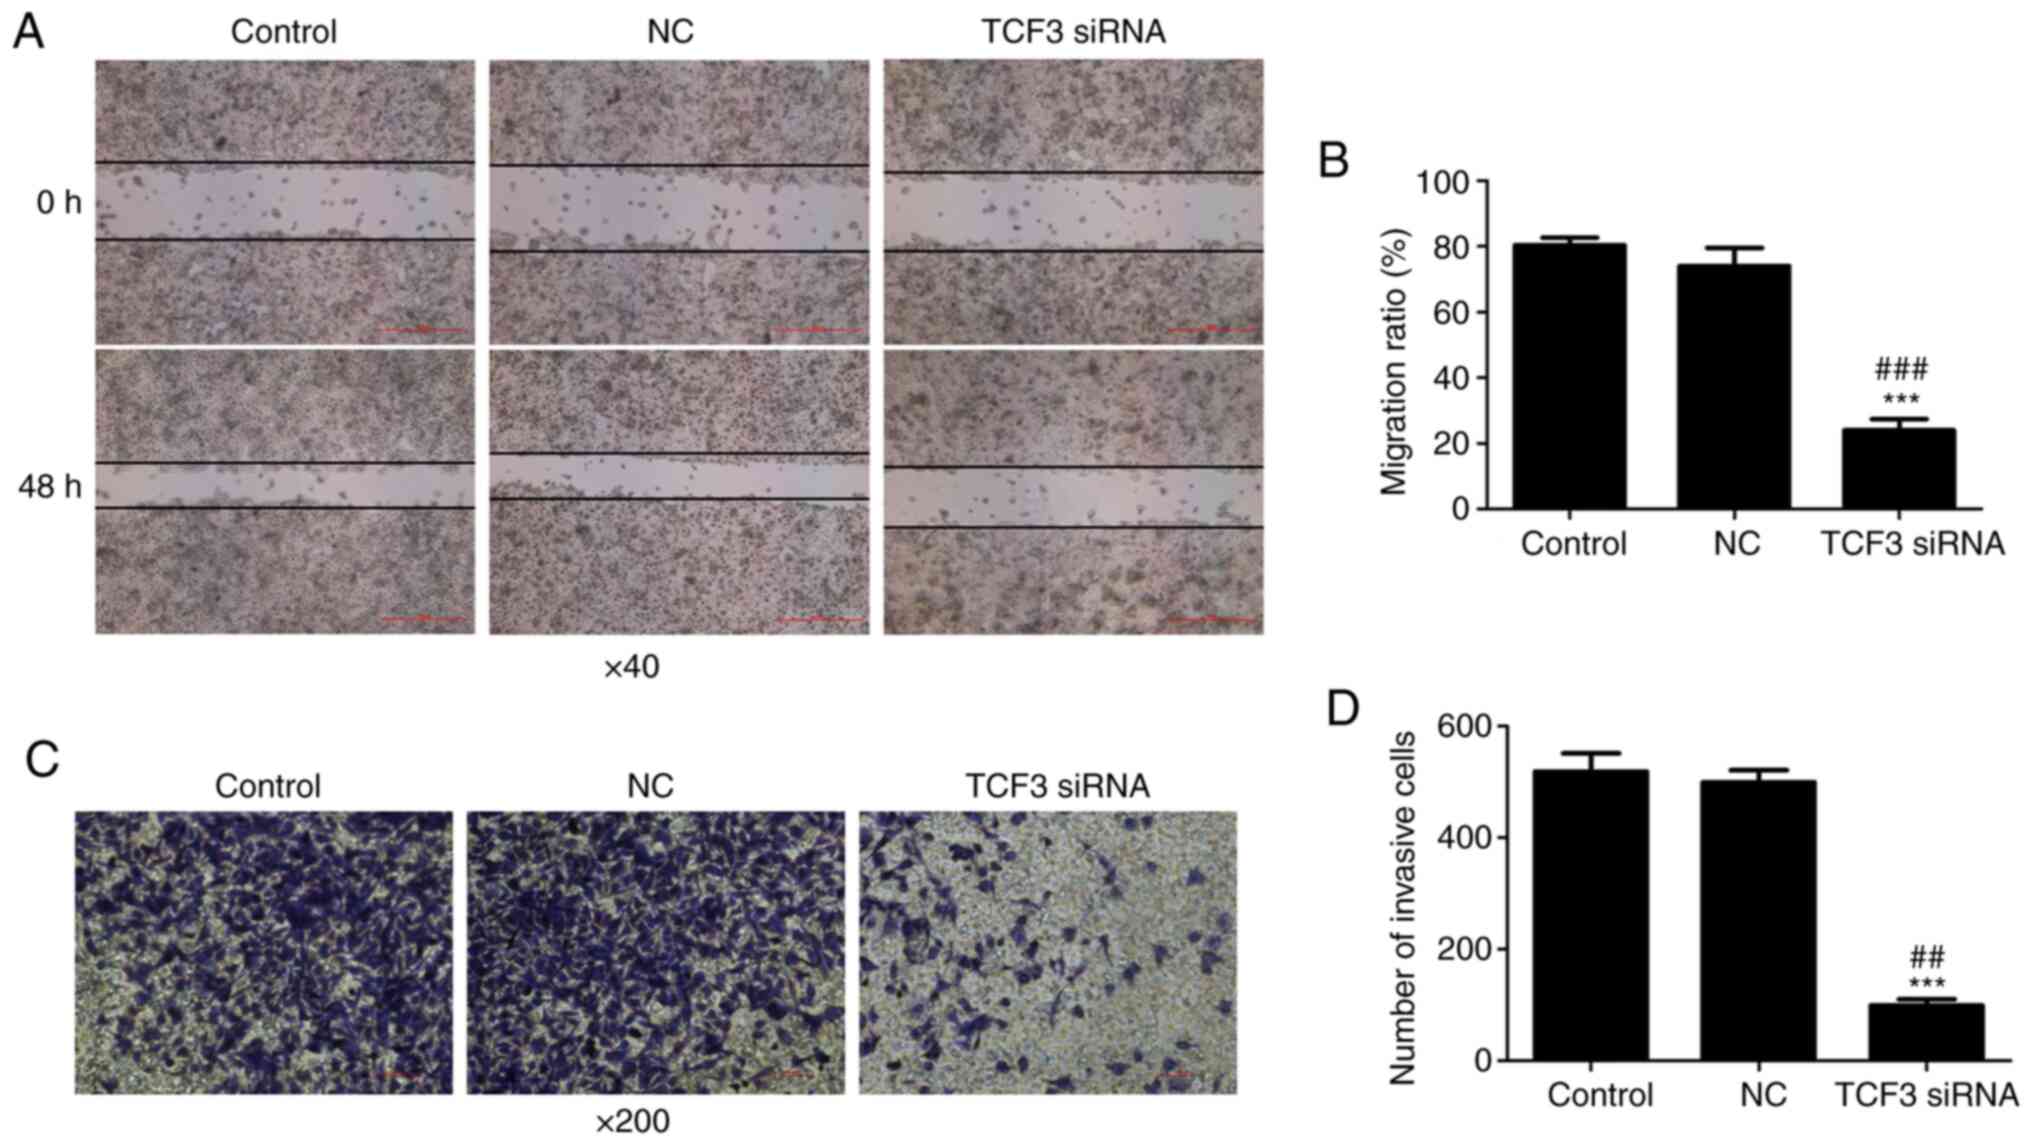
To investigate the effect of TCF3 silencing on the
migration and invasion of G401 kidney tumor cells, wound-healing
and Transwell assays were performed. The results of the
wound-healing assay demonstrated that the cell migration ratio was
decreased in the TCF3 siRNA group compared with that in the control
and NC groups (Fig. 3A and B). The
results of Transwell assays revealed that the number of invasive
cells in the TCF3 siRNA group was significantly lower than that in
the control and NC groups (Fig.
3C); quantification of cells stained with crystal violet is
shown in Fig. 3D. These results
suggested that TCF3 may promote the migration and invasion of G401
kidney tumor cells.
Effect of TCF3 silencing on the mRNA
and protein expression levels of Wnt pathway-related genes in G401
kidney tumor cells
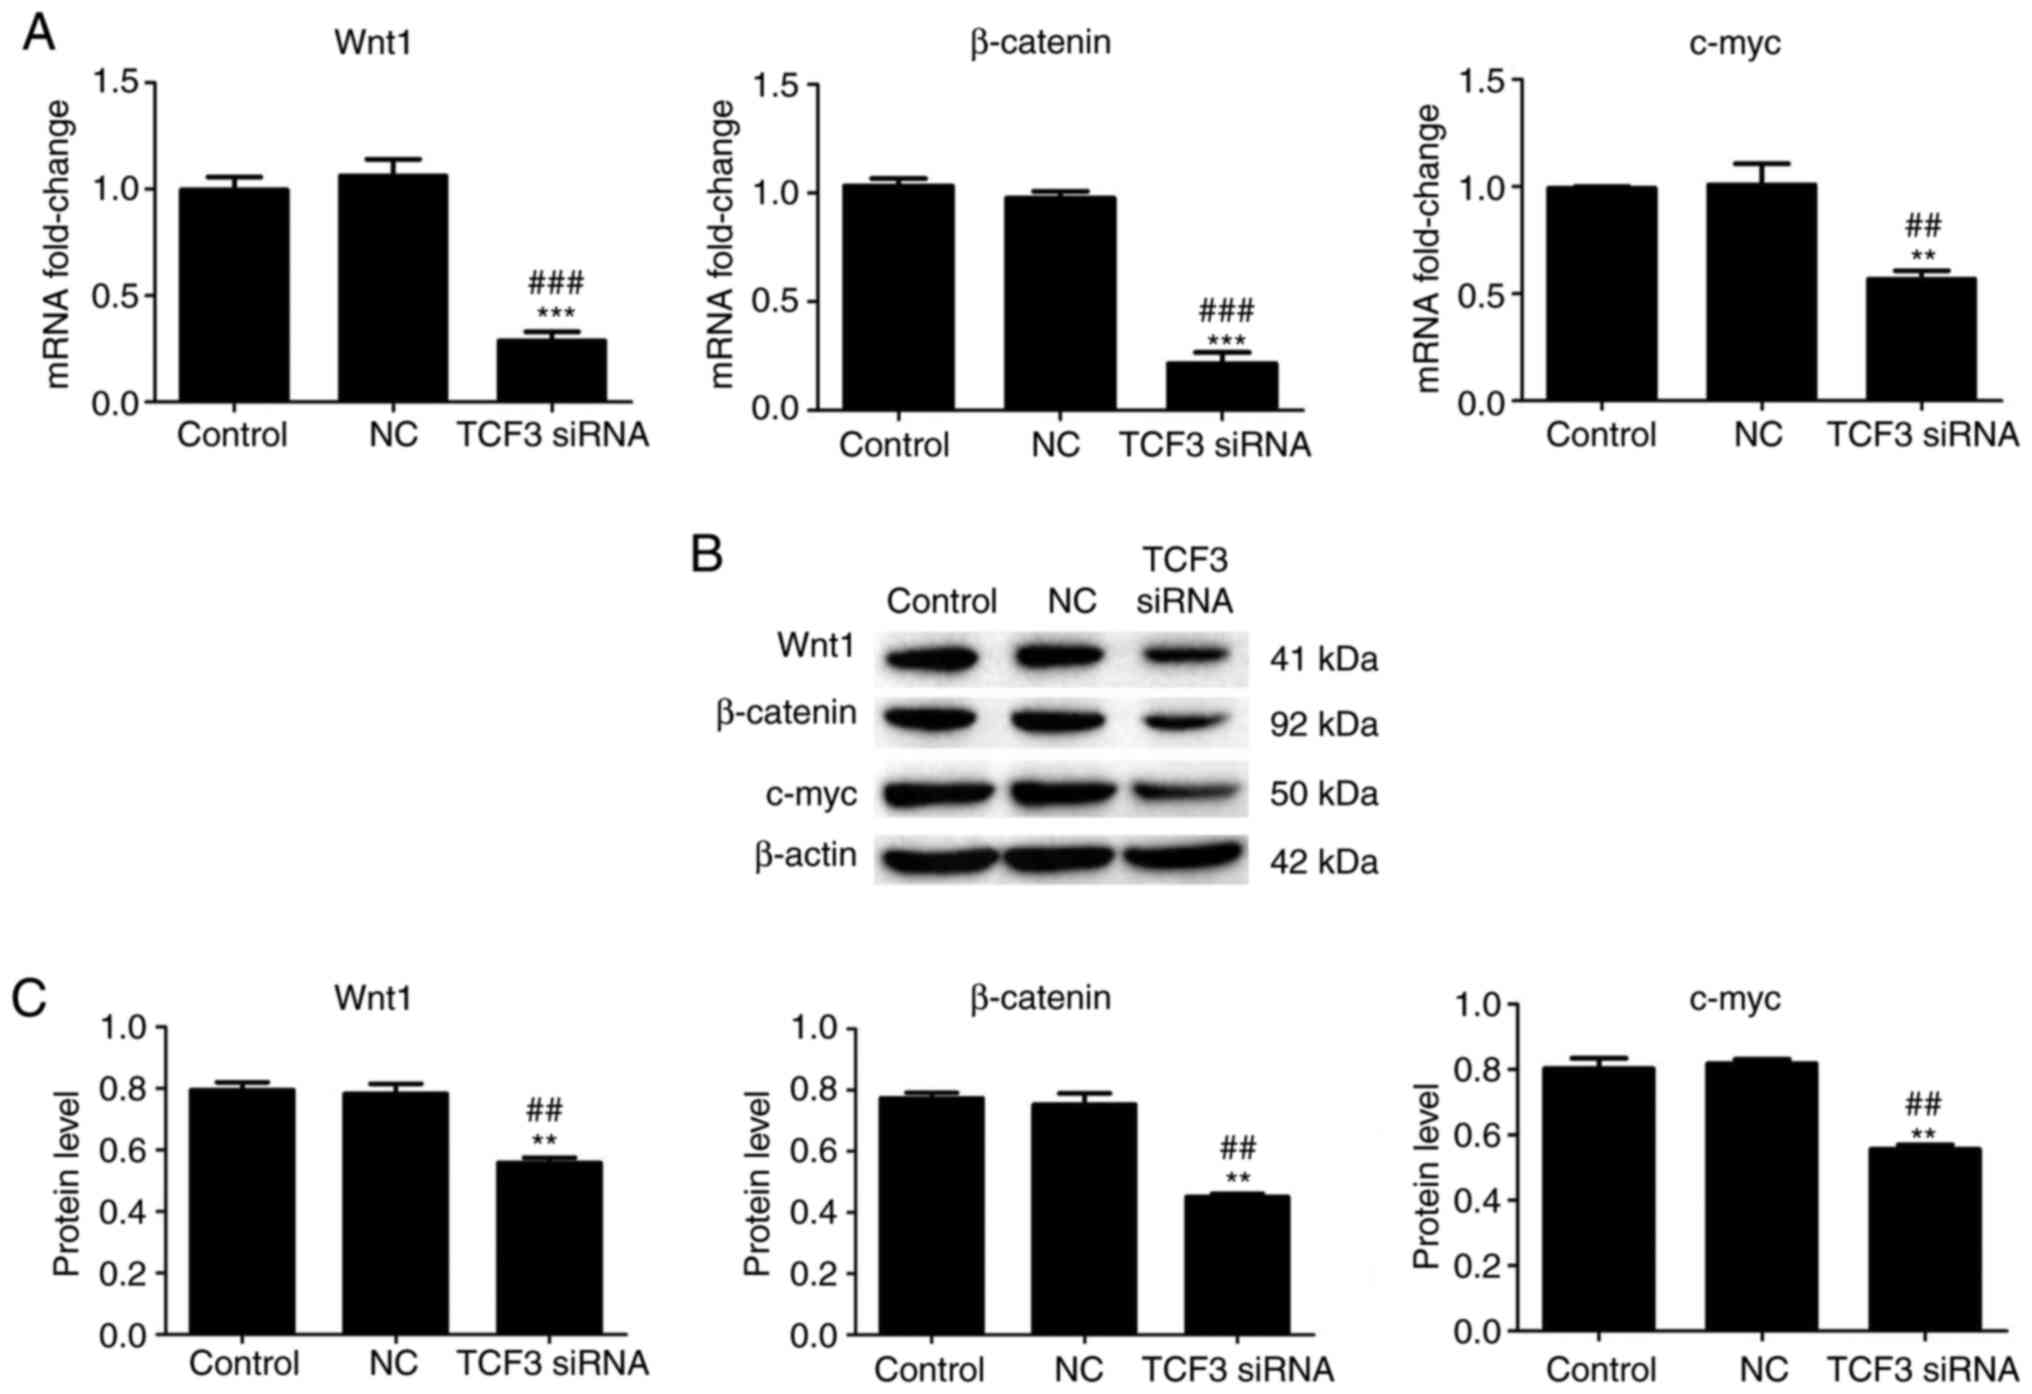
A previous study reported that Wnt pathway
activation is associated with TCF3 (18). Therefore, to further investigate the
effect of TCF3 silencing on genes involved in the Wnt signaling
pathway, the mRNA and protein expression levels of Wnt1, β-catenin
and c-myc in the Wnt signaling pathway were detected using RT-qPCR
and western blotting. The results of RT-qPCR demonstrated that the
mRNA expression levels of Wnt1, β-catenin and c-myc were
significantly lower in the TCF3 siRNA group compared with those in
the control and NC groups (Fig.
4A). The results of western blotting regarding changes in the
protein expression levels of Wnt1, β-catenin and c-myc were
consistent with the changes detected in the mRNA expression levels.
Compared with those in the control and NC groups, the protein
expression levels of Wnt1, β-catenin and c-myc were significantly
decreased in the TCF3 siRNA group (Fig.
4B and C). These results indicated that TCF3 silencing may
inactivate the Wnt signaling pathway in G401 kidney tumor
cells.
Discussion
In the present study, the expression of TCF3 in WT
tissue was higher than that in normal adjacent tissue, and the
results in vitro and in vivo suggested that high TCF3
expression may promote G401 cell viability and WT development. The
effects of TCF3 silencing on kidney tumor cell viability,
apoptosis, migration and invasion were investigated via MTT assay,
flow cytometry, and cell migration and invasion assays. The results
revealed that the viability, migration and invasion of G401 kidney
tumor cells were significantly decreased after TCF3 was silenced.
In addition, when TCF3 was silenced, the percentage of apoptotic
G401 cells was significantly increased, the proportion of
G0/G1 phase cells was decreased and the
proportion of G2/M phase cells was significantly
increased. These results indicated that TCF3 silencing may inhibit
G401 kidney tumor cell viability, migration and invasion, and
promote apoptosis.
TCF3 is a common transcription factor that regulates
tumor cell proliferation, migration and invasion (19). The present study revealed that TCF3
regulated the viability, migration and invasion of kidney tumor
cells. TCF3 is also one of the final effector molecules of the
highly conserved classical Wnt signaling pathway in mammalian
cells, which is closely related to tumor occurrence and development
(20). TCF3 has dual regulatory
functions: TCF3 binds to the Groucho/TLE family of transcription
inhibitors to inhibit gene transcription in the absence of Wnt
signaling (21,22); however, TCF3 binds to β-catenin to
promote gene transcription in the presence of Wnt signaling
(22). In addition, TCF3 has
different regulatory roles for different Wnt target genes (23). Overexpression of TCF3 has been
reported to stimulate division of human hair follicle bulge
epidermal progenitor cells; TCF3 detaches from the corresponding
gene promoter when the Wnt pathway is activated and target gene
transcription is activated to enhance the division activity of
pluripotent stem cells (18). The
present study revealed that TCF3 silencing inactivated the Wnt
pathway in kidney tumor cells. TCF3 has also been shown to promote
the ability of breast cancer cells to initiate the formation of
tumor tissue and maintain the growth of cancer cells (16). Conversely, the prognosis of patients
with colon cancer was reported to be worse in patients with low
TCF3 expression, and the absence of TCF3 was shown to cause colon
cancer cells to proliferate faster and metastasize more easily
(24). Thus, TCF3 serves an
important role during the course and development of cancer, and it
may have different roles in various tumor types. In the present
study, TCF3 was revealed to have a positive role in the development
of WT. Although TCF3 has been shown to be a potential master
regulator in blastemal WT, the effect of TCF3 expression on kidney
tumor cells was unclear in the present study, and exploring WT
pathogenesis and finding novel targets for diagnosis and treatment
is still of great significance (25).
The cell cycle-related gene c-myc is a target gene
of the Wnt signaling pathway (26,27).
The Wnt1/β-catenin signaling pathway is known to be related to
tumor development (28–30). Genes related to the Wnt signaling
pathway, such as Wnt1 and β-catenin, have an important role in
tumor cell proliferation, dedifferentiation and metastasis
(31,32). The present study hypothesized that
TCF3 might affect the viability of kidney tumor cells by regulating
the Wnt1/β-catenin signaling pathway and its target gene c-myc. To
investigate this hypothesis, the expression levels of TCF3, Wnt1,
β-catenin and c-myc were detected using RT-qPCR and western
blotting. The results revealed that in G401 kidney tumor cells,
TCF3 silencing significantly inhibited the mRNA and protein
expression levels of TCF3, Wnt1, β-catenin and c-myc. The
downregulation of Wnt signaling pathway-related genes after TCF3
knockdown in G401 cells suggested that TCF3 may serve a role in
transcriptional activation of Wnt signaling in kidney tumor cells.
One possible mechanism is that a large amount of dissociated
β-catenin enters the nucleus when the Wnt pathway is activated, at
which point TCF3 binds to β-catenin, forming a transcriptional
activator that regulates Wnt target genes (33). Thus, TCF3 silencing could inactivate
the Wnt pathway and inhibit the Wnt pathway target gene c-myc.
These results indicated that TCF3 silencing may inhibit the
malignant biological behavior of kidney tumor cells, and that TCF3
siRNA may suppress the viability of G401 cells by inhibiting the
expression of Wnt signaling pathway-related genes.
To the best of our knowledge, the present study is
the first to demonstrate the important role of TCF3 in the
biological function of kidney tumor cells in vitro. TCF3
silencing was shown to suppress the viability, migration and
invasion, and promote the apoptosis of G401 kidney tumor cells
in vitro by regulating the expression of Wnt
signaling-related genes at the cellular level. The present study
provided novel insight into the molecular mechanism underlying the
effects of TCF3 on kidney tumor cells and may indicate a path
towards a novel treatment for WT. In subsequent in-depth studies,
animal experiments should be conducted to confirm that TCF3
silencing can contribute to inhibition of kidney tumor development
in vivo.
Acknowledgements
Not applicable.
Funding
The present study was supported by the Kunming
Health Science and Technology Talent project [grant no. 2020-SW
(reserve)-115], the Health Research project of Kunming Health
Committee (grant no. 2020-06-02-001) and the Scientific Research
project of Yunnan Education Department (grant no. 2021J0286).
Availability of data and materials
The datasets used and/or analyzed during the current
study are available from the corresponding author on reasonable
request.
Authors' contributions
NZ and ZY conceived and designed the study. NZ, BY,
JM, HJ, LL, HT and FJ performed the experiments. NZ, JM and HJ
processed data. NZ and BY wrote the manuscript. NZ and ZY reviewed
and edited the manuscript. NZ and ZY confirm the authenticity of
all the raw data. All authors read and approved the final
manuscript.
Ethics approval and consent to
participate
All human tissue samples were collected by the
Kunming Children's Hospital and the present study was approved by
the Medical Ethics Committee of Kunming Children's Hospital
(approval no. 2020-03-105-K01). Written informed consent was
obtained from the parents/guardians of the patients.
Patient consent for publication
Not applicable.
Competing interests
The authors declare that they have no competing
interests.
References
|
1
|
Pastore G, Znaor A, Spreafico F, Graf N,
Pritchard-Jones K and Steliarova-Foucher E: Malignant renal tumours
incidence and survival in European children (1978–1997): Report
from the automated childhood cancer information system project. Eur
J Cancer. 42:2103–2114. 2006. View Article : Google Scholar : PubMed/NCBI
|
|
2
|
Davidoff AM: Wilms tumor. Adv Pediatr.
59:247–267. 2012. View Article : Google Scholar : PubMed/NCBI
|
|
3
|
Brok J, Lopez-Yurda M, Tinteren HV, Treger
TD, Furtwängler R, Graf N, Bergeron C, van den Heuvel-Eibrink MM,
Pritchard-Jones K, Olsen ØE, et al: Relapse of Wilms' tumour and
detection methods: A retrospective analysis of the 2001 Renal
Tumour Study Group-International Society of Paediatric Oncology
Wilms' tumour protocol database. Lancet Oncol. 19:1072–1081. 2018.
View Article : Google Scholar : PubMed/NCBI
|
|
4
|
Kaste SC, Dome JS, Babyn PS, Graf NM,
Grundy P, Godzinski J, Levitt GA and Jenkinson H: Wilms tumour:
Prognostic factors, staging, therapy and late effects. Pediatr
Radiol. 38:2–17. 2008. View Article : Google Scholar : PubMed/NCBI
|
|
5
|
Lee JS, Padilla B, DuBois SG, Oates A,
Boscardin J and Goldsby RE: Second malignant neoplasms among
children, adolescents and young adults with Wilms tumor. Pediatric
Blood Cancer. 62:1259–1264. 2015. View Article : Google Scholar : PubMed/NCBI
|
|
6
|
Travis A, Amsterdam A, Belanger C and
Grosschedl R: LEF-1, a gene encoding a lymphoid-specific protein
with an HMG domain, regulates T-cell receptor alpha enhancer
function [corrected]. Genes Dev. 5:880–894. 1991. View Article : Google Scholar : PubMed/NCBI
|
|
7
|
van de Wetering M, Oosterwegel M, Dooijes
D and Clevers H: Identification and cloning of TCF-1, a T
lymphocyte-specific transcription factor containing a
sequence-specific HMG box. EMBO J. 10:123–132. 1991. View Article : Google Scholar : PubMed/NCBI
|
|
8
|
Merrill BJ, Pasolli HA, Polak L, Rendl M,
García-García MJ, Anderson KV and Fuchs E: Tcf3: A transcriptional
regulator of axis induction in the early embryo. Development.
131:263–274. 2004. View Article : Google Scholar : PubMed/NCBI
|
|
9
|
Lin G, Zhao L, Yin F, Lan R, Li L, Zhang
X, Zhang H and Yang B: TCF3 inhibits F9 embryonal carcinoma growth
by the down-regulation of Oct4. Oncol Rep. 26:893–899.
2011.PubMed/NCBI
|
|
10
|
Kehl T, Schneider L, Kattler K, Stöckel D,
Wegert J, Gerstner N, Ludwig N, Distler U, Tenzer S, Gessler M, et
al: The role of TCF3 as potential master regulator in blastemal
Wilms tumors. Int J Cancer. 144:1432–1443. 2019. View Article : Google Scholar : PubMed/NCBI
|
|
11
|
Huang H and He X: Wnt/beta-catenin
signaling: New (and old) players and new insights. Curr Opin Cell
Biol. 20:119–125. 2008. View Article : Google Scholar : PubMed/NCBI
|
|
12
|
Major MB, Camp ND, Berndt JD, Yi X,
Goldenberg SJ, Hubbert C, Biechele TL, Gingras AC, Zheng N, Maccoss
MJ, et al: Wilms tumor suppressor WTX negatively regulates
WNT/beta-catenin signaling. Science. 316:1043–1046. 2007.
View Article : Google Scholar : PubMed/NCBI
|
|
13
|
Huelsken J and Behrens J: The Wnt
signalling pathway. J Cell Sci. 115((Pt 21)): 3977–3978. 2002.
View Article : Google Scholar : PubMed/NCBI
|
|
14
|
Moon RT, Kohn AD, De Ferrari GV and Kaykas
A: WNT and beta-catenin signalling: Diseases and therapies. Nat Rev
Genet. 5:691–701. 2004. View
Article : Google Scholar : PubMed/NCBI
|
|
15
|
Uematsu K, He B, You L, Xu Z, McCormick F
and Jablons DM: Activation of the Wnt pathway in non small cell
lung cancer: Evidence of dishevelled overexpression. Oncogene.
22:7218–7221. 2003. View Article : Google Scholar : PubMed/NCBI
|
|
16
|
Slyper M, Shahar A, Bar-Ziv A, Granit RZ,
Hamburger T, Maly B, Peretz T and Ben-Porath I: Control of breast
cancer growth and initiation by the stem cell-associated
transcription factor TCF3. Cancer Res. 72:5613–5624. 2012.
View Article : Google Scholar : PubMed/NCBI
|
|
17
|
Livak KJ and Schmittgen TD: Analysis of
relative gene expression data using real-time quantitative PCR and
the 2(-Delta Delta C(T)) method. Methods. 25:402–408. 2001.
View Article : Google Scholar : PubMed/NCBI
|
|
18
|
Yi F, Pereira L, Hoffman JA, Shy BR, Yuen
CM, Liu DR and Merrill BJ: Opposing effects of Tcf3 and Tcf1
control Wnt stimulation of embryonic stem cell self-renewal. Nat
Cell Biol. 13:762–770. 2011. View
Article : Google Scholar : PubMed/NCBI
|
|
19
|
Shah M, Rennoll SA, Raup-Konsavage WM and
Yochum GS: A dynamic exchange of TCF3 and TCF4 transcription
factors controls MYC expression in colorectal cancer cells. Cell
Cycle. 14:323–332. 2015. View Article : Google Scholar : PubMed/NCBI
|
|
20
|
Ben-Porath I, Thomson MW, Carey VJ, Ge R,
Bell GW, Regev A and Weinberg RA: An embryonic stem cell-like gene
expression signature in poorly differentiated aggressive human
tumors. Nat Genet. 40:499–507. 2008. View
Article : Google Scholar : PubMed/NCBI
|
|
21
|
Cavallo RA, Cox RT, Moline MM, Roose J,
Polevoy GA, Clevers H, Peifer M and Bejsovec A: Drosophila Tcf and
Groucho interact to repress Wingless signalling activity. Nature.
395:604–608. 1998. View
Article : Google Scholar : PubMed/NCBI
|
|
22
|
Stamos JL and Weis WI: The β-catenin
destruction complex. Cold Spring Harb Perspect Biol. 5:a0078982013.
View Article : Google Scholar : PubMed/NCBI
|
|
23
|
Arce L, Yokoyama NN and Waterman ML:
Diversity of LEF/TCF action in development and disease. Oncogene.
25:7492–7504. 2006. View Article : Google Scholar : PubMed/NCBI
|
|
24
|
Zhao H, Zhao C, Li H, Zhang D and Liu G:
E2A attenuates tumor-initiating capacity of colorectal cancer cells
via the Wnt/beta-catenin pathway. J Exp Clin Cancer Res.
38:2762019. View Article : Google Scholar : PubMed/NCBI
|
|
25
|
Chan CC, To KF, Yuen HL, Shing Chiang AK,
Ling SC, Li CH, Cheuk DK, Li CK and Shing MM: A 20-year prospective
study of Wilms tumor and other kidney tumors: A report from Hong
Kong pediatric hematology and oncology study group. J Pediatr
Hematol Oncol. 36:445–450. 2014. View Article : Google Scholar : PubMed/NCBI
|
|
26
|
Pajic A, Spitkovsky D, Christoph B,
Kempkes B, Schuhmacher M, Staege MS, Brielmeier M, Ellwart J,
Kohlhuber F, Bornkamm GW, et al: Cell cycle activation by c-myc in
a burkitt lymphoma model cell line. Int J Cancer. 87:787–793. 2000.
View Article : Google Scholar : PubMed/NCBI
|
|
27
|
Doose G, Haake A, Bernhart SH, López C,
Duggimpudi S, Wojciech F, Bergmann AK, Borkhardt A, Burkhardt B,
Claviez A, et al: MINCR is a MYC-induced lncRNA able to modulate
MYC's transcriptional network in Burkitt lymphoma cells. Proc Natl
Acad Sci USA. 112:E5261–E5270. 2015. View Article : Google Scholar : PubMed/NCBI
|
|
28
|
Trowbridge JJ, Xenocostas A, Moon RT and
Bhatia M: Glycogen synthase kinase-3 is an in vivo regulator of
hematopoietic stem cell repopulation. Nat Med. 12:89–98. 2006.
View Article : Google Scholar : PubMed/NCBI
|
|
29
|
Ying Y and Tao Q: Epigenetic disruption of
the WNT/beta-catenin signaling pathway in human cancers.
Epigenetics. 4:307–312. 2009. View Article : Google Scholar
|
|
30
|
Lustig B and Behrens J: The Wnt signaling
pathway and its role in tumor development. J Cancer Res Clin Oncol.
129:199–221. 2003. View Article : Google Scholar : PubMed/NCBI
|
|
31
|
Nusse R, Brown A, Papkoff J, Scambler P,
Shackleford G, McMahon A, Moon R and Varmus H: A new nomenclature
for int-1 and related genes: The Wnt gene family. Cell. 64:2311991.
View Article : Google Scholar : PubMed/NCBI
|
|
32
|
Yost C, Torres M, Miller JR, Huang E,
Kimelman D and Moon RT: The axis-inducing activity, stability, and
subcellular distribution of beta-catenin is regulated in Xenopus
embryos by glycogen synthase kinase 3. Genes Dev. 10:1443–1454.
1996. View Article : Google Scholar : PubMed/NCBI
|
|
33
|
Chodaparambil JV, Pate KT, Hepler MR, Tsai
BP, Muthurajan UM, Luger K, Waterman ML and Weis WI: Molecular
functions of the TLE tetramerization domain in Wnt target gene
repression. EMBO J. 33:719–731. 2014. View Article : Google Scholar : PubMed/NCBI
|