Introduction
Colorectal cancer (CRC) is common type of cancer
worldwide. Over the last few decades, there have been notable
advances in the diagnosis and treatment of CRC (1,2);
however, In China, the incidence and mortality rates of CRC were
376 and 191 per 10,000, respectively, in 2015 and have been
increasing gradually over the past decade (3). Therefore, there is an urgent need to
discover new and effective molecular targets for improving the
prognostic outcomes of patients with CRC.
GRINA is a member of the N-methyl D-aspartate
receptor (NMDAR) family and is located on chromosome 8q24.3
(4). An increasing number of
studies have reported the association between NMDAR expression and
cancer development (5–7). NMDAR inhibition in small cell lung and
breast cancer promotes cancer cell apoptosis (5,6). In
addition, NMDARs have been suggested as candidate therapeutic
targets for the management of ovarian cancer (6). In gastric cancer (GC), GRINA
expression is upregulated, which enhances GC progression and
suppresses apoptosis (7). However,
the role of GRINA in CRC is not completely understood.
The present study aimed to examine the expression
levels of GRINA in CRC tissues and cells, and to determine its
prognostic value in patients with CRC. Additionally, the effects of
GRINA on CRC cell proliferation, invasion and migration, as well as
the mechanism underlying GRINA upregulation in CRC were
assessed.
Materials and methods
Patients and tissue samples
Between September 2008 and December 2009, CRC
tissues and corresponding non-carcinoma samples (distance from
tumor margin, ≥5 cm) were collected from 167 patients with CRC
receiving surgical resection at The Affiliated Hospital of North
Sichuan Medical College (Nanchong, China). The age and sex
distribution of patients with CRC are shown in Table SI. Among the 167 patients, six
patients developed distant metastases and were excluded from the
study, as such a small sample size was not significant. All
enrolled patients had not received any adjuvant therapies prior to
surgery. The tissues were immersed in liquid nitrogen immediately
after resection and then stored at −80°C until subsequent analysis.
The present study was approved by the Medical Ethics Committee of
North Sichuan Medical College [approval no. 2021ER(A)006]. All
patients provided written informed consent for participation in the
present study. To evaluate postoperative survival, all CRC cases
were periodically followed up for 11–132 months. The detailed
clinical characteristics of the enrolled patients are presented in
Table SI.
Bioinformatic analysis
GRINA expression profiles in solid tumors were
compared with matched non-carcinoma samples based on data obtained
from The Cancer Genome Atlas (TCGA). In addition, the FireBrowse
(firebrowse.org) portal in TCGA was used for selecting and
analyzing data (8). The University
of California Santa Cruz Xena browser (xenabrowser.net) was used to
analyze GRINA mRNA expression and copy number alterations (CNAs) in
the TCGA-derived primary CRC cases (9). For improved validation of the GRINA
mRNA expression levels within CRC samples, GRINA was analyzed in
Oncomine (oncomine.org), an online database that contains
previously published and publicly available microarray data
(10). To validate the survival
analysis results, Kaplan-Meier curves of overall survival (OS) were
obtained from The Human Protein Atlas database (THPA;
proteinatlas.org) (11). TargetScan
(targetscan.org/vert_71/), starBase (starbase.info/) and Pictar
(pictar.mdc-berlin.de/) were used to predict the miRNA most likely
to bind to the mRNA of GRINA.
Cell culture
The normal colonic epithelial cell line FHC, 293T
cells and five human CRC cell lines (SW480, SW620, HT29, LoVo and
HCT116) were purchased from American Type Culture Collection. The
293T and CRC cell lines were cultured in DMEM (Invitrogen; Thermo
Fisher Scientific, Inc.) supplemented with 10% FBS (Invitrogen;
Thermo Fisher Scientific, Inc.). The FHC cell line was cultured in
DMEM:F12 (Sigma-Aldrich; Merck KGaA; cat. no. D8437) supplemented
with 10% FBS. All cells were maintained in a humidified incubator
at 37°C with 5% CO2. The vendors stated the identity of
the cells had been confirmed using STR profiling and were free of
mycoplasma contamination. The HT-29 cell line was also identified
by STR profiling in our laboratory. STR markers were analyzed
(Amelogenin, CSF1P0, D2S1338, D3S1358, D5S818, D7S820, D8S1179,
D13S317, D16S539, D18S51, D19S433, D21S11, FGA, Penta D, Penta E,
TH01, TPOX and vWA).
Immunohistochemical staining and
evaluation
CRC tissue was collected from patients with CRC,
fixed with 4% paraformaldehyde for 12 h at room temperature and
embedded in paraffin. Paraffin-embedded CRC tissues were sectioned
into 4-µm thick slices. After baking at 60°C for 2 h, the tissue
sections were deparaffinized using dimethylbenzene and rehydrated
using a descending alcohol gradient. The sections were incubated
with 0.3% hydrogen peroxide at room temperature for 30 min and then
blocked using 10% BSA (Sangon Biotech Co., Ltd.) for 1 h at room
temperature. Subsequently, the sections were incubated overnight at
4°C with a rabbit anti-GRINA antibody (1:50; cat. no. ab216953;
Abcam), followed by incubation with an HRP-conjugated secondary
antibody (1:100; goat Anti-Rabbit IgG H&L; cat. no. ab205718;
Abcam) at 37°C for 2 h. To develop signals, the tissues were
stained with DAB (OriGene Technologies, Inc.) at room temperature
for 1 h. For counterstaining, tissues were stained with hematoxylin
for 1 min at room temperature. All sections were dehydrated and
sealed. Stained tissues were observed and imaged using a light
microscope (Carl Zeiss AG). Sections labeled with rabbit IgG (cat.
no. #A7016; Beyotime Institute of Biotechnology) as the primary
antibody were used as negative controls and known GRINA positive
slides were used as positive controls. Scoring was performed based
on the ratio of positively stained cells (0, 0–5%; 1, 6–35%; 2,
36–70%; and 3, >70%) and the staining intensity (0, no staining;
1, weakly stained; 2, moderately stained; and 3, strongly stained),
as previously described (12). The
final score was determined by multiplying the score of the
percentage of the positive cells by the score of the staining
intensity, and final scores were defined as follows: -,0-1; +, 2–3;
++, 4–6; and +++, >6. Low expression was defined as a total
score <4, whereas high expression was defined as a total score
≥4. The tissues were scored by two experienced pathologists
independently.
Oligonucleotides and plasmid
transfection
MicroRNA (miR/miRNA)-296-3p mimics
(5′-GAGGGUUGGGUGGAGGCUCUCC-3′), miR-296-3p inhibitor
(anti-miR-296-3p; 5′-GGAGAGCCUCCACCCAACCCUC-3′), miR-negative
control (NC) mimics (5′-UUCUCCGAACGUGUCACGU-3′) and anti-miR-NC
(5′-UUUGUACUACACAAAAGUACUG-3′) were provided by Guangzhou RiboBio
Co., Ltd. The open reading frame of GRINA was amplified by PCR
using primers containing KpnI and EcoRI restriction
sites and subcloned into vector pcDNA 3.1(+) (BioVector NTCC, Inc.)
to generate the construct pcDNA-GRINA with no 3′-UTR. The empty
vector (NC plasmid) served as a negative control. The primers used
were as follows: Forward,
5′-GGATCCGCCACCATGTCCCATGAAAAGAGTTTTTTG−3′ and reverse,
5′-CACAACTCGAGCTACTCCTTGGCGCGGCCAATGAT-3′. Cell transfections were
performed using Lipofectamine® 2000 reagent (Invitrogen;
Thermo Fisher Scientific, Inc.) according to the manufacturer's
protocol. In brief, 2×10⁵ LoVo cells were cultured in
6-well plates at 37°C until they reached 60–70% confluence. Then ~5
µg corresponding transfectant (miR-296-3p or miR-NC mimics,
pcDNA3.1-GRINA or pcDNA3.1-NC plasmid) was added. Cells were
collected for subsequent experiments following 24 h co-culture at
37°C.
Reverse transcription-quantitative
(RT-q)PCR
Total RNA (including miRNA) was isolated from cells
(SW480 or LoVo) and tissues using TRIzol® (Invitrogen;
Thermo Fisher Scientific, Inc.) according to the manufacturer's
protocol. To reverse transcribe miRNA to cDNA, the TaqMan miRNA
Reverse Transcription kit (Applied Biosystems; Thermo Fisher
Scientific, Inc.) with miR-296-3p specific primers (Applied
Biosystems; Thermo Fisher Scientific, Inc.) was used according to
the manufacturer's protocol. To determine the expression levels of
mature miR-296-3p, qPCR was performed using TaqMan miRNA assays
(Applied Biosystems; Thermo Fisher Scientific, Inc.). To reverse
transcribe mRNAs to cDNA, the PrimeScript RT Reagent kit (Takara
Bio, Inc.) was used according to the manufacturer's protocol. To
determine GRINA mRNA expression levels, qPCR was performed using
SYBR Premix Ex Taq II (Takara Bio, Inc.) and an ABI 7500 Real-Time
PCR system (Applied Biosystems; Thermo Fisher Scientific, Inc.).
The following thermocycling conditions were used for qPCR: 95°C for
10 min; followed by 40 cycles of 95°C for 30 sec, 60°C for 30 sec
and 72°C for 30 sec and final extension at 72°C for 2 min. Samples
without cDNA template were used as the NCs. The sequences of the
primers used for qPCR were as follows: miR-296-3p forward,
5′-ACTTTGGGTGGAGGCTCTCC-3′ and reverse,
5′-CTGGTGTCGTGGAGTCGGCAATT-3′; U6 forward, 5′-CTCGCTTCGGCAGCACA-3′
and reverse, 5′-AACGCTTCACGAATTTGCGT-3′; GRINA forward,
5′-GGATGATCGCCAGCTTCTAC-3′ and reverse, 5′-GCGAAGATGAAGAGCACCAC-3′;
β-actin forward, 5′-CCAAGGCCAACCGCGAGAAGATGAC-3′ and reverse,
5′-AGGGTACATGGTGGTGCCGCCAGAC-3′. miRNA and mRNA relative expression
levels were calculated using the 2−ΔΔCq method (13) and normalized to the internal
reference genes U6 and GAPDH, respectively.
Lentivirus constructs
The plasmid (pLX304-Blast-V5) containing GRINA-HA
and the NC plasmid were provided by Asia-Vector Biotechnology
(Shanghai) Co., Ltd. The shRNA-containing plasmids (pGIZP-gfp-puro)
and NC plasmid were purchased from Shanghai GenePharma Co., Ltd.
The sequences of the short hairpin RNAs (shRNAs) are presented in
Table SII. To generate stable cell
lines, the pPACKH1 HIV Lentivector Packaging kit (System
Biosciences, LLC) was used according to the manufacturer's
instructions. Briefly, 1.0 µg GRINA-HA- or shRNA-containing
plasmids (corresponding control plasmid) and 5.0 µg pPACKH1 (3rd
generation packaging system) packaging plasmid mix (pPACKH1-GAG,
pPACKH1-REV and pVSV-G plasmids) were transfected into 293T cells.
After 24 h, the collected culture media was mixed with PEG-it
Reagent (System Biosciences) and incubated overnight at 4°C to
concentrate the viruses. The culture medium containing virions was
centrifuged at 72,000 × g for 120 min at 4°C. The centrifuged
pellet was resuspended in 1X phosphate-buffered saline and aliquots
were stored at −80°C. The viruses were transduced into SW480 or
LoVo cells using polybrene (8 mg/ml; Sigma-Aldrich; Merck KGaA) at
MOI=20. After 24 h, the medium containing virus were replaced with
fresh complete medium. Stably transfected SW480 or LoVo cells were
selected by adding puromycin (6 µg/ml) in medium and the
maintenance concentration of puromycin in transfected cells was 3
µg/ml. Successful transfection was confirmed using RT-qPCR and
western blotting.
Cell proliferation analysis
MTT cell proliferation assays were performed to
assess cell proliferation. Briefly, 100 µl transfected cells (SW480
or LoVo; 5×10³ cells/well) were plated in 96-well
plates. After incubation for 24, 48, 72 or 96 h, 5 mg/ml MTT
solution (20 µl) was added to each well and incubated for a further
4 h. Subsequently, the MTT solution was removed and 150 µl DMSO was
added. Absorbance was measured at a wavelength of 490 nm using a
SpectraMax M5 microplate reader (Molecular Devices LLC). The
experiment was performed in quintuplicate and repeated twice.
Wound healing assay
Transfected cells (SW480 or LoVo) were plated into
6-well plates and cultured at 37°C in DMEM containing 1% FBS until
they reached 100% confluency. Subsequently, a pipette tip was used
to scrape the cell monolayer to generate a linear cell wound, and
floating cells were gently washed twice with DMEM. Cells were
cultured at 37°C in DMEM (1% FBS) for 24 h. The cells migrating
into the wounded areas were observed using a light microscope
(magnification, ×20) at 0 and 24 h. Wound healing was assessed
using MShot Image Analysis system 1.3.10 (Guangzhou Mingmei
PhotoelectricTechnology Co, Ltd.). Each experiment was repeated
three times.
Matrigel invasion assays
Transwell inserts (pore size, 8 µm; Corning, Inc.)
were coated with Matrigel (BD Biosciences) for 30 min at 37°C.
Subsequently, transfected cells (SW480 or LoVo) (1×10⁵
cells/well) in serum-free medium were plated into the upper chamber
of the Transwell inserts in a 24-well plate. The lower chamber was
filled with medium supplemented with 10% FBS. Following incubation
for 24 h at 37°C, cells in the lower chamber were fixed in 10%
formalin at 25°C for 10 min and stained with 0.1% crystal violet at
25°C for 5 min and counted using an inverted light microscope
(magnification, ×20; Olympus Corporation). All experiments were
repeated three times.
In vivo xenograft experiments
A total of 18 female BALB/C nude mice (age, 4 weeks;
weight, ~20 g) were provided by Shanghai SLAC Laboratory Animal
Co., Ltd. Animals maintained under standard animal housing
conditions (24°C, 60% humidity, 12-h light/dark cycle, free access
to food and purified water) and were randomly assigned to one of
two groups (n=4 per group; shGRINA and sh-NC group). The animal
experiments were approved by the Experimental Animal Ethics
Committee of North Sichuan Medical College (approval no. 20190907).
The nude mice were subcutaneously injected with shGRINA or
shNC-transfected LoVo cell suspension (1×10⁶ cells/ml)
in 200 µl serum-free medium through the lower back. After 4 weeks,
all animals were sacrificed, the tumors were resected and tumor
weight was measured. Mice were euthanized by the intraperitoneal
injection of sodium pentobarbital (200 mg/kg). Tumor volume was
determined as follows: Volume (cm3)=length ×
width2/2, where both length and width were measured in
cm. The maximum tumor diameter was 1.3 cm and the maximum tumor
volume was 1.2 cm3. For tail vein metastasis, nude mice
(n=5 per group) were injected with sh-GRINA- or sh-Ctrl-transfected
LoVo cells (2×10⁶) through the tail vein. After 8 weeks,
the animals were sacrificed and the lung tissues were removed.
Following paraffin embedding, pathological examination was
performed. A dissection microscope was used to count the tumor
metastases in the lungs (magnification, ×20).
Luciferase reporter assay
In the luciferase reporter assays, the mutant-type
(MUT) or wild-type (WT) 3′-untranslated region (3′-UTR) of GRINA
was subcloned into the empty psicheck-2 vector (Promega
Corporation) at the XhoI-NotI restriction sites to
produce the psicheck-2-GRINA-3′-UTR MUT and WT plasmids,
respectively. Specific fragments were amplified from human genomic
DNA extracted from nucleated cells using a genomic DNA extraction
kit (ab156900; Abcam). The primers used were GRINA-WT forward,
5′-CACAACTCAGCTCGCTGTGCCCGCTCAGGT-3′ and reverse,
5′-CACAACACAATCACTGACAACAACCCCATT-3′; GRINA-MUT forward,
5′-AGGATCGGACTCTCGTTGGGACCTGTATGTACACTGCAGA-3′ and reverse,
5′-ACAGGTCCCAACGAGAGTCCGATCCTTTTCCCTAGGCTGT-3′. PCR was performed
using Takara LA Taq polymerase and PCR system (Takara Biotechnology
Co., Ltd.). The thermocycling conditions were as follows: Initial
denaturation at 94°C for 5 min; followed by 35 cycles of 94°C for
30 sec, 60°C for 30 sec and 72°C for 40 sec and final extension at
72°C for 5 min. To perform the luciferase reporter assays, 293T
cells (1×10⁵ cells/well) were plated into a 24-well
plate. Subsequently, 293T cells were co-transfected with 2 ng
pRL-TK (Promega Corporation), 200 ng psicheck-2-GRINA-WT or
psicheck-2-GRINA-MUT and 40 nM miR-NC/miR-296-3p or
anti-miR-NC/anti-miR-296-3p using Lipofectamine® 2000.
Then, cells were transfected at 37°C for 48 h. At 48 h
post-transfection, cells were collected and luciferase activities
were measured using the Dual-Luciferase Reporter assay system
(Promega Corporation) according to the manufacturer's protocol.
Firefly luciferase activities were normalized to Renilla
luciferase activities.
Western blotting
Total protein was extracted from cells (transfected
SW480 or LoVo) using RIPA lysis buffer (Beijing Solarbio Science
& Technology Co., Ltd.) containing proteinase inhibitors.
Protein concentrations were determined using the BCA method.
Proteins (50 µg/lane) were separated via 10% SDS-PAGE and
transferred onto PVDF membranes. Following blocking with 5% skimmed
milk for 1.5 h at room temperature, the membranes were incubated
overnight at 4°C with primary antibodies targeted against: GRINA
(rabbit; 1:1,000; cat. no. AP13558c; Abgent, Inc.) or GAPDH (mouse;
1:1,000; cat. no. AM1020b; Abgent, Inc.). Subsequently, the
membranes were incubated with horseradish peroxidase-conjugated
anti-rabbit (1:5,000; cat. no. sc-2357; Santa Cruz Biotechnology,
Inc.) and anti-mouse (1:10,000; cat. no. Sc-2005; Santa Cruz
Biotechnology, Inc.) secondary antibodies for 1 h at 37°C. Protein
bands were visualized using ECL (EMD Millipore). Protein expression
was semi-quantified using ImageJ software (version 1.8.0; National
Institutes of Health) with GAPDH as the loading control.
Statistical analysis
Continuous variables are presented as the mean ± SD.
The χ2 test was used to examine the association between
GRINA expression levels and the clinicopathological features of
patients with CRC. Comparisons between two groups were analyzed
using the Student's t-test or Mann-Whitney U test. Comparisons
among multiple groups were analyzed using one-way ANOVA followed by
Dunnett's or Tukey's post hoc test. The Kaplan-Meier method was
used to analyze survival following surgery and a log-rank test was
used for comparison of survival. Spearman's correlation analysis
was used to determine the correlation between miR-296-3p and GRINA
expression in CRC samples. Statistical analyses were performed
using SPSS software (version 19; IBM Corp.). R (version 3.5.2:
r-project.org/) and GraphPad Prism (version 6; GraphPad Software,
Inc.) were used to prepare the graphs. P<0.05 was considered to
indicate a statistically significant difference.
Results
GRIN expression is significantly
upregulated in CRC tissues compared with healthy tissues
The differential expression of GRINA at the mRNA
level was detected by comparing cancer samples with healthy samples
in FireBrowse. GRINA expression was upregulated by ~3× in CRC
samples compared with the corresponding healthy samples (Fig. 1).
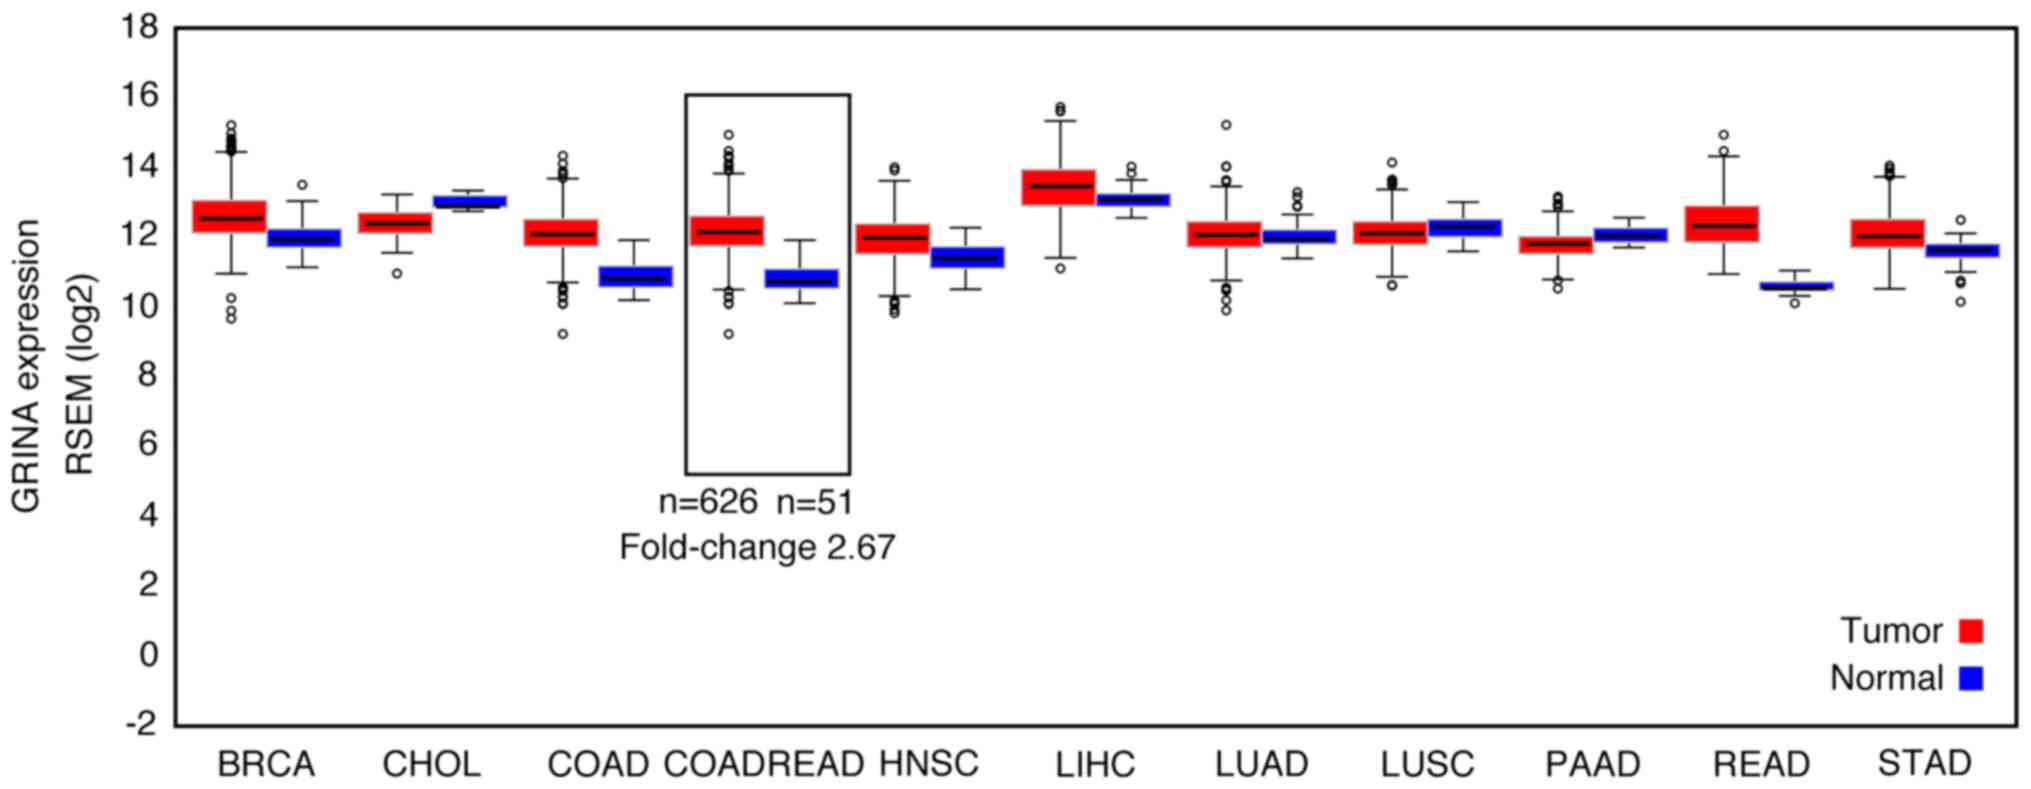 | Figure 1.GRINA mRNA expression levels in a
range of solid tumor samples and matched non-carcinoma samples
based on bioinformatics analysis. GRINA, glutamate receptor,
ionotropic, N-methyl D-aspartate-associated protein 1; RSEM,
RNA-Seq by Expectation-Maximization; BRCA, breast invasive
carcinoma; CHOL, cholangiocarcinoma; COAD, colon adenocarcinoma;
COADREAD, colon adenocarcinoma/rectum adenocarcinoma; HNSC, head
and neck squamous cell carcinoma; LIHC, liver hepatocellular
carcinoma; LUAD, lung adenocarcinoma; LUSC, lung squamous cell
carcinoma; PAAD, pancreatic adenocarcinoma; READ, rectum
adenocarcinoma; STAD, stomach adenocarcinoma. |
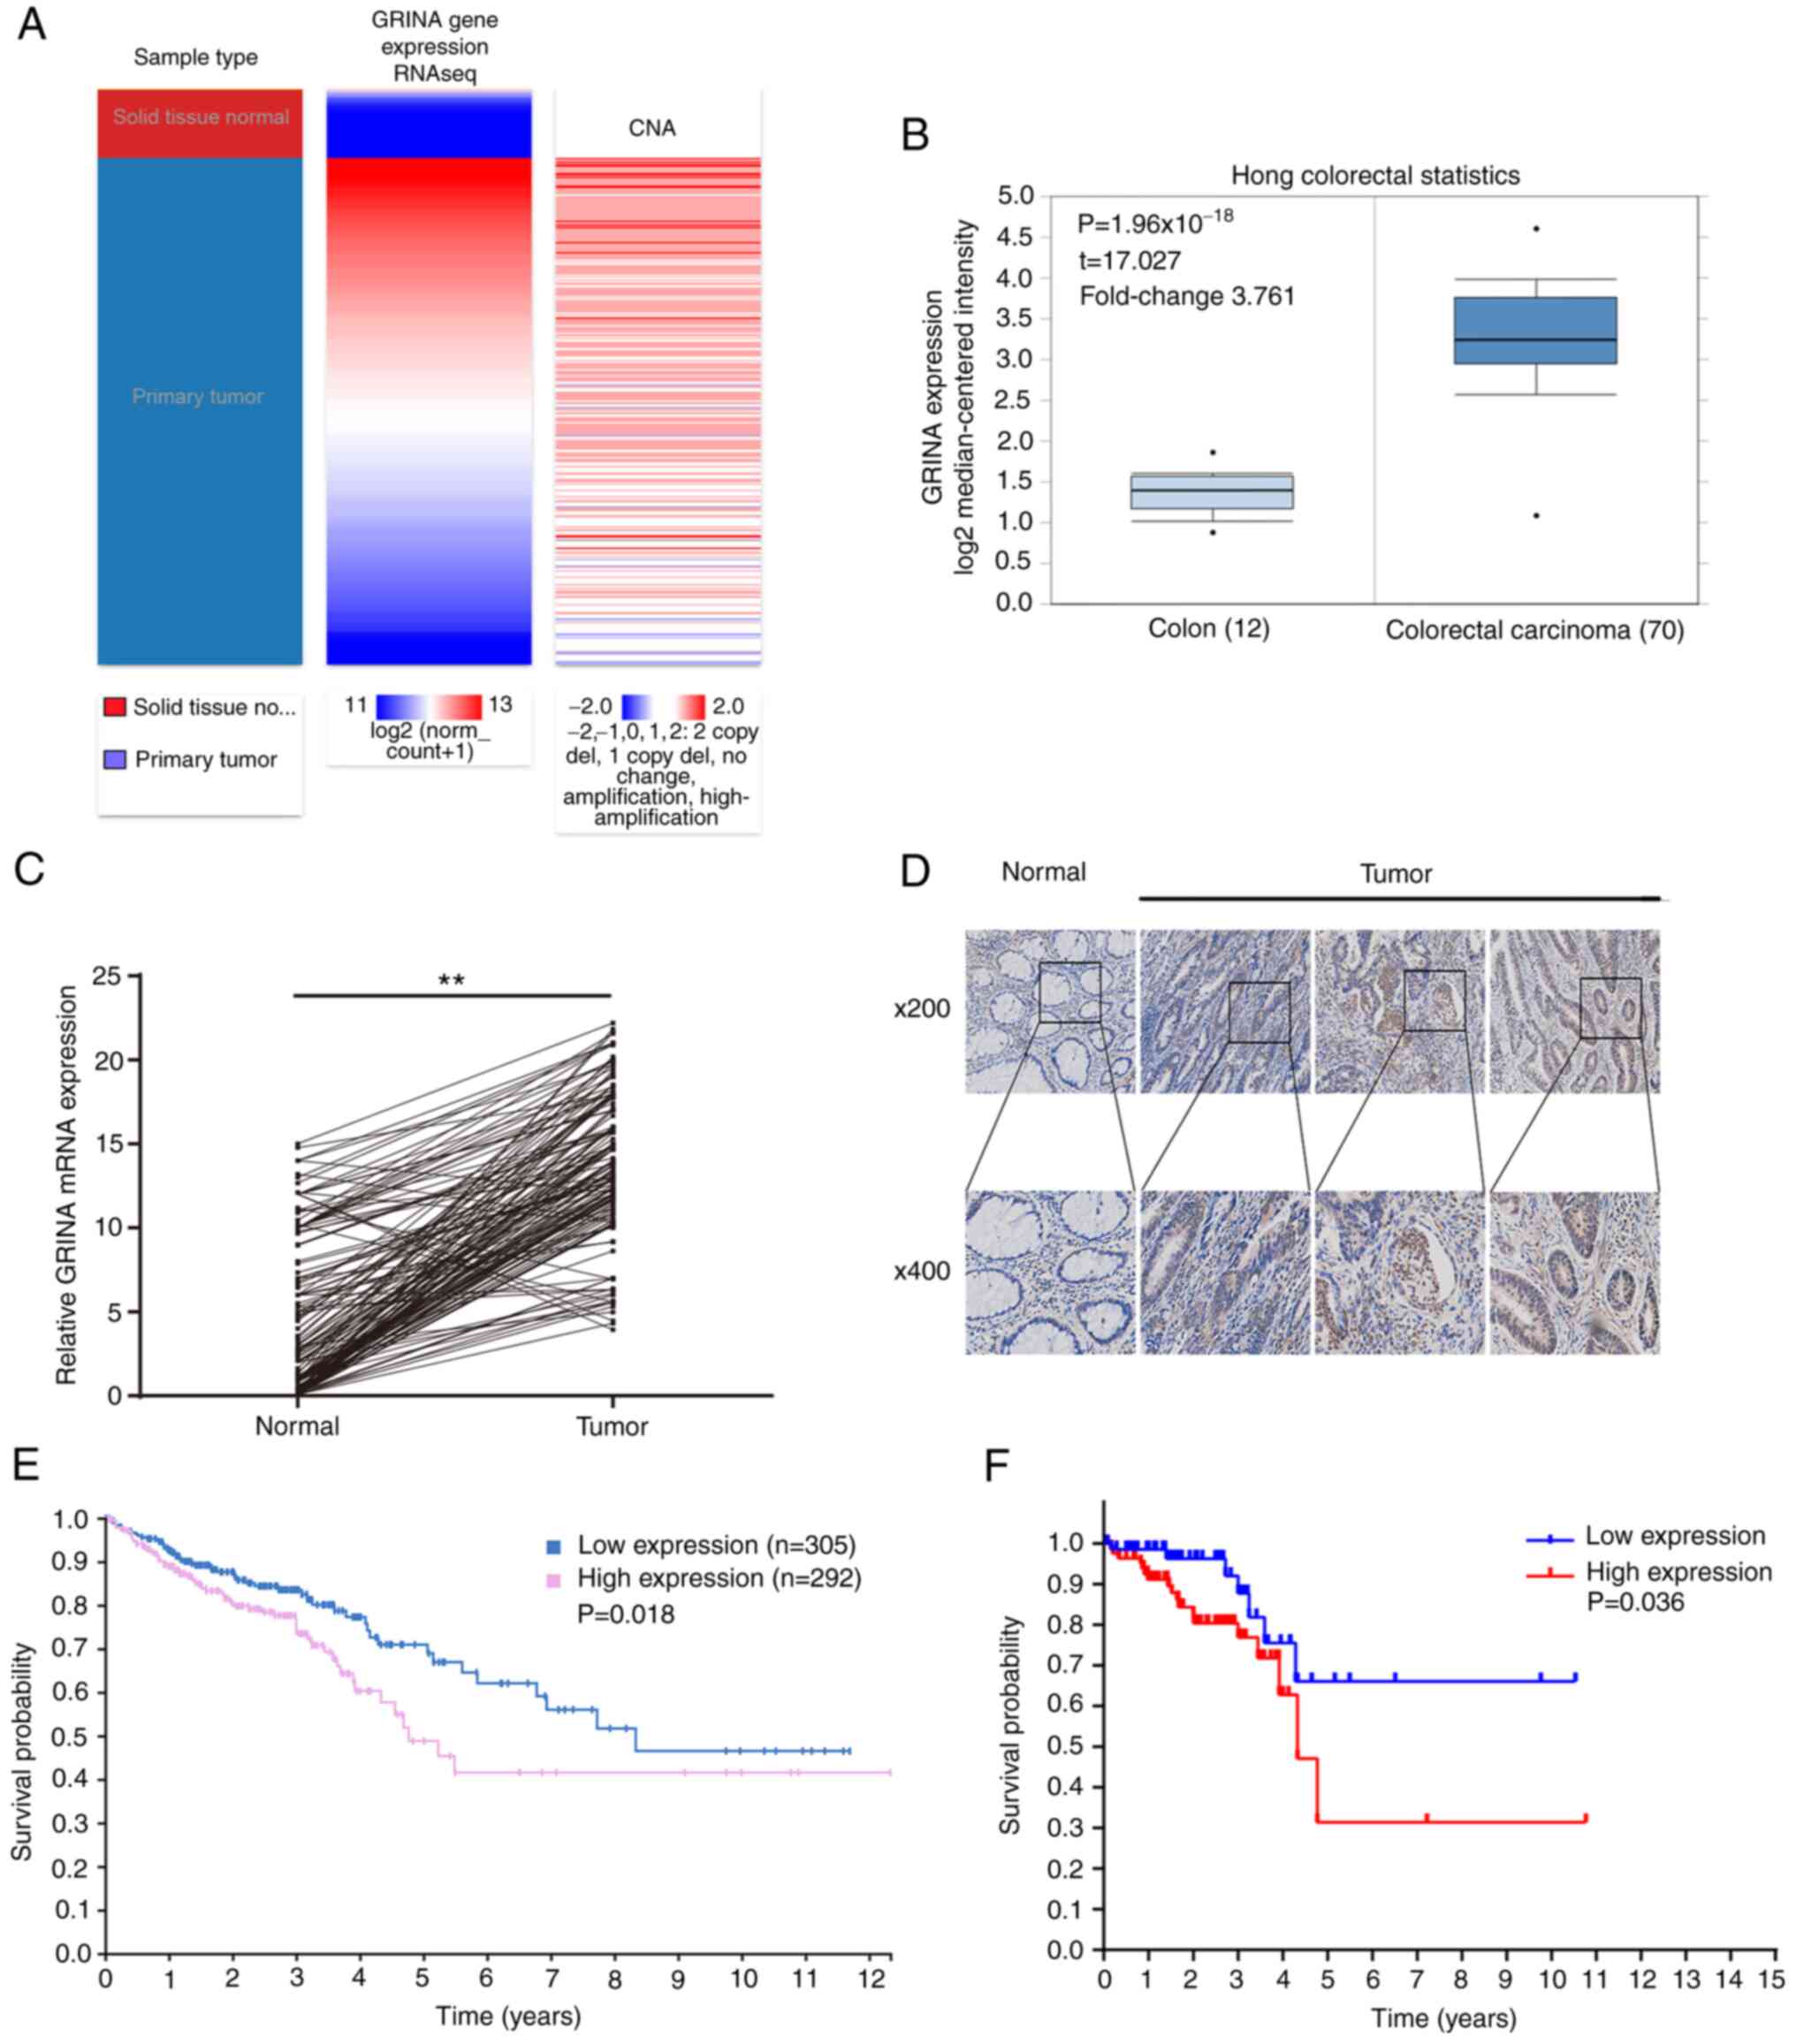
In samples obtained from TCGA and Oncomine, GRINA
mRNA expression was significantly increased in CRC samples compared
with healthy samples (Fig. 2A and
B). Additionally, it was shown that the amplification was
associated with higher mRNA expression levels of GRINA (Fig. 2A).
To validate the results of the bioinformatics
analysis, 161 pairs of freshly resected CRC and healthy samples
were obtained to assess the GRINA mRNA and protein expression
levels. GRINA expression levels in the tumor samples were higher
compared with the healthy samples (Fig.
2C and D), which was consistent with the bioinformatics
analysis.
The correlation between the OS of patients and GRINA
expression was examined using the Kaplan-Meier method. A total of
161 patients with CRC were categorized into high or low groups
based on the median mRNA expression level of GRINA. The median
GRINA mRNA expression level was 14.352 (4.256–23.364). Kaplan-Meier
survival analysis demonstrated that GRINA mRNA expression was
significantly associated with the OS of patients with CRC.
Specifically, upregulated expression of GRINA was associated with a
worse OS (Fig. 2F). This result was
confirmed using the Kaplan-Meier survival analysis on the data
obtained from THPA (Fig. 2E).
Association between GRINA expression
and the clinicopathological factors of patients with CRC
To determine the value of GRINA in clinical and
pathological diagnosis, immunohistochemical staining of the 161 CRC
samples was performed. The association between GRINA expression and
the clinicopathological characteristics of the patients is
presented in Table I. GRINA
expression was significantly associated with age (P=0.045),
American Joint Committee on Cancer stage (P=0.011) and lymphatic
invasion (P=0.0001), but not sex, T stage, differentiation or tumor
location.
 | Table I.Association between GRINA expression
and clinicopathological parameters in 161 patients with colorectal
cancer. |
Table I.
Association between GRINA expression
and clinicopathological parameters in 161 patients with colorectal
cancer.
|
| GRINA
expression |
|
|---|
|
|
|
|
|---|
| Clinicopathological
parameter | Low (n=64) | High (n=97) | P-value |
|---|
| Age |
|
| 0.045a |
|
<60 | 27 | 25 |
|
|
≥60 | 37 | 72 |
|
| Sex |
|
| 0.675 |
|
Male | 30 | 50 |
|
|
Female | 34 | 47 |
|
| T stage |
|
| 0.775 |
| T1 and
T2 | 22 | 30 |
|
| T3 and
T4 | 42 | 67 |
|
| Lymphatic
invasion |
|
|
<0.001b |
|
Absent | 43 | 34 |
|
|
present | 21 | 63 |
|
| TNM stage |
|
| 0.011a |
| I | 17 | 10 |
|
| II | 20 | 27 |
|
|
III | 27 | 60 |
|
|
Differentiation |
|
| 0.058 |
|
Well | 20 | 15 |
|
|
Moderate | 25 | 45 |
|
|
Poor | 19 | 37 |
|
| Tumor location |
|
| 0.632 |
|
Colon | 31 | 42 |
|
|
Rectum | 33 | 55 |
|
GRINA promotes CRC cell proliferation,
migration and invasion in vitro
RT-qPCR was performed to examine the mRNA expression
levels of GRINA in the normal colonic FHC cell line and the five
CRC cell lines (HT29, HCT116, LoVo, SW480 and SW620). GRINA
expression was significantly higher in the five CRC cell lines
compared with that in FHC cells (Fig.
3A). Among the five CRC cell lines, GRINA expression was
notably higher in LoVo and SW620 cells compared with that in HT29,
HCT116 and SW480 cells (Fig. 3A).
Therefore, SW480 and LoVo cells were used for subsequent in
vitro experiments. Lentiviral transfection was performed to
overexpress GRINA expression in SW480 cells and knock down GRINA
expression in LoVo cells. RT-qPCR and western blotting were
performed to verify successful GRINA overexpression and knockdown
(Fig. 3B and C).
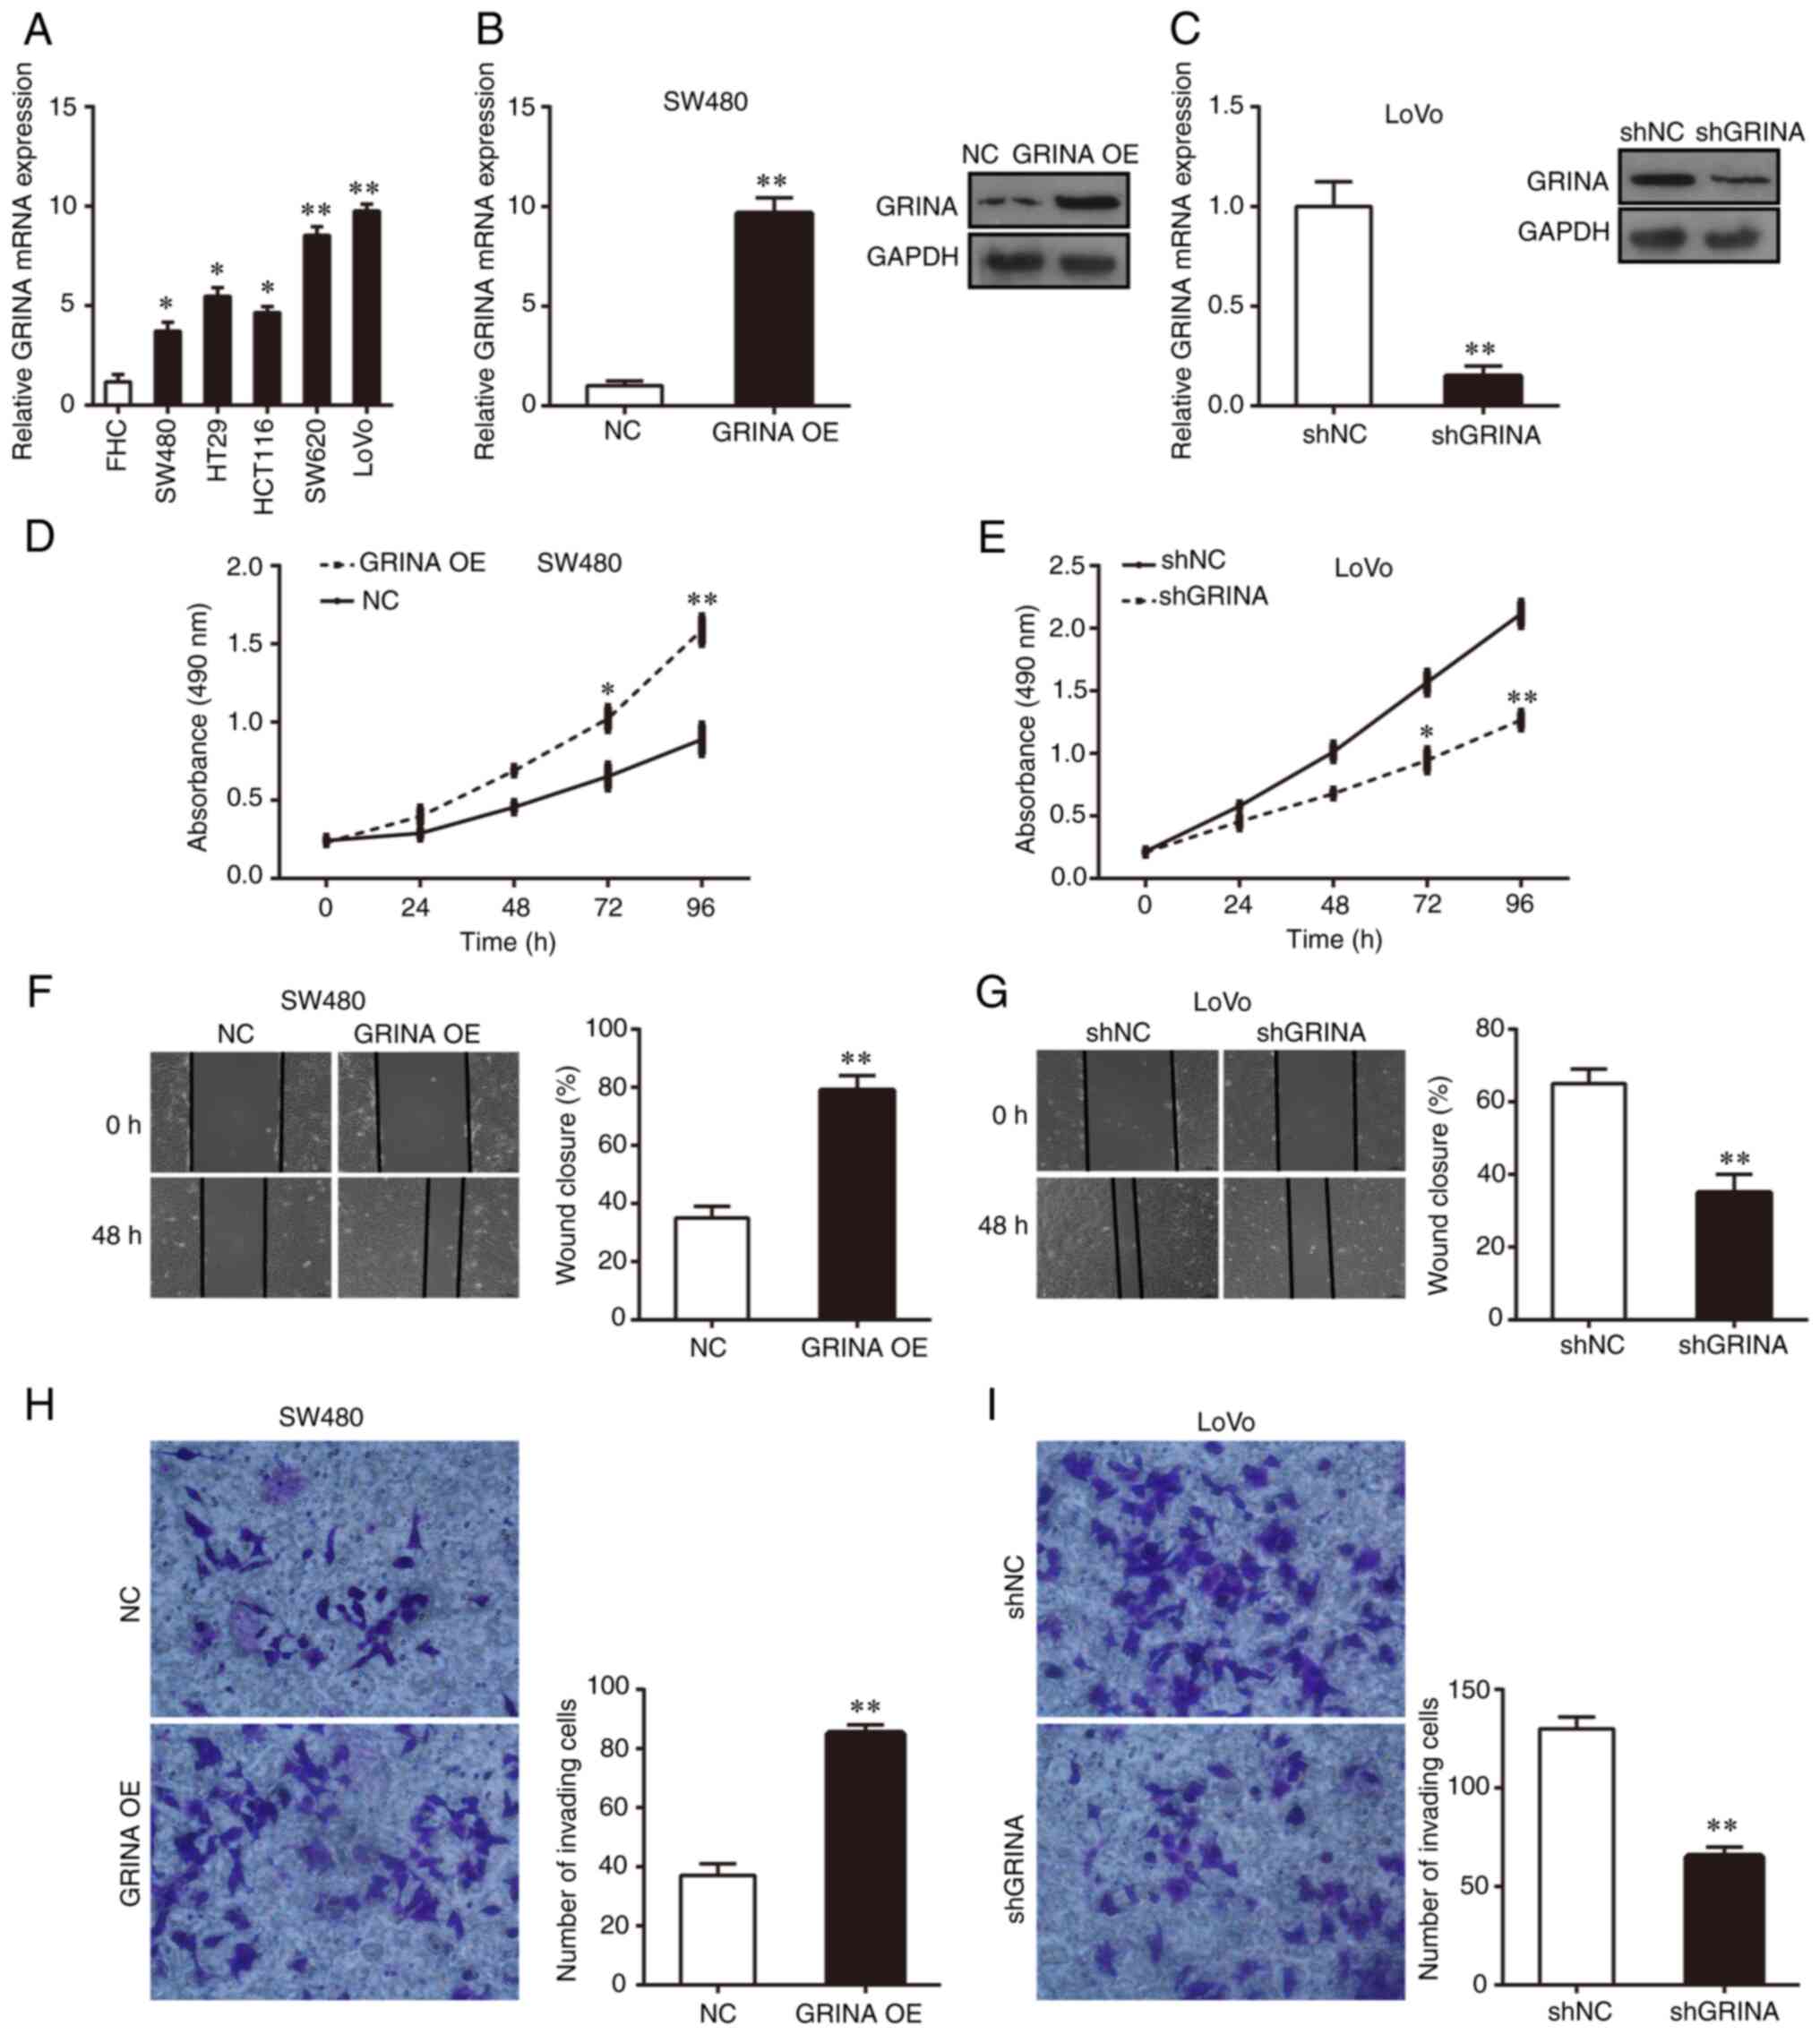 | Figure 3.GRINA enhances CRC cell growth,
invasion and migration in vitro. (A) Relative GRINA mRNA
expression levels in the normal colonic epithelial cell line (FHC)
and the five CRC cell lines (HCT116, HT29, LoVo, SW480 and SW620).
(B) Following GRINA overexpression, GRINA mRNA and protein
expression levels in SW480 were detected by performing RT-qPCR and
western blotting. (C) Following GRINA knockdown, GRINA mRNA and
protein expression levels in LoVo cells were detected by performing
RT-qPCR and western blotting. Cell proliferation of (D)
GRINA-overexpression SW480 and (E) GRINA-knockdown LoVo cells was
detected by performing MTT assays. Cell migration of (F)
GRINA-overexpression SW480 and (G) GRINA-knockdown LoVo cells was
detected by performing wound healing assays. Cell invasion of (H)
GRINA-overexpression SW480 and (I) GRINA-knockdown LoVo cells was
detected by performing Transwell invasion assays. *P<0.05 and
**P<0.01. GRINA, glutamate receptor, ionotropic, N-methyl
D-aspartate-associated protein 1; CRC, colorectal cancer; RT-qPCR,
reverse transcription-quantitative PCR; NC, negative control; OE,
overexpression; sh, short hairpin RNA. |
MTT, wound healing and Matrigel invasion assays were
performed to assess the effect of GRINA on CRC cell proliferation,
migration and invasion, respectively. The results suggested that
GRINA overexpression significantly increased SW480 cell
proliferation, migration and invasion compared with the NC group
(Fig. 3D, F and H). Conversely,
GRINA knockdown significantly suppressed LoVo cell growth,
migration and invasion compared with the shNC group (Fig. 3E, G and I). Thus, the results
indicated that GRINA served a tumor-promoting effect on CRC
cells.
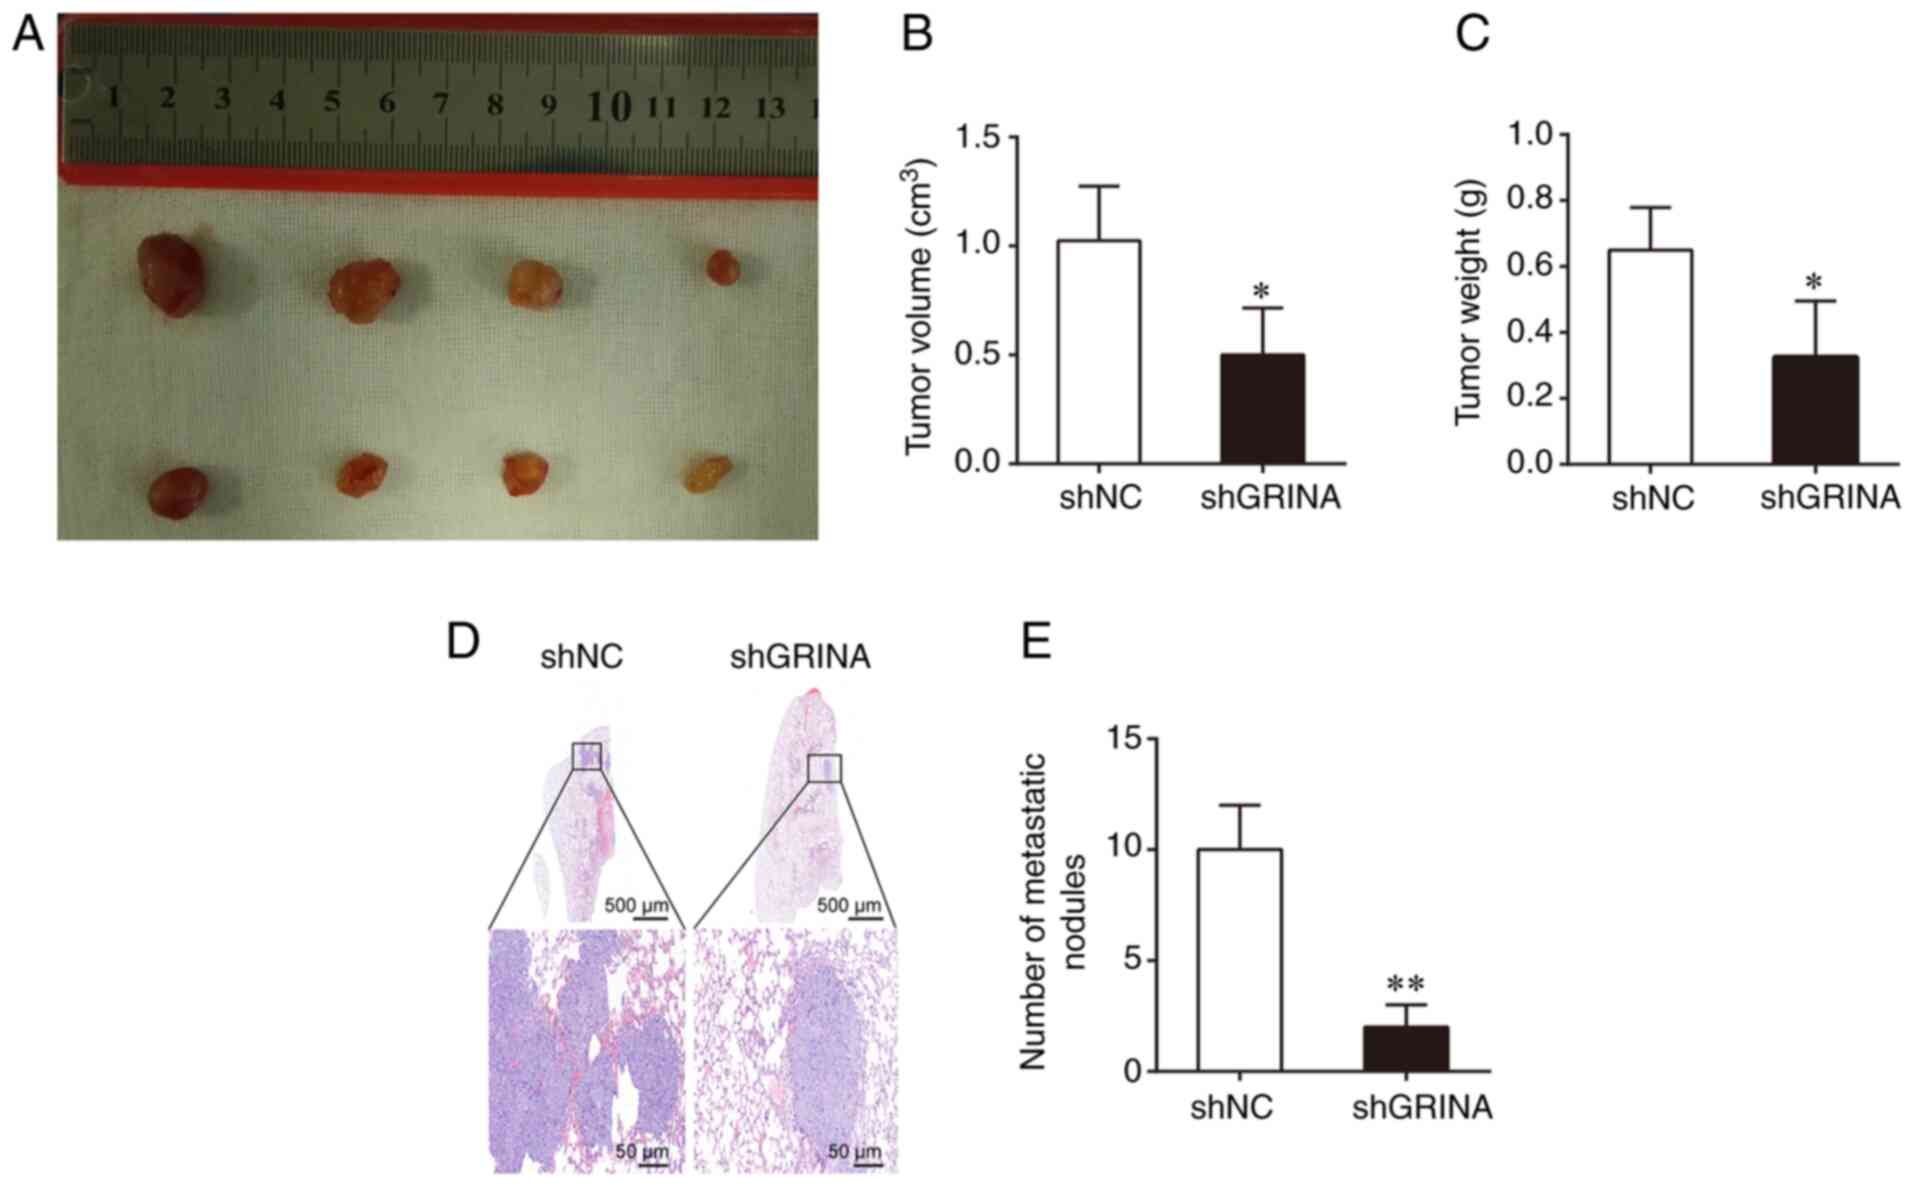
GRINA promotes LoVo cell growth and
metastasis in vivo
To determine the effect of GRINA on tumor growth
in vivo, a BALB/C xenograft nude mouse model was used, in
which mice were transplanted with shGRINA- or shNC-transfected LoVo
cells. After 4 weeks, the shGRINA group presented with
significantly smaller and lighter tumors compared with those
obtained from mice in the shNC group (Fig. 4A-C). To assess metastasis, the shNC-
and shGRINA-transfected LoVo cells were injected into nude mice via
the tail vein. At 8 weeks post-injection, the number of metastatic
lesions in the lungs was counted. As shown in Fig. 4D, the shNC group displayed a larger
metastatic lesions in the lung compared with the small lesions
observed in the shGRINA group. In addition, the shGRINA group
displayed significantly fewer metastatic lesions compared with the
shNC group (Fig. 4E). These results
were consistent with the in vitro results, further
confirming the role of GRINA in the development of CRC.
miR-296-3p directly targets GRINA in
CRC cells
The roles of various miRNAs as vital regulatory
factors in the development and progression of CRC have previously
been identified (14). However,
their specific roles in the regulation of CRC invasion and
metastasis are not completely understood. Previous studies have
demonstrated that miR-296 inhibits CRC progression by targeting
different genes (15,16). Several online tools, including
TargetScan, starBase and Pictar, were used in the present study to
predict the miRNA most likely to bind to the mRNA of GRINA. The
results suggested the direct binding of miR-296-3p to the 133–139
position in the 3′-UTR of GRINA mRNA (Fig. 5A). Interestingly, GRINA mRNA
expression was negatively correlated with miR-296-3p expression
(Fig. 5B). The binding between
GRINA and miR-296-3p was confirmed using a dual luciferase reporter
assay. The WT or MUT 3′-UTR GRINA luciferase reporter gene was
co-transfected into 293T cells with miR-296-3p mimics, miR-NC,
anti-miR-296-3p or anti-miR-NC. Compared with the miR-NC and
anti-miR-NC groups, respectively, miR-296-3p overexpression
significantly reduced luciferase activity, whereas miR-296-3p
knockdown significantly increased the luciferase activity of the WT
3′UTR (Fig. 5C and D). Moreover,
the functions of miR-296-3p mimics and anti-miR-296-3p were
abolished by co-transfection with the MUT 3′-UTR (Fig. 5C and D), further confirming binding
between miR-296-3p and GRINA mRNA. miR-296-3p inhibitor or mimics
were transiently transfected into cells to regulate miR-296-3p
expression levels. RT-qPCR was performed to confirm successful
transfection (Fig. 5E and F).
Compared with the anti-miR-NC and miR-NC groups, respectively,
miR-296-3p knockdown upregulated GRINA mRNA and protein expression
in SW480 cells, whereas miR-296-3p overexpression decreased GRINA
expression in LoVo cells (Fig. 5G and
H). Collectively, these results suggested that miR-296-3p
regulated GRINA expression through direct interaction with the
3′-UTR in CRC.
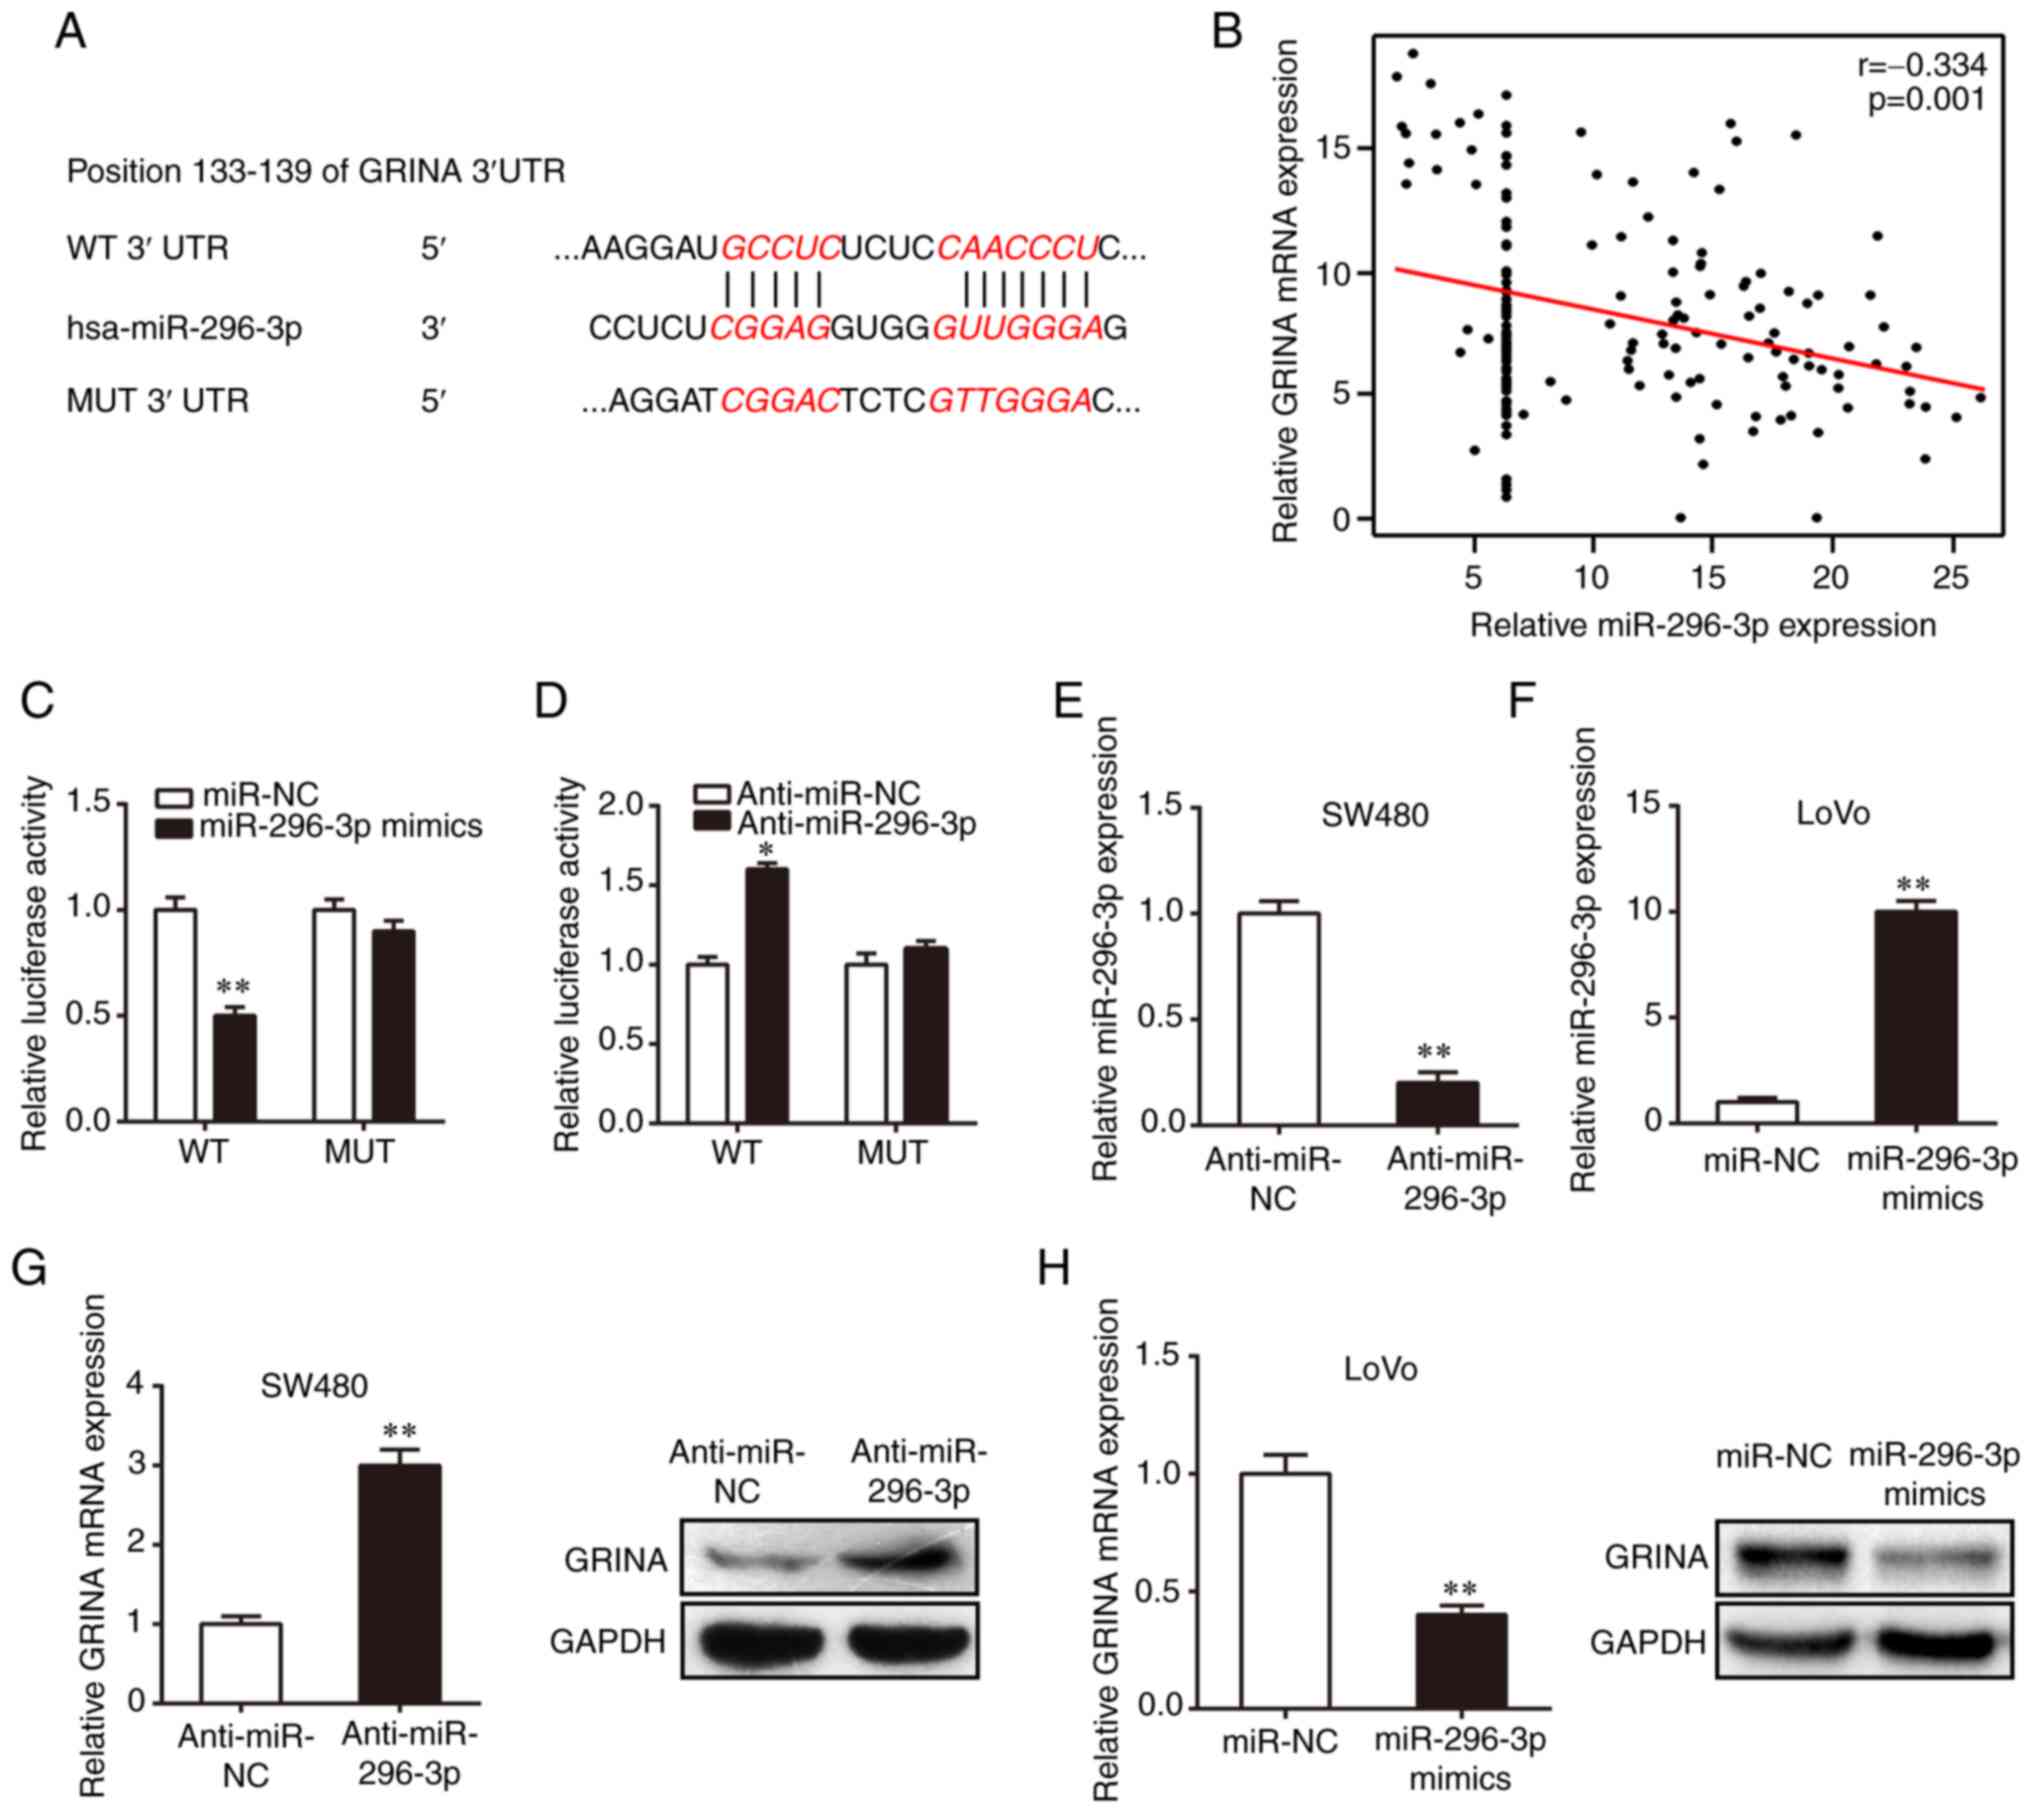 | Figure 5.GRINA is a direct target of
miR-296-3p. (A) WT and MUT putative target sequences of miR-296-3p
in the 3′UTR of GRINA. (B) miR-296-3p expression was negatively
correlated with GRINA expression in colorectal cancer samples.
Luciferase activities of psicheck-2-GRINA 3′UTR MUT and WT vectors
in 293T cells co-transfected with (C) miR-296-3p mimics, miR-NC,
(D) anti-miR-296-3p or anti-miR-NC. miR-296-3p expression in (E)
SW480 cells transfected with anti-miR-296-3p or anti-miR-NC and (F)
LoVo cells transfected with miR-296-3p mimics or miR-NC. GRINA mRNA
and protein expression levels in transfected (G) SW480 and (H) LoVo
cell lines. *P<0.05 and **P<0.01 vs. miR-NC or anti-miR-NC.
GRINA, glutamate receptor, ionotropic, N-methyl
D-aspartate-associated protein 1; WT, wild-type; MUT, mutant-type;
UTR, untranslated region; miR, microRNA; NC, negative control. |
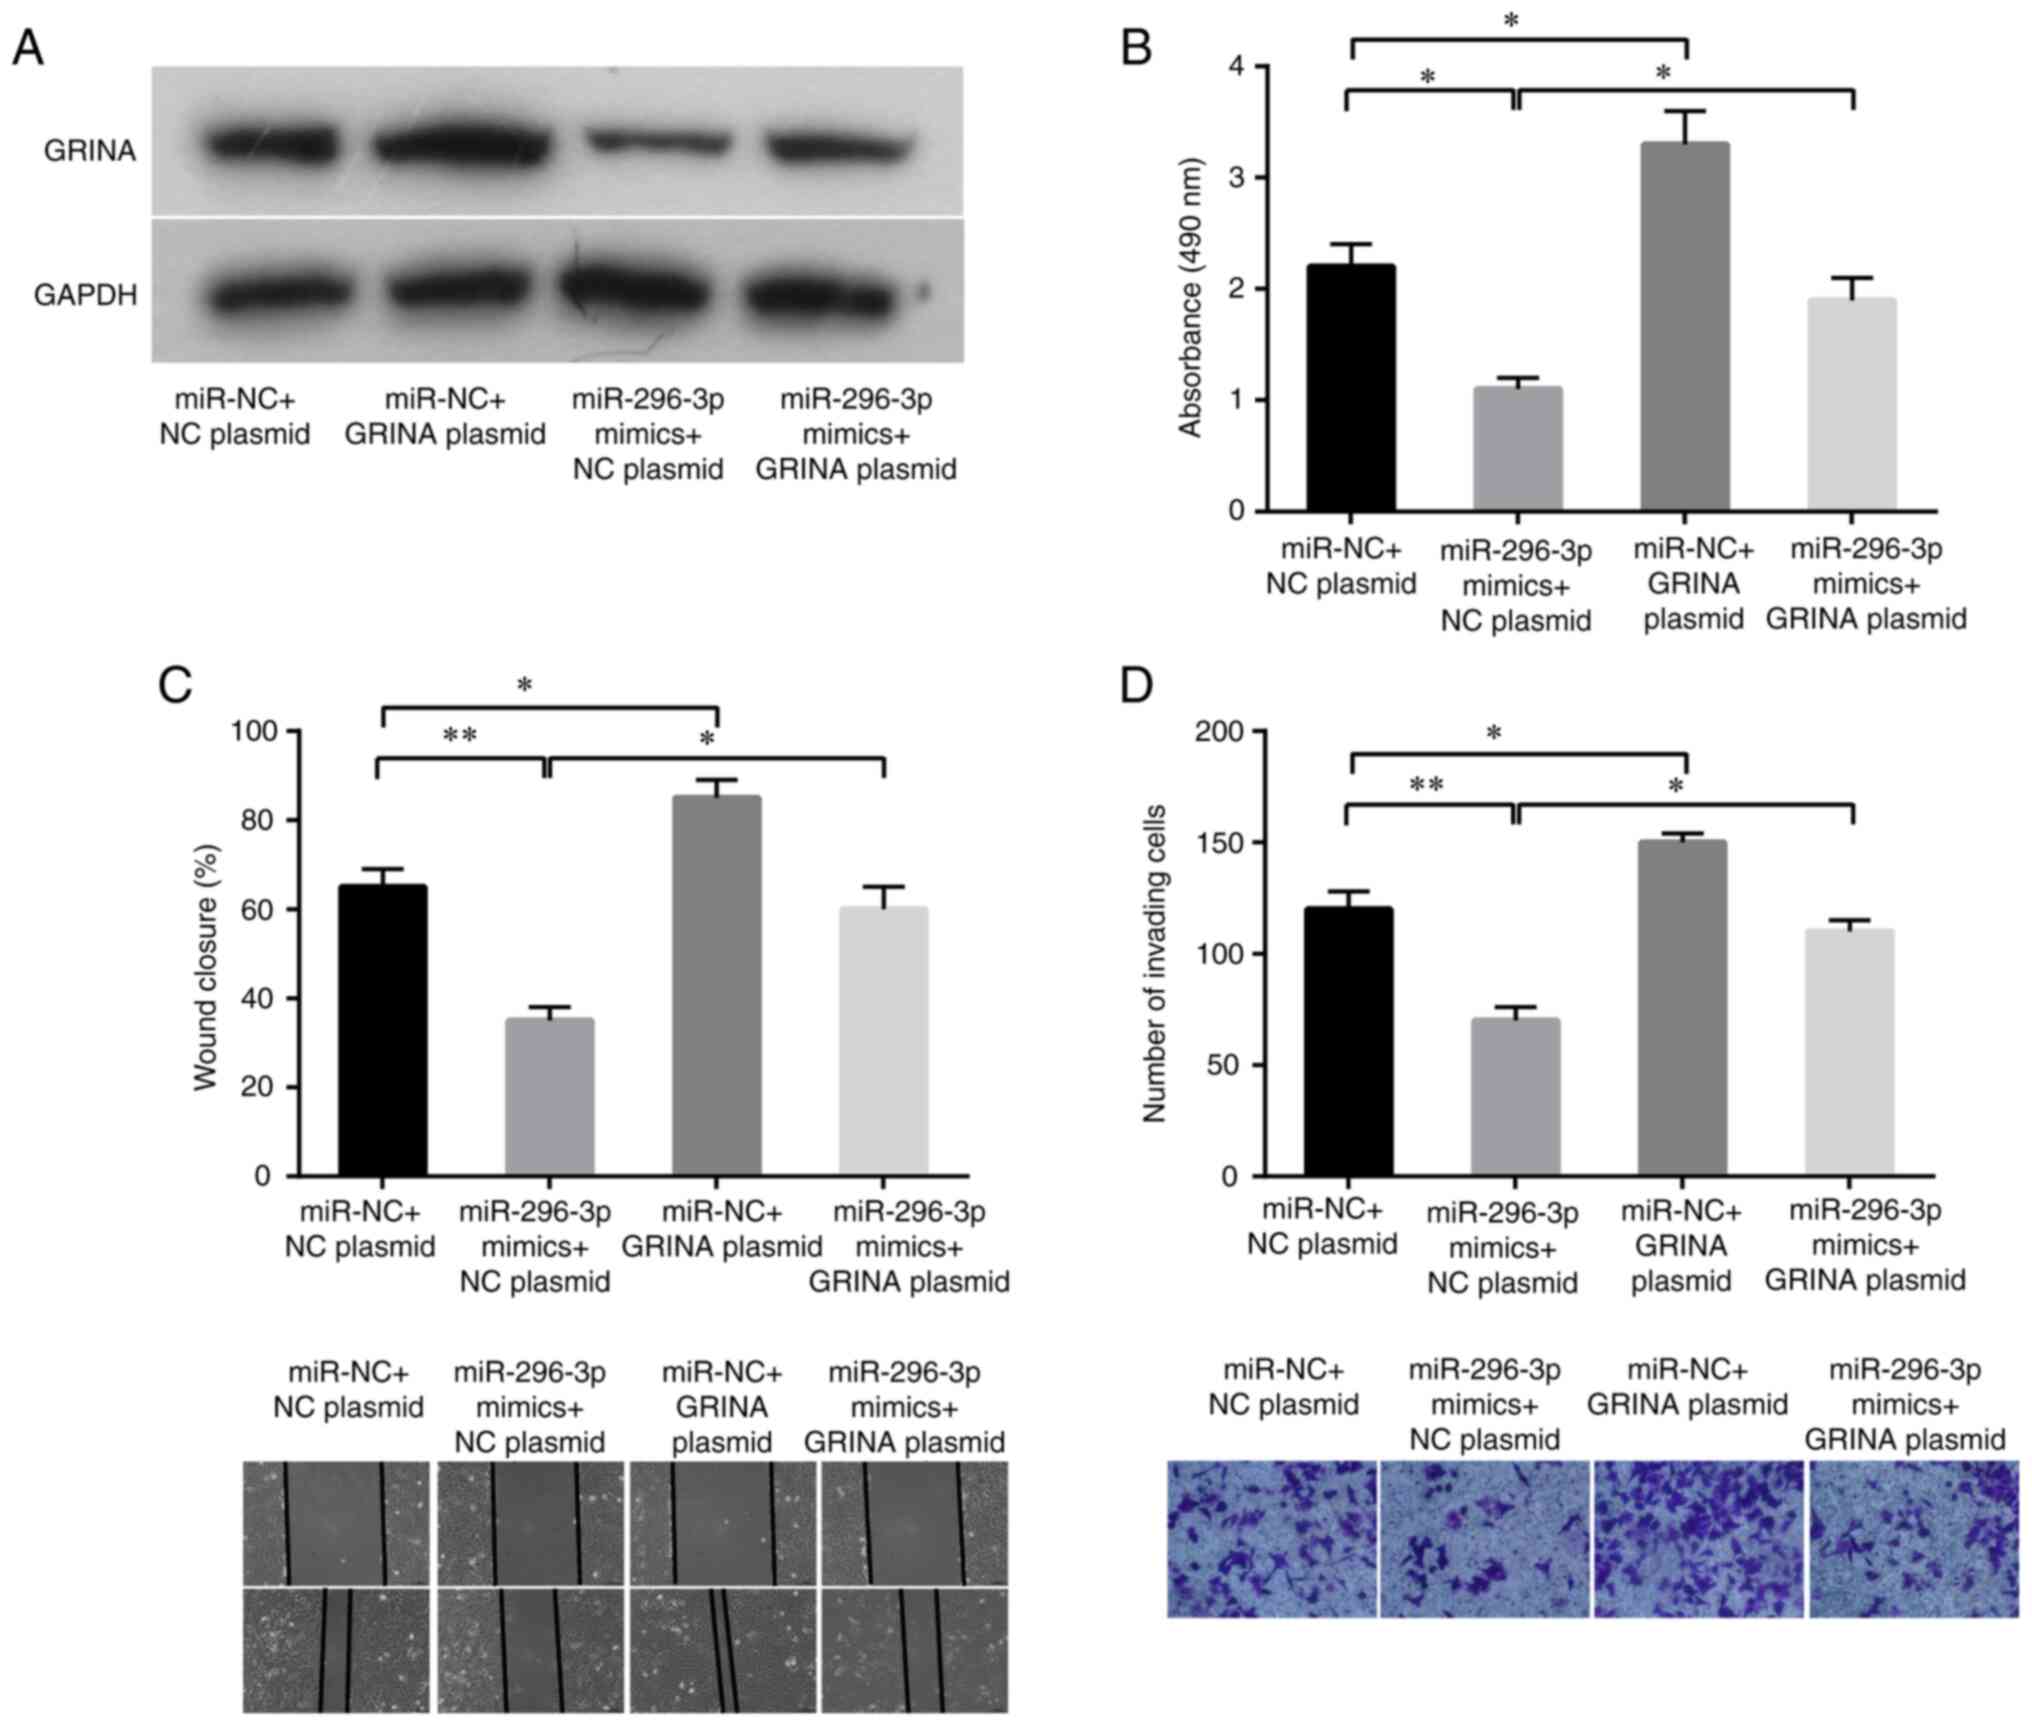
miR-296-3p suppresses CRC cell
proliferation and invasion via GRINA
To further investigate the roles of GRINA and
miR-296-3p in CRC cell proliferation, migration and invasion, a
pcDNA3.1-GRINA overexpression plasmid with no 3′-UTR or an empty
vector was transfected into LoVo cells with or without ectopic
expression of miR-296-3p in a rescue assay. GRINA relative mRNA and
protein expression levels were increased by transfecting LoVo cells
with pcDNA3.1-GRINA plasmid compared with its expression in the NC
plasmid group (Fig. S1). As shown
in Fig. 6A, the western blotting
results verified that GRINA expression was increased following
co-transfection with miR-296-3p mimics and pcDNA3.1-GRINA plasmid.
Conforming to target protein expression, miR-296-3p mimics also
significantly suppressed LoVo cell proliferation, migration and
invasion compared with the miR-NC+NC plasmid group (Fig. 6B-D). Compared with the control
cells, GRINA-overexpression LoVo cells displayed significantly
increased proliferation, migration and invasion (Fig. 6B-D). Moreover, simultaneous GRINA
and miR-296-3p overexpression partially decreased
miR-296-3p-mediated inhibition in LoVo cells (Fig. 6B-D). Therefore, the results
confirmed that GRINA was a target of miR-296-3p.
Discussion
Aberrant NMDAR expression has been detected in
several types of cancer, including oral squamous cell carcinoma
(OSCC), cutaneous squamous cell carcinoma, prostate cancer and GC
(17). NMDAR1 (a glutamate
receptor) expression in cutaneous squamous cell carcinoma is
significantly associated with cancer metastasis and differentiation
(18). In OSCC, NMDAR1 upregulation
is significantly associated with cancer stage, lymph node
metastasis and tumor size (19).
GRINA is a member of the NMDAR family that is also known as NMDARA1
(4). Xu et al (7) verified the upregulation GRINA in GC,
where its expression was positively associated with T stage, N
stage, distant metastasis, histological differentiation, blood
vessel invasion and perineuronal invasion.
In the present study, data from several databases
were used to analyze GRINA expression. GRINA expression was
increased in CRC tissues compared with that in healthy tissues. In
the recruited cohort, primary CRC samples displayed significantly
upregulated expression of GRINA at both the mRNA and protein levels
compared with the corresponding healthy samples. Furthermore, GRINA
expression levels were associated with age, TNM stage and lymphatic
invasion. Survival analysis demonstrated that upregulated GRINA
expression was associated with worse OS in patients with CRC. These
results were consistent with previous studies (7,18,19).
Collectively, these results highlighted the potential role of GRINA
in the development and progression of CRC.
Subsequently, the biological effects of GRINA on CRC
development were determined. GRINA expression levels were
significantly increased in CRC cells compared with those in normal
colonic cells. Additionally, GRINA overexpression increased CRC
cell proliferation, migration and invasion. GRINA also promoted the
growth and metastasis of xenograft tumors in nude mice. Similar
results have been observed with other NMDARs in previous studies
(20,21). For example, an NMDAR antagonist
suppressed cancer development by inhibiting the extracellular
signal-mediated kinase signaling pathway (20). Moreover, NMDAR NR2A subunit enhanced
human GC cell (MKN45) proliferation (21). These findings demonstrate that GRINA
may serve as an important oncogene in the development of CRC. SW480
tumorigenesis might be attributed to the APC and p53 signaling
pathway, whereas LoVo cells possess wild-type p53 and their
tumorigenesis might be attributed to the microsatellite instability
phenomenon (22,23). CRC cell lines were selected for the
overexpression (SW480) and knock down (LoVo) experiments based on
the endogenous expression of GRINA in these cells. The experiments
performed using these cells provided consistent results that
supported the hypothesis that GRINA promoted CRC development and
progression. However, whether the characteristics of these two
cells lines affects the specific mechanism of action of GRINA
requires further investigation.
Subsequently, the molecular mechanisms underlying
the effects of GRINA on mediating CRC progression were examined.
First, the mechanism underlying the upregulated expression of GRINA
in CRC was examined. GRINA is located on chromosome 8q24.3
(4), where the CNA is the leading
cause of tumorigenesis in GC (24).
By examining the CNAs in TCGA-CRC, the results demonstrated that
primary CRC samples displayed GRINA amplification. Furthermore,
upregulated GRINA mRNA expression was associated with
amplification. Additionally, it was shown that GRINA was regulated
by miR-296-3p. miR-296 is located on chromosome 20q13.32 and serves
a tumor suppressive role in pancreatic and cervical cancer via
regulating certain targets (25,26).
miR-296-5p targets S100 calcium binding protein A4 to suppress CRC
metastasis and epithelial-mesenchymal transition (15). Additionally, it was reported that
miR-296-5p suppresses cell growth and promotes apoptosis in CRC
cells via targeting arrestin b1-regulated activation of AKT
(16). miR-296-3p may be derived
the from the pre-miR-296 3′ arm (27). Consistent with previous studies, the
present study indicated that miR-296-3p may serve as a tumor
suppressor gene in CRC. However, further investigations are
required to verify the results of the present study
In the present study, luciferase reporter assays
were used to validate GRINA as a direct target of miR-296-3p.
miR-296-3p knockdown increased the expression levels of GRINA at
the mRNA and protein levels in CRC cells, whereas miR-296-3p
overexpression displayed the opposite effects. Additionally,
miR-296-3p expression levels were negatively correlated with GRINA
expression in the human CRC samples, and GRINA overexpression
partially abrogated miR-296-3p-mediated inhibitory effects on CRC
cells. Ma et al (28)
reported that GRINA increases rectal cancer cell proliferation,
invasion and migration, which may be regulated by miR-296-5p, which
was consistent with the results of the present study.
In conclusion, the present study demonstrated that
GRINA significantly increased CRC cell proliferation, invasion and
migration via miR-296-3p. These results may improve the current
understanding of the molecular mechanisms underlying the
progression and metastasis of CRC and highlight potentially novel
therapeutic targets for CRC. The miR-296-3p/GRINA axis should be
further investigated as a candidate therapeutic target in
anti-metastasis treatments for CRC. To the best of our knowledge,
there are currently no data on the use of NMDA/GRINA inhibitors for
CRC therapy, thus future studies should investigate this
further.
Supplementary Material
Supporting Data
Acknowledgements
Not applicable.
Funding
The present work was supported by the Sichuan Youth
Science and Technology Foundation (grant no. 2017JQ0039), the
Scientific and Technological Cooperation Project of Nanchong City
(grant no. 18SXHZ0577), the Key Scientific Project of The
Affiliated Hospital of North Sichuan Medical College (grant no.
19ZD004) and the Key Scientific Project of Sichuan health and
Health Committee (grant no. 19ZD005).
Availability of data and materials
The datasets used and/or analyzed during the current
study are available from the corresponding author on reasonable
request.
Authors' contributions
ZY, PL and YX designed the study, analyzed and
interpreted the data, and wrote the manuscript. HT analyzed and
interpreted the data. TZ and GZ analyzed and interpreted the data
and wrote the manuscript. All authors read and approved the final
manuscript. TZ and GZ confirm the authenticity of all the raw
data.
Ethics approval and consent to
participate
The present study was approved by the Medical Ethics
Committee of North Sichuan Medical College [approval no.
2021ER(A)006]. All patients provided written informed consent for
participation in the present study. The animal experiments were
approved by the Experimental Animal Ethics Committee of North
Sichuan Medical College (approval no. 20190907).
Patient consent for publication
Not applicable.
Competing interests
The authors declare that they have no competing
interests.
References
|
1
|
Troiani T, Zappavigna S, Martinelli E,
Addeo SR, Stiuso P, Ciardiello F and Caraglia M: Optimizing
treatment of metastatic colorectal cancer patients with anti-EGFR
antibodies: Overcoming the mechanisms of cancer cell resistance.
Expert Opin Biol Ther. 13:241–255. 2013. View Article : Google Scholar : PubMed/NCBI
|
|
2
|
Siegel RL, Miller KD and Jemal A: Cancer
statistics, 2017. CA Cancer J Clin. 67:7–30. 2017. View Article : Google Scholar : PubMed/NCBI
|
|
3
|
Chen W, Zheng R, Baade PD, Zhang S, Zeng
H, Bray F, Jemal A, Yu XQ and He J: Cancer statistics in China,
2015. CA Cancer J Clin. 66:115–132. 2016. View Article : Google Scholar : PubMed/NCBI
|
|
4
|
Collins C, Duff C, Duncan AM,
Planells-Case R, Sun W, Norremolle A, Michaelis E, Montal M, Worton
R and Hayden MR: Mapping of the human NMDA receptor subunit
(NMDAR1) and the proposed NMDA receptor glutamate-binding subunit
(NMDARA1) to chromosomes 9q34.3 and chromosome 8, respectively.
Genomics. 17:237–239. 1993. View Article : Google Scholar : PubMed/NCBI
|
|
5
|
North WG, Gao G, Memoli VA, Pang RH and
Lynch L: Breast cancer expresses functional NMDA receptors. Breast
Cancer Res Treat. 122:307–314. 2010. View Article : Google Scholar : PubMed/NCBI
|
|
6
|
North W, Liu F, Tian R, Abbasi H and
Akerman B: NMDA receptors are expressed in human ovarian cancer
tissues and human ovarian cancer cell lines. Clin Pharmacol.
7:111–117. 2015.PubMed/NCBI
|
|
7
|
Xu DH, Li Q, Hu H, Ni B, Liu X, Huang C,
Zizhen ZZ and Zhao G: Transmembrane protein GRINA modulates aerobic
glycolysis and promotes tumor progression in gastric cancer. J Exp
Clin Cancer Res. 37:3082018. View Article : Google Scholar : PubMed/NCBI
|
|
8
|
Gehlenborg N, Noble MS, Getz G, Chin L and
Park PJ: Nozzle: A report generation toolkit for data analysis
pipelines. Bioinformatics. 29:1089–1091. 2013. View Article : Google Scholar : PubMed/NCBI
|
|
9
|
Goldman MJ, Craft B, Hastie M, Repečka K,
McDade F, Kamath A, Banerjee A, Luo Y, Rogers D, Brooks AN, et al:
Visualizing and interpreting cancer genomics data via the xena
platform. Nat Biotechnol. 38:675–678. 2020. View Article : Google Scholar : PubMed/NCBI
|
|
10
|
Rhodes DR, Yu J, Shanker K, Deshpande N,
Varambally R, Ghosh D, Barrette T, Pandey A and Chinnaiyan AM:
ONCOMINE: A cancer microarray database and integrated data-mining
platform. Neoplasia. 6:1–6. 2004. View Article : Google Scholar : PubMed/NCBI
|
|
11
|
Uhlén M, Fagerberg L, Hallström BM,
Lindskog C, Oksvold P, Mardinoglu A, Sivertsson Å, Kampf C,
Sjöstedt E, Asplund A, et al: Proteomics. Tissue-based map of the
human proteome. Science. 347:12604192015. View Article : Google Scholar : PubMed/NCBI
|
|
12
|
Fan XJ, Wan XB, Yang ZL, Fu XH, Huang Y,
Chen DK, Song SX, Liu Q, Xiao HY, Wang L and Wang JP: Nail promotes
lymph node metastasis and twist enhances tumor deposit formation
through epithelial-mesenchymal transition in colorectal cancer. Hum
Pathol. 44:173–180. 2013. View Article : Google Scholar : PubMed/NCBI
|
|
13
|
Livak KJ and Schmittgen TD: Analysis of
relative gene expression data using real-time quantitative PCR and
the 2(-Delta Delta C(T)) method. Methods. 25:402–408. 2001.
View Article : Google Scholar : PubMed/NCBI
|
|
14
|
Xuan Y, Yang H, Zhao L, Lau WB, Lau B, Ren
N, Hu Y, Yi T, Zhao X, Zhou S and Wei Y: MicroRNAs in colorectal
cancer: Small molecules with big functions. Cancer Lett.
360:89–105. 2015. View Article : Google Scholar : PubMed/NCBI
|
|
15
|
He Z, Yu L, Luo S, Li M, Li J, Li Q, Sun Y
and Wang C: miR-296 inhibits the metastasis and
epithelial-mesenchymal transition of colorectal cancer by targeting
S100A4. BMC Cancer. 17:1402017. View Article : Google Scholar : PubMed/NCBI
|
|
16
|
Zhang Z, Zhong X, Xiao Y and Chen C:
MicroRNA-296 inhibits colorectal cancer cell growth and enhances
apoptosis by targeting ARRB1-mediated AKT activation. Oncol Rep.
41:619–629. 2018.PubMed/NCBI
|
|
17
|
Kalariti N, Pissimissis N and Koutsilieris
M: The glutamatergic system outside the CNS and in cancer biology.
Expert Opin Investig Drugs. 14:1487–1496. 2005. View Article : Google Scholar : PubMed/NCBI
|
|
18
|
Kang M, Cho JH, Koo JK, Noh SU, Kim MY,
Kang H, Oh ST, Kim HO and Park YM: The expression of NMDA receptor
1 correlates with clinicopathological parameters in cutaneous
squamous cell carcinoma. Ann Dermatol. 21:382–388. 2009. View Article : Google Scholar : PubMed/NCBI
|
|
19
|
Choi SW, Park SY, Hong SP, Pai H, Choi JY
and Kim SG: The expression of NMDA receptor 1 is associated with
clinicopathological parameters and prognosis in the oral squamous
cell carcinoma. J Oral Pathol Med. 33:533–537. 2004. View Article : Google Scholar : PubMed/NCBI
|
|
20
|
Stepulak A, Sifringer M, Rzeski W,
Endesfelder S, Gratopp A, Pohl EE, Bittigau P, Felderhoff-Mueser U,
Kaindl AM, Bührer C, et al: NMDA antagonist inhibits the
extracellular signal-regulated kinase pathway and suppresses cancer
growth. Proc Natl Acad USA. 102:15605–15610. 2005. View Article : Google Scholar : PubMed/NCBI
|
|
21
|
Watanabe K, Kanno T, Oshima T, Miwa H,
Tashiro C and Nishizaki T: The NMDA receptor NR2A subunit regulates
proliferation of MKN45 human gastric cancer cells. Biochem Biophys
Res Commun. 367:487–490. 2008. View Article : Google Scholar : PubMed/NCBI
|
|
22
|
Rochette PJ, Bastien N, Lavoie J, Guérin
SL and Drouin R: SW480, a p53 double-mutant cell line retains
proficiency for some p53 functions. J Mol Biol. 352:44–57. 2005.
View Article : Google Scholar : PubMed/NCBI
|
|
23
|
Bras-Gonçalves RA, Rosty C, Laurent-Puig
P, Soulié P, Dutrillaux B and Poupon MF: Sensitivity to CPT-11 of
xenografted human colorectal cancers as a function of
microsatellite instability and p53 status. Br J Cancer. 82:913–923.
2000. View Article : Google Scholar : PubMed/NCBI
|
|
24
|
Song K, Kim RN, Jeon S, Kim HI, Choi YL
and Shin YK: Abstract 5171: An integrated analysis of copy number
alteration and global gene expression reveals potential oncogenes
underlying stomach cancer. Cancer Res. 74:51712014.
|
|
25
|
Lv L and Wang X: MicroRNA-296 targets
specificity protein 1 to suppress cell proliferation and invasion
in cervical cancer. Oncol Res. 26:775–783. 2017. View Article : Google Scholar : PubMed/NCBI
|
|
26
|
Li H, Li J, Shi B and Chen F: MicroRNA-296
targets AKT2 in pancreatic cancer and functions as a potential
tumor suppressor. Mol Med Rep. 16:466–472. 2017. View Article : Google Scholar : PubMed/NCBI
|
|
27
|
Li H, Ouyang XP, Jiang T, Zheng XL, He PP
and Zhao GJ: MicroRNA-296: A promising target in the pathogenesis
of atherosclerosis? Mol Med. 24:122018. View Article : Google Scholar : PubMed/NCBI
|
|
28
|
Ma H, Zhang X, Li N, Lu X, Wei Y, Yuan N,
Tian G and Li S: Glutamate receptor, ionotropic, N-methyl
D-aspartate-associated protein 1, a potential target of miR-296,
facilitates proliferation and migration of rectal cancer cells.
Biosci Biotech Bioch. 84:2077–2084. 2020. View Article : Google Scholar : PubMed/NCBI
|