Introduction
Intracerebral hemorrhage (ICH) refers to cerebral
parenchymal hemorrhage caused by spontaneous rupture of cerebral
blood vessels. It is one of the subtypes of cerebral apoplexy,
accounting for 20–30% of all cerebral apoplexy in China (1,2). ICH
is a common disorder in the field of neurology. The treatment
methods available for ICH, such as intravenous mannitol, remain
limited, and the mortality rate of the acute stage is 30–40%. The
majority of survivors exhibit sequelae, such as dyspraxia,
cognitive impairment and speech and deglutition disorder (2,3). The
high mortality and disability rates (~40% and 90%) associated with
this disease are costly in terms of the pain and burden caused to
both families and society (3,4). As
the population ages worldwide, the harm caused by ICH becomes
increasingly acute (4,5).
Current research suggests that ICH not only
comprises primary lesions caused by hematoma (for example, hematoma
formation and the placeholder effect of expansion, which cause
direct damage to tissue around the hematoma), but also includes
toxic substances triggered by the burst of erythrocytes, high
metabolic state, spreading depression, oxidative stress, toxic
effects of excitatory amino acids and inflammation of the tissue
surrounding the hematoma, which causes secondary damage (6–8). The
secondary neuronal damage caused by ICH contributes towards
neurological impairment, which manifests as neuronal apoptosis and
glial activation and proliferation (9,10).
Similarly to ‘ischemic penumbra’ in cerebral infarction, the tissue
around the hematoma is provisionally termed a perihematoma
‘microenvironment’, due to the lack of a definite definition. With
ongoing pathological damage, these cells gradually die or undergo
proliferation and activation, thereby aggravating neurological
function defects and resulting in death of the tissue (11,12).
With the completion of the Human Genome Project, the
number of known gene sequences has been growing at an unprecedented
rate. Traditional experimental methods, such as de novo
protein sequencing, have been unable to systematically interpret
the increasing amount of gene sequence information (13). Gene chip technology, also known as
DNA chip or microarray, which was developed in the late 1980s, aims
to study polymorphism and expression changes of numerous genes in a
variety of physiological and pathological contexts for
high-throughput analysis to assess their function, interaction and
regulatory association (14–16).
Investigation of both the molecular mechanisms underpinning changes
in the perihematoma microenvironment following ICH and the
regulatory associations of the molecular protein network will
provide better understanding of the pathological mechanisms
underlying ICH, thereby assisting in the development of drugs for
use in the clinic and therapeutic intervention strategies.
Materials and methods
Animals and reagents
A total of 80 male specific-pathogen-free
Sprague-Dawley rats (age, 8–9 weeks; weight, 220–260 g; mean
weight, 240 g) were obtained from the Department of Animal Center,
Medical College of Nantong University. All animals were raised in a
temperature- and humidity-controlled room (22±1°C; 55–65%) with a
12-h light/dark cycle and food and water were available ad
libitum. Primary antibodies against pro caspase-3 (cat. no.
ab32499), cleaved caspase-3 (cat. no. ab32042), NeuN (cat. no.
ab279290), ret proto-oncogene (RET; cat. no. ab134100) and
β-tubulin (cat. no. ab18207), secondary goat anti-rabbit IgG
H&L (cat. no. ab6721) and rabbit anti-mouse IgG (cat. no.
ab6728) and Hoechst 33342 Staining Dye Solution (cat. no. ab228551)
were purchased from Abcam. The ECL Western Blot Substrate (cat. no.
ab65623) were purchased from Abcam. The secondary Alexa
Fluor®−488 (anti-mouse; cat. no. A-11029) and Alexa
Fluor®−568 (anti-rabbit; cat. no. A-11036) antibodies
were purchased from Thermo Fisher Scientific, Inc. The BCA protein
quantitation kit, tissue total protein lysis buffer, PMSF and
fluorescent sealing solution were from Beyotime Institute of
Biotechnology; PVDF membrane and protease inhibitor were from Roche
Diagnostics. Blotting paper was purchased from Bio-Rad
Laboratories, Inc.
Construction of the ICH model and
animal grouping
ICH model rats were anesthetized intraperitoneally
with sodium pentobarbital (30 mg/kg). The body position of the rats
was straightened, and the head was fixed. The top of the head was
locally prepared and routinely disinfected (17). A central sagittal incision of ~1.5
cm was made on the top of the head to expose the skull. The caudate
nucleus was located on one side of the brain by stereotactic
localization (the fontanelle was used as the reference median
point; forward, 0.2; lateral, 3.5; depth, 5.5 mm) and the return
needle was 0.5 mm. For the operation group, 50 µl autogenous blood
was injected at a rate of 10 µl/min; for the sham operation group,
the same method was used to insert the needle but without
injection. The needle was retained for 10 min and sutured.
Rats were randomly divided into normal (control),
sham and post-ICH groups (6 and 12 h, and 1, 2, 3, 5, 7 and 9 days;
these times refer to the time points after the intracerebral
hemorrhage and at these time points the behavioral experiments and
tissue extraction were performed; n=6 rats/group). At the end of
the study, rats were anesthetized by intraperitoneal injection of
sodium pentobarbital (30 mg/kg) until they lost consciousness. All
animals were sacrificed following anesthesia by exsanguination.
Forelimb placing test
The trunk of the rat was suspended, and the
forelimbs were allowed to move freely. The whiskers on one side of
the rat were quickly brushed. When the forelimb of the same side
reflexively extended to the corner of the table, one point was
recorded. The two forelimbs of each rat were tested 10 times each.
The lower the score, the more severe was the impairment of nerve
function, as shown by the difficulty of forelimb placement on the
opposite side of the injury following ICH (18).
Corner turn test
Two pieces of wood were fixed to form an included
angle of 30°. After entering the included angle, rats were able to
exit by turning left or right, and the data were recorded. The
experiment was repeated 10–15 times for each rat, with a time
interval of ≥30 sec between repeats, and the number of left or
right turns was calculated. Under normal circumstances, rats are
equally likely to turn left or right; however, rats are more
inclined to turn to the injured side than to the opposite side
following ICH (19).
Western blot analysis
Brain tissue was collected from the perihematoma
region (distance, ≤3 mm), and protein lysate (1 ml/100 mg) was
added. The compound was homogenized at 4°C and centrifuged (12,000
× g for 10 min) following 30 min incubation on ice. Subsequently,
the supernatant was removed, and the protein concentration was
determined via the BCA method. A small amount of supernatant (~50
µl) was divided into EP tubes and stored at −80°C. For western
blotting analysis, 10 µg total protein was resolved by SDS-PAGE on
10% gels and then transferred onto PVDF membranes. Skimmed milk
powder blocking solution (5%) was then added to the prepared films,
and the membranes were shaken at room temperature for 2 h (or
overnight at 4°C). After sealing the membrane, the corresponding
primary antibody was incubated at 4°C with the membrane, which was
allowed to rest at room temperature for 8–10 h, or at 4°C
overnight. The dilution factor of cleaved-caspase3 was 1:500; RET
and GAPDH were both 1:1,000. The membrane was subsequently
incubated with the secondary antibody (1:10,000), the plate was
flipped at room temperature for 1 h and the films were developed
using ECL. GAPDH was used as the loading control. ImageJ v1.8.0.112
(National Institutes of Health) was used for densitometry.
Immunohistochemistry
At the aforementioned time points following the
construction of the ICH model, tissue was fixed in 4%
paraformaldehyde at 4°C for 12 h. Subsequently, the fixed tissue
was dehydrated with 20–30% sucrose solution sequentially (20% for 1
day, then 30% for 1 day). When the tissue had sunk to the bottom of
the bottle, the tissue was removed and placed on a frozen slicer
with 5% sucrose solution or OCT as an embedding agent at −20°C.
Coronal section of the brain was performed, and the thickness of
the slices was 5 µm. The frozen sections were attached to adhesive
slides, marked and stored at 4°C for later use. The tissue sections
were washed 3 times with PBS (10 min each). The sealing solution
(5% BSA) was added and placed in a wet box for incubation at 37°C
for 30 min. The solution was discarded, and primary cleaved
caspase-3 (1:100; cat. no. ab32042), NeuN (1:1,000; cat. no.
ab279290) and RET (1:100; cat. no. ab134100; all Abcam) antibodies
were added and incubated overnight at 4°C. The sections were again
washed 3 times with PBS (10 min each). The secondary antibody was
subsequently added and incubated either at room temperature for 2 h
or at 4°C overnight (both of these methods can be used to incubate
the secondary antibodies, and the appropriate method can be chosen
according to the arrangement of experiment time). The sections were
washed 3 times with PBS (10 min each). Nuclear dye (1:1,000;
Hoechst 33342) was added, and the tissue sections were incubated at
room temperature for 10 min. The sections were washed again three
times with PBS (10 min each). Water droplets were absorbed from the
surface, and the fluorescent sealing solution was added carefully
to ensure that there were no bubbles. After standing at room
temperature for 2 h in the dark, each section was observed and
recorded under a laser confocal microscope (magnification, ×4, ×10,
×20, ×40 and ×100). ImageJ v1.8.0.112 (National Institutes of
Health) was used for analysis.
RNA extraction and microarray
hybridization in rat brain tissue
Gene-chip hybridization and data-reading experiments
were performed by CapitalBio Technology. The RNA purity (measured
as the absorbance ratio A260/A280) was ≥1.80; total RNA was ≥1 µg;
RNA integrity was detected by formaldehyde denaturing gel
electrophoresis, and the electrophoretic band of the RNA sample was
found to be clear; 28S:18S ribosomal RNA band brightness ratio was
≥1:1 and the quality of the RNA met the requirements of the
expression profile chip. In accordance with the manufacturer's
instructions, the hybridization was performed in an Agilent
Hybridization Oven overnight at a rotation speed of 20 rpm at 42°C.
An Agilent Microarray Scanner was used to scan the chip images,
which were subsequently analyzed using Agilent image analysis
software (GeneSpring software v12; Agilent Technologies, Inc.).
Bioinformatics analysis
After it had been confirmed that the quality of RNA
resulting from each chip experiment was consistent, the RNA with
significant differences in expression (log2≥1 or ≤-1 and P<0.05)
was screened using the calibration F test. Principal component
analysis (PCA) of differentially expressed genes was then performed
(http://bonsai.hgc.jp/~mdehoon/software/cluster/software.htm).
Hierarchical clustering was used to compare genes with the control
group to identify approximate relational classification (different
pathways in which different genes are expressed) of up- and
downregulated genes [Cluster 3.0 (https://cluster2.software.informer.com/3.0/) and Java
Treeview (http://jtreeview.sourceforge.net/)] (20). Gene set enrichment analysis (GSEA)
was performed by applying GSEA v2.2.3 to the Entrez Gene ID of
these genes. Functional classification of differentially expressed
genes was performed using Gene Ontology (GO) and Pathways (IPA)
analyses. A link diagram of the pictorial information transmission
path was constructed using the Kyoto Encyclopedia of Genes and
Genomes (KEGG) database. Differentially expressed genes associated
with neurological disease were screened for ICH. IPA was used to
analyze differences in genes. PANTHER (the Protein Annotation
Through Evolutionary Relationship) was used to analyze
differentially expressed genes. Venny 2.1.0 software was used to
compare the 15 selected differentially expressed genes.
Reverse transcription-quantitative
(RT-q)PCR
The sequences of the primers used in the present
analysis are shown in Table I. For
tissue total RNA extraction, the brain tissue surrounding the
frozen hematoma (distance, 3 mm) was extracted and weighed, placed
into a 1.5 ml RNase-free EP tube and 1 ml TRIzol®
(Invitrogen; Thermo Fisher Scientific, Inc.) was added to the
homogenizer for homogenization on ice. The process was allowed to
proceed at a low temperature, and the tissue was left on ice for 30
min for lysis. Chloroform (200 µl) was added, and the tissue was
shaken for 15 sec, before being allowed to stand at room
temperature for 2 min. Centrifugation was performed at 13,000 × g
at 4°C for 15 min. Supernatant (300 µl) was separated and an equal
volume of isopropanol (300 µl) was added, before the mixture was
allowed to rest for 10 min following gentle mixing. The tissue was
centrifuged at 13,000 × g at 4°C for 10 min, and the supernatant
was then carefully discarded. The precipitate was carefully washed
with 1 ml RNase-free 75% ethanol, and centrifuged again at 13,000 ×
g at 4°C for 15 min. After drying the precipitate,
diethylpyrocarbonate-treated water (40 µl) was added to promote
dissolution at 65°C for 10–15 min. The optical density value and
concentration of RNA were measured. RNA was stored at −80°C for
later use.
 | Table I.Primer sequences. |
Table I.
Primer sequences.
| Primer | Sequence,
5′-3′ |
|---|
| COMT | F:
AGAATGCAAAGCCTGGAGAC |
|
| R:
GCTGTACTCCCGAATCACTG |
| KIT | F:
CCATCAAAGCTATCCCAGTGG |
|
| R:
ACCGTAAATGTGTCCCCTTC |
| SPP1 | F:
GGTTTGCTTTTGCCTGTTCG |
|
| R:
CTGAGTGTTTGCTGTAATGCG |
| HPN | F:
GGGTTCAGGCTGTGATCTATC |
|
| R:
CGGCTGGATGTATTCTGTGAG |
| RET | F:
CCTTCTACCAGTTCCGCATG |
|
| R:
CCGTCCCCTTCTAAGAGTTTG |
| DUSP9 | F:
CCCTAACCTTCCTAACCTCTTTG |
|
| R:
AGATTCTGGCTCCAATGATCAG |
| PKP2 | F:
GCAGACTTAGAGATGACCTTGG |
|
| R:
ACCCTTTTCCGTGCTTCAG |
| HOMER3 | F:
GCTACGAAGAGGAACTGGATTC |
|
| R:
TGAAGGTCATGTTGGGAGTG |
| KALRN | F:
CCCAAAACACCAGCCAAAC |
|
| R:
GTCACTCTCCACTGTGTTCTG |
| CNKSR2 | F:
CAACACCAAAACAAGACAGCC |
|
| R:
GGACTGGCACAACTCATAGAG |
| BAIAP2L1 | F:
CTACTTCTACCTTCAAAGCCCC |
|
| R:
ATCGGTCATTGGTCACTGTC |
| TFAP2B | F:
CTGGGCTCTGTGTCTCAAG |
|
| R:
GAGTACGGGTCTTGACTTTGG |
| SNCA | F:
CTGCCACTGGTTTTGTCAAG |
|
| R:
CTTCCAGGATTCCCTCTTGTG |
| PPIA | F:
CAAGACTGAGTGGCTGGATG |
|
| R:
GGCTTCCACAATGCTCATG |
| SHOC2 | F:
CCTTTGGATTTTGGAACTTGGAC |
|
| R:
AGAGAAACAAGACCAGACACG |
| β-actin | F:
CAACTGGGACGATATGGAGAAG |
|
| R:
TCTGGGTCATCTTTTCACGG |
A HisScript® II First Strand cDNA
Synthesis kit (+gDNA wiper) was used to reverse transcribe 500 ng
RNA into complementary (c)DNA on ice. The cDNA obtained by reverse
transcription was subjected to RT-qPCR in accordance with the
instructions of the AceQ® qPCR SYBR® Green
Master Mix kit (Vazyme Biotech Co., Ltd.).
Multiple wells in triplicate were set up for each
PCR reaction. After the amplification program, the dissolution and
amplification curves were analyzed and the maximum-error term was
excluded. The thermocycling conditions are shown in Table II. The PCR yield was calculated
using the 2−ΔΔCq method (21). The internal reference was
β-actin.
| Table II.Thermocycling conditions used for
PCR. |
Table II.
Thermocycling conditions used for
PCR.
| Stage | Cycles | Temperature,
°C | Duration |
|---|
| Initial
denaturation | 1 | 95 | 5 min |
| Thermocycling | 40 | 95 | 10 sec |
|
|
| 60 | 30 sec |
| Solubility
curve | 1 | 95 | 15 sec |
|
|
| 60 | 60 sec |
|
|
| 95 | 15 sec |
Hematoxylin and eosin (H&E)
staining
Histopathologic changes of the perihematoma in the
striatum area were studied using H&E (Beyotime Institute of
Biotechnology) staining in rats at 2 and 7 days post-ICH. Following
fixation in 4% paraformaldehyde at 4°C for 12 h, the sections (5
µm) were stained in hematoxylin solution for 30 sec and eosin
solution for 1 min at room temperature. Following gradient
dehydration, the slides were further cleared with xylene and
coverslipped with neutral gum.
Statistical analysis
All data are expressed as the mean ± SD. Each
experiment was repeated six times. Pairwise comparisons were
performed using unpaired Student's t test and one-way ANOVA was
conducted for comparisons among multiple groups, followed by post
hoc Bonferroni's correction. All statistical analyses were
performed using SPSS version 15.0 software (SPSS, Inc.). Pearson
correlation coefficient analysis was used to compare different
samples. Circos (http://circos.ca/) was used for
plotting. P<0.05 was considered to indicate a statistically
significant difference.
Results
Changes in neuronal function and
pathological changes in rats following ICH
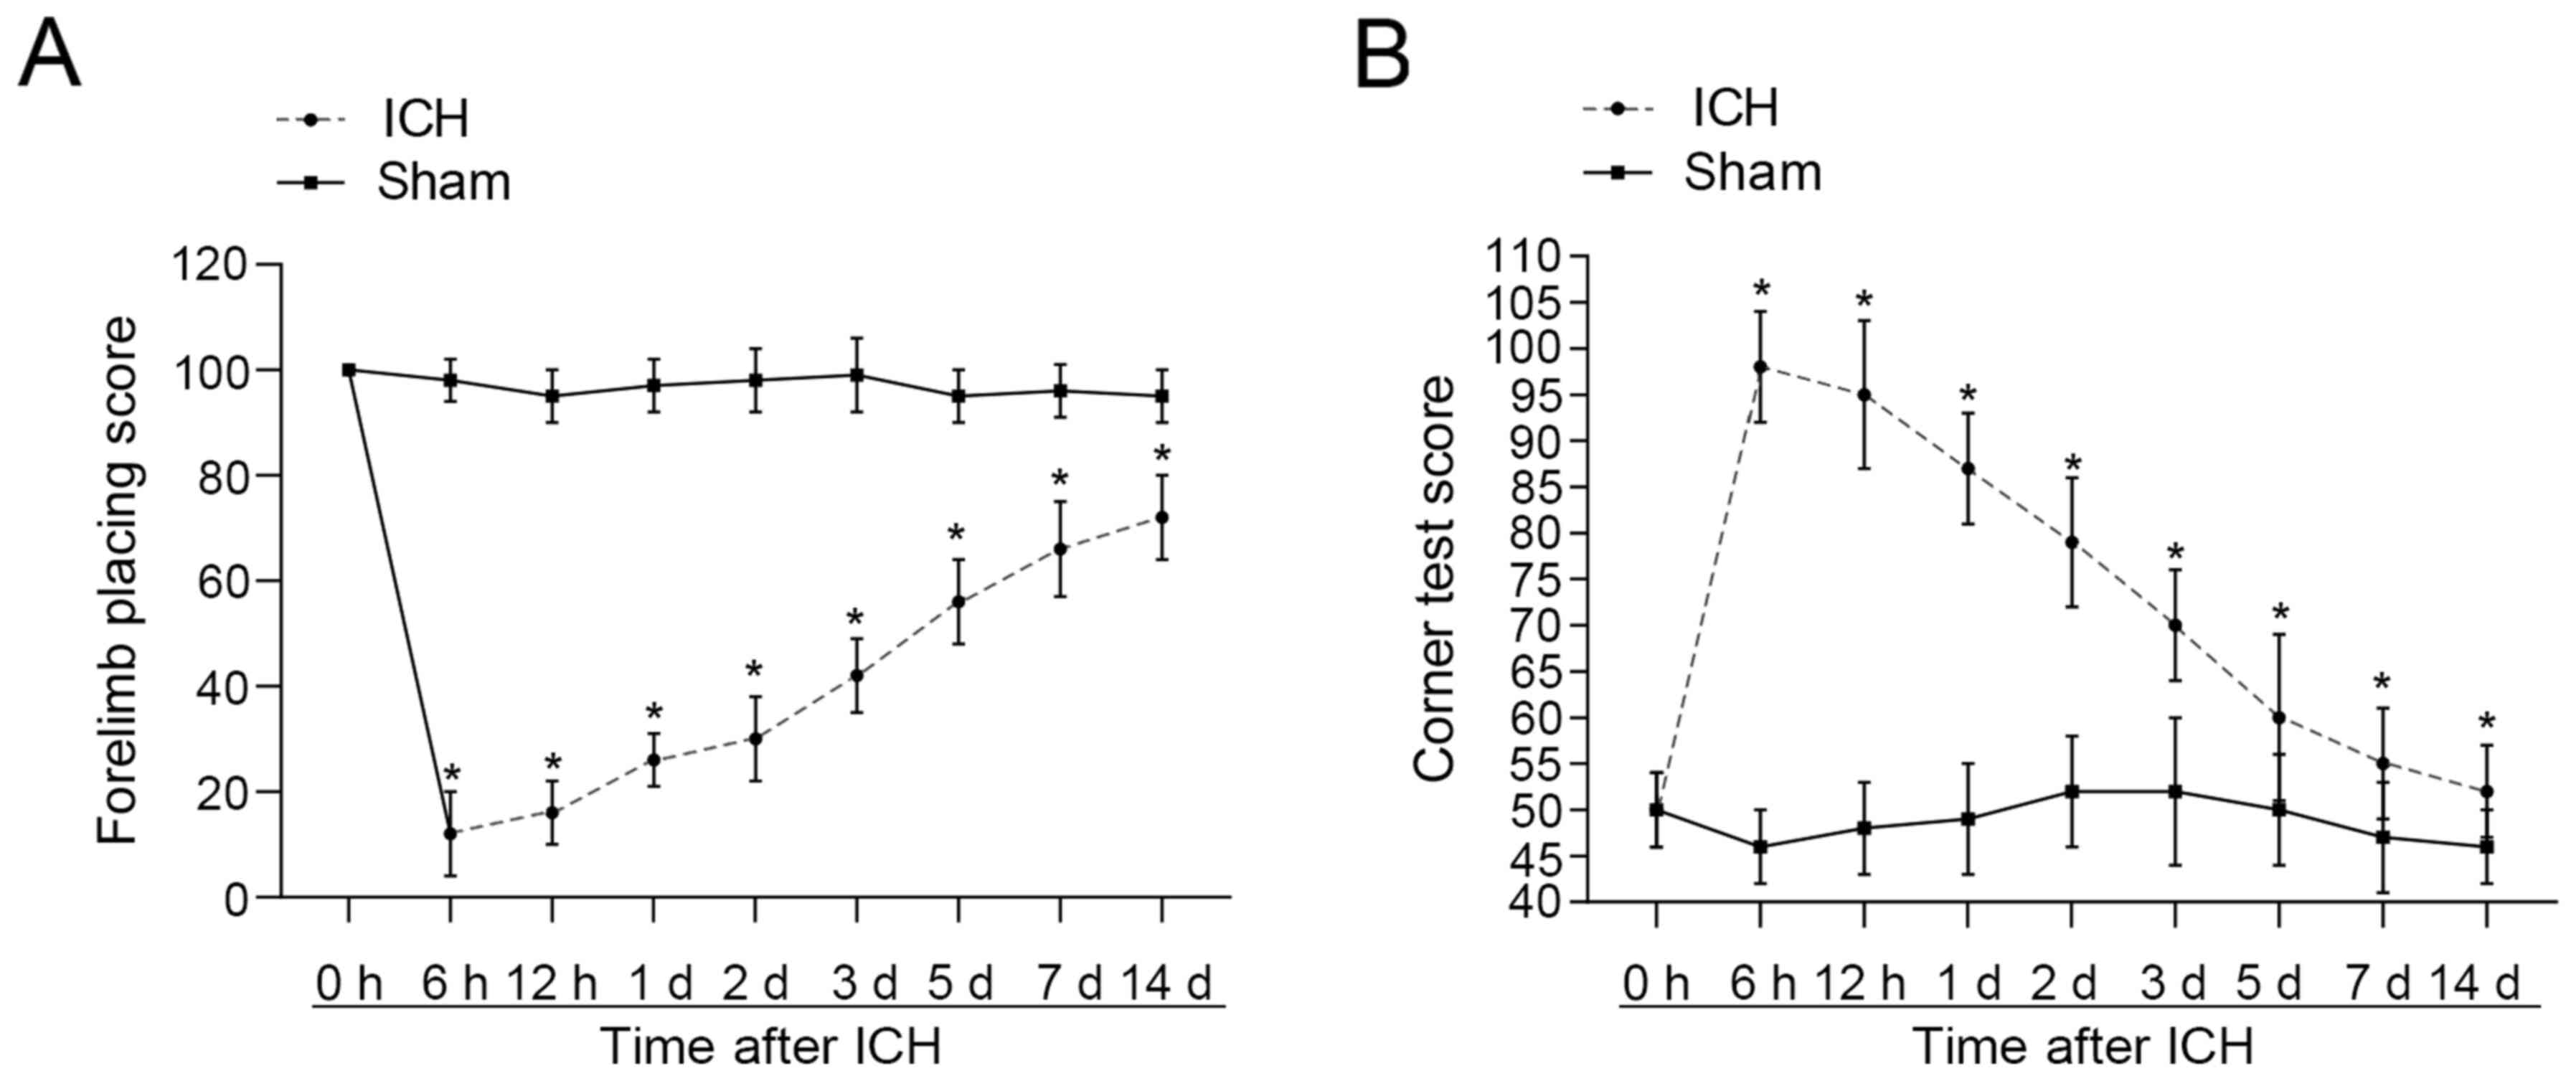
In a previous study, it had been demonstrated that
ICH peaks at day 2 post-surgery (20). Forelimb placement and corner turn
tests were used in the present study to determine the success of
the ICH model. Neurological dysfunction was most severe at 6 h
post-ICH, before improving (Fig. 1A and
B). At day 7 post-ICH, there was still a significant difference
in neurological function of the ICH-induced rats compared with the
sham group. The graph shows differences were significant throughout
the entire period. This demonstrated that the ICH model had been
constructed successfully. Since the death of neurons in the
peripheral hematoma region following ICH causes severe functional
impairment, levels of caspase-3 and cleaved caspase-3 were examined
as indicators of neuronal apoptosis in the peripheral hematoma
region (22). Expression of cleaved
caspase-3 in the sham group was low, although the expression level
increased following ICH, reaching a peak on day 2 post-ICH, before
the expression levels were downregulated (Fig. 2). Compared with the sham group
(2C-F), the levels of cleaved caspase-3 in the peripheral hematoma
region at 2 days post-ICH were markedly high (Fig. 2G-J). Additionally, elevated levels
of cleaved caspase-3 were primarily co-located with the neurons,
which confirmed that the increase in activation of cleaved
caspase-3 in the peripheral hematoma region was primarily
associated with the apoptosis of neurons (Fig. 2G-J). At 2 days post-ICH in rats, the
hematoma was elliptic, and there was also clear edema of
surrounding tissue, as shown by H&E staining (Fig. S1). This also revealed that the
severest stage of neurological impairment occurred on day 2
post-ICH.
Detection of gene expression profile
in perihematoma tissue following ICH in rats
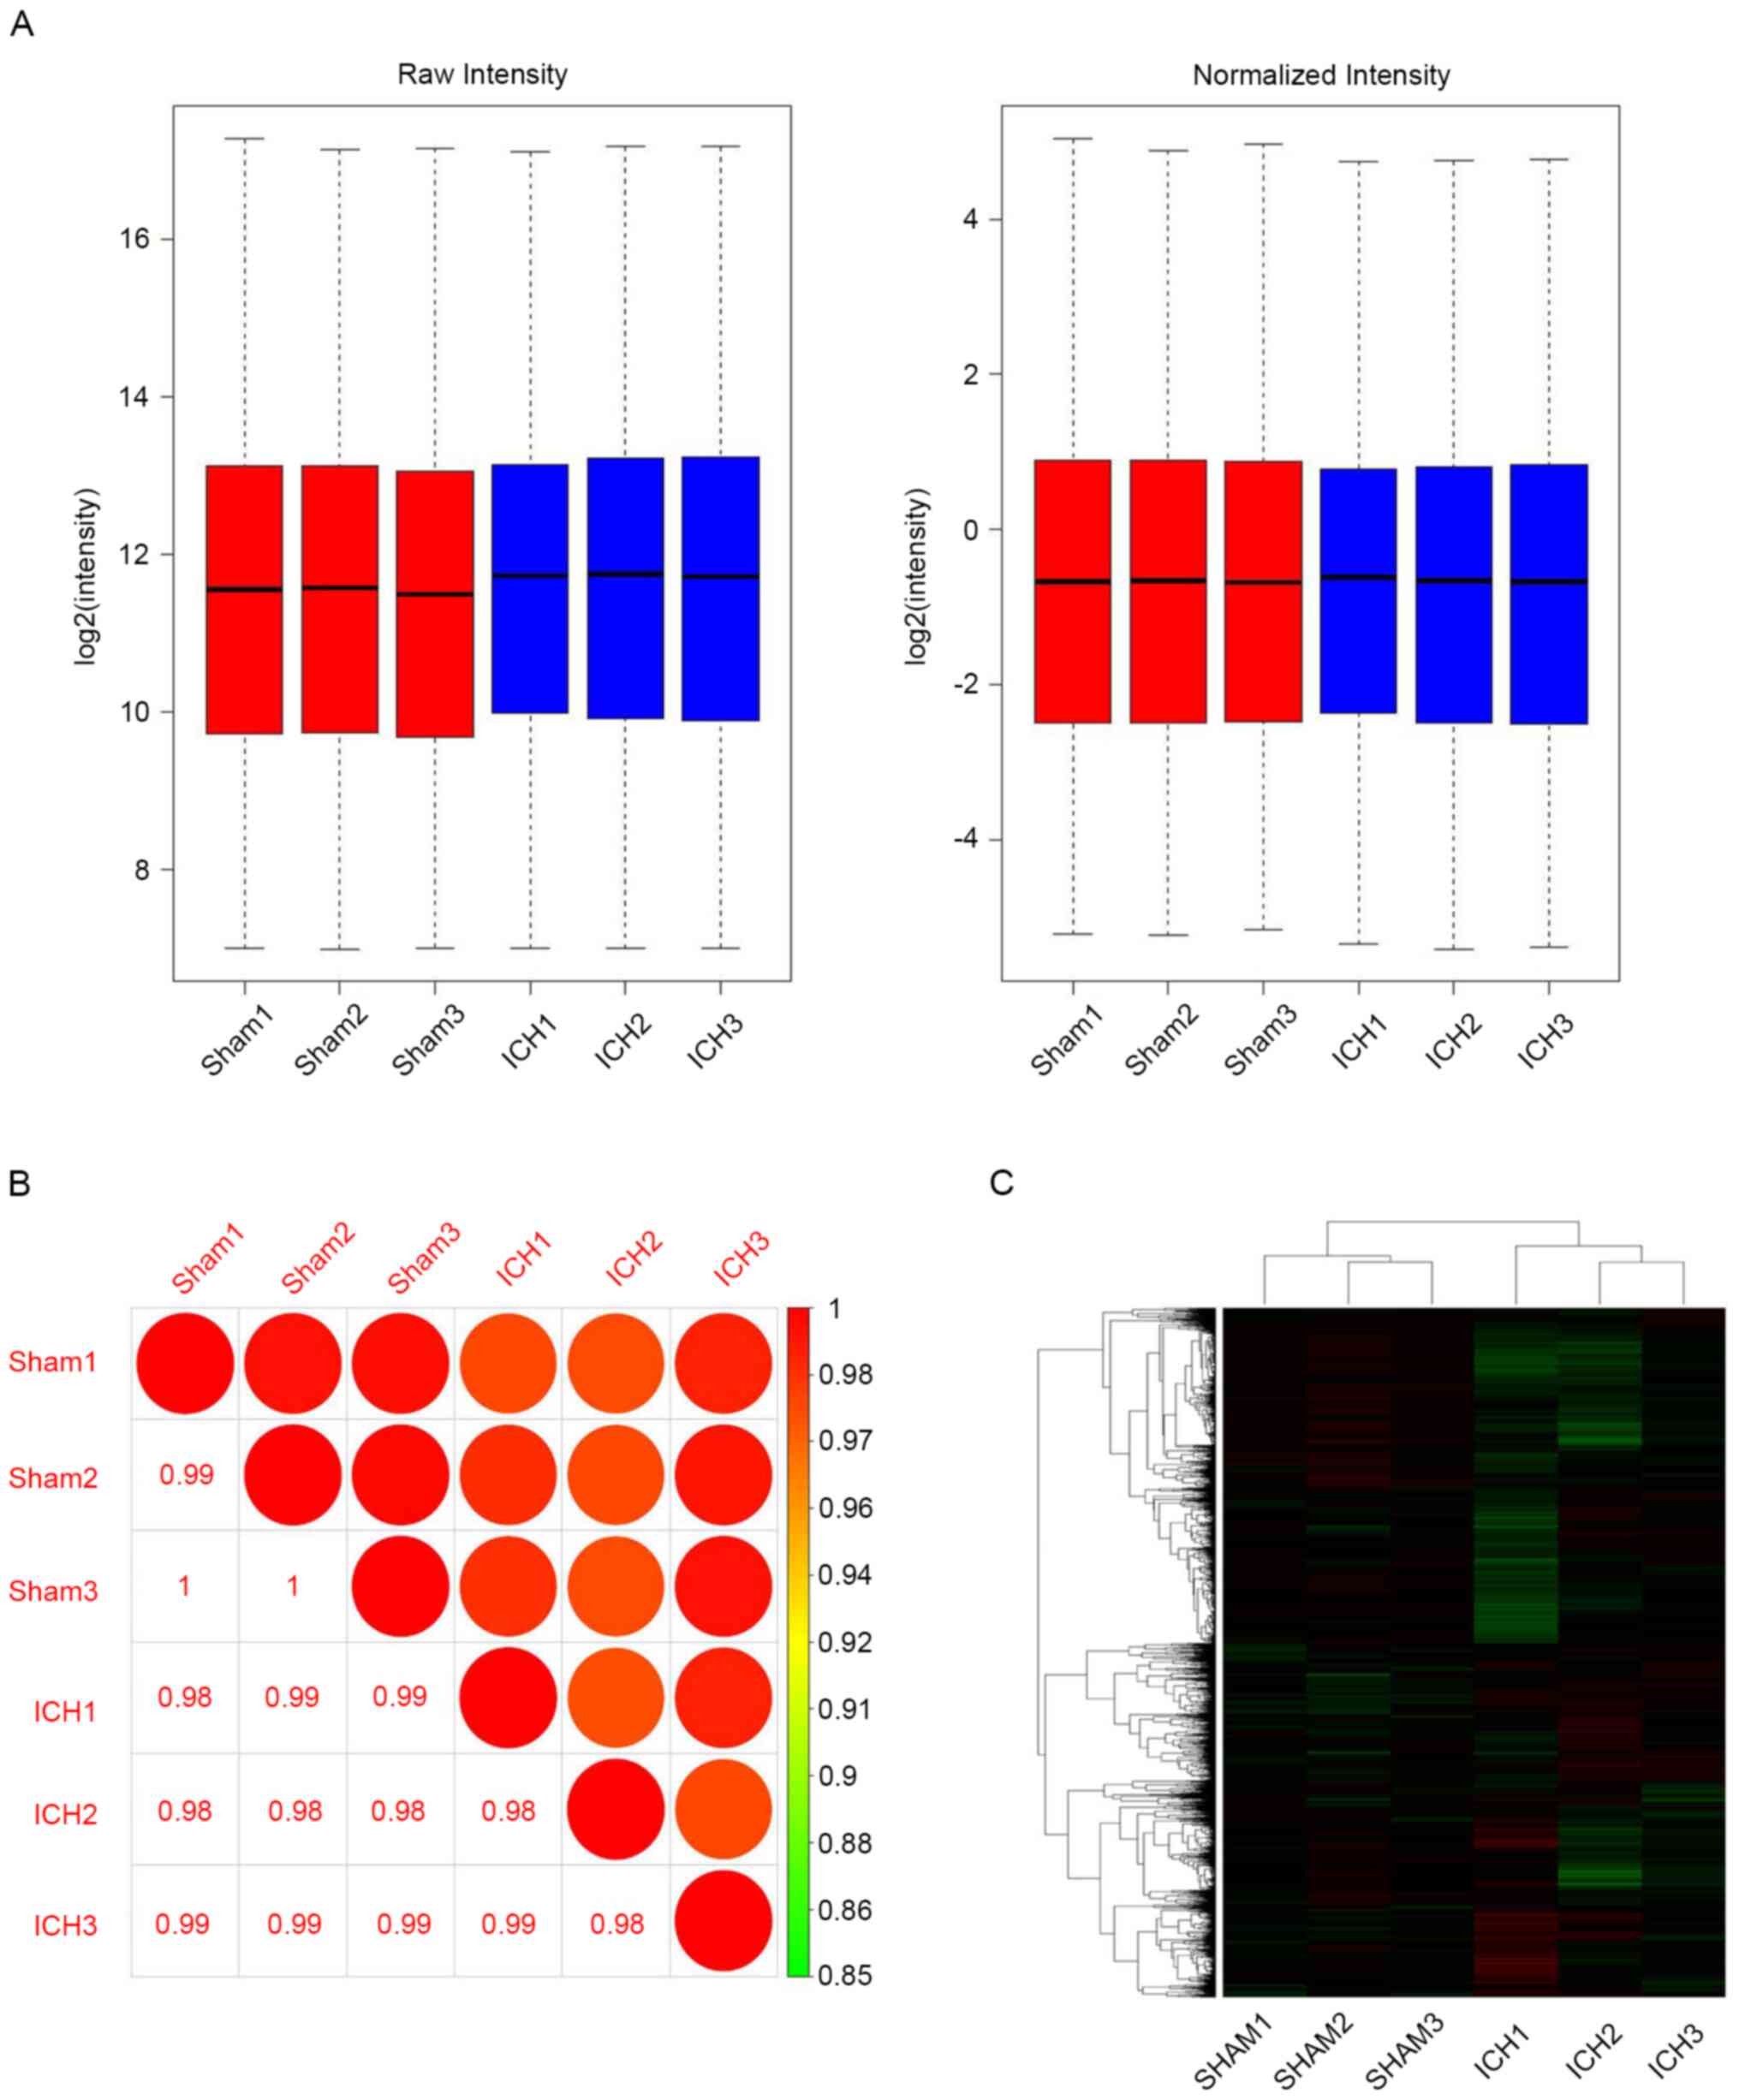
In order to investigate the molecular mechanism of
the perihematoma microenvironment following ICH, microarray
detection of the gene expression profile was performed 1 day
post-ICH (Agilent; 8×60 K, single channel). From the results of the
Pearson correlation coefficient analysis, comparisons of samples
between the sham and ICH groups exhibited differences, whereas
samples derived from the same group were similar (Fig. 3A). The boxplot presents the
expression level of the whole gene (probe) before and after
normalization of different samples; expression levels tended to be
similar between samples within each group (Fig. 3B). Original data clustering
identified differentially expressed genes between the sham and ICH
group, including 210 up- and 173 downregulated genes; a further
24,150 genes were not significantly differentially expressed
(Fig. 3C).
Changes in gene expression profile in
perihematoma tissue following ICH
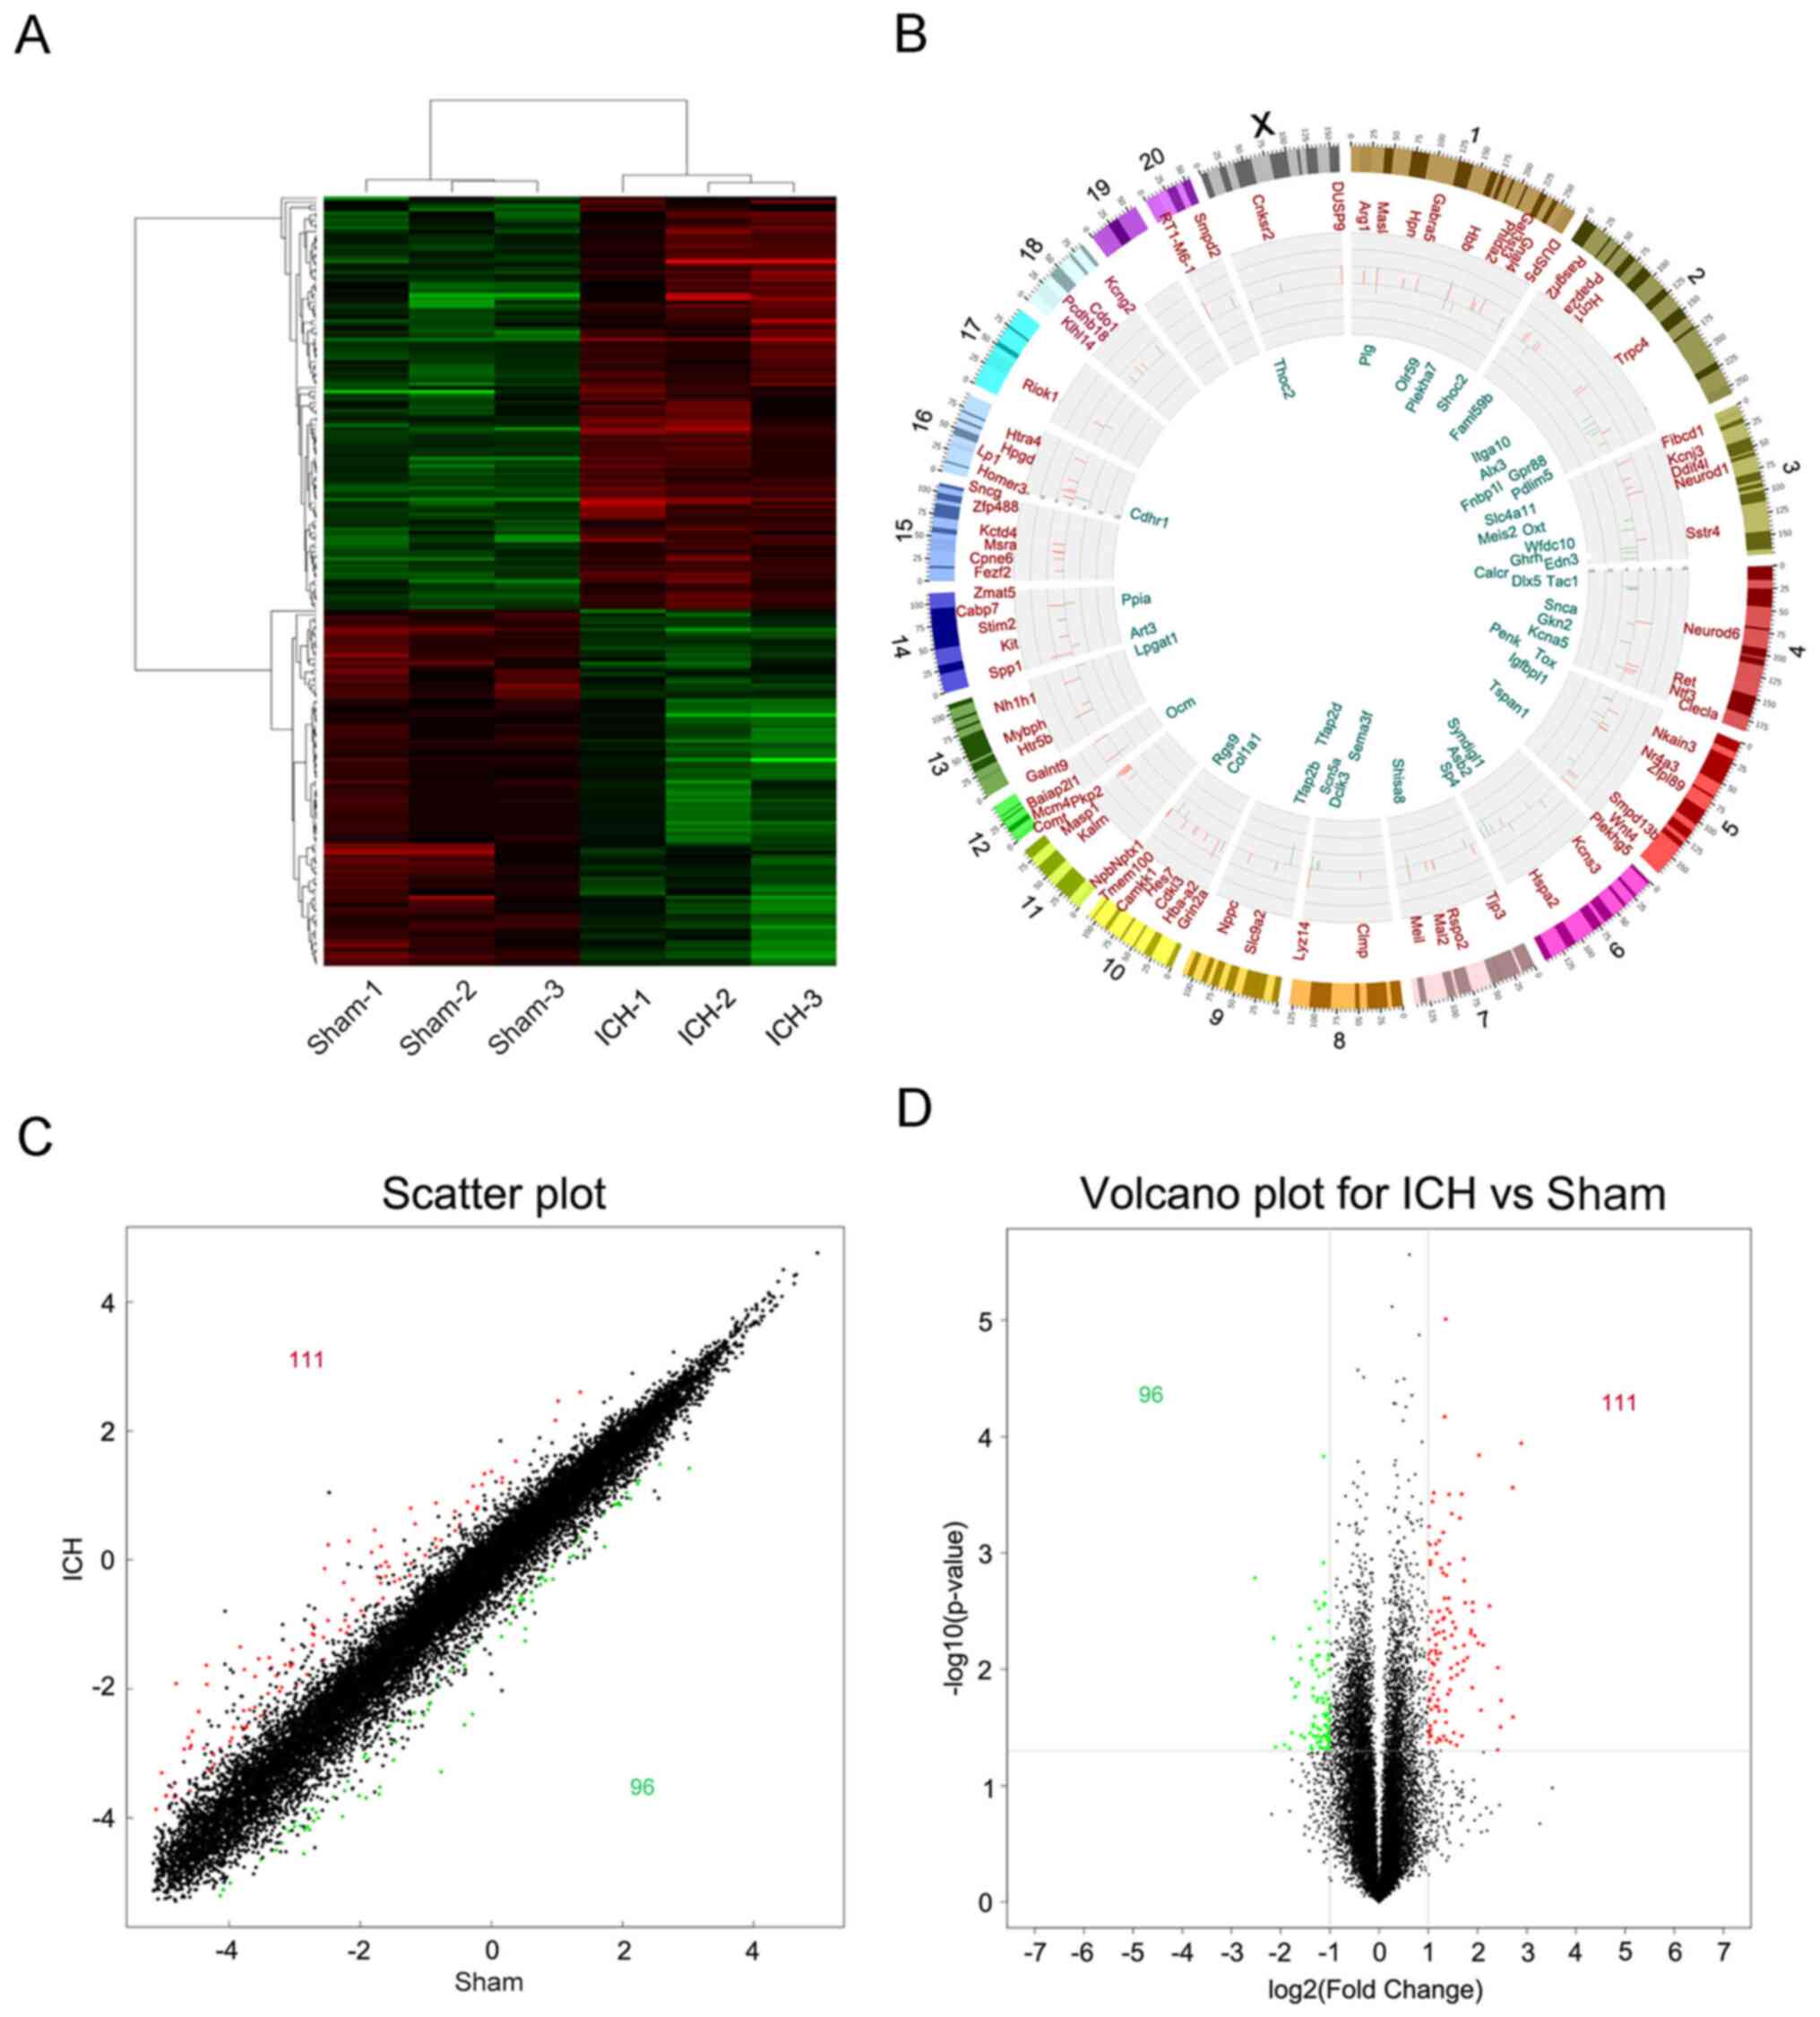
In order to analyze the significance of the
microarray expression profile data, data with an original log2
signal value <120 were filtered out; the resulting number of
differentially expressed genes in the perihematoma tissue following
ICH was decreased to 207, among which 111 genes were up- and 96
were downregulated (Fig. 4A). A
Circos plot was constructed to show the specific positions of
differentially expressed genes on the chromosome (Fig. 4B). Differential variations in the
gene expression of samples were compared between the sham and the
ICH groups (Fig. 4C and D).
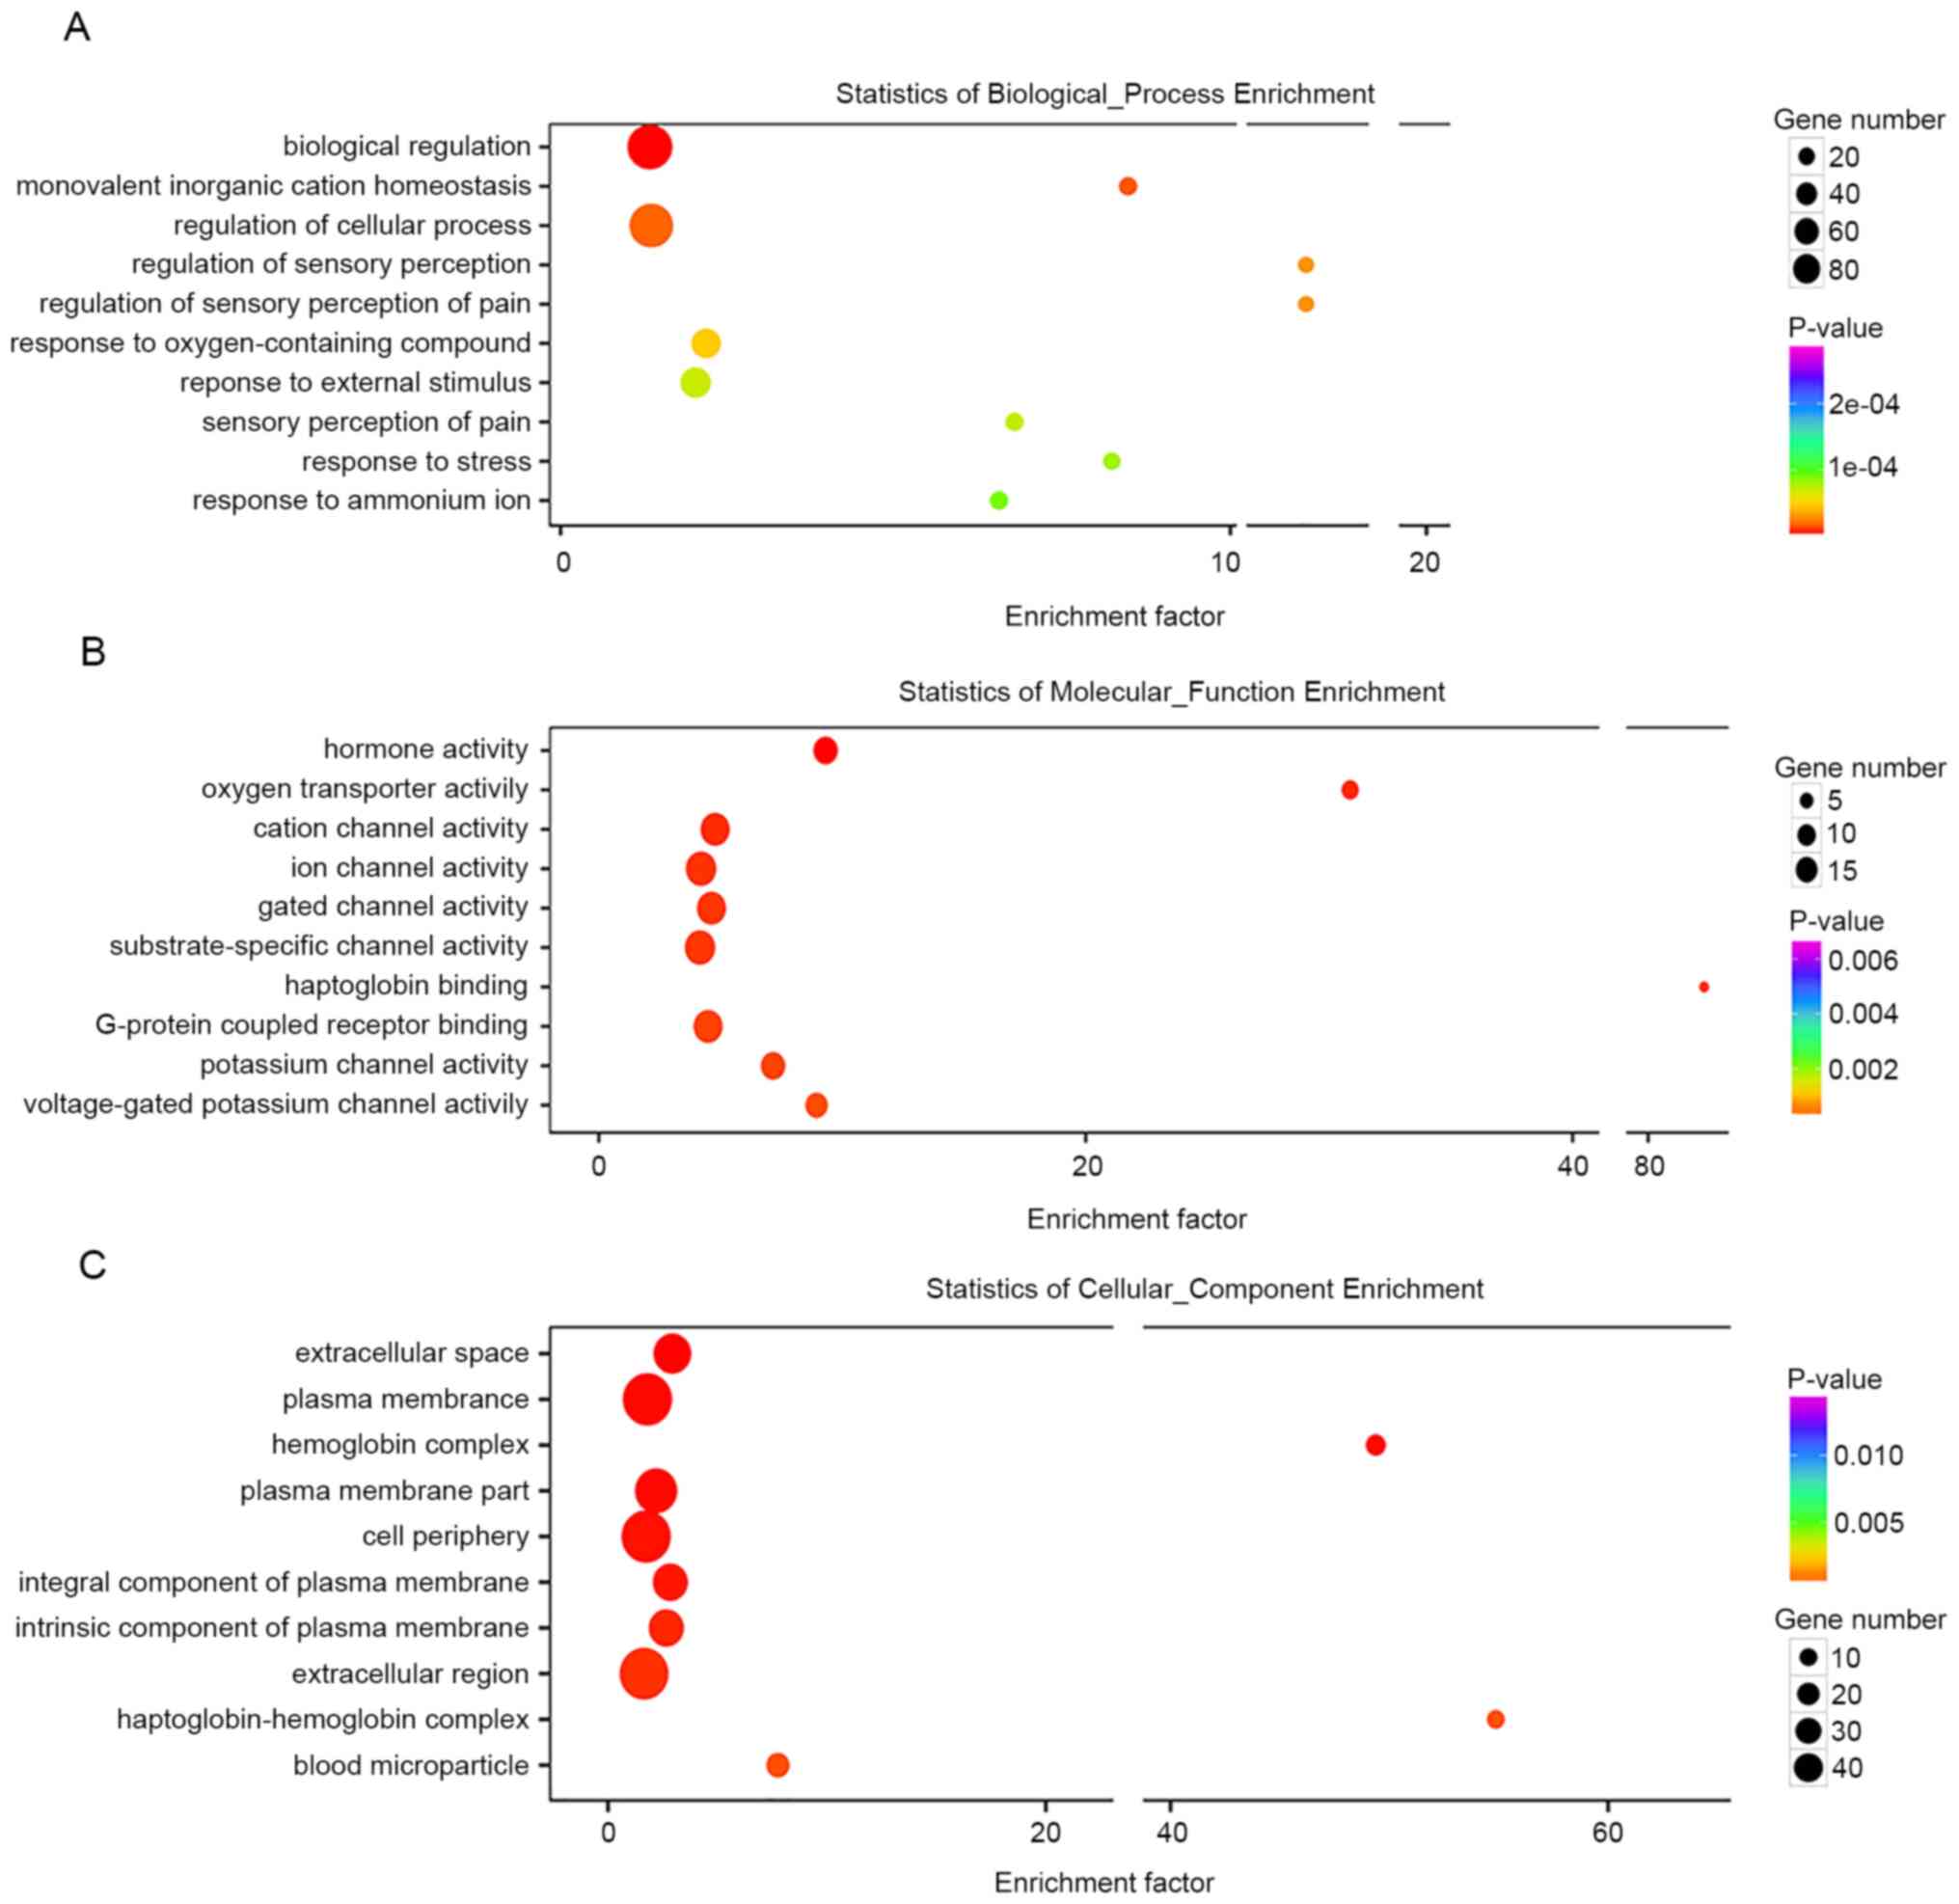
Genome annotation
The different gene spectra were classified according
to GO by GSEA. Three domains were included in the GO analysis:
Biological process, cell component and molecular function. The top
10 most significant annotations were listed according to P-value.
Differentially expressed genes were primarily associated with
‘biological regulation’, ‘monovalent inorganic cation homeostasis’,
‘regulation of cellular processes’, ‘regulation of pain sensation’,
‘response to external stimulation’ and ‘response to stress’
(Fig. 5A). Differentially expressed
genes were also associated with ‘hormone activity’, ‘oxygen
transporter activity’ and activation of a series of ion channels
(Fig. 5B). Localization of
differentially expressed genes occurred in the ‘extracellular
space’ and ‘plasma membrane’ (Fig.
5C). In combination with GO analysis, changes in the gene
expression profile in the peripheral hematoma region following ICH
were analyzed; these were primarily associated with the
harmful/beneficial effects of external stimulation received by
neurons in the peripheral hematoma region via activating ion
channels (receptors) on the cell membrane and regulating the
intracellular biological (stress) process.
Classical signal path analysis
The study of classical signaling pathways involved
in differentially expressed genes serves an important role in
understanding the pathology and underlying molecular mechanism of
the peripheral hematoma following ICH. Using Ingenuity Pathway
Analysis (IPA, digitalinsights.qiagen.com/products-overview/discovery-insights-portfolio/analysis-and-visualization/qiagen-ipa/),
a path analysis software, group differences (differences in genes)
around the hematoma following ICH were studied using classic
genetic spectrum signal-pathway enrichment analysis. The results
revealed that 25 classical pathways were potentially enriched by
changes in gene expression profile in the peripheral hematoma
region following ICH (Fig. 6A).
According to the z-score, the 9 most significant enrichment
pathways were isolated (Fig. 6B and
C; Table III). Z-score ≥2 or
≤-2 was used to represent activation or inhibition of the signaling
pathway, respectively; z-scores obtained did not show activation or
inhibition of the signaling pathways. In addition, the Protein
Annotation Through Evolutionary Relationship (PANTHER) pathway
database analysis indicated that the differentially expressed genes
in the peripheral hematoma region following ICH may be associated
with ‘oxidative stress response’ (Fig.
6D).
| Table III.Classical signaling pathways of
enriched gene expression profiles in perihematoma following
ICH. |
Table III.
Classical signaling pathways of
enriched gene expression profiles in perihematoma following
ICH.
| Pathway | Overlap | Genes |
|---|
| ‘Thyroid cancer
signaling’ | 3/38 | NTF3, BDNF,
RET |
| ‘Huntington's
disease signaling’ | 6/232 | NEUROD1, BDNF,
PENK, GNA14, SNCA, HSPA2 |
| ‘L-DOPA
degradation’ | 1/2 | COMT |
| ‘Taurine
biosynthesis’ | 1/2 | CDO1 |
| ‘Arginine
degradation I (arginase pathway)’ | 1/4 | ARG1 |
| ‘L-cysteine
degradation I’ | 1/4 | CDO1 |
| ‘Role of
osteoblasts, osteoclasts and chondrocytes in rheumatoid
arthritis’ | 5/224 | COL1A1, SPP1, DLX5,
CALCR, WNT4 |
| ‘Urea cycle’ | 1/6 | ARG1 |
| ‘Arginine
degradation VI (arginase 2 pathway)’ | 1/6 | ARG1 |
Association between differentially
expressed gene profiles and disease pathways
According to the changes in gene expression profile
in the peripheral hematoma region following ICH and the enrichment
of disease pathways, five disease pathways were identified that had
the closest association with changes in gene expression profile in
the peripheral hematoma region following ICH, according to the
z-score analysis (Table IV).
Functions associated with the neuropathology of the peripheral
hematoma following ICH were further analyzed, including
‘development of nervous system and neurological diseases’, ‘nervous
system development and function’, ‘cellular structure, function and
developmental disease’, ‘nervous system disorder’ and ‘organismal
injury and abnormalities’.
| Table IV.Expression profile differential genes
and disease pathway functional enrichment. |
Table IV.
Expression profile differential genes
and disease pathway functional enrichment.
| ID | Associated network
function | Score |
|---|
| 1 | ‘Nervous system
development and function’, ‘psychological disorders’, ‘organismal
injury and abnormalities’ | 45 |
| 2 | ‘Cellular
development’, ‘embryonic development’, ‘nervous system development
and function’ | 37 |
| 3 | ‘Cellular assembly
and organization’, ‘cellular function and maintenance’,
‘developmental disorder’ | 28 |
| 4 | ‘Cardiovascular
disease’, ‘nervous system development and function’, ‘neurological
disease’ | 26 |
| 5 | ‘Cancer’,
‘gastrointestinal disease’, ‘organismal injury and
abnormalities’ | 21 |
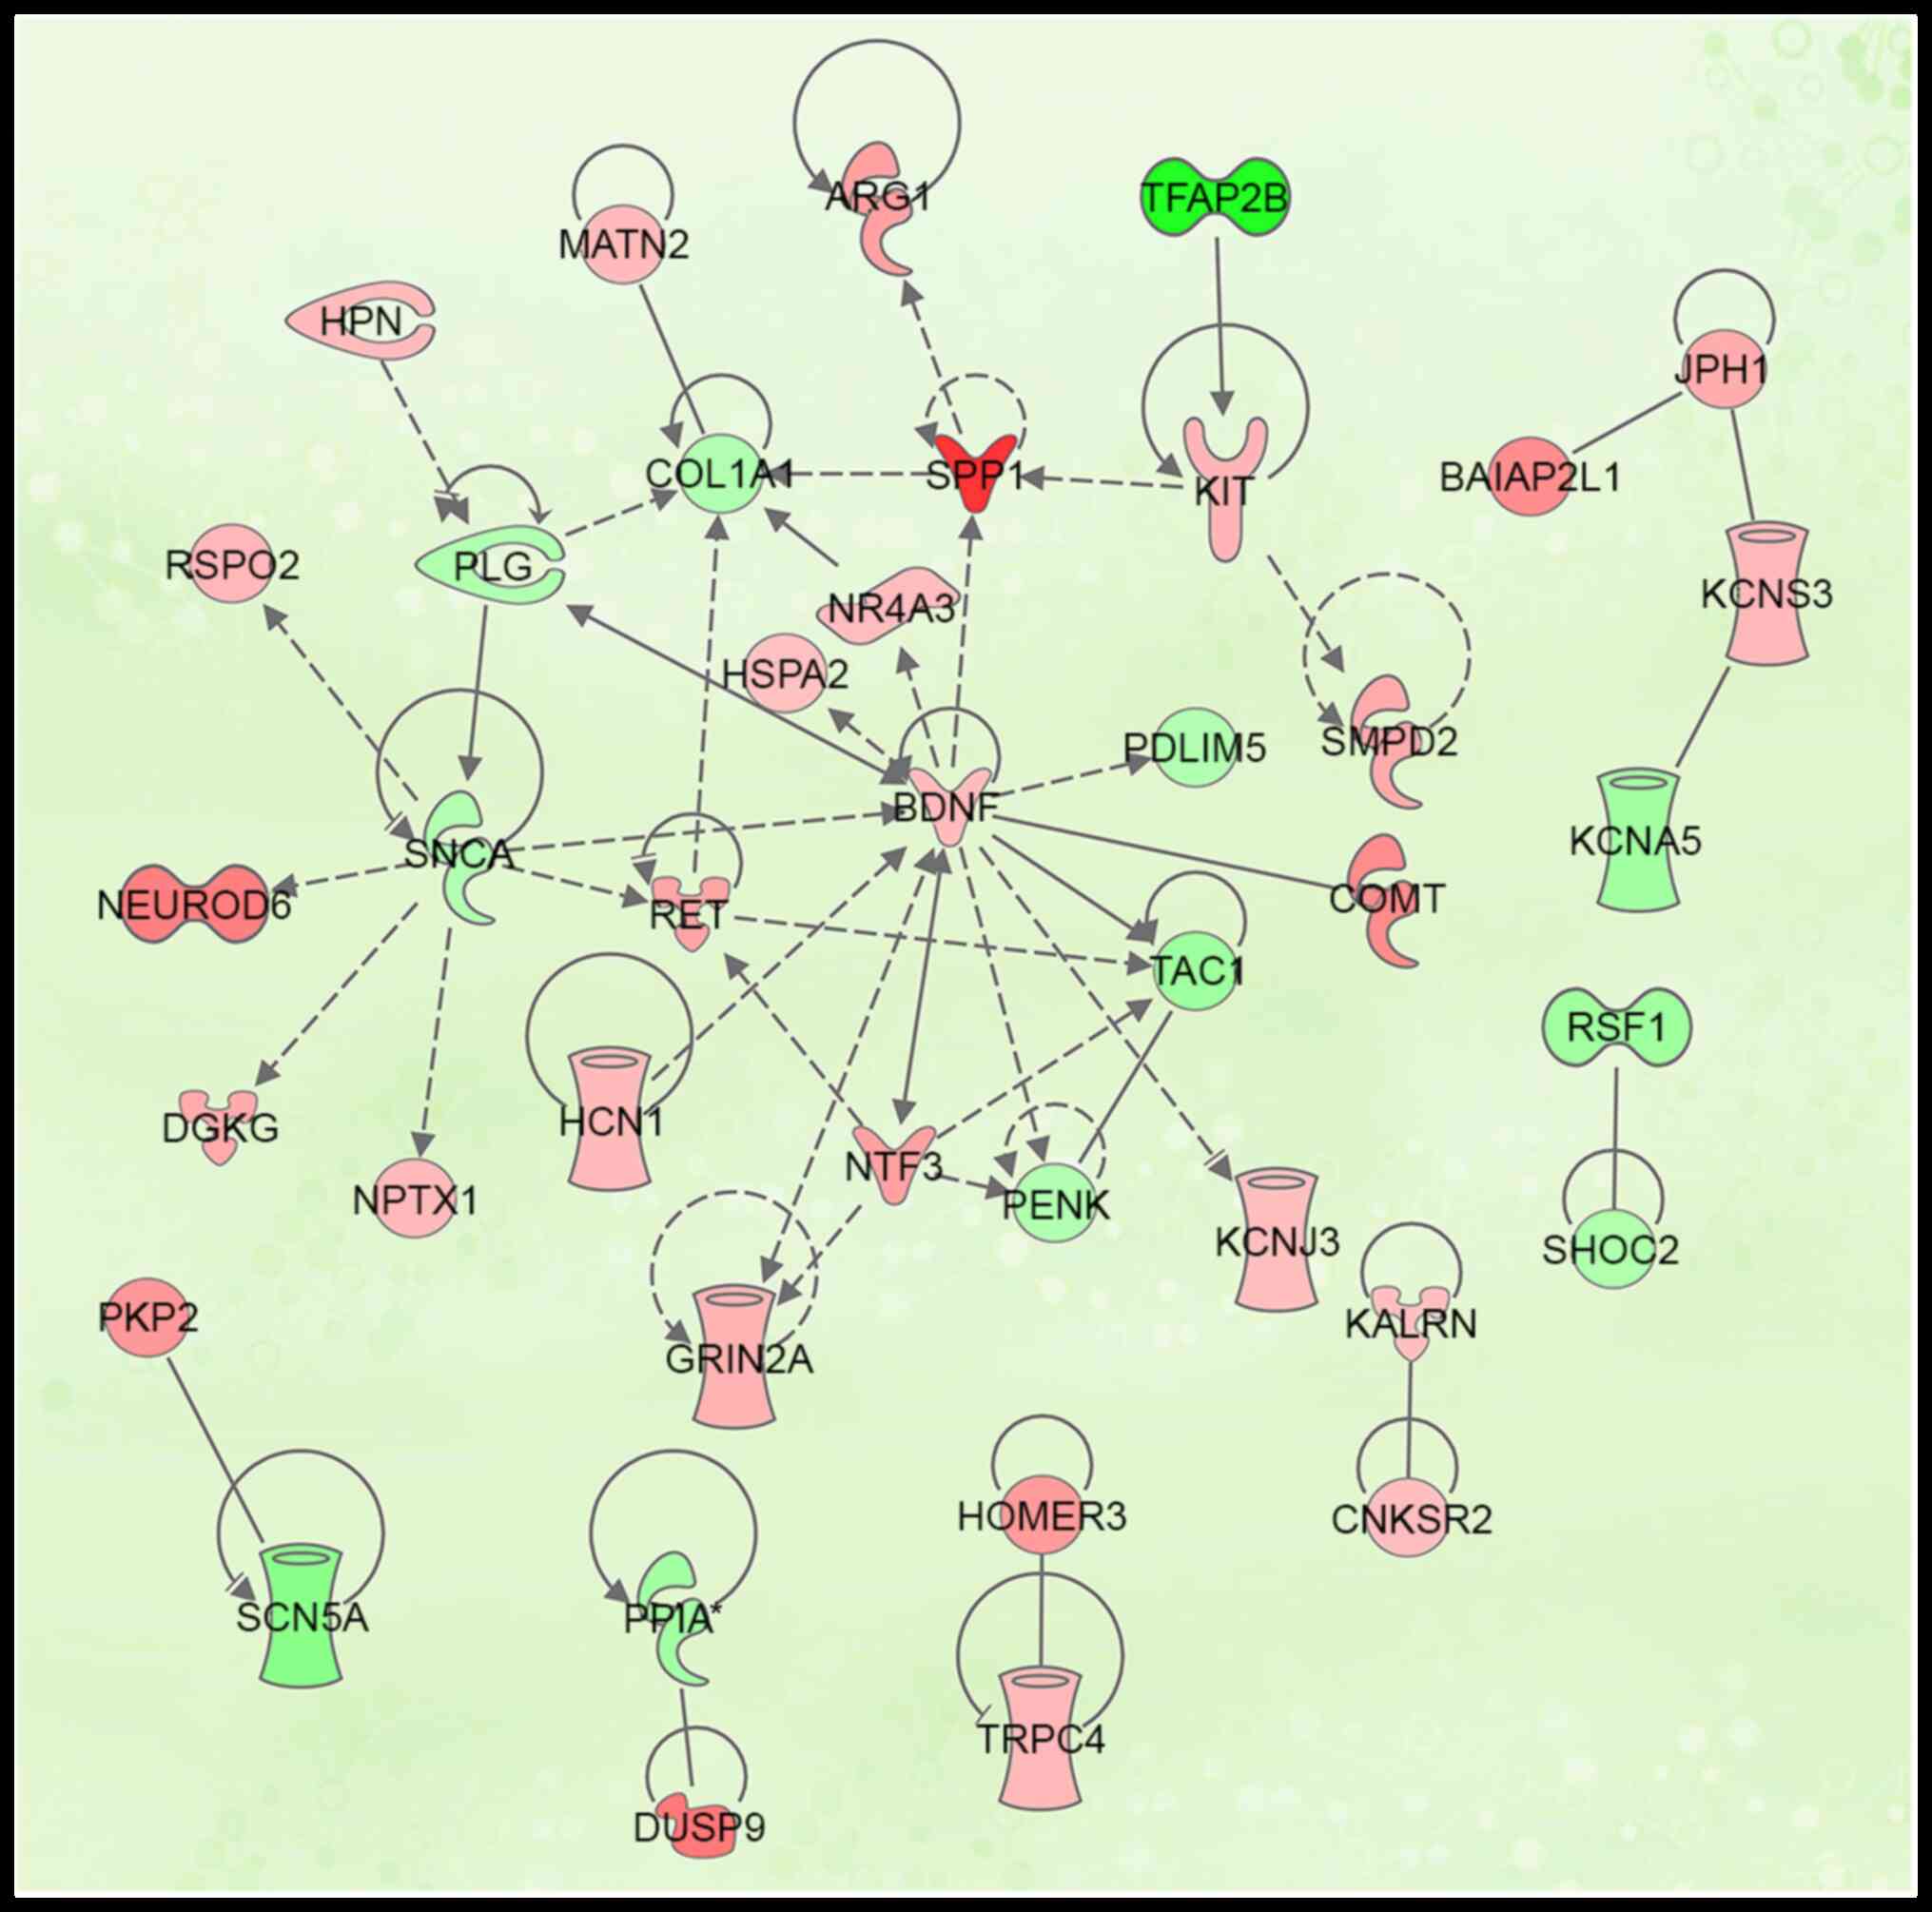
Protein interaction network
analysis
Protein function is regulated and mediated by
interaction with other proteins (23). By querying the protein interaction
database and the associated literature, a protein interaction
network was constructed (Fig. 7)
and 37 proteins with interactive associations were selected for
further analysis (Table V)
(24).
| Table V.Protein interaction network
protein. |
Table V.
Protein interaction network
protein.
| ID | Probe name | P-value | Fold-change
(absolute value) | UniGene ID | Gene symbol |
|---|
| 1 |
A_42_P758222a | 0.008947 | 3.019220 | Rn.9857 | ARG1 |
| 2 |
A_64_P035936a | 0.004929 | 3.643115 | Rn.21473 | BAIAP2L1 |
| 3 |
A_44_P437896a | 0.028281 | 2.204321 | Rn.11266 | BDNF |
| 4 |
A_44_P178576a | 0.022114 | 2.085212 | Rn.42893 | CNKSR2 |
| 5 |
A_64_P040278b | 0.003882 | −2.030321 | Rn.2953 | COL1A1 |
| 6 |
A_64_P038419a | 0.014364 | 3.714765 | Rn.220 | COMT |
| 7 |
A_44_P179145a | 0.003238 | 2.717895 | Rn.10544 | DGKG |
| 8 |
A_44_P192406a | 0.006205 | 4.322715 | Rn.100548 | DUSP9 |
| 9 |
A_44_P505902a | 0.001482 | 2.461507 | Rn.9710 | GRIN2A |
| 10 |
A_44_P1053605a | 0.020786 | 2.206627 | Rn.21408 | HCN1 |
| 11 |
A_44_P463822a | 0.000312 | 3.201671 | Rn.144573 | HOMER3 |
| 12 |
A_64_P134748a | 0.000838 | 2.225321 | Rn.11139 | HPN |
| 13 |
A_44_P309081a | 0.008181 | 2.012769 | Rn.211303 | HSPA2 |
| 14 |
A_44_P116510a | 0.017897 | 2.037972 | Rn.87882 | KALRN |
| 15 |
A_44_P383960b | 0.005883 | −2.374771 | Rn.162789 | KCNA5 |
| 16 |
A_44_P452282a | 0.037462 | 2.078167 | Rn.9809 | KCNJ3 |
| 17 |
A_44_P416938a | 0.020996 | 2.285903 | Rn.10878 | KCNS3 |
| 18 |
A_64_P117011a | 0.007250 | 2.368849 | Rn.54004 | KIT |
| 19 |
A_64_P133152a | 0.000144 | 4.090774 | Rn.84947 | NEUROD6 |
| 20 |
A_44_P260751a | 0.007369 | 2.235491 | Rn.54707 | NPTX1 |
| 21 |
A_43_P12619a | 0.016427 | 2.141300 | Rn.62694 | NR4A3 |
| 22 |
A_44_P496447a | 0.011159 | 3.004565 | Rn.9715 | NTF3 |
| 23 |
A_43_P12767b | 0.007438 | −2.014961 | Rn.221146 | PDLIM5 |
| 24 |
A_42_P749184b | 0.041926 | −2.026286 | Rn.10015 | PENK |
| 25 |
A_44_P999507a | 0.001125 | 3.296893 | Rn.27944 | PKP2 |
| 26 |
A_42_P599062b | 0.010107 | −2.032312 | Rn.20178 | PLG |
| 27 |
A_64_P016970b | 0.037218 | −2.35685 | Rn.1463 | PPIA |
| 28 |
A_64_P154019a | 0.006528 | 2.909228 | Rn.93200 | RET |
| 29 |
A_64_P082924a | 0.039384 | 2.310934 | Rn.225158 | RSPO2 |
| 30 |
A_44_P823749b | 0.037002 | −3.006713 | Rn.32074 | SCN5A |
| 31 |
A_44_P356962b | 0.007621 | −2.042897 | Rn.156055 | SHOC2 |
| 32 |
A_44_P265965a | 0.015076 | 2.715601 | Rn.18572 | SMPD2 |
| 33 |
A_64_P160635b | 0.020375 | −2.012871 | Rn.1827 | SNCA |
| 34 |
A_44_P491796a | 0.025735 | 6.590008 | Rn.8871 | SPP1 |
| 35 |
A_64_P009999b | 0.037288 | −2.521888 | Rn.1920 | TAC1 |
| 36 |
A_43_P18397b | 0.001637 | −5.744454 | Rn.12263 | TFAP2B |
| 37 |
A_64_P093467a | 0.003924 | 2.266533 | Rn.10853 | TRPC4 |
The protein interaction network mapped by IPA was
able to identify the molecular types (including enzymes, cytokines,
transcription factors, transmembrane receptors and ion channels),
and the functions of these proteins. These molecules comprised 11
enzymes, one cytokine, two growth factors, two transcription
factors, seven ion channels, one transmembrane receptor, one
nuclear receptor and 12 others (Table
VI).
| Table VI.Types of differentially expressed
gene. |
Table VI.
Types of differentially expressed
gene.
| Family | Gene |
|---|
| Enzyme | ARG1a, SMPD2a, COMTa, SNCAb, PPIAb, PLGb, DGKG a, RETa, KALRNa, DUSP9a, HPNa |
| Cytokines | SPP1a |
| Growth factor | NTF3a, BDNFa |
| Transcription
factor |
NEUROD6a,
TFAP2Bb |
| Ion channel | HCN1a, GRIN2Aa, SCN5Ab, KCNJ3a, KCNS3a, TRPC4a, KCNA5b |
| Transmembrane and
nuclear receptors | KITa, NR4A3a |
| Other |
BAIAP2L1a, COL1A1b, HSPA2a, PDLIM5b, TAC1b, PENKb, NPTX1a, PKP2a, RSPO2a, SHOC2b, HOMER3a, CNKSR2a |
The interaction network was screened and certain
genes with high connectivity were selected for subsequent analysis.
A total of 16 genes were screened expressing
catechol-O-methyltransferase (COMT), KIT proto-oncogene, receptor
tyrosine kinase (KIT), secreted phosphoprotein (SPP)1, hepsin
(HPN), RET, neurotrophin (NTF)3, dual specificity phosphatase
(DUSP)9, plakophilin (PKP)2, homer scaffold protein (HOMER)3,
kalirin RhoGEF kinase (KALRN), connector enhancer of kinase
suppressor of Ras (CNKSR2), BAR/IMD domain-containing adaptor
protein 2-like 1 (BAIAP2L1), transcription factor AP-2β (TFAP2B),
synuclein α (SNCA), peptidylprolyl isomerase A (PPIA) and SHOC2
leucine rich repeat scaffold protein (SHOC2). After comparing these
with the differential expression profiles, 11 upregulated (SPP1,
DUSP9, COMT, BAIAP2L1, PKP2, HOMER3, RET, KIT, HPN, CNKSR2 and
KALRN) and four downregulated genes (TFAP2B, PPIA, SHOC2 and SNCA)
were identified; a total of 15 differentially expressed genes were
therefore selected for further investigation. Of these, one was
located in the outer membrane, six were in the plasma membrane, six
were in the cytoplasm, and two were in the nucleus (Table VII).
| Table VII.Localization of differentially
expressed genes. |
Table VII.
Localization of differentially
expressed genes.
| Location | Gene |
|---|
| Extracellular
space | SPP1a |
| Plasma
membrane | CNKSR2a, HOMER3a, HPNa, KITa, |
|
| PKP2a, RETa |
| Cytoplasm |
BAIAP2L1a, COMTa, KALRNa, |
|
| PPIAb, SHOC2b, SNCAb |
| Nucleus | DUSP9a, TFAP2Bb |
RT-qPCR verification analysis
RT-qPCR verification was performed on the 15
differentially expressed genes screened; expression levels of all
15 genes significantly changed following ICH. TFAP2B, SHOC2, SNCA
and PPIA were downregulated, all the other genes were upregulated
(Fig. 8).
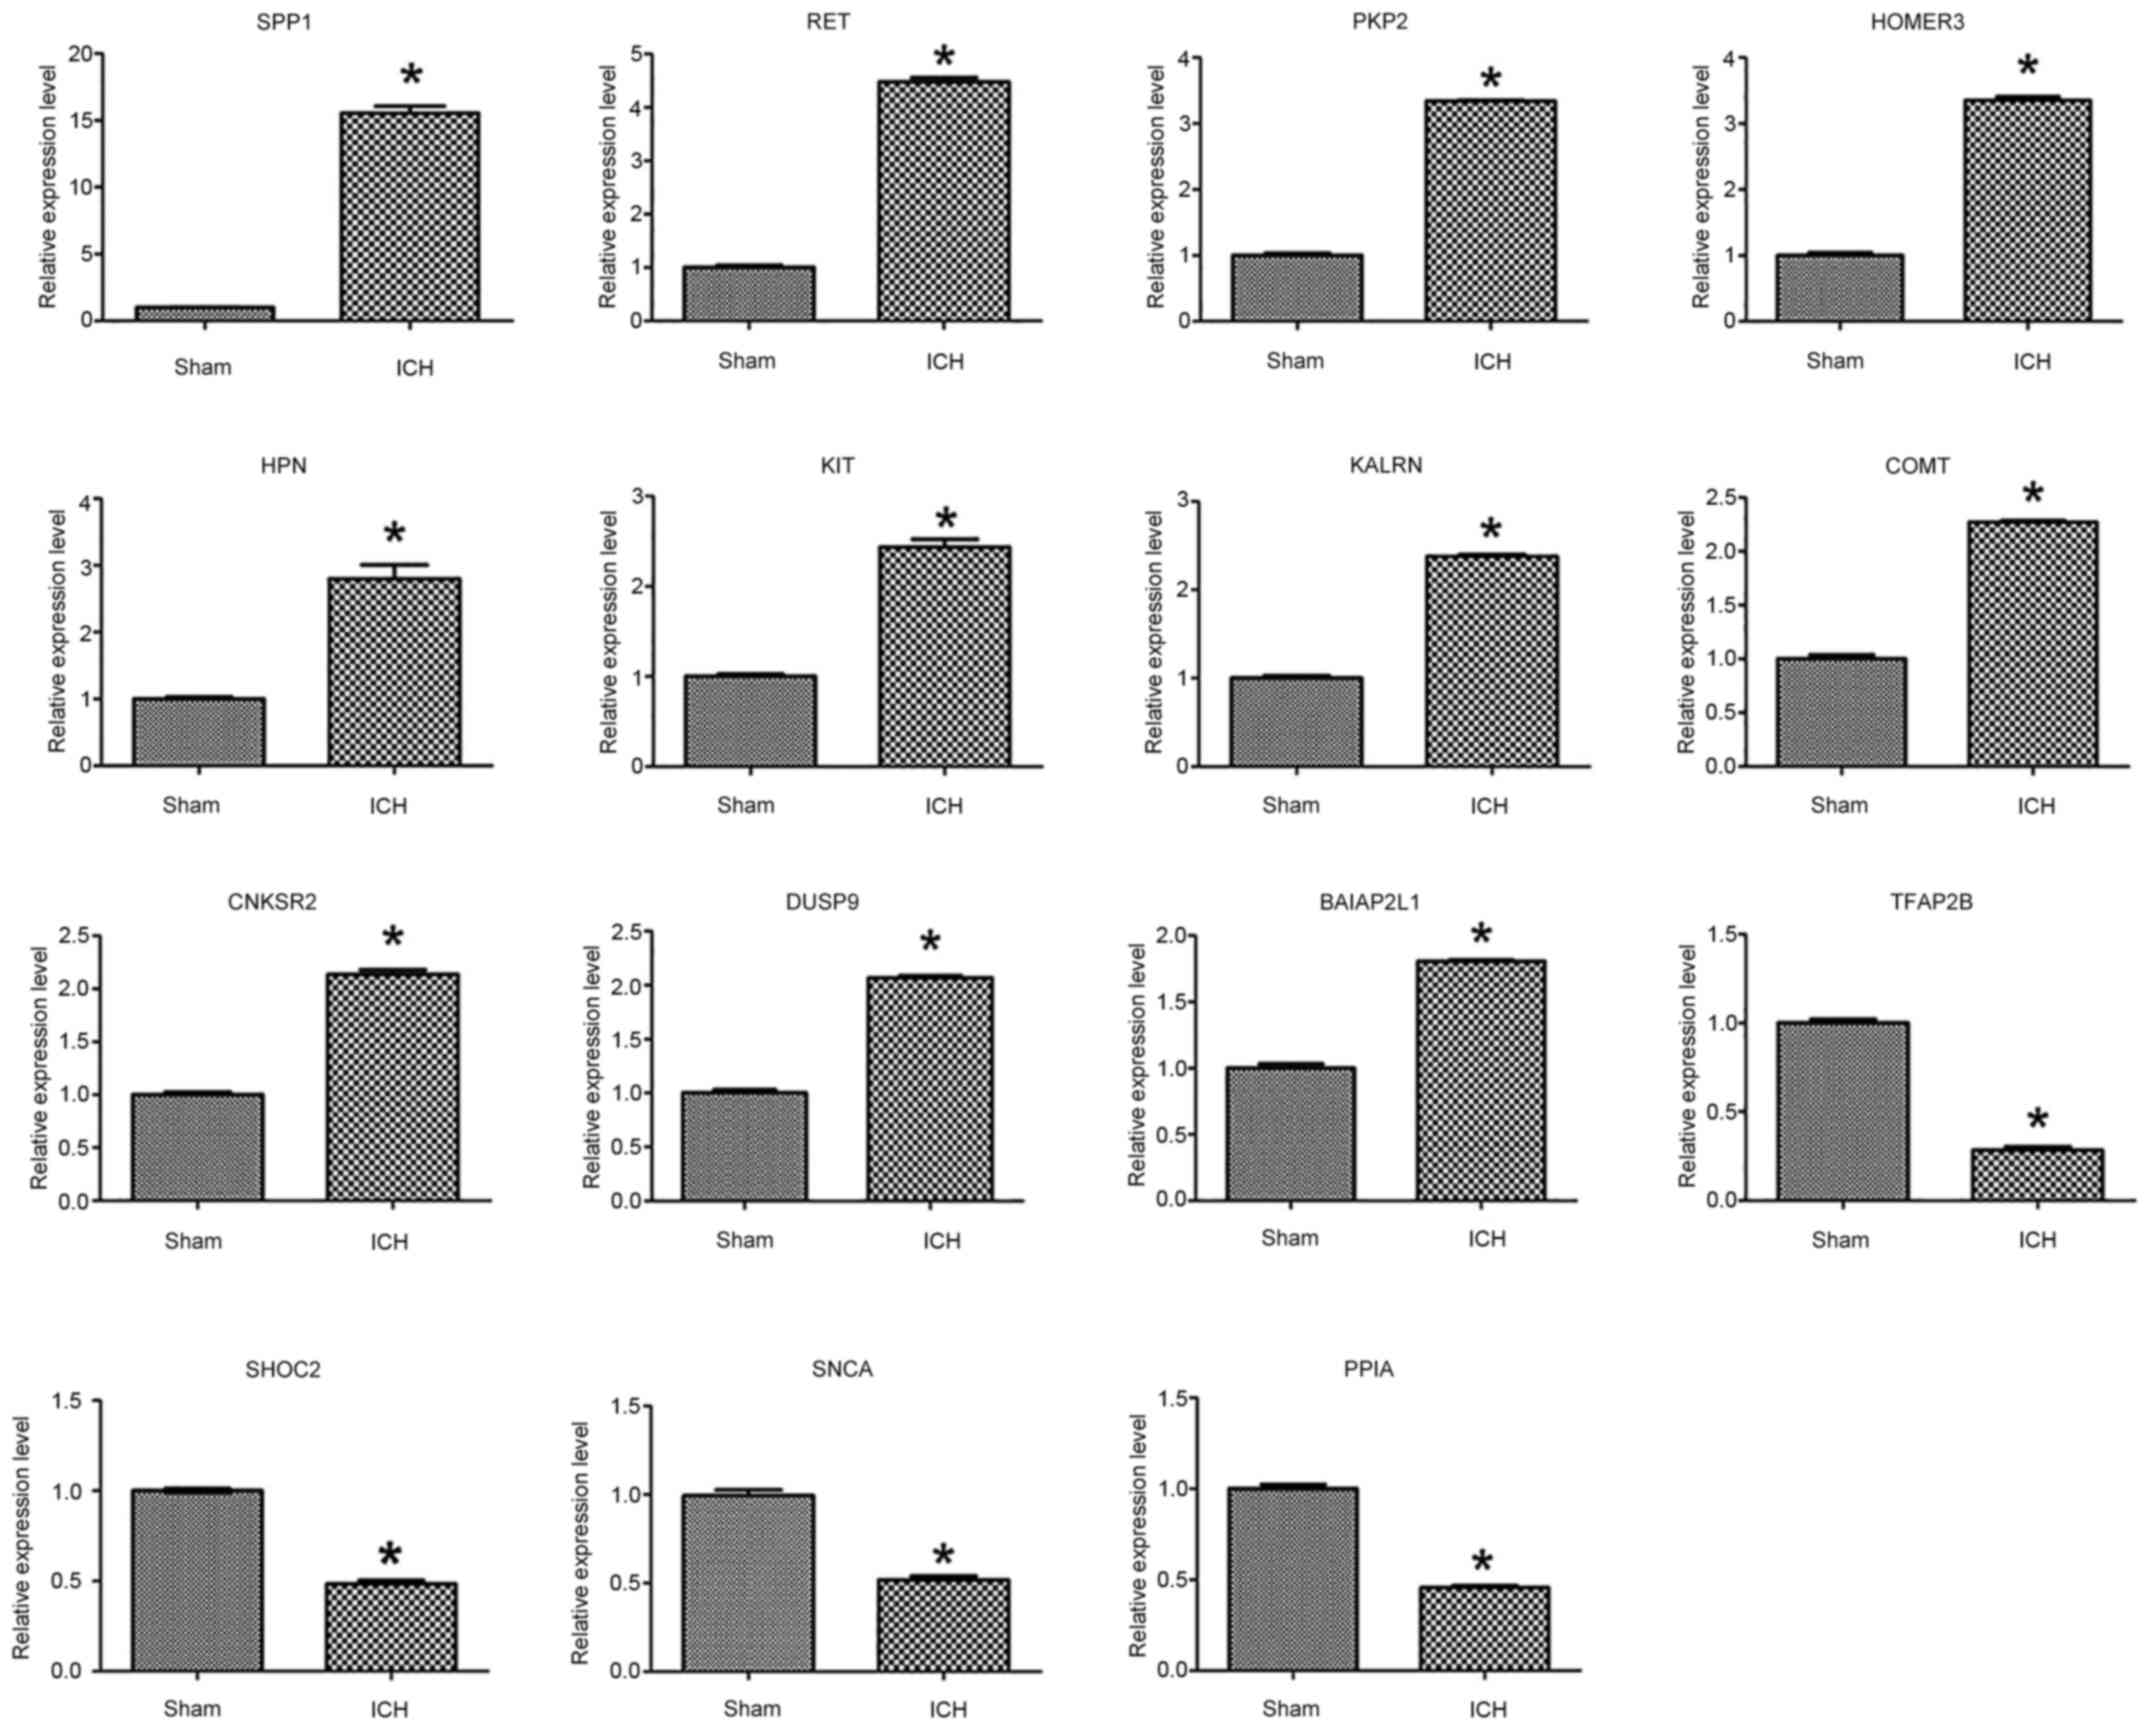 | Figure 8.Reverse transcription-quantitative
PCR was used to detect the expression changes of associated genes
in perihematoma tissue in the sham and ICH groups. mRNA expression
levels were normalized to those of β-actin. *P<0.05 vs. sham.
ICH, intracerebral hemorrhage; SPP1, secreted phosphoprotein 1;
HPN, hepsin; RET, ret proto-oncogene; DUSP9, dual specificity
phosphatase 9; PKP2, plakophilin 2; HOMER3, homer scaffold protein
3; KALRN, kalirin rhoGEF kinase; CNKSR2, connector enhancer of
kinase suppressor of ras 2; BAIAP2L1, BAR/IMD domain containing
adaptor protein 2 like 1; TFAP2B, transcription factor AP-2β; SNCA,
synuclein α; PPIA, peptidylprolyl isomerase A; SHOC2, SHOC2 leucine
rich repeat scaffold protein; COMT,
catechol-o-methyltransferase. |
Association between differentially
expressed gene profile and nervous system development following
ICH
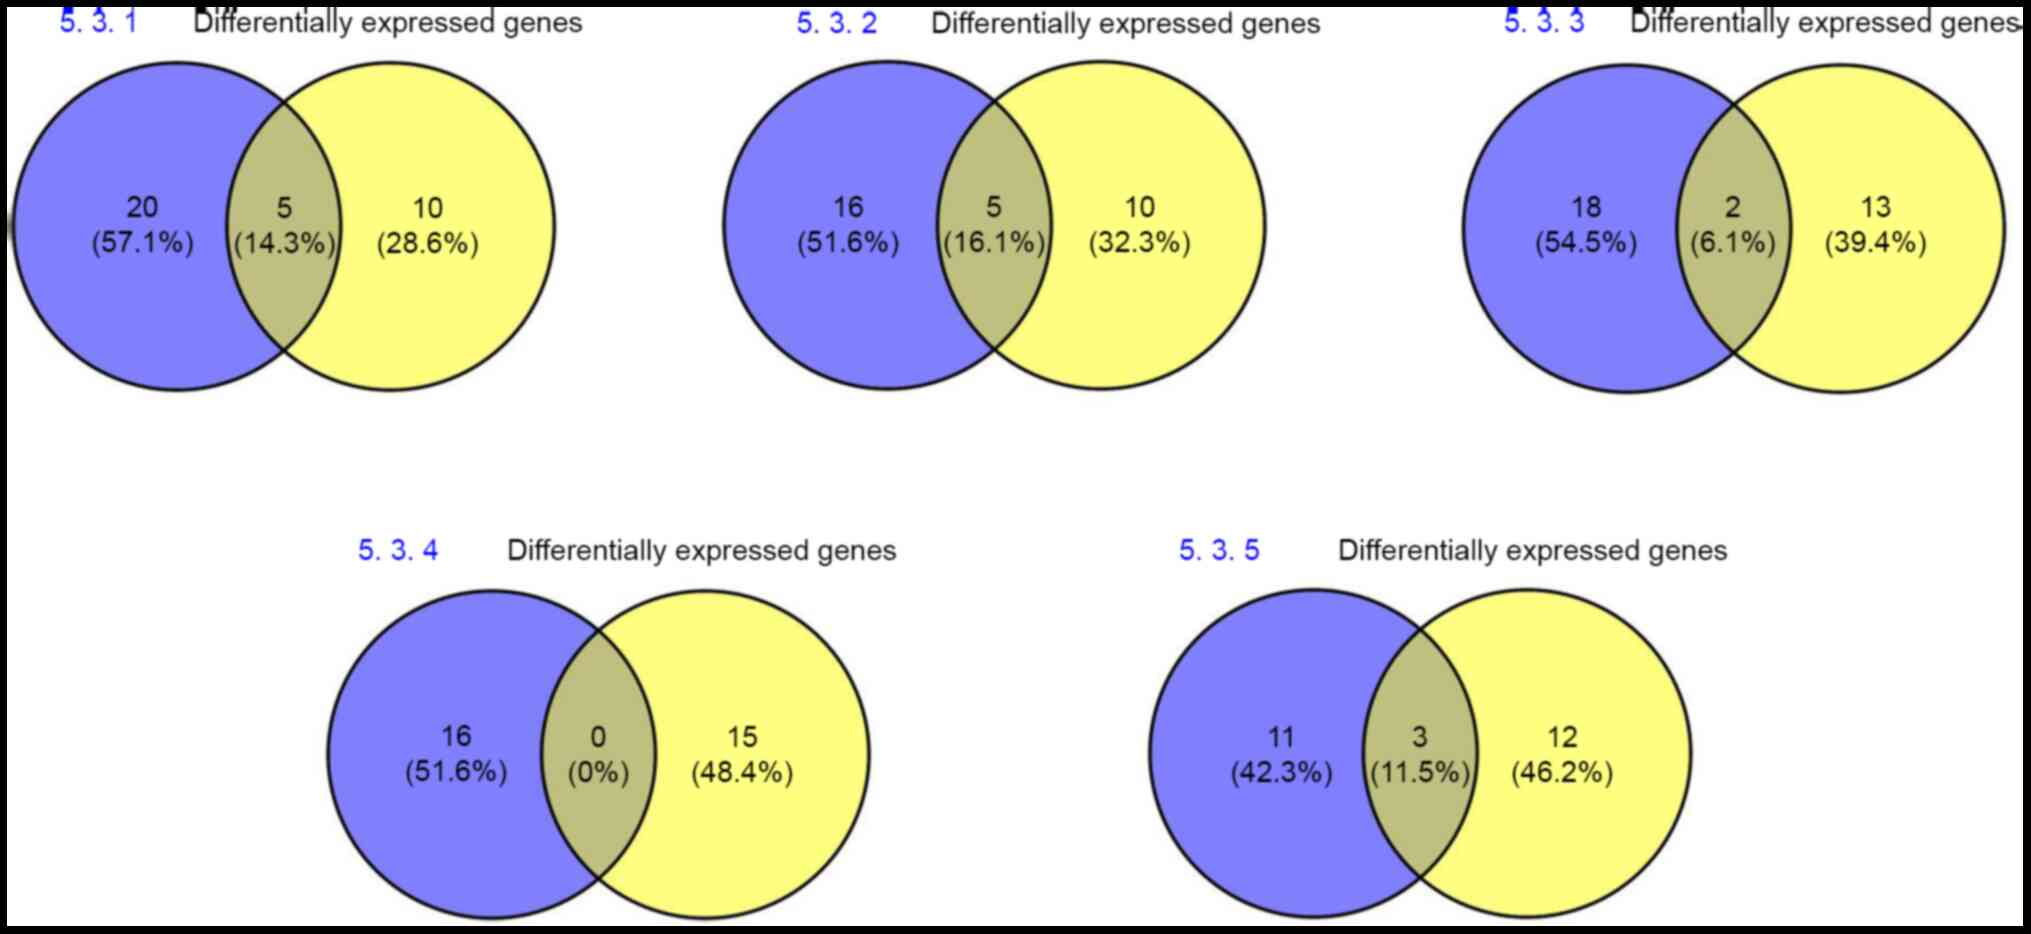
Using Venny 2.1.0 software, the 15 selected
differentially expressed genes were compared and analyzed with
disease-associated networks (Fig.
9). This revealed that five differentially expressed genes
(14.3%) overlapped in the ‘nervous system development’, ‘cell
development’ and ‘neurological disease’ networks (5.3.1). There
were five common genes within the ‘cell development’, ‘embryonic
development’ and ‘development of the nervous system’ networks
(5.3.2), accounting for 16.1%. Additionally, there were two common
genes with respect to ‘cell structure and function’ and
‘developmental disease’ networks (5.3.3), accounting for 6.1%;
however, there were 0 common genes (0%) within ‘cardiovascular
disease’ and ‘nervous system disease’ (5.3.4). A total of three
common genes were identified in ‘organismal injury and
abnormalities’, accounting for 11.5% of the total (5.3.5; Fig. S2; Table VIII).
| Table VIII.Expression of common differentially
expressed genes between disease-associated networks. |
Table VIII.
Expression of common differentially
expressed genes between disease-associated networks.
| Network | Common genes |
|---|
| 5.3.1 | KALRNa, CNKSR2a, COMTa, SHOC2b, PKP2a |
| 5.3.2 | SNCAb, KITa, TFAP2Bb, BAIAP2L1a, RETa |
| 5.3.3 | DUSP9a, PPIAb |
| 5.3.4 | – |
| 5.3.5 | HPN, aSPP1a, HOMER3a |
Analysis of the association with ‘neurological
diseases’ indicated that the changes in the perihematoma
microenvironment following ICH were associated with ‘development
(repair) of the nervous system’. Subsequently, IPA software was
used to analyze the causal network of neural functional
development. This analysis showed that only effects of
Achaete-scute homolog 1 (ASCL1) were activated, and this gene was
associated with ‘cell growth’ and ‘neuron development (repair)’
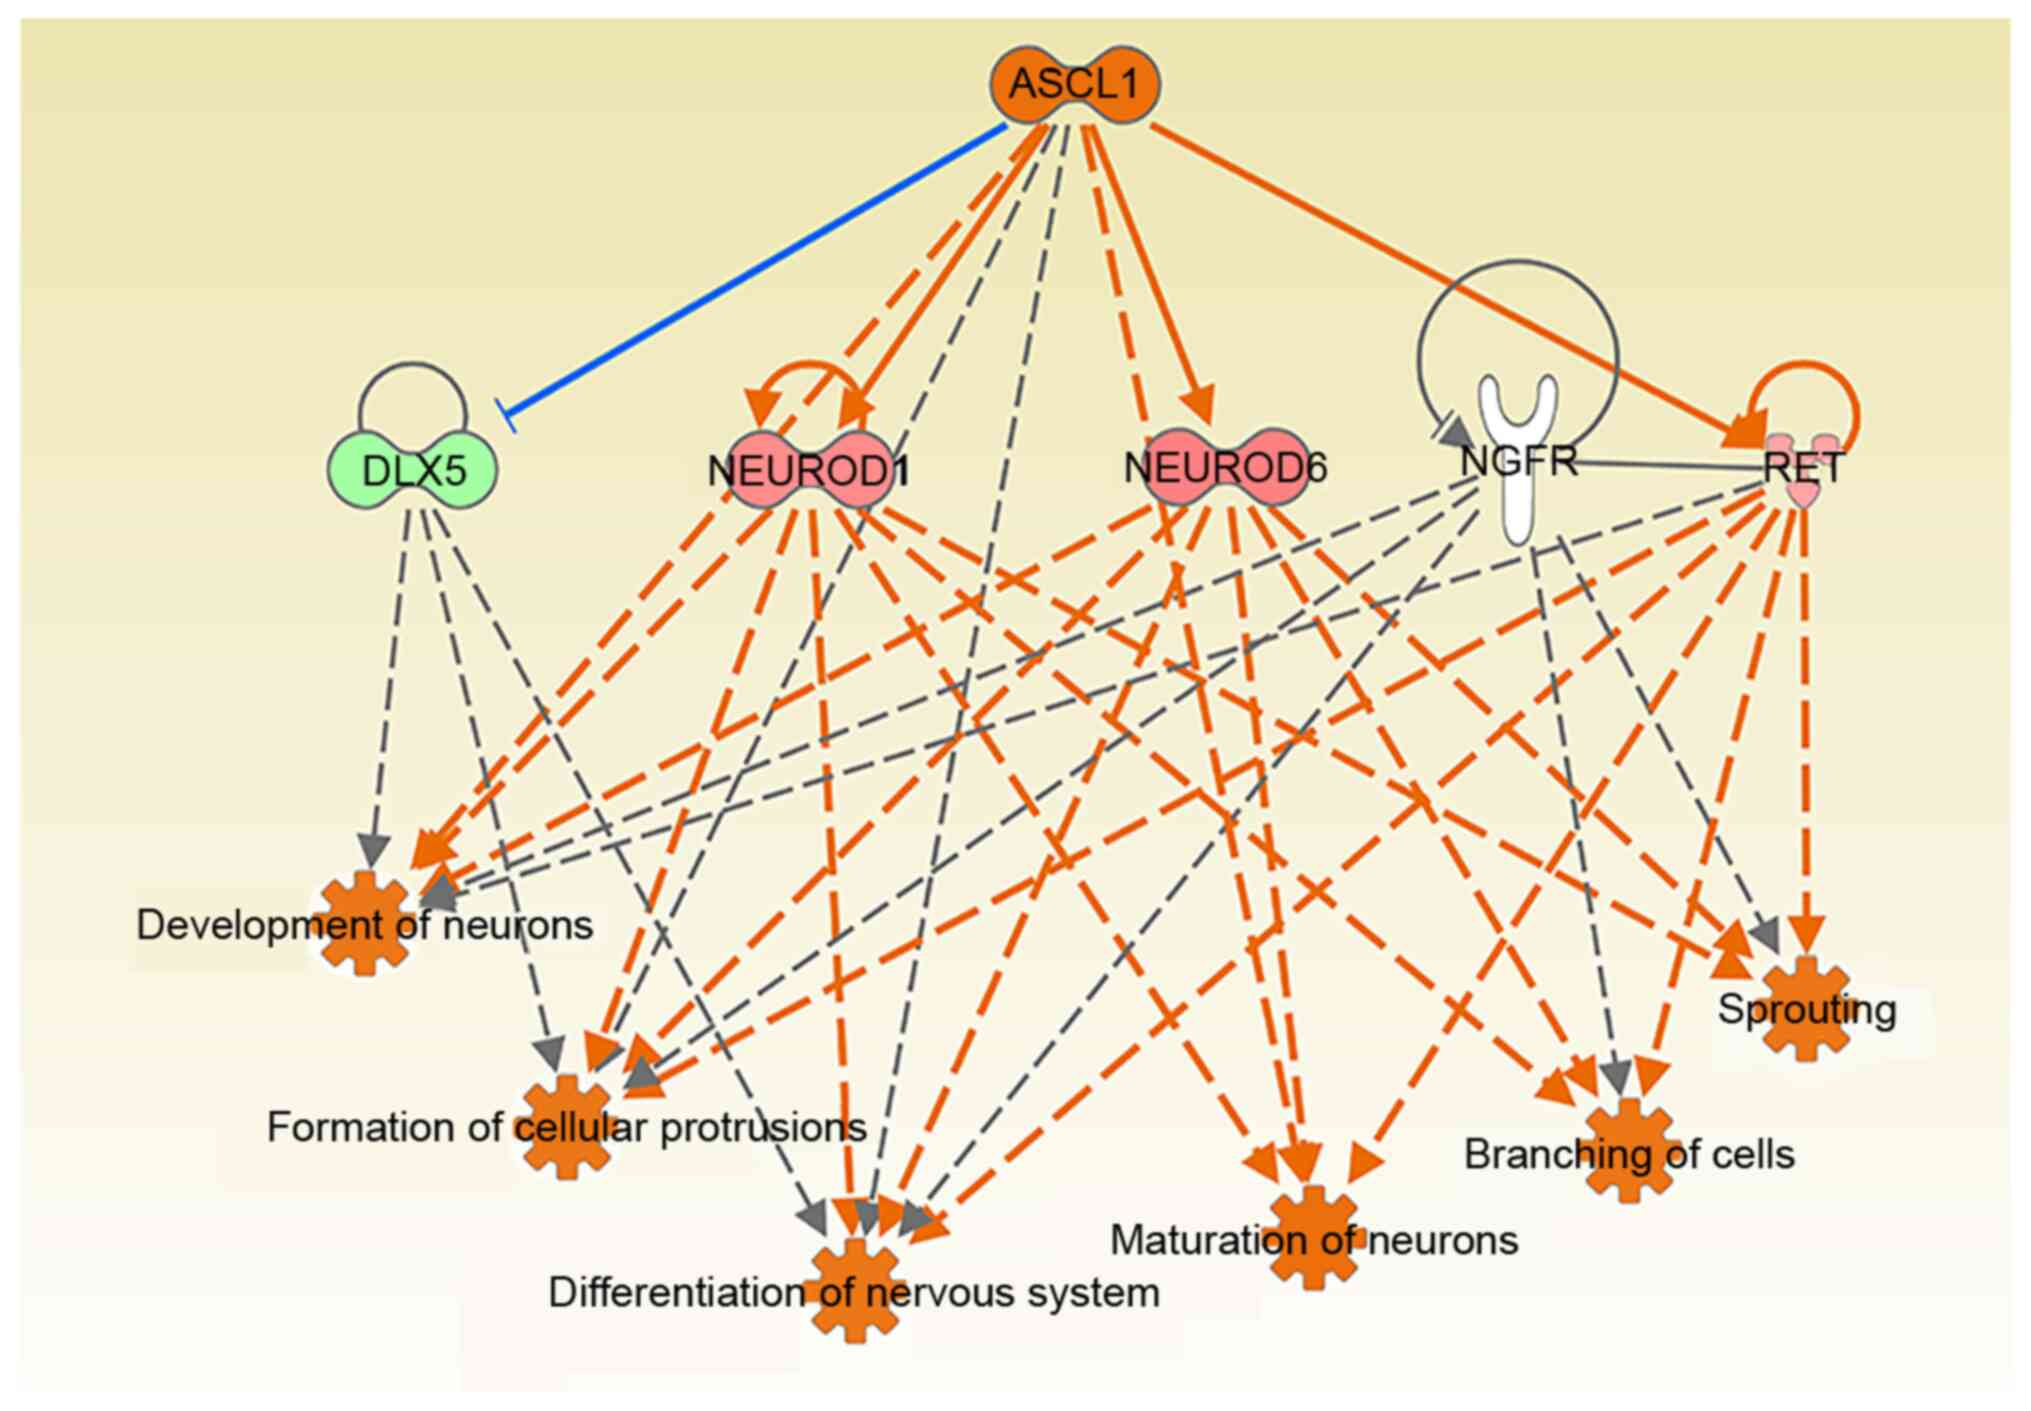
(Fig. 10). ASCL1 mediated cell
functions such as ‘germination’, ‘extension’, ‘neuron maturation’,
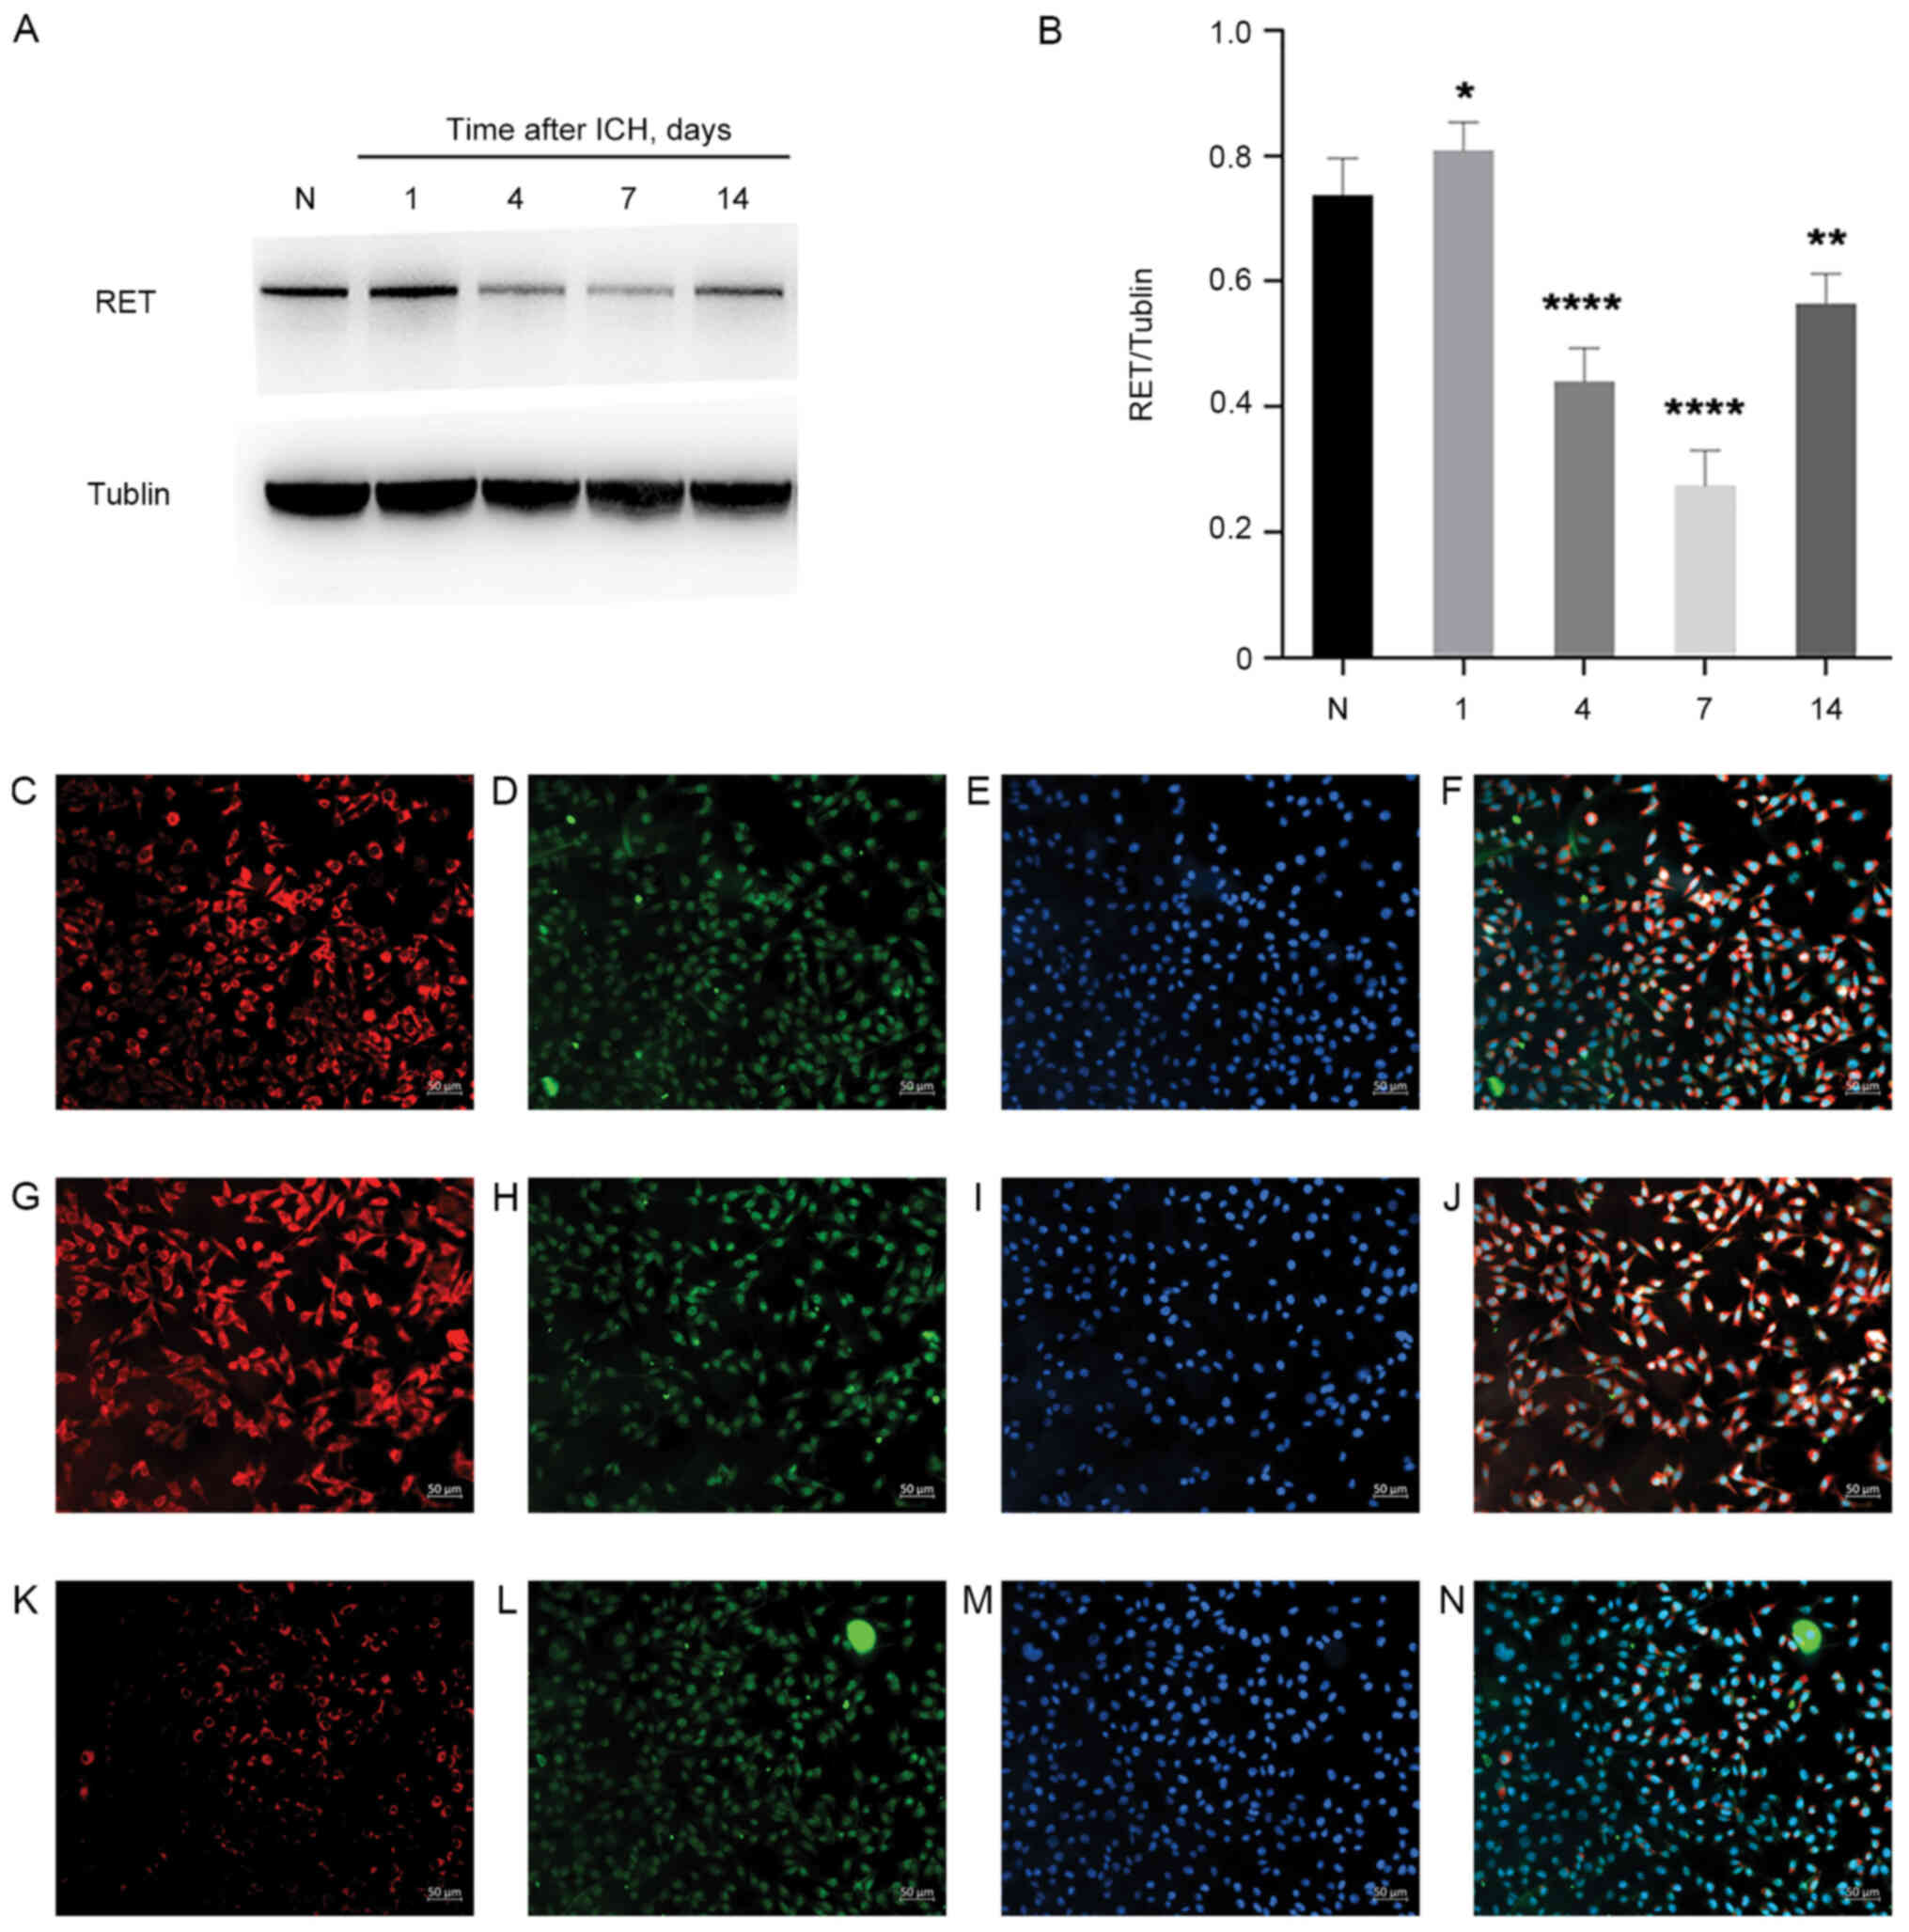
‘development’ and ‘synaptic formation’ by regulating RET (Fig. 11A and B). Furthermore, it was
possible to detect the upregulation of RET and its colocalization
with neurons in rats following ICH (Fig. 11C-N). Therefore, further
investigation of the repair function of this pathway axis of the
ASCL1-RET-nervous system will be an object for future research.
Discussion
ICH is an acute and severe disease of the central
nervous system, which endangers the health of the public and brings
a heavy burden on families and society (25). Current knowledge suggests that ICH
not only includes primary lesions caused by hematoma (for example,
hematoma formation and the placeholder effect of expansion, which
causes direct damage to perihematoma tissue) but also includes
agents indirectly responsible for secondary damage. These include
toxic substances triggered by the burst of erythrocytes, a highly
active metabolic state, spreading depression, oxidative stress,
toxic effects of excitatory amino acids and inflammation in
perihematoma tissue, which causes secondary damage (25,26).
This is referred to as a microenvironment change in the
perihematoma following ICH (1,4,12). The
functions of the microenvironment are diverse, including regulation
of the blood flow and metabolism, modulation of substance exchange
across the blood-brain barrier, trophic support and repair of
injured neurons (26). Primary
post-ICH injury is often unforeseeable, and therefore potential
intervention strategies, such as neuroprotection, are limited
(26). Consequently, secondary
injury in the peripheral hematoma following ICH is an important
factor in neurological impairment and is a challenge for
translational medicine.
In the present study, an ICH model was constructed
by injecting autologous venous-tail blood into the basal ganglia
region of the brain in rats, and the success of the construction of
the ICH model was assessed using the neural dysfunction scoring
method (comprising the forelimb placement and the corner turn
test). Between 6 h and 7 days post-ICH, neural dysfunction in rats
with limb paralysis was significantly increased compared with the
sham group. Apoptosis is an important contributor towards nerve
function defect in neurons in the perihematoma following ICH
(16); the present study showed
that, from 12 h to 4 days post-ICH, neuron apoptosis increased
compared with the sham group, and apoptosis peaked on day 2
post-surgery. In addition, immunofluorescence co-localization
experiments showed that the neuronal proteins tagged were the
neuronal nuclear antigen NeuN and the apoptotic protein cleaved
caspase-3, thereby suggesting that apoptosis in perihematoma
following ICH primarily occurred in neurons.
The perihematoma tissue in rats 1 day after the
operation was screened using Agilent microarray detection assay. As
shown by the Pearson correlation coefficient, boxplot and cluster
map, significant differences in gene expression were identified in
the perihematoma of the sham and ICH groups at 1 day post-ICH,
among which 210 genes were up- and 173 were downregulated;
differences in expression levels of 24,150 were not statistically
significant. GO functional annotation showed that the
differentially expressed genes were most relevant to ‘biological
regulation’, ‘ion balance’, ‘regulation of cellular processes’,
‘pain sensation’, ‘external stimuli’ and ‘regulation of stress’.
Molecular functions were primarily associated with ‘hormone
activity’, ‘oxygen transporter activity’ and activation of a series
of ion channels. Cell component was associated with ‘extracellular
region’ and ‘plasma membrane’. Therefore, based on GO functional
annotation, it was possible to conclude that the changes in gene
expression profiles in the peripheral hematoma region following ICH
were primarily associated with external stimulation, which exerted
harmful/beneficial effects, such as neuron protection/neuronal
apoptosis, via activating ion channels (receptors) on the cell
membrane and regulating the intracellular biological (stress)
responses (25–27). Using IPA, enrichment of the
classical signaling pathways of the differentially expressed genes
in the post-ICH perihematoma was further studied. This analysis
identified nine of the most significant enrichment pathways for
these differentially expressed genes, including: ‘Thyroid cancer
signaling’ [3/38; NTF3, brain-derived neurotrophic factor (BDNF),
RET]; ‘c-Huntington's Disease signaling’ [6/232; neuronal
differentiation 1, BDNF, proenkephalin, G protein subunit α14,
SNCA, heat shock protein family A (Hsp70) member 2]; ‘L-DOPA
degradation’ (1/2; COMT); ‘taurine biosynthesis’ [1/2; cysteine
dioxygenase type 1 (CDO1)]; ‘arginine degradation I (arginase
pathway)’ [1/4; arginase 1 (ARG1)]; ‘L-cysteine degradation I’
(1/4; CDO1); ‘role of osteoblasts, osteoclasts and chondrocytes in
rheumatoid arthritis’ (5/224; collagen type I α1 chain, SPP1,
distal-less homeobox 5, calcitonin receptor, Wnt family member 4);
‘urea cycle’ (1/6; ARG1); and ‘arginine degradation VI (arginase 2
pathway)’ (1/6; ARG1; Table III).
However, the z-scores did not reveal any significant activation or
inhibition of the signaling pathways. PANTHER analysis suggested
that changes in gene expression profiles following ICH were
primarily enriched in ‘oxidative stress response’. Using IPA
software, associations between differentially expressed genes and
diseases were then analyzed. This indicated that changes in these
differentially expressed genes were primarily associated with
‘nervous system development’ and ‘neurological diseases’. After
analyzing these disease-associated networks and differentially
expressed genes in rats, a series of differentially expressed genes
associated with disease function were identified. Based on
functional annotation of these associated genes, it was possible to
determine that changes in the expression chip profile of the
hematoma in rats following ICH were primarily linked with ‘nervous
system development’. Considered with the biological phenomena
associated with pathological status following ICH, such as neuron
apoptosis, these differentially expressed genes were suggested to
be most closely associated with ‘repair of nerve function’ in the
perihematoma following ICH.
Protein function is regulated and mediated by
interaction with other proteins. Protein interaction network
analysis of differentially expressed genes following ICH in rats
was performed to classify 37 proteins according to molecular type;
this included 10 enzymes, one cytokine, two growth factors, two
transcription factors, seven ion channels, one transmembrane
receptor, one nuclear receptor and 12 others. Associated proteins
from the protein interaction network for selected for further
study, which led to the identification of 11 genes (SPP1, DUSP9,
COMT, BAIAP2L1, PKP2, HOMER3, RET, KIT, HPN, CNKSR2 and KALRN) that
were upregulated and four (TFAP2B, PPIA, SHOC2 and SNCA) that were
downregulated. Furthermore, these genes were confirmed via RT-qPCR
and cell localization analysis; the results showed that one protein
was localized in the extracellular domain, six were in the plasma,
six were in the cytoplasm and two were in the nuclei. This was
consistent with the results of GO functional annotation, indicating
that these 15 differentially expressed genes were the most
essential in terms of tissue damage in the peripheral hematoma
following ICH.
Venny 2.1.0 software was used to compare and analyze
the 15 selected differentially expressed genes and
disease-associated networks. A total of five common genes (14.3%)
were identified between the differentially expressed genes and
‘nervous system development’, ‘cell development’ and ‘neurological
diseases’. A total of five common genes were associated with ‘cell
development’, ‘embryonic development’ and ‘nervous system
development’, accounting for 16.1%; there were two common genes
with respect to ‘cell structure and function’ and ‘developmental
diseases’, accounting for 6.1%. Additionally, there were three
common genes associated with ‘organismal injury and abnormalities’,
which accounted for 11.5%, and 0 genes (0%) in common between
‘cardiovascular disease’ and ‘nervous system disease’. These
findings were consistent with the previous finding that changes in
gene expression identified via microarray expression assay in the
peripheral hematoma region following ICH are those of genes most
closely associated with repair of the nervous system (27). Subsequently, IPA was used to analyze
the causal network of neural functional development. This analysis
showed that only ASCL1 was activated; this protein is associated
with ‘cell growth’ and ‘neuron development (repair)’. Among the
candidate genes, ASCL1 mediated ‘cell germination’, ‘extension’,
‘neuron maturation’, ‘development and synaptic formation’ via
regulating RET. Additionally, western blotting and
immunofluorescence experiments revealed upregulation of RET in
perihematoma tissue in rats following ICH and localization of RET
in the neurons. The present results suggested that the
ASCL1-RET-nerve repair signal axis may serve a key role in repair
of nerve damage in the peripheral hematoma region following ICH;
this may provide an avenue for further investigation of the nerve
repair function in the perihematoma microenvironment following
ICH.
Supplementary Material
Supporting Data
Acknowledgements
Not applicable.
Funding
The present study was supported by the National
Natural Science Foundation of China (grant nos. 81901195 and
81873742) and Postgraduate Research & Practice Innovation
Program of Jiangsu Province (grant no. SJCX19_0864).
Availability of data and materials
The datasets generated and/or analyzed during the
current study are available in the Gene Expression Omnibus
repository, accession no. GSE171144.
Authors' contributions
JW participated in study design, performed the
experiments and wrote the manuscript. YC conceived the study and
performed the experiments. JL designed the experiments. MC
performed western blot and statistical analysis. JS analyzed the
data and approved the manuscript and revised it critically for
important intellectual content. KK made substantial contributions
to acquisition of data, revised and approved the manuscript. JS, KK
and JW confirm the authenticity of all the raw data. All authors
read and approved the final manuscript.
Ethics approval and consent to
participate
The present study was approved by the Animal Care
and Use Committee in Nantong University (approval no.
S20180816-012).
Patient consent for publication
Not applicable.
Competing interests
The authors declare they have no competing
interests.
References
|
1
|
Carcel C, Sato S, Zheng D, Heeley E, Arima
H, Yang J, Wu GJ, Chen GF, Zhang SH, Delcourt C, et al: Prognostic
significance of hyponatremia in acute intracerebral hemorrhage:
Pooled analysis of the intensive blood pressure reduction in acute
cerebral hemorrhage trial studies. Crit Care Med. 44:1388–1394.
2016. View Article : Google Scholar : PubMed/NCBI
|
|
2
|
Li WJ, Jin C, Vaidya A, Wu YT, Rexrode K,
Zheng XM, Gurol ME, Ma C, Wu SL and Gao X: Blood pressure
trajectories and the risk of intracerebral hemorrhage and cerebral
infarction: A prospective study. Hypertension. 70:508–514. 2017.
View Article : Google Scholar : PubMed/NCBI
|
|
3
|
Qiu M, Sato S, Zheng D, Wang X, Carcel C,
Hirakawa Y, Sandset EC, Delcourt C, Arima H, Wang J, et al:
Admission heart rate predicts poor outcomes in acute intracerebral
hemorrhage: The intensive blood pressure reduction in acute
cerebral hemorrhage trial studies. Stroke. 47:1479–1485. 2016.
View Article : Google Scholar : PubMed/NCBI
|
|
4
|
Yang J, Arima H, Wu G, Heeley E, Delcourt
C, Zhou J, Chen G, Wang X, Zhang S, Yu S, et al: Prognostic
significance of perihematomal edema in acute intracerebral
hemorrhage: Pooled analysis from the intensive blood pressure
reduction in acute cerebral hemorrhage trial studies. Stroke.
46:1009–1013. 2015. View Article : Google Scholar : PubMed/NCBI
|
|
5
|
Wang X, Arima H, Heeley E, Delcourt C,
Huang Y, Wang JG, Stapf C, Robinson T, Woodward M, Chalmers J, et
al: Magnitude of blood pressure reduction and clinical outcomes in
acute intracerebral hemorrhage: Intensive blood pressure reduction
in acute cerebral hemorrhage trial study. Hypertension.
65:1026–1032. 2015. View Article : Google Scholar : PubMed/NCBI
|
|
6
|
Wu J, Sun L, Li H, Shen H, Zhai W, Yu Z
and Chen G: Roles of programmed death protein 1/programmed
death-ligand 1 in secondary brain injury after intracerebral
hemorrhage in rats: Selective modulation of microglia polarization
to anti-inflammatory phenotype. J Neuroinflammation. 14:362017.
View Article : Google Scholar : PubMed/NCBI
|
|
7
|
Zeng Z, Liu H and Jiang D: NRH2 induces
cell apoptosis of cerebral tissues around hematomas after
intracerebral hemorrhage through up-regulating proNGF, sortilin and
p75NTR expressions. Xi Bao Yu Fen Zi Mian Yi Xue Za Zhi.
31:532–536, 539. 2015.(In Chinese). PubMed/NCBI
|
|
8
|
Zhao X, Ting SM, Liu CH, Sun G, Kruzel M,
Roy-O'Reilly M and Aronowski J: Neutrophil polarization by IL-27 as
a therapeutic target for intracerebral hemorrhage. Nat Commun.
8:6022017. View Article : Google Scholar : PubMed/NCBI
|
|
9
|
Xi T, Jin F, Zhu Y, Wang J, Tang L, Wang
Y, Liebeskind DS and He Z: MicroRNA-126-3p attenuates blood-brain
barrier disruption, cerebral edema and neuronal injury following
intracerebral hemorrhage by regulating PIK3R2 and Akt. Biochem
Biophys Res Commun. 494:144–151. 2017. View Article : Google Scholar : PubMed/NCBI
|
|
10
|
Guerrero WR, Gonzales NR, Sekar P,
Kawano-Castillo J, Moomaw CJ, Worrall BB, Langefeld CD, Martini SR,
Flaherty ML, Sheth KN, et al: Variability in the use of platelet
transfusion in patients with intracerebral hemorrhage: Observations
from the ethnic/racial variations of intracerebral hemorrhage
study. J Stroke Cerebrovasc Dis. 26:1974–1980. 2017. View Article : Google Scholar : PubMed/NCBI
|
|
11
|
Chen-Roetling J, Kamalapathy P, Cao Y,
Song W, Schipper HM and Regan RF: Astrocyte heme oxygenase-1
reduces mortality and improves outcome after collagenase-induced
intracerebral hemorrhage. Neurobiol Dis. 102:140–146. 2017.
View Article : Google Scholar : PubMed/NCBI
|
|
12
|
Urday S, Beslow LA, Dai F, Zhang F, Battey
TW, Vashkevich A, Ayres AM, Leasure AC, Selim MH, Simard JM, et al:
Rate of perihematomal edema expansion predicts outcome after
intracerebral hemorrhage. Crit Care Med. 44:790–797. 2016.
View Article : Google Scholar : PubMed/NCBI
|
|
13
|
Chiang CC, Meyer DM, Meyer BC, Agrawal K
and Modir R: RAcial Disparities in Ich after IV-tPA and
Neurointerventional Treatment (RADIANT). J Stroke Cerebrovasc Dis.
29:1044742019. View Article : Google Scholar : PubMed/NCBI
|
|
14
|
Viader A, Chang LW, Fahrner T, Nagarajan R
and Milbrandt J: MicroRNAs modulate Schwann cell response to nerve
injury by reinforcing transcriptional silencing of
dedifferentiation-related genes. J Neurosci. 31:17358–17369. 2011.
View Article : Google Scholar : PubMed/NCBI
|
|
15
|
Nagarajan R, Le N, Mahoney H, Araki T and
Milbrandt J: Deciphering peripheral nerve myelination by using
schwann cell expression profiling. Proc Natl Acad Sci USA.
99:8998–9003. 2002. View Article : Google Scholar : PubMed/NCBI
|
|
16
|
de Jonge RR, Vreijling JP, Meintjes A, Kwa
MS, van Kampen AH, van Schaik IN and Baas F: Transcriptional
profile of the human peripheral nervous system by serial analysis
of gene expression. Genomics. 82:97–108. 2003. View Article : Google Scholar : PubMed/NCBI
|
|
17
|
Wu H, Wang J, Cao M, Liang J, Wu D, Gu X
and Ke K: Effects of homocysteine-induced endoplasmic reticulum
protein on endoplasmic reticulum stress, autophagy, and neuronal
apoptosis following intracerebral hemorrhage. IBRO Rep. 9:207–217.
2020. View Article : Google Scholar : PubMed/NCBI
|
|
18
|
Shen J, Liu Y, Song Y, Li L, Duan C, Zhou
Y and Ke K: CHMP4B, ESCRT-III associating protein, associated with
neuronal apoptosis following intracerebral hemorrhage. Brain Res.
1597:1–13. 2015. View Article : Google Scholar : PubMed/NCBI
|
|
19
|
Hua Y, Nakamura T, Keep RF, Wu J,
Schallert T, Hoff JT and Xi G: Long-term effects of experimental
intracerebral hemorrhage: The role of iron. J Neurosurg.
104:305–312. 2006. View Article : Google Scholar : PubMed/NCBI
|
|
20
|
Cao M, Ke K, Sun H and Robertson A:
Effects of prostaglandin E1 on perihematomal tissue after
hypertensive intracerebral hemorrhage. Acta Neurol Taiwan.
20:172–181. 2011.PubMed/NCBI
|
|
21
|
Livak KJ and Schmittgen TD: Analysis of
relative gene expression data using real-time quantitative PCR and
the 2(-Delta Delta C(T)) method. Methods. 25:402–408. 2001.
View Article : Google Scholar : PubMed/NCBI
|
|
22
|
Ding W, Chen R, Wu C, Chen W, Zhang H, Fan
X, Wang H, Ji Y, Xie L, Ning X and Shen L: Increased expression of
HERPUD1 involves in neuronal apoptosis after intracerebral
hemorrhage. Brain Res Bull. 128:40–47. 2017. View Article : Google Scholar : PubMed/NCBI
|
|
23
|
Zhou T, Wang H, Shen J, Li W and Cao M,
Hong Y and Cao M: The p35/CDK5 signaling is regulated by p75NTR in
neuronal apoptosis after intracerebral hemorrhage. J Cell Physiol.
Feb 15–2019.(Epub ahead of print).
|
|
24
|
Dong Z, Liu Z, Liang M, Pan J, Lin M, Lin
H, Luo Y, Zhou X and Yao W: Identification of circRNA-miRNA-mRNA
networks contributes to explore underlying pathogenesis and therapy
strategy of gastric cancer. J Transl Med. 19:2262021. View Article : Google Scholar : PubMed/NCBI
|
|
25
|
Han X, Ren H, Nandi A, Fan X and Koehler
RC: Analysis of glucose metabolism by F-FDG-PET imaging and glucose
transporter expression in a mouse model of intracerebral
hemorrhage. Sci Rep. 11:108852021. View Article : Google Scholar : PubMed/NCBI
|
|
26
|
Gao L, Xu W, Li T, Chen J, Shao A, Yan F
and Chen G: Stem cell therapy: A promising therapeutic method for
intracerebral hemorrhage. Cell Transplant. 27:1809–1824. 2018.
View Article : Google Scholar : PubMed/NCBI
|
|
27
|
Wang S, Xue F, Li W, Shan Y, Gu X, Shen J
and Ke K: Increased expression of Triad1 is associated with
neuronal apoptosis after intracerebral hemorrhage in adult rats.
Int J Neurosci. 130:759–769. 2020. View Article : Google Scholar : PubMed/NCBI
|