Introduction
Colorectal cancer (CRC) is one of the most common
types of cancer worldwide, being the third most commonly diagnosed,
and the second most deadly cancer (1,2).
Therapeutically, patients with CRC are treated with a combined
regimen of 5-fluorouracil (5FU), folinic acid (FA) and oxaliplatin
(FOLFOX-6), which have been demonstrated to improve prognosis
(3). However, <10% of patients
at stage IV survive for >5 years (4,5) and
>90% of patients tend to develop metastasis and chemoresistance
(6,7). The presence of cancer stem cell (CSC)
populations are associated with chemoresistance, as well as with
tumor-initiating cells (TICs) (8–10).
CSCs are characterized by self-renewal, limitless proliferation and
differentiation into various epithelial lineages, and generating
tumor heterogeneity (11); mainly
derived from genetic alterations, they develop from either
intestinal stem cells or from differentiated intestinal cells by
epithelial-mesenchymal transition (EMT) (12,13).
Specific markers for normal stem cells, such as Lgr5, CD44, CD24,
CD26, CD29, CD166, CD326, CD133, EpCAM and ALDH, are commonly used
to isolate and characterize CSCs (14,15).
Previous studies suggest that the number of CSCs in tumors and
metastasis become enriched after starting chemotherapy and only a
small subpopulation survive (16–18).
These surviving CSCs expand after chemotherapy; hence it should be
no surprise that several mechanisms are involved in the process of
chemoresistance and that some specific genes are implicated as
potential candidates for resistance to anticancer agents (19–21).
Previous studies have identified response markers
that predict potential therapeutic targets and used next generation
sequencing to identify sensitivity of these biomarkers, and the
genomic and genetic characteristics of cancer cell lines or tumor
tissue samples (22–26). The present study analyzed the
expression of the genetic profile of colon-CSC CD44+
cells resistant to 5FU and oxaliplatin using a custom assay with
chemoresistance genes to discover a candidate gene of
colon-CSC.
Materials and methods
Participants
A total of 51 patients with CRC who underwent
resection of the primary tumor were enrolled between January 2014
and December 2016 at the Autonomous University of Nuevo Leon,
University Hospital ‘Dr. Jose Eleuterio Gonzalez’ (Monterrey,
Mexico) and the High Specialty Medical Unit (UMAE 25) of the
Mexican Social Security Institute (IMSS) and the Century XXI
National Medical Center, IMSS. This project was authorized by the
Ethics Committee of the Autonomous University of Nuevo Leon Medical
School and University Hospital (approval no. BI14-009) and by the
National Committee of Bioethics of the IMSS (approval no.
R-2012-785-075). All participants signed an informed consent
letter.
The inclusion criteria included the following: Men
and women aged >18 years with a diagnosis of CRC who wished to
participate in the study and who signed the informed consent
letter. As part of the study participants had to undergo CRC
surgical removal. The exclusion criteria included the following:
Patients with a family history of CRC who did not sign the informed
consent letter, pregnant women, Karnofsky Scale <60. Clinical
characteristics and sociodemographic data are shown in Table I. The quality of life of the
participants was valued immediately before surgery and 24 months
after starting treatment using the Karnofsky Scale (27).
 | Table I.Clinical characteristics of patients
(n=51). |
Table I.
Clinical characteristics of patients
(n=51).
|
Characteristics | Number of patients,
n (%) |
|---|
| Sex |
|
|
Female | 17 (33.0) |
|
Male | 34 (67.0) |
| Age, years |
|
|
30-49 | 8 (16.0) |
|
50-59 | 17 (33.0) |
|
60-69 | 15 (29.0) |
|
>70 | 11 (22.0) |
| Location |
|
|
Rectum | 18 (35.0) |
|
Colon | 33 (65.0) |
| Histopathological
diagnosis |
|
|
Adenocarcinoma | 51 (100.0) |
|
Moderately differentiated | 40 (78.5) |
| Poorly
differentiated | 4 (7.8) |
|
Others | 7 (13.7) |
| TNM |
|
|
T2N0M0 | 10 (19.6) |
|
T2N2M0 | 5 (9.8) |
|
T3N0M0 | 19 (37.3) |
|
T3N1M0 | 9 (17.7) |
|
T3N0M1 | 4 (7.8) |
|
T4N0M0 | 3 (5.9) |
|
T4N2M0 | 1 (1.9) |
Experimental strategy
Fresh sample fragments (>1.4 cm2) were
obtained from CRAC, normal tissue adjacent to the tumor (NAT; 3–7
cm distance from tumor) and normal colon from a donation of the
historical collection of unidentifiable samples from the Department
of Forensic Medicine of the University Hospital of the Autonomous
University of Nuevo Leon. Normal colon tissues were preserved in
RNA later stabilization solution at −20°C (Thermo Fischer
Scientific, Inc.). Each sample was then divided into four
fragments. A random fragment was used for chemosensitivity assays
in a primary culture assay. A second fragment was fixed with
Carnoy's solution, which contained ethanol, chloroform and glacial
acetic acid (6:3:1 ratio), for 24 h at room temperature, embedded
in paraffin, cut into 4-µm thick sections and mounted on glass
slides for hematoxylin and eosin stain (H&E) and
immunofluorescence (IF) analysis. A third CRAC fragment was
immersed in RNAlater (Thermo Fischer Scientific, Inc.) for 48 h at
4°C. RNA was isolated using RNAeasy mini kit (Qiagen GmbH).
Finally, a fourth CRAC fragment was used to isolate CSCs by culture
media.
Primary cultures (PCs)
A piece of tissue (CRAC, NAT and normal colon) from
each sample was washed with sterile phosphate-buffered saline (PBS;
Sigma-Aldrich; Merck KGaA), immersed in 70% ethanol for 1 min
(Sigma-Aldrich; Merck KGaA) and then cut into small pieces (<1
mm3) and mixed with 100 UI/ml Collagenase Type I
(Invitrogen; Thermo Fisher Scientific, Inc.) diluted in 4 ml RPMI
culture medium (Gibco; Thermo Fisher Scientific, Inc.), 100 µg/ml
gentamicin (Gibco; Thermo Fisher Scientific, Inc.) and 2.5 µg/ml
amphotericin B (Invitrogen; Thermo Fisher Scientific, Inc.). Next,
the preparations were incubated for 2 h in a water bath at 37°C
with a magnetic stirrer (8 stirs/min) on Cimarec hot plates
(Cimarec; Thermo Fisher Scientific, Inc.). The disaggregated cells
were separated from debris by sifting each of the digested
preparations through a 100 µM mesh cell strainer (BD Biosciences).
Then the cells were washed three times with PBS followed by
resuspension in 1 ml Iscove's Modified Dulbecco's Medium (IMDM;
Gibco; Thermo Fisher Scientific, Inc.) with 100 µg gentamicin/ml,
2.5 µg amphotericin B/ml (Gibco; Thermo Fisher Scientific, Inc.)
and supplement 10% fetal bovine serum (FBS; Invitrogen; Thermo
Fisher Scientific, Inc.). Preparations were then analyzed using the
trypan blue exclusion test for cell viability. Briefly, 0.4% trypan
blue solution was added to cells at room temperature. Immediately
after cells without the stain (viable cells) were counted using a
hemocytometer.
Determination of anti-CRAC first-line
drug cytotoxicity
The evaluation of cytotoxicity in response to a
mixture of first-line drugs (5FU, OXA and leucovorin) was performed
with the modified ATP-CRA assay (28). Briefly, viable cells were inoculated
in triplicate (20,000/50 µl) from each piece of tissue, as well as
from a cell line of colorectal adenocarcinoma Colo 320DM from ATCC,
in a 96-well ultralow attachment plate (Costar; Corning, Inc.) with
IMDM supplemented and 10% FBS. These cells were then divided into
microplates; six wells for the negative control, three wells for
treated cells, and three wells contained IMDM medium as a blank,
without cells or drugs. As an internal control, 105 pg ATP diluted
in 100 µl IMDM medium/well was added into three wells in each
microplate. Next, the mixture of the chemotherapeutic agents were
used (50 µl) at a final concentration: 10 µg 5FU/ml (Teva
Pharmaceutical Industries, Ltd.), 2.9 µg OXA/ml (Asofarma de
México) and 0.5 µg leucovorin/ml, which represent the maximal
plasma concentration of each drug. After 48 h of incubation at 37°C
and 5% CO2, the cells were lysed with 100 µl lysis
buffer/well, which was then included with the CellTiter-Glo kit
(Promega Corporation). The ATP content was measured in each well
with the luminometer Cytation 3 (BioTek Instruments, Inc.).
Luminescence was equivalent to the ATP production by cells as
described elsewhere (28). The
percentage of cell death (PCD) was determined as the rate of ATP
luminescence reduction in the treated cultures concerning the
untreated controls. Tissue with PCD ≥15.0±5.0 was classified as
drug-sensitive and PCD ≤15.0 as drug-resistant. Cytotoxicity was
evaluated as previously reported (28).
H&E and IF staining
A total of two histological sections were obtained
from each fragment. One of these sections was stained with H&E
to verify the orientation of each tissue. The other section was
processed for IF to visualize in situ and calculate CD44 and
CD24 percentage, using monoclonal primary antibodies CD44-PE-Cy7
(cat. no. ab46793) and CD24-FITC (cat. no. ab30350; Abcam). Each
antibody was diluted with PBS 1:100 v/v. Next 100 µl diluted
antibody was added by slide (50 µl from each diluted antibody) and
incubated at 4°C overnight. For each slide, 10 µl of mounting
medium with DAPI Vectashield (Vector Laboratories, Inc.) was used
to stain the nuclei of cells blue. Finally, all slides were stored
at 4°C in the dark until viewed with an epifluorescence microscope
(Nikon Eclipse 50i; Nikon Corporation). Colo320DM was used as the
positive control and as the negative control, histological sections
of the brain (negative control tissue) and colon (without primary
antibody) were used.
All preparations were observed with an
epifluorescence microscope at a magnification of ×400. From each of
the histological sections, five microscope fields were chosen for
image capture using a digital camera (Digital Sight DS-L2; Nikon
Corporation). Microscope fields were chosen with the aid of the
software, ENIS-Elements B12 v2.30 (Nikon Corporation). Finally, the
results were reported as the mean ± standard deviation of
CD44+ and CD24+ in the five microscope fields
of all CRACs, NAT, normal colon and COLO 320DM. The percentage of
CD44+, CD24+ and
CD44+/CD24+ cells was estimated regarding the
total number of cells in each histological section, by applying the
following equation:
PPC (percentage of positive cells)=the number of
positive cells/the total number of cells or nuclei observed by DAPI
×100.
P<0.05 by Student's t-test was considered to
indicate a statistically significant difference.
Double-labeled immunohistochemistry kit confirmed
the expression level of CD44 and CD24 (HRP/Green & AP/Fast Red;
Abcam) according to the manufacturer's protocol, using monoclonal
primary antibodies anti-CD24 (clone ALB9; 1:100) or anti-CD44
(clone F10-44-2; 1:200) and anti-CD26 (clone: polyclonal; 1:200). A
total of six sensitive and six resistant tissues were evaluated to
confirm a significant difference between the two groups analyzed.
Slides were scanned with an Aperio AT2 Digital Pathology Scanner
(AT2 Model; Leica Microsystems, Inc.), evaluating the intensity of
the signal using the Sketch and Calc program (iCalc Inc., 2018;
http://www.sketchandcalc.com/).
RNA-total isolation from CRACs
A total of 34 fresh whole samples of CRACs were
submerged in 1.5 ml RNAlater for 48 h at 4°C. Afterwards, RNA was
isolated using an RNAeasy mini kit and was quantified with a
NanoDrop spectrophotometer (Thermo Fisher Scientific, Inc.), The
RNA was kept at −80°C until ready for use. Also, RNA was quantified
with RiboGreen™ (cat. no. R11490; Thermo Fisher Scientific, Inc.)
using the Qubit instrument and integrity was analyzed using the
Bioanalyzer RNA 6000 NanoAssay Kit, Agilent 2100 Bioanalyzer system
(Agilent Technologies, Inc.). The remaining RNA was stored at −80°C
until the samples were processed to construct the libraries.
Isolation and expansion of CSC
Isolation and expansion of CSC were performed as
described by the modified method of Cammareri et al
(29). Briefly, cells from
disaggregated tissue CRAC or Colo320DM were seeded in 100 µl/well
(5×10⁴ cells suspended in 5 ml of medium) in 96-low
adhesion plates and incubated at 37°C with 5% CO2. Cell
growth every third day was observed using an inverted microscope
(VE403; Velab). During this period, 50 µl of fresh Dulbecco's
Modified Eagle Medium (DMEM) F12 culture medium enriched with 6 mg
glucose/ml, 1 mg NaHCO3/ml, 5 mM
4-(2-Hydroxyethyl)-1-piperazine ethane sulfonic acid (HEPES), 2 mM
glutamine, 4 µg heparin/ml, 10 ng basic fibroblast growth factor
(bFGF)/ml, 20 ng epidermal growth factor (EGF)/ml, 100 µg human
transferrin/ml, 25 µg insulin/ml, 9.6 µg putrescin/ml, 30 nM sodium
selenite and 20 nM progesterone was added every 3–5 days to each
well [all the above reagents were purchased from Sigma-Aldrich
(Merck KGaA)]. Cultures were incubated at 37°C in a 5%
CO2 atmosphere for 15–20 days until typical CSC
spheroids were observed.
Identification of CD44+ and CD24+ CSCs
and differentiation of epithelial cells
CSC isolates (n=3 with 500,000 cell/ml) 100 µl were
seeded in a slice coated w/poli-L-lysine, after fixation with
Carnoy's solution for at least 48 h at 4°C. Next, quantification of
CD24 and CD44 cell surface markers was performed by IF as
previously mentioned. Then, five fields by color for each sample
were counted by two independent observers. The graphs represented
the mean obtained ± standard error. For differentiation of CSC to
epithelial cells, 1×10³ CSCs were incubated in each well
of the four microchambers of a Nunc Lab-Tek II Chamber Slide (Nalge
Nunc International; Thermo Fisher Scientific, Inc.) at 37°C in a 5%
CO2 atmosphere for 25–30 days, with RPMI 1640
supplemented gentamicin, amphotericin B and 2% bovine serum albumin
(SAB; Sigma-Aldrich; Merck KGaA), culture medium was replenished
every third or fourth day. Visualization of the morphology of the
cells was performed with an inverted microscope (VE403; Velab). The
concentration of FBS in the culture media was increased on day 3–4
to 5% and on day 9–10 to 10% and after day 15 to 15%. The
differentiated cells were fixed with methanol-acetone (1:1 v/v) and
stored at 4°C until their analysis with in situ IF.
Subsequently, epithelial cells were characterized using primary
monoclonal antibodies 1:200 in PBS (v/v) (Abcam), anti-CK-17 (cat.
no. ab51056), anti-CK-20 (cat. no. ab109111), a mixture of
monoclonal antibodies against a cocktail of CK (cat. no. ab115959)
signals were detected using secondary polyclonal antibodies
anti-IgG [1:500 in PBS (v/v) Alexa Fluor 488; cat. no. A32731;
Invitrogen; Thermo Fisher Scientific, Inc.] and anti-EGFR (cat. no.
ab32562) detected secondary antibodies polyclonal anti-IgG [1:500
PBS (v/v) Alexa Fluor 660; cat. no. A-21073; Invitrogen; Thermo
Fisher Scientific, Inc.]. From three randomly selected fields,
images were captured at ×400 magnification. These images were
merged using ImageJ version 1.52r (National Institutes of
Health).
Characterization of Colo 320DM- and
CRAC-CSC
From CSCs (2,000 cells/well), resistance to 5FU/OXA
was determined by ATP-CRA after 48 h of exposure to the mixture
(5FU and Oxa). Then the cells (~500,000) were washed twice with PBS
and incubated with fresh CSC-medium without 5FU/OXA. From these
cultures (CRACs- or -Colo320), one cell fraction was selected with
magnetic beads by binding anti-CD44 monoclonal antibodies. Cells
were passed through an LS Column and a MidiMACS Manual Separator
(Miltenyi Biotec, Inc.). Next, the eluted cell suspension was
centrifuged at 500 × g for 10 min at room temperature, discarding
the supernatant and resuspending the cells in 500 µl RNAlater and
left at 4°C for 48 h after isolating total RNA.
cDNA obtention and sequencing
RNA-seq libraries were constructed using 50–250 ng
RNAs (RIN>7) with TruSeq Target RNA Expression System (Illumina,
Inc.). The libraries were denatured as single-stranded DNA
molecules, captured on Illumina flow cells, amplified in
situ as clusters and finally sequenced for 150 cycles on an
Illumina MiSeq Sequencer (Illumina, Inc.) according to the
manufacturer's instructions. The cDNA library was constructed using
the TruSeqRNA Access Library Prep system (Illumina, Inc.).
Libraries with concentrations ≤2 nM were discarded. The size of
cDNAs was determined with a 2100 Bioanalyzer system (Agilent
Technologies Deutschland GmbH). The concentration of cDNAs was
determined with Pico green (Thermo Fisher Scientific, Inc.),
following the instructions of the manufacturer. cDNA sequencing was
performed with 10 pM of the libraries with 0.1% PhiX. Single-end
sequencing of multiplexed cDNA libraries was carried out on an
Illumina MiSeq sequencer for 150 cycles (Reagent kit v3; Illumina,
Inc.).
Normalization of cDNA data
Data from four cDNA sequence-readings was obtained
using the following equation: N=Total number of readings of each
gene (TNRG)/Total number of readings per sample (TNRS) × Total
number of readings of all sequenced cDNA (TNRAS). Where N denoted
normalized data; TNRG, the total number of readings of each gene,
TNRS, the total number of readings per sample and TNRAS, the total
number of readings of all sequenced cDNA. Over 94% of reads were
identified, accepting >Q30 (Q30=1 error each 1,000 bp).
Bioinformatics analysis
To visualize the differences in gene expression
associated with resistance, heatmaps were developed using GraphPad
Prism 6.0 program (GraphPad Software, Inc.). The number of
normalized readings for each of the samples of sensitive, resistant
and control (healthy) tissues were considered and plotted. Using
the Search Tool for the Retrieval of Interacting Genes/Proteins
(STRING) program (https://string-db.org/), the STRING protein-protein
interactions were evaluated to determine whether these genes were
involved in any common metabolic pathways or functions.
KRT-18 analysis on CRAC
Based on the results, one gene, KRT-18, with
overexpression of resistance of CRAC and CSC was chosen. To confirm
the results, we analyzed co-expression of KRT-18 and CD44 by IF
using another 12 different paraffin-embedded CRAC only from stages
III or IV (six tissues classified as drug-sensitive and
drug-resistant) and six healthy tissues.
Statistical analysis
Data for chemosensitivity of primary cultures of
CRAC and healthy colon samples were performed in triplicate and
analyzed using Bonferroni's correction following one way ANOVA,
variance analysis and Student's t-test. The percentages of the
markers CD44, CD24 and CD26 were obtained in duplicate from
different sections of tissues of each patient in five fields and
two independent observers made analysis using Kruskal-Wallis
(ANOVA-means and ranges) and Student's t-test. P<0.05 was
considered to indicate a statistically significant difference.
Statistical analyses were performed using the SPSS
version 20 (IBM Corp.). Results of CRAC analysis showed a PCD
≥15±5% standard deviation and a percentage ≥5 of CD44+
and CD24+ cells were considered sensitive to 5FU/OXA.
From this, a heat map was constructed to show the number of
normalized readings using the GraphPad Prism 8 program (GraphPad
Software, Inc.). The levels of gene expression by the CSCs from
sensitive and resistant CRACs were then compared with Basespace
Illumina software version 4.10 (Illumina, Inc.) and Euclidean
distance (absolute difference between average normal expression or
sensitive CRAC and resistance CRAC). P<0.05 was considered to
indicate a statistically significant difference. To identify which
genes were relevant, genes found with overexpression in normal
colon tissue and human mesenchymal stem cells isolated from adipose
tissue (hMSC-AT) were discarded.
Finally, sets of data were analyzed by one-way ANOVA
followed by the Bonferroni post hoc test. P<0.05 was considered
to indicate a statistically significant difference.
Results
Variability of drug-sensitivity in
CRACs-PCs
To determine the threshold to define the sensitivity
of the tumors, some adjacent regions from tumor and healthy tissues
were evaluated with the same experimental technique. All 12/12
samples from healthy tissue (100%) had PCD ≥15.0±5.0 and were
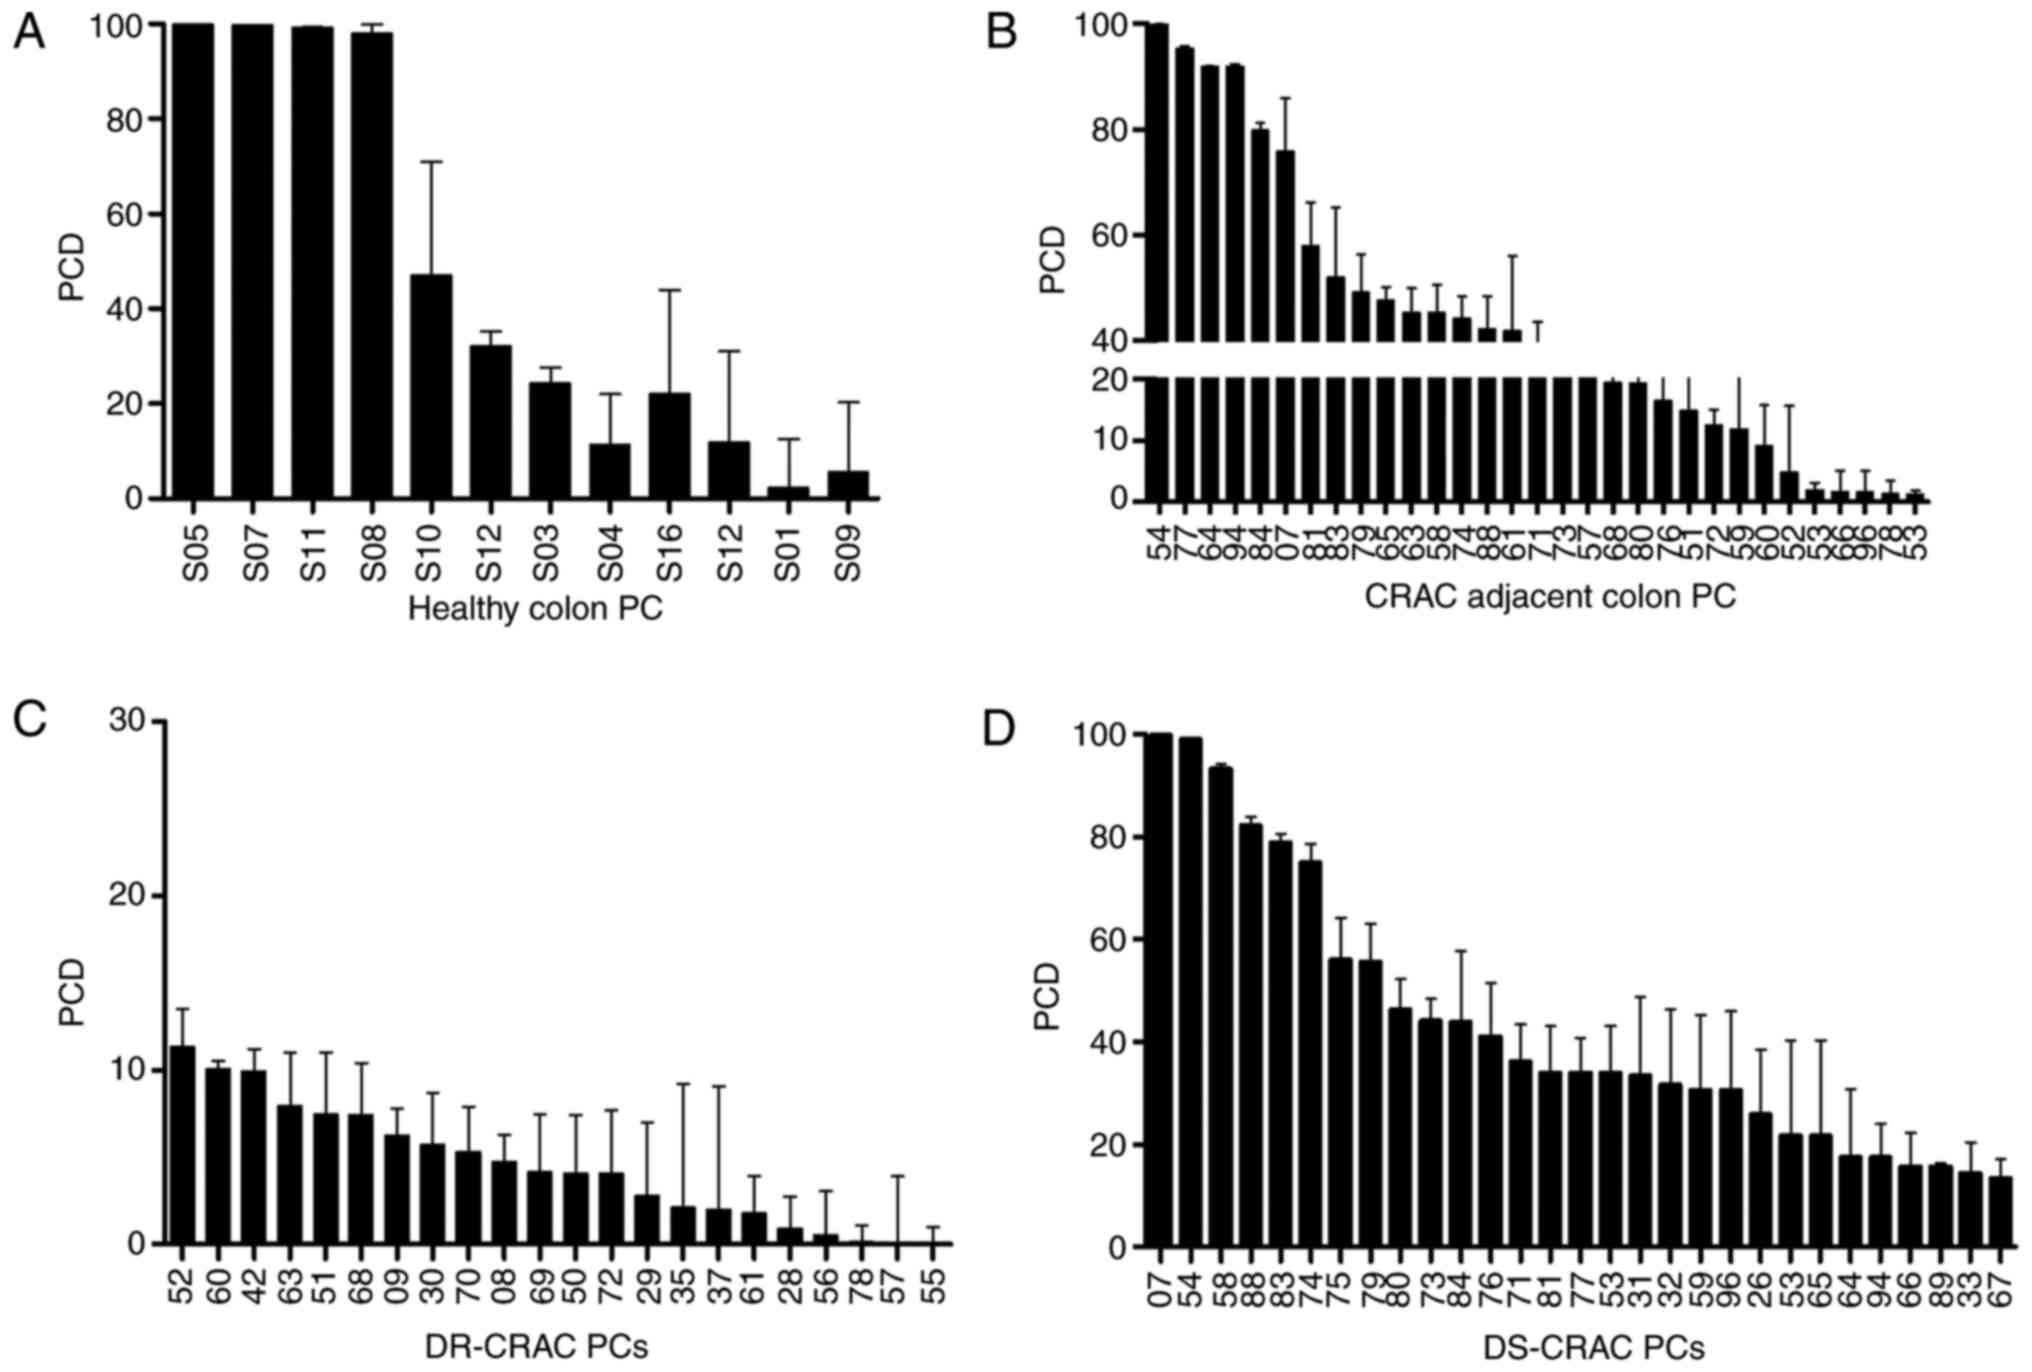
classified as drug-sensitive, Fig. 1A
and B show that 22/31 (71%) CRAC-adjacent colon samples were
sensitive to treatment. Then the response to 5FU/Oxa on all primary
cultures (PCs) was analyzed as seen in Fig. 1C and D. This demonstrated that CRAC
22/51 (43.1%) samples were drug resistant and 29/51 (56.9%) were
sensitive. Also, 14 samples (44%) from the same person (CRAC and
CRAC-adjacent colon) were resistant and 17 samples (56%) were
sensitive. Colo 320 was a sensitive control (92.70±00.22).
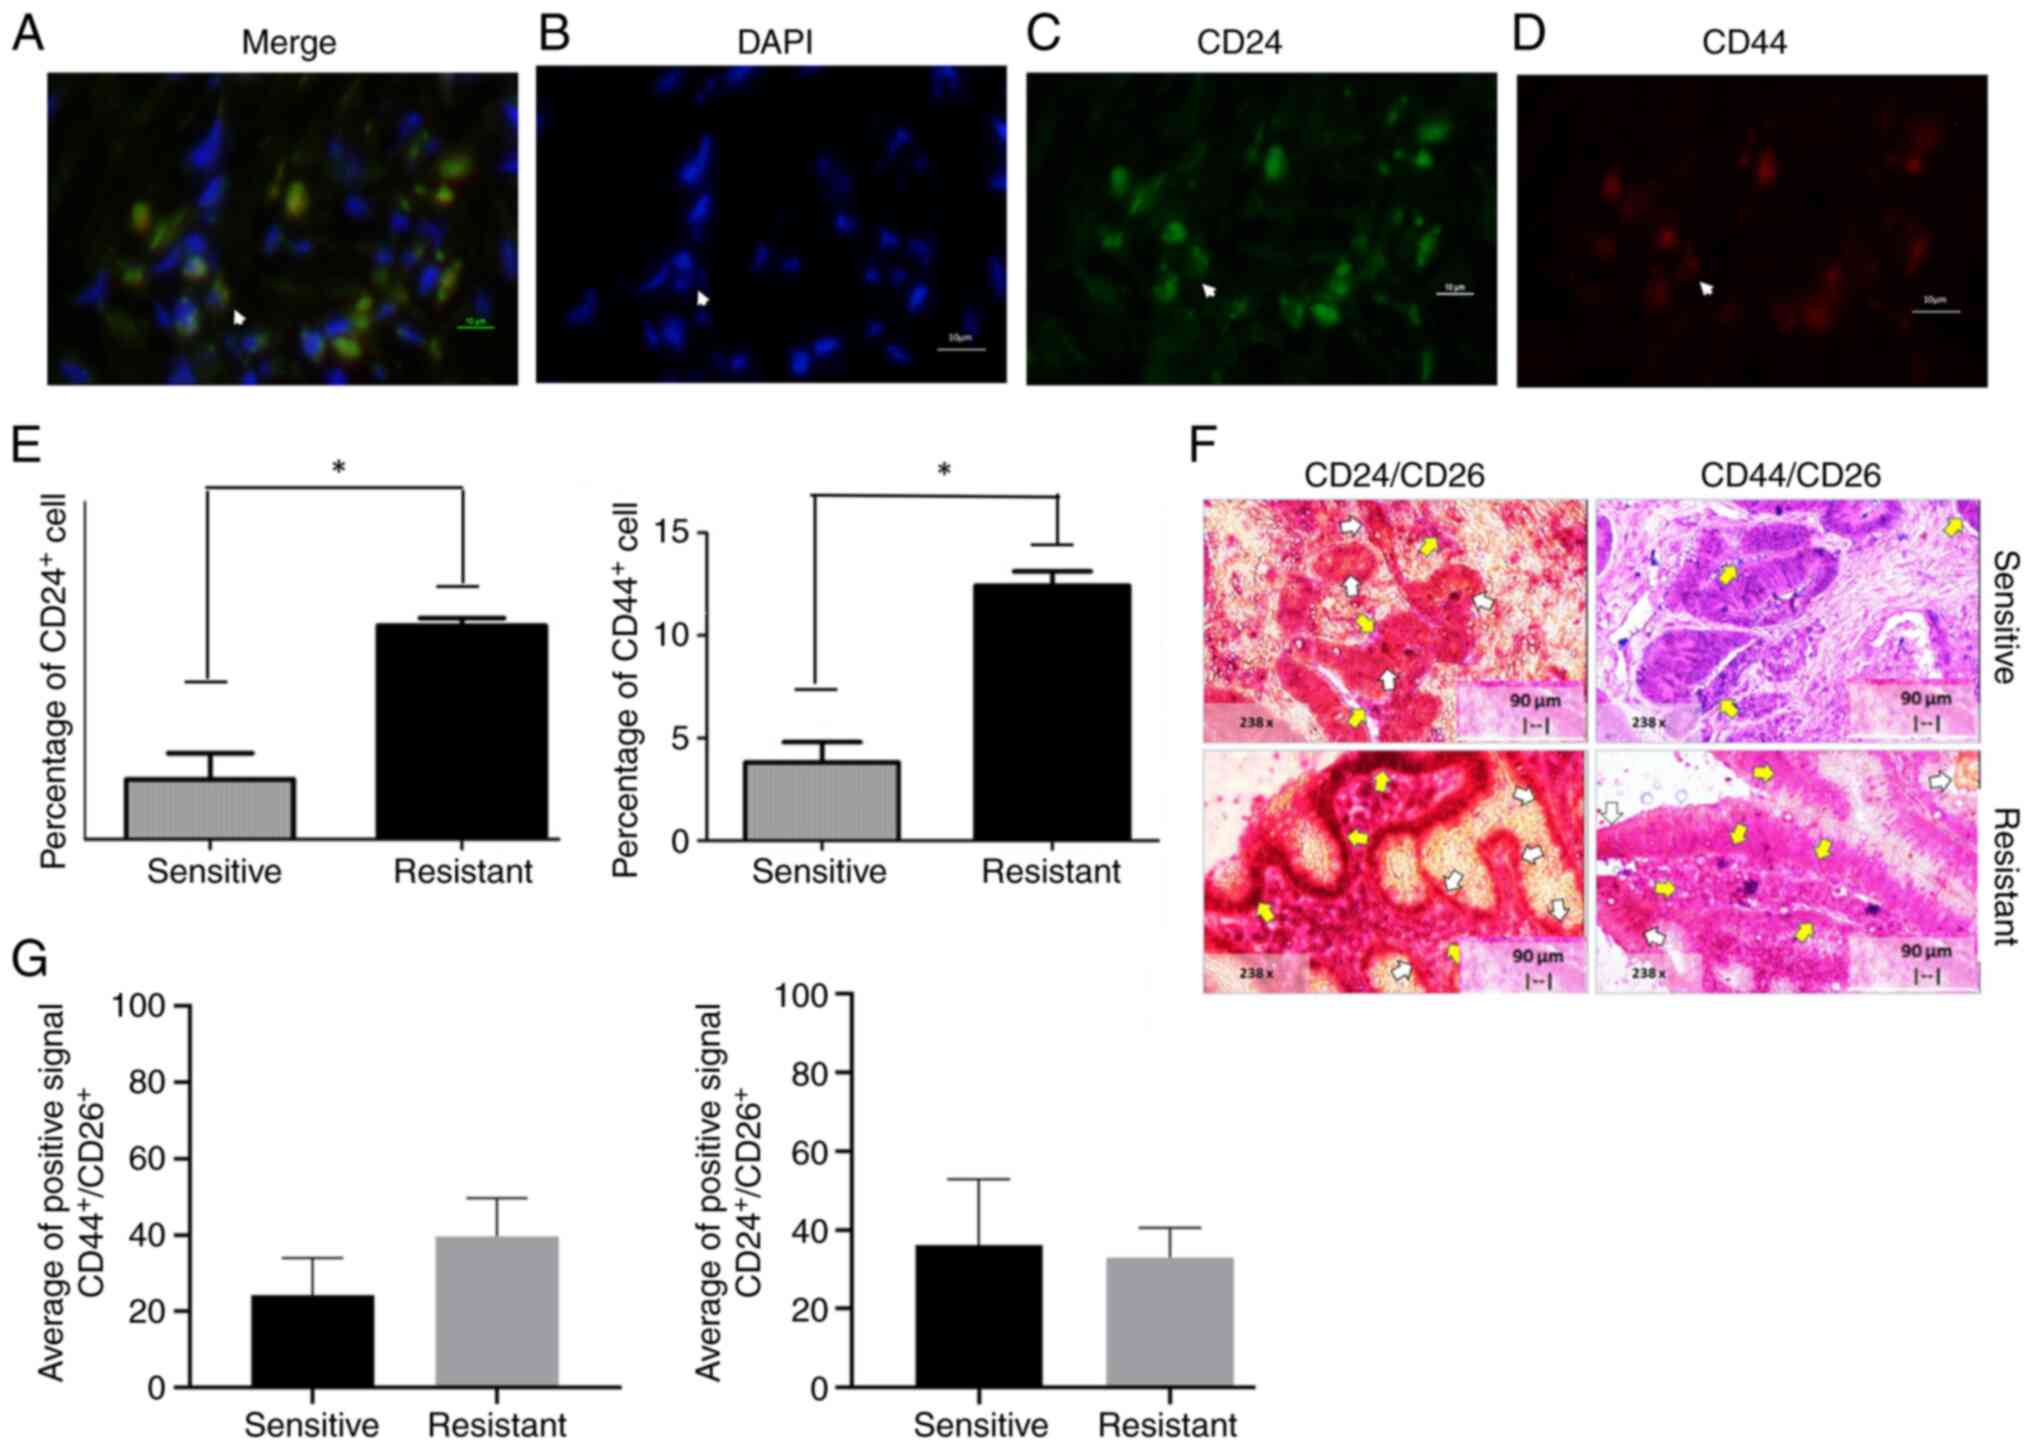
CD24+ and CD44+
markers in CRACs
CRACs expressing CD24 and CD44 were then tested for
sensitivity and resistance to 5FU and oxaliplatin. Results shown in
Fig. 2A-D. Fig. 2E-G show the mean ± standard
deviation of CD44− and CD24-positive markers on
sensitive and resistant CRACs. Briefly, the percentage of
CD44+ cells was 4.80±2.84% and for CD24+
3.85±1.48%. The mean ± standard deviation of
CD44+/CD24+ cells was 2.70±2.075. By
contrast, the positive percentage of CD44+ and
CD24+ cells in the resistant tumor were 11.75±13.12 and
9.86±9.18%, respectively. There was a significant difference in
CD44+ and CD24+ (individual markers) as
sensitive and resistant tissue, as shown in Fig. 2E and F.
Quality and integrity RNA total
CRACs
Total RNA (n=51) was then obtained from the CRACs
cells (50-1,200 ng/µl) and the integrity analyzed. This resulted in
34 samples with a RIN >7, which were later used for the analysis
of gene expression. In addition, 10 RNA samples (80–849 ng/µl) from
healthy tissue had higher quality and integrity and were chosen for
analysis (data not shown). Results were public and added to
https://www.kaggle.com/elsangarzatrevio/quibit-and-bioanalyzer/version/1.
None of the adjacent colon to CRAC was used for RNAseq.
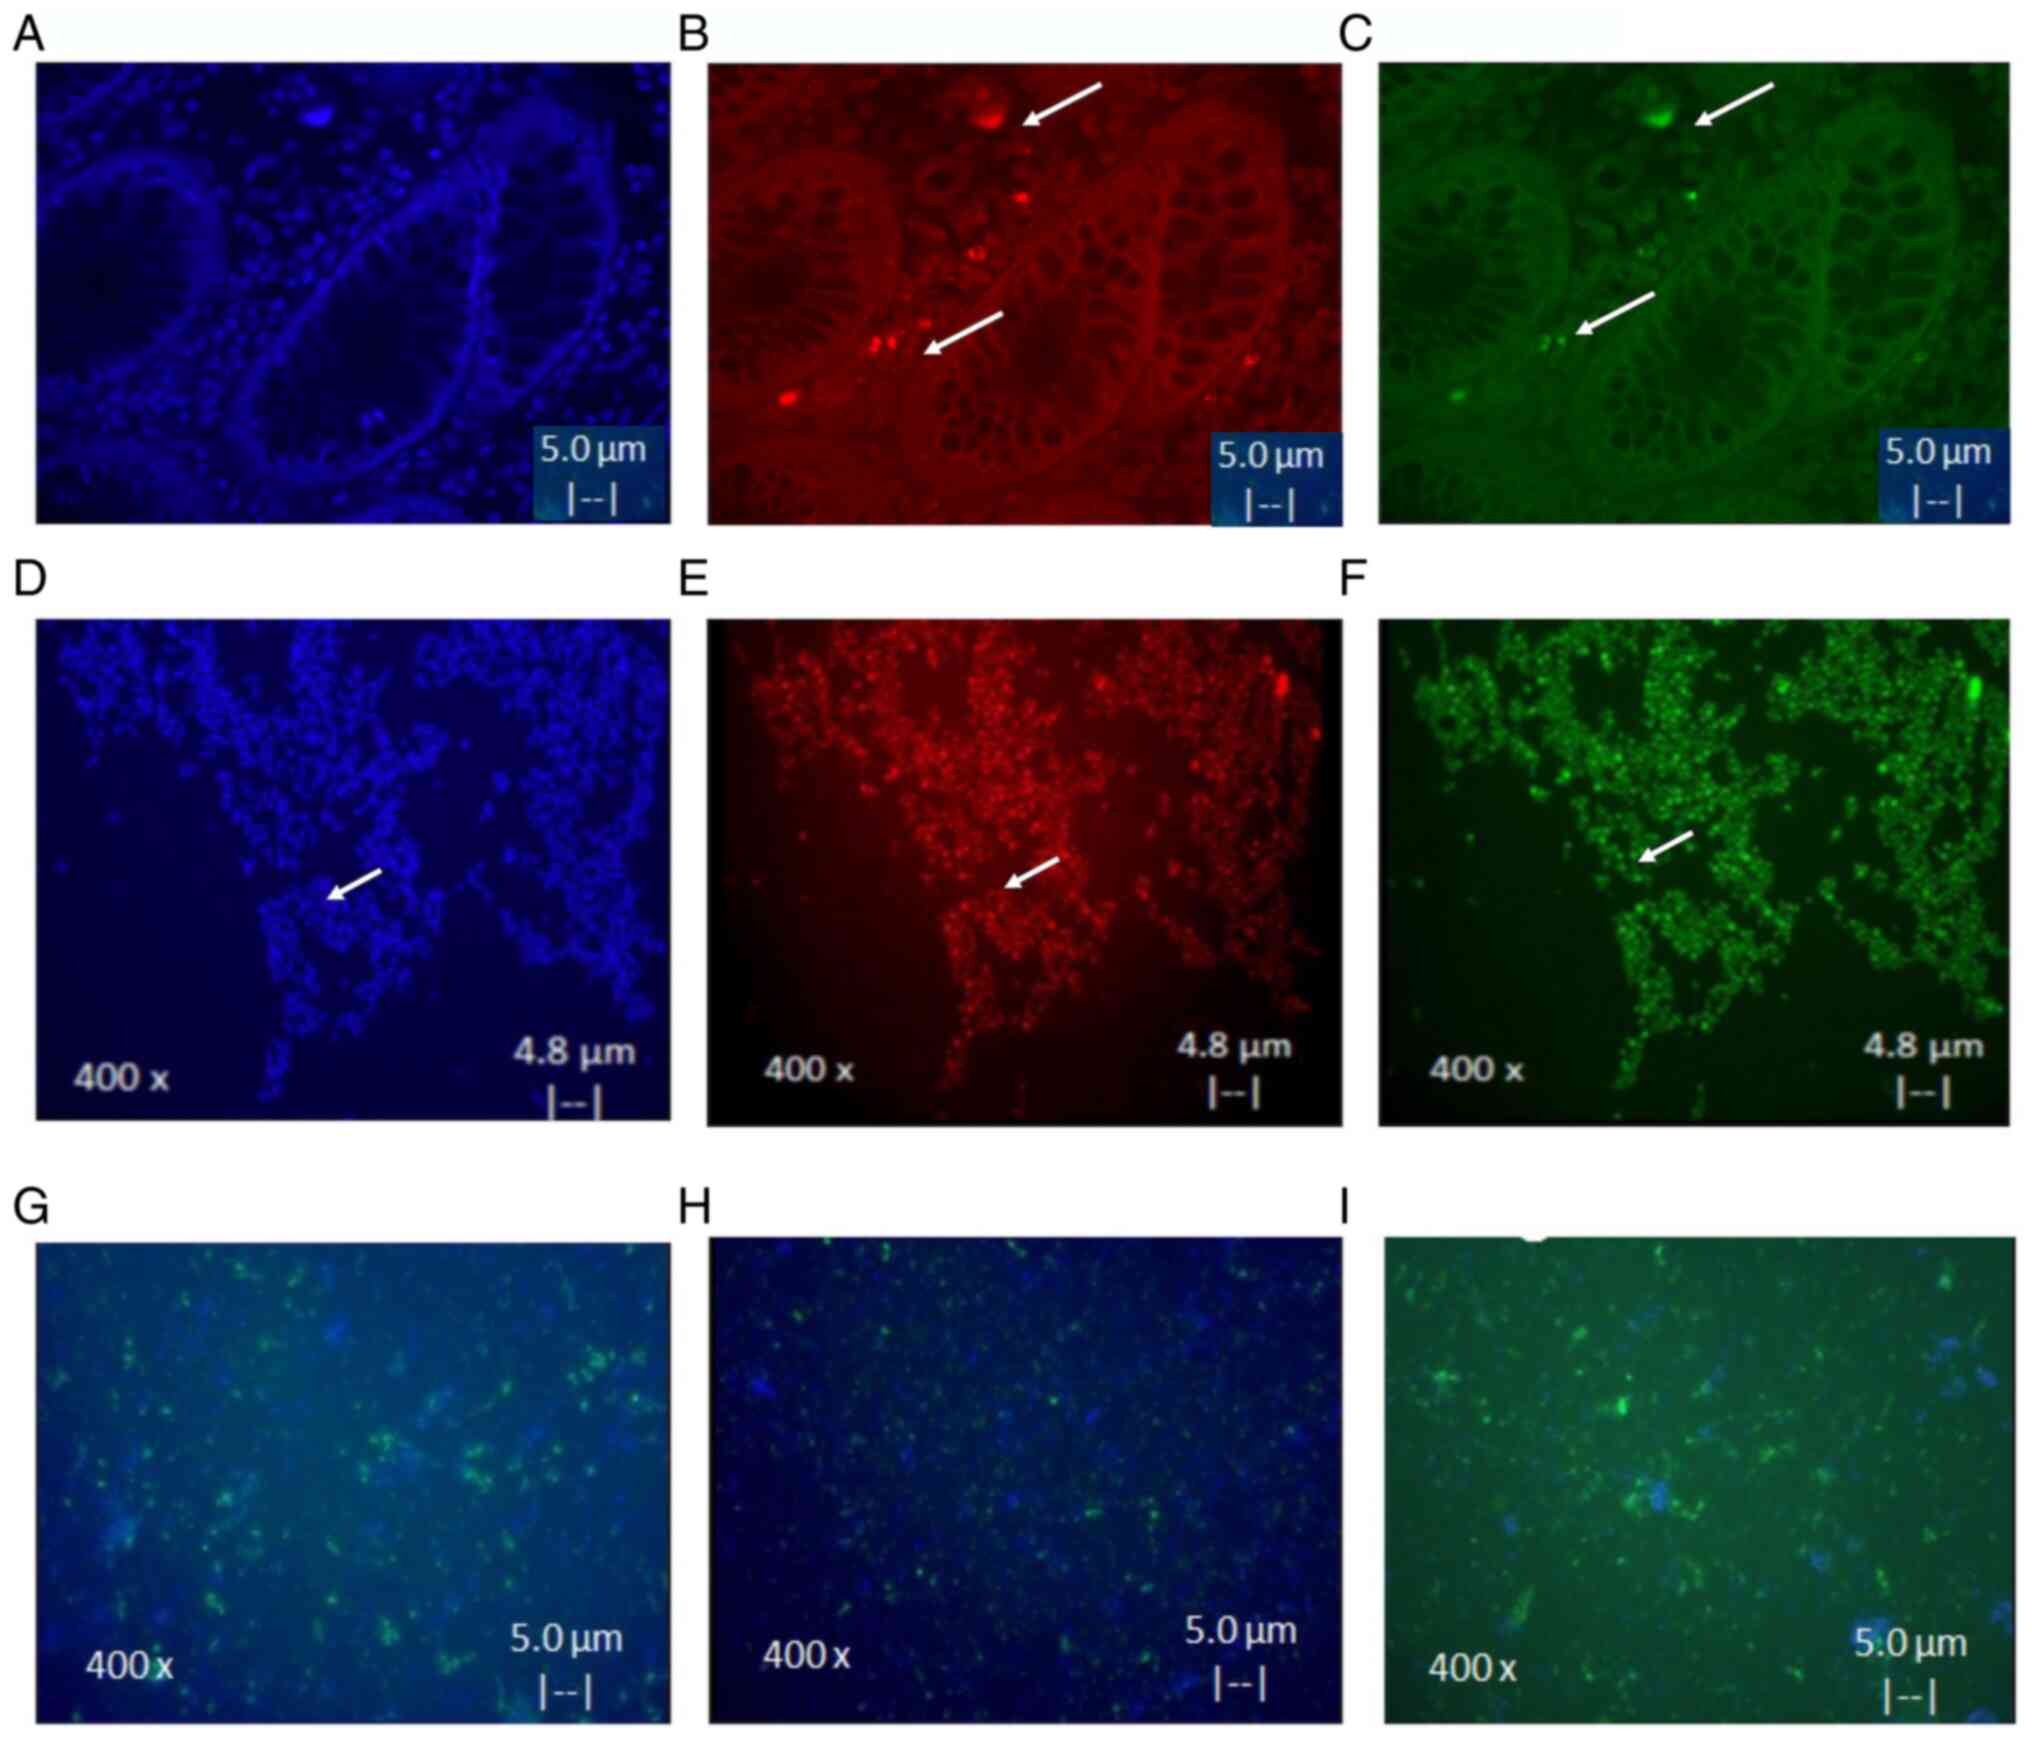
Isolates and characteristics of
CSCs
A total of three CSC cultures from CRACs of advanced
cancer tissue and from cell line Colo320 were successful and were
used as a control. CSC isolates were positive to CD44 and CD24.
These results demonstrated an eight times higher expression of
markers after culture, as shown in Fig.
3A-F. It was also found that differentiation of CSC to
epithelial cells occurs only after 15 days in medium with serum.
Notably it was observed that cells acquired the ability to adhere
to plastic and express EGFR (Fig.
3G), CK17 (Fig. 3H) and CK20
(Fig. 3I) markers (<80%).
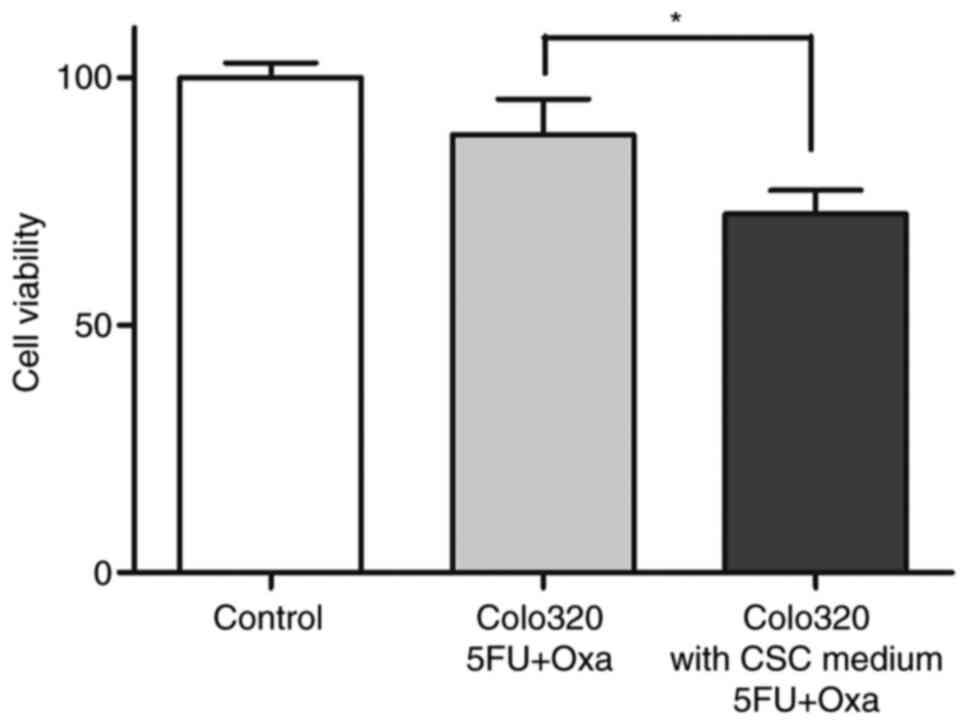
CSCs were further analyzed for chemoresistance by an
ATP-CRA modified assay. It was also observed that cell lines from
Colo320 maintained in medium enriched CSC, permitted reduced
cytotoxic activity of the drugs assayed. Results showed a decrease
(Fig. 4) from 88.43±7.17 to
72.36±4.78 (P<0.05). However, CSCs isolated from tumor tissue
were resistant before and after they were in the medium to enrich
CSCs. After eliminating the stimulating chemotherapeutic agents,
tumor cells that proliferated were observed.
Genes overexpressed by CSCs from
Colo320DM and CRACs
A total of 66 genes were selected that were
associated with chemoresistance of 5FU and oxaliplatin-based in the
project (ID 40581) created with Homo sapiens (human) genome
assembly GRCh37 (hg19) from Genome Reference using the Illumina
platform. Next Generation Sequencing (NGS) technologies were used
to assess overall gene expression profiles. Pre-validated primers
for the conserved region and specific targets were selected and are
shown in Table II. Gene expression
levels in healthy colon samples and CSC resistance to 5FU and
oxaliplatin were compared. Protein-protein interactions were also
analyzed using STRING, to ascertain if the overexpression protein
belonged to the same pathway or metabolic route. A heatmap of the
Colo 320 line was constructed before and after treating CSC in
medium (Fig. 5A); the genes that
were found highly overexpressed were: Excision Repair 1,
Endonuclease Non-Catalytic Subunit (ERCC1),
Poly-ADP-ribosyltransferase (PARP1), TGFβ, ATP binding cassette
subfamily B member 1 (ABCB1) and MYC.
| Table II.Primers used for expression
analysis. |
Table II.
Primers used for expression
analysis.
| Gene | Region | Forward primer
(5′→3′) | Reverse primer
(5′→3′) |
|---|
| VEPH | Chr3 |
CTTTGGAGCAAATTAAGATAATTAGCTCA |
AACAATGACCAGGCAGTAGTTGAAATC |
| ERCC1 | Chr19 |
GCTGGGCCAGAGCACCTGTGCCCTGTT |
ACAACCTGCACCCAGACTACATCCAT |
| SLC4A4 | Chr4 |
GATGGGCAGGAGATGGAGTGGAAGGAAA |
AGAAAAAGTGGAACAGGGTGGGGAAA |
| HYAL1 | Chr3 |
TTCTATGACACGACAAACCACTTTCTGC |
TGGAGCACAGCCTGGGGGAGAGT |
| VNN1 | Chr6 |
AGTAAACTGGATCCCCTGTAATAATCG |
CCAGTACAAGAAAGACTCAGCTGCCT |
| ANKRD44 | Chr2 |
TGCTCATCCATAAAACTGAAGATGTGA |
ACCCCTCTTCATGTGGCCGCATTTCT |
| PROM2 | Chr2 |
CCTCTCGGTGGTGCAGCTCAATCCTTT |
GTTGGTAAAGGCCCTACTGAATGAGCT |
| DNER | Chr2 |
AGAAAGTTGTAGAAATGAAATGGGATCAAG |
GGGAATGCCAGTTCTAACAGCTC |
| BTG1 | Chr12 |
TCCTGCCGCCTCCTGTCTCGAAAATAA |
TCTAAAGAAAGAAAGACAAAAGTAGTCGTC |
| CTPS2 | ChrX |
TCGATGCTGGCACTTTTTCACCTT |
GTCTTAAATGATGGTGGAGAAGTTGAT |
| ITPA | Chr20 |
TCTGGAGAAGTTAAAGCCTGAAGGTC |
GCCGGGTTCGAGGACAAGTCAGCCTAT |
| ENTPD5 | Chr14 |
GGTGCTGTTAGGTAGGACTTGTATCCA |
AAAGGAACCAAGGAGAAAATTCAGA |
| MLH1 | Chr3 |
ATCTGAGGAGTCGACCCTCTCAG |
CCAAACTCCTGGAAGTGGACTGT |
| PARP1 | Chr1 |
TGGTGTGAATGACACCTCTCTACT |
TATTGCTCAGGTAAATCTGAAGTATCTGC |
| UCK1 | Chr9 |
CCTGATAGGGGTGAGCGGCGGCACT |
TGTGTGAGAAGATCATGGAGTTGCTG |
| DPYD | Chr1 |
TAAATCATTCATCACAAGTATTGCAAACA |
CTGCTAAGATGATATTTTCTGACAACCCAC |
| TYMS | Chr18 |
TATTTACCTGAATCACATCGAGCCACTG |
CCAGACCTTTCCCAAAGCTCAGGATT |
| IL-23R | Chr1 |
TGGAATTATGTGCTTCAAACAGGTTGA |
GGAAACAGTCTTTTCCTGCTTCCAGA |
| RNF180 | Chr5 |
GTTTTATGGAGTATCTTGAGAATCAAGTG |
ATGATTCAGTTGATGCTCAAAATATTTGTC |
| C70rf44 | Chr7 |
ATTTTCAAGAGAGTTGTGCTATGATGTGG |
GCAGGAAGCAGGCGGTCAATGCCTCT |
| GABRR1 | Chr6 |
ATTTCAGCATGAGGCCTGGCTTT |
TGTGGATGTGCAGGTGGAGAGTTT |
| CYP2C18 | Chr10 |
TTCCAGTGGCTGAAAAAGTTAACAAAGG |
ATGGAAAGAGATGGAAGGAGATCCG |
| ALDH3B2 | Chr11 |
GACGTGCTGGCCCAGGACCTGCATA |
TCTGAGCTCATCCTTTGCCAGAA |
| HGD | Chr3 |
ACACATAGAGGAGAGAGAAAATGGCTG |
ACATTTCTGGATTTGGGAATGAGTGTTC |
| CLEC4E | Chr12 |
ATTCATCTAAATCATCTGAAACACAATGC |
GAGAGGATGCTTCTCTTCCCAAATGT |
| ERAP2 | Chr5 |
TTATAAAAGCACATACAGAACTCTTGGTGG |
TGAGCCAACCCAGGCACGCATG |
| MTHFR | Chr1 |
CGAGCGTTCTGAGTCACCCGGGACT |
CCCAGCCATGGTGAACGAAGCCA |
| GSTP1 | Chr11 |
CAGGGAGGCAAGACCTTCATTGT |
TACAACCTGCTGGACTTGCTGCTGAT |
| GSTT1 | Chr22 |
TGAAGGACGGGGACTTCACCTTGA |
CTACCTGACGCGCAAATATAAGGTC |
| GSTM1 | Chr1 |
CAGCTGGGCATGATCTGCTACAAT |
CAAAGTACTTGGAGGAACTCCCTGAA |
| MMRN1 | Chr4 |
TACCAAAAATCAAATTTCGAAACAACTAG |
TGTACATACCAGGTTATCTCCCACAGTG |
| CINP | Chr14 |
AGGAACTGCAGGCCACCTTGGAT |
CCAAAATACAGGTGAAAATGGAAAAGCTG |
| BRAF | Chr7 |
GGCCTCTTCGGCTGCGGACCCTGCCATT |
TGGAATATCAAACAAATGATTAAGTTGACA |
| KRAS | Chr12 |
AGCGGCTCCCAGGTGCGGGAGAGA |
GAATATAAACTTGTGGTAGTTGGAGCT |
| BNIP3 | Chr10 |
TCTCTCATTTGCTGGCCATCGGATT |
GATCTATATTGGAAGGCGTCTGACAACC |
| PSAP | Chr10 |
CTTCCTCCTGGCCAGCCTCCTG |
TCCTTGGACTGAAAGAATGCACCAG |
| APC | Chr5 |
CTGGACAGATTGATTTATTAGAGCGTC |
GCTTAACTTAGATAGCAGTAATTTCCCTGG |
| ABCG2 | Chr4 |
AATGCAACAGGAAACAATCCTTGTAAC |
TGTACTGGCGAAGAATATTTGGTAAAGC |
| ABCB1 | Chr7 |
TGAAGCCACGTCAGCTCTGGATACAGAAA |
CCCTGGACAAAGCCAGAGAAGG |
| NFKB | Chr4 |
ACTGCTGGACCCAAGGACATGGT |
AACCTGGGTATACTTCATGTGACAAAG |
| AKT1 | Chr14 |
GTGAGGCTCCCCTCAACAACTTCTCT |
GTGCCAGCTGATGAAGACGGAG |
| TGFB1 | Chr19 |
TACATTTGGAGCCTGGACACGCAGTA |
ACAACCAGCATAACCCGGGCGC |
| TERT | Chr5 |
ACAAGCTGTTTGCGGGGATTCG |
CTGCTCCTGCGTTTGGTGGATGATTT |
| BST1 | Chr4 |
GCGCACTGCTGAGTCCCGAGCA |
CAAGAACTGCACAGCCATCTGGGAA |
| STK17A | Chr7 |
ACGGCTACAGCCTGTGCCCGGG |
CAGTGGTGAGAAAATGTATAAAGAAAGAT |
| NOTCH1 | Chr9 |
AGAACGGGGCTAACAAAGATATGCAG |
AGGAGACACCCCTGTTTCTGGC |
| MEG3 | Chr14 |
GGGCGCCCACGAGAGGATCCCTCA |
GGTCTCTCCTCAGGGATGACATCAT |
| TP53 | Chr17 |
ACCATCATCACACTGGAAGACTCCA |
AATCTACTGGGACGGAACAGCTTTG |
| PKM2 | Chr15 |
TGATGGGCTTATTTCTCTCCAGGTGA |
TGCCGACTTCCTGGTGACGGAGGTGGAAAA |
| WNT1 | Chr12 |
GGCCCCACCTCTTCGGCAAGATCGTCAA |
CGAGAAACGGCGTTTATCTTCGCTAT |
| RRM1 | Chr11 |
ATGCACTTCTACGGCTGGAAGCA |
GGTTTGAAGACTGGGATGTATTATTTAAG |
| KRT18 | Chr12 |
CTTCAAGATCATCGAGGACCTGAGG |
AATGCCCGCATCGTTCTGCAGAT |
| EGF | Chr4 |
GCTGGTGAGGATGGCCAGGCAGCAGAT |
AATGCAACCAACTTCATGGAGGCA |
| HIF1A | Chr14 |
TATTTGCGTGTGAGGAAACTTCTGGA |
ATATTGAAGATGACATGAAAGCACAGATG |
| REPS1 | Chr6 |
CGCAGCTGCCGAACGACGTGGTCCTA |
ATGGAGCTTTGTGGTGCAACAAGA |
| MYC | Chr8 |
TGAGGAGACACCGCCCACCACCA |
AGGAACAAGAAGATGAGGAAGAAATCG |
| CDK14 | Chr7 |
AGCCCGGTTACTCTGCCTTCGT |
TGTGTCACAAAGATGTCTACACGGAAC |
| EGFR | Chr7 |
CTGCCCGGCGAGTCGGGCTCTGGAGGAAAA |
CAAGCTCACGCAGTTGGGCACTTTT |
| BCL2 | Chr18 |
TTGACAGAGGATCATGCTGTACT |
CAGAGGAAGTAGACTGATATTAACAATACT |
| SOD1 | Chr21 |
ACCATTGCATCATTGGCCGCACA |
CAGATGACTTGGGCAAAGGTGGAAAT |
Resistant and sensitive tissues had the variability
of the expression genes analyzed; however, greater expression in
sensitive tissues of genes involved in cell growth and
differentiation was observed. By contrast, in resistant tissues,
the main overexpressed genes were SOD1, MYC, PARP1, HGD, BSTG1,
PKM2, GSTM1, ALDH3B and ABCB1 (Fig.
5B).
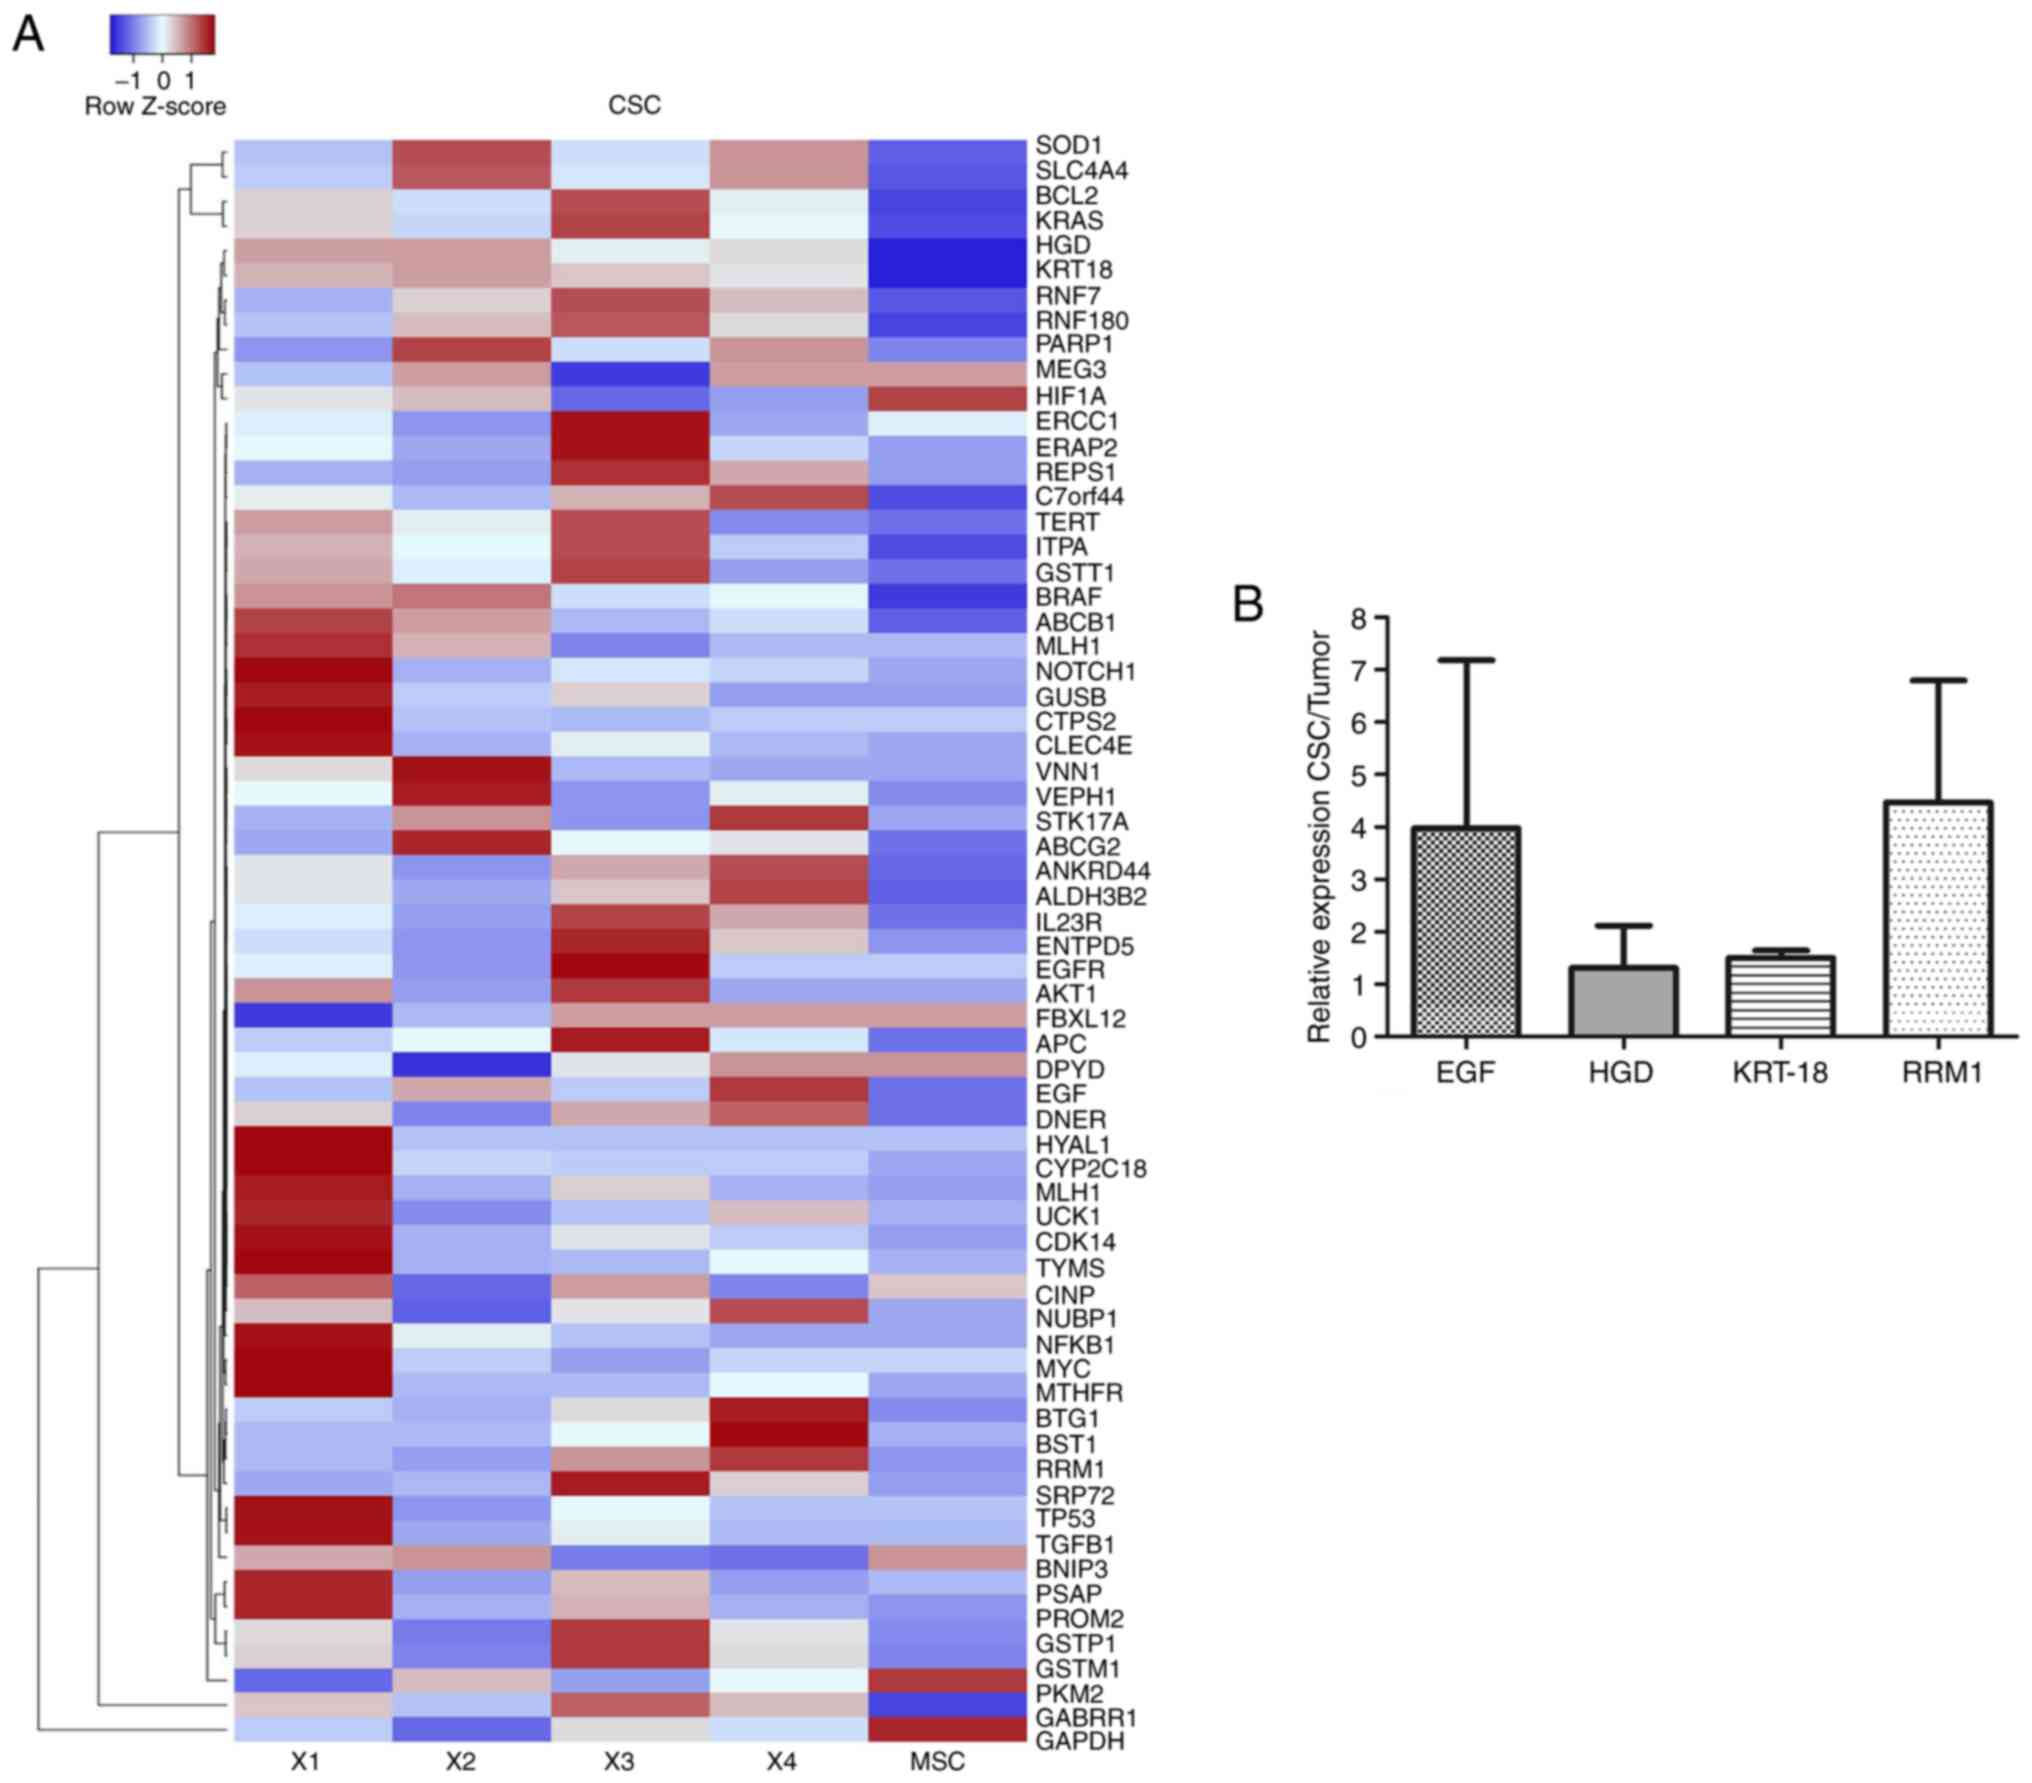
The heatmap in Fig.
6A shows the expression levels of normal stem cells
human-mesenchymal stem cells-isolate from adipose tissue and CSC
isolates. As observed on the expression scale, the intensity of
color allowed the observation of low expression levels in blue and
high expression levels in red. Results of the CSC isolates from
CRACS were different in each patient; however, overexpressed genes
repeated with high frequency were ribonucleoside-diphosphate
reductase large subunit (RRM1), EGF, HGD and
KRT-18 in colon CSC from patients with CRC (Fig. 6A). In addition, Fig. 6B represents relative expression
levels of genes from CSC isolates and the tumor. It was found that
RRMI, EGF, HGD and KRT-18 genes were expressed in CSC
tissue.
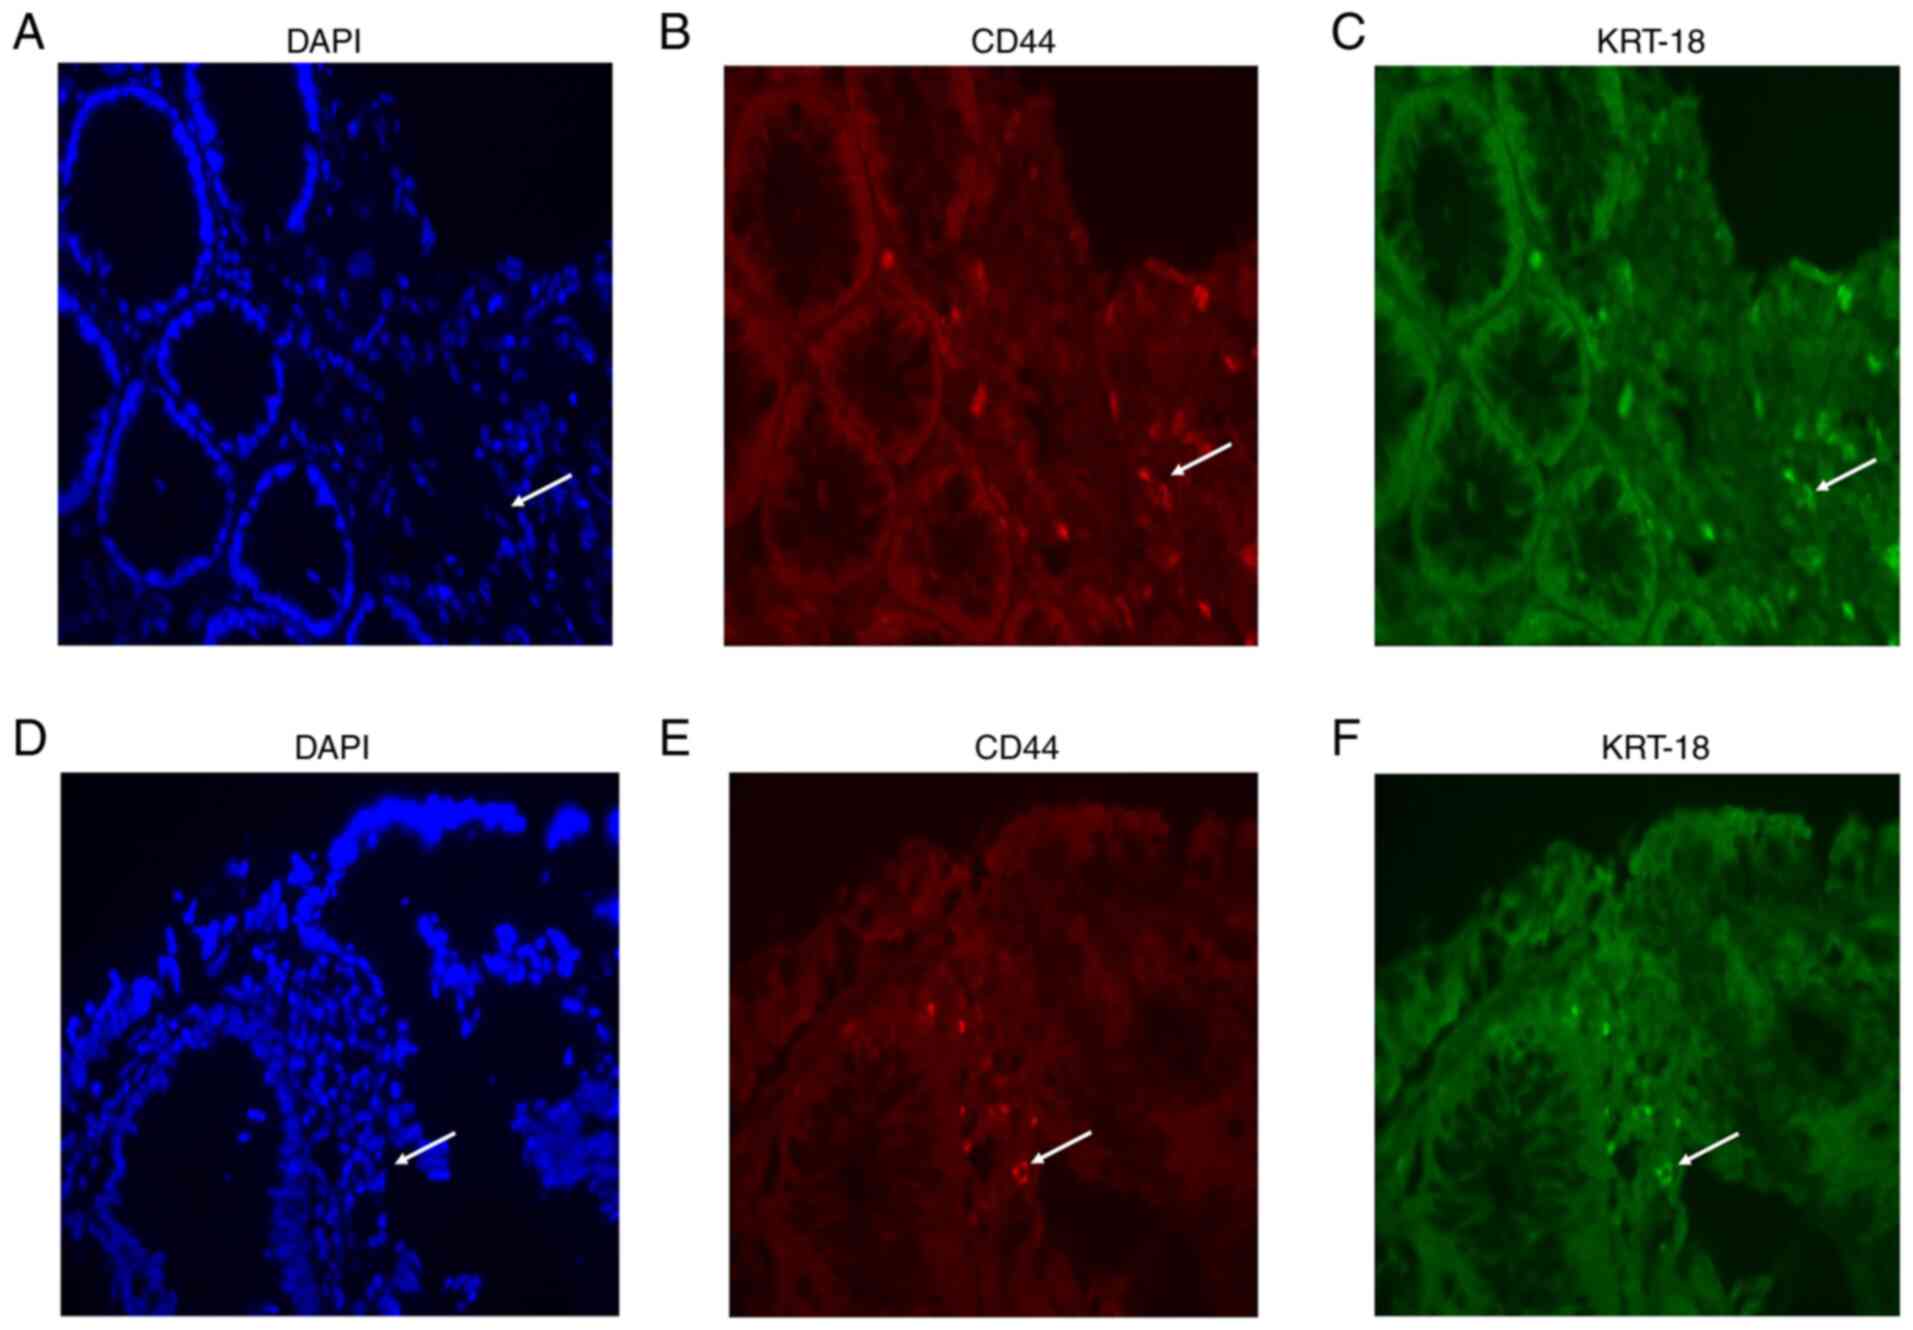
Validation of resistant genes on
CRAC
Following the results of the present and previous
studies (30,31), KRT-18 was selected as the key
gene in the progression of CRAC to be validated by
immunohistochemistry. Representative samples shown in Fig. 7A-F, demonstrated that co-expression
of KRT-18 protein and CD44 resistance was observed by IF in the 12
tissues from the patients with CRAC. No statistical difference was
found between KRT-18 and CD44 markers in sensitive and resistant
tissues. Calculated mean value for KRT-18 sensitive tissue showed
positive for 2.27±1.9%, while resistant showed 3.18±4.03%,
meanwhile CD44 sensitive showed 2.31±2.01%, whereas resistant
showed 3.32±4.02% (data not shown).
Discussion
CRC is frequently associated with drug-resistance
(32); in 90% of cases, this leads
to cancer or tumor relapse. Drug resistance is situation frequently
associated with tumor progression can induce mortality in patients
(33). It has been further shown
that the cells responsible for chemoresistance and metastasis are
CSCs (19,21). Thus, CSCs could be the key to
opportunely detecting chemoresistance and for finding a more
adequate drug regimen. Certain markers are known to be in CSCs:
Lgr5, CD44, CD24, CD26, CD29, CD166, CD326, CD133 and ALDH
(28). However, these markers are
not exclusive to CSCs and can also found in normal stem cells
(34). One view is that these sets
of markers are found in highly differentiable cells, although
further research is warranted on the combined mechanisms for their
expression, as this may lead to an improved understating of
stemness and regulation (14).
The present study identified KRT-18 as a gene
in CSCs of CRACs that could be a promising biomarker for 5FU/OXA
resistance. The population analyzed corresponded mostly to adult
men (49% <60 years) with advanced stages of CRAC, which is
consistent with the fact that 91% of cases are diagnosed in
individuals ≥50 years of age. Although the average age is similar
to that reported, there are cases in individuals <50 years
(15,33).
The present study classified all the primary
cultures of CRACs as sensitive and resistant to 5FU/OXA. The
condition of 5FU/OXA-sensitive or resistance was defined when the
PCD was >15±5% as primary cultures of healthy colon are known to
have a PCD >15%. This criterion agrees with that reported by
Kwon et al (35) in 2016.
The percentage of CRAC primary cultures resistant to 5FU/OXA was
significantly (18%) higher than those sensitive to 5FU/OXA. It was
notable that a subpopulation of primary cultures (23%) of the colon
adjacent to CRACs were resistant to 5FU/OXA. This suggested that
malignant cells of CRAC can induce malignancy in healthy tissue, as
happens in other types of cancer (36), such as breast (37), melanoma (38) and prostate (39). The fact that CSCs and fibroblasts
located in the tumor supports this, and the adjacent colon export
cytokines, chemokines and miRNAs, which can cause normal cells to
become malignant (40).
Typically, a high percentage of primary cultures are
resistant to first-line antineoplastic agents, even before
chemotherapy (41). In most CRC
cases, the primary tumor is completely resected; therefore,
chemoresistance does not represent a problem in the first stage of
cancer (29). However, in some
patients, tumor cells remain in the gut of patients who were
treated with a first-line drug, such as 5FU and OXA (42). In the present study, the Colo 320DM
cell line was shown to be sensitive to all the drug combinations
evaluated, which made it useful as an internal control each time a
PC-CRC was analyzed (36,43).
CD44 and CD24 are putative markers to isolate CSCs
from solid tumors activating and modulating several cell signaling
networks, such as Wnt, NF-κB, Notch, Hedgehog, JAK-STAT,
PI3K/AKT/mTOR and TGF/SMAD, that serve an important role in
mediating tumorigenic properties of tumor cells leading to tumor
progression, migration and associated with resistance to
antineoplastic drugs; the present study found an increase of
positive CD44 and CD24 cells in resistant CRAC tissue as previously
reported (15,40).
Adapting and using a protocol reported by Cammareri
et al (29) allowed us to
isolate CD44+ and CD24+ CSC from primary
cultures of CRC (29). The CSC
isolate was successful in 7.8% of processed samples, as previously
reported (13). This was especially
true in the cases of patients with advanced cancer who had not
received previous treatment with chemotherapy or radiotherapy, but
were resistant to 5FU and oxaliplatin (higher percentage of CD44
and CD24 markers). Although it seemed low, it is similar to a
previous study (13).
Previous results have also reported that colon CSCs
were able to express LGR5 even after stimulation with irinotecan
(42). In the present study, the
selection of the resistant population was made by exposing the CSC
to stimulation by chemotherapy and subsequent selection with
anti-CD44 magnetic beads after 72 h (8). This allowed for the selection of cells
resistant to 5FU and oxaliplatin; however, the results are limited
by 5FU and oxaliplatin, therefore further analysis against other
chemotherapeutic agents is required to understand all resistance
profiles.
There was a substantial variation of certain genes
observed in the results of NGS between the tissues with CRAC. Those
that were classified as sensitive presented a higher expression of
genes involved in cell proliferation (BTG1, MYC, MEG3, IL-23R,
NFKB, ERRC1) and detoxifying enzymes [Glutathione S-transferase
µ 1 (GSTM1) and ATP-binding cassette superfamily G member
2]. On the other hand, genes involved in oxidative damage-apoptosis
(SOD1, MYC, PARP1), metabolism alteration (HGD, BSTG1,
PKM2) and detoxifying enzymes (GSTM1, ALDH3B and
ABCB1) were observed with greater frequency in resistant
tissues. Also in the results only advanced tumors with higher
levels of CD44 and CD24 overexpressed TGFβ (30) and Hypoxia Factor Inducible 1 α
(44), which are signals that
induce expression of growth factors, such as fibroblast specific
protein, smooth muscle actin α, vascular endothelial growth factor
and pro-inflammatory cytokines (IL-6, IL-23 and/or IL-1β), which in
turn participate and activate other pathways (WNT, Hedgehog and
NOTCH) to promote EMT (8,13,21).
Subsequently, the expression of genes associated
with resistance in the CSC isolates and the MSC-ADTs was compared.
It was found that the genes with the highest expression levels were
HGD, KRT-18, RNF180, EGF and RRM1. Notably,
HGD-related genes in the tyrosine catabolic pathways have
not been linked to changes in DNA, however, a dysregulated process
exists in some types of cancer (45–47). A
recent report has shown that tyrosine catabolic genes or microRNAs
(miR-539 and miR-661) could be used as a prognostic biomarker for
hepatocellular carcinoma (48). The
RNF180 gene is a E3 ubiquitin ligase implicated in the
ubiquitin-proteasome pathway, which acts as a potential tumor
suppressor, exhibiting a critical role in the suppression of cell
proliferation and induction of apoptosis (49,50).
In the present study, the RNF180 gene was significantly
overexpressed; a previous study in GC cells suggested that RNF180
has regulatory activity on STAT3 and pSTAT3 (49). In addition, EGF signaling is
necessary for the maintenance of colon CSC and the upregulation in
the isolates can be due to medium supplementation with EGF
(51). KRT-18 gene belongs
to a family of intermediate filament genes that can affect
carcinogenesis through various signaling pathways, including
PI3K/AKT, WNT and signal-regulated ERK and MAPK (52). KRT-18 is overexpressed in
most types of human tumor and associates with clinical stage, tumor
stage and metastasis stage in patients with esophageal cancer
(52). In gastric cancer, high
KRT-18 expression has been suggested to be associated with positive
lymph nodes, advanced clinical stage and chemoresistance (30). However, the clinical significance
and biological function of KRT-18 is seldomly reported in
CRC. A recent study reported that high KRT-18 expression can
promote viability, migration and invasion of tumor cells (30). In colonic epithelial cells,
Lähdeniemi et al (44) found
that KRT-18 interacts with Notch1 and regulates Notch1
signaling activity, which promotes CSC.
Recently, KRT-18 was proposed in gastric cancer as a
CSC marker by proteomic results and was found as a marker in
circulating tumor cells (CTC) in metastatic colorectal cancer
(30). In the results of the
present study, KRT-18 was overexpressed in CSCs and at the protein
level co-expression with CD44 markers in CRC-resistant tissue was
observed. In addition, Virag et al (53) reported that the upregulation of
PTPRO, KRT-18, NDRG1, AVEN and ID1 in association
with CSC-CRC chemoresistance to oxaliplatin and Francipane et
al (54) reported that the
upregulation of PTEN, MMAC1 and TEP1 is associated with CSC-CRC.
Finally, the results of the present study demonstrated that
resistant CRAC tissues in patients with a higher percentage of CSC
were associated with resistance to 5FU and oxaliplatin with
overexpression of KRT-18; a gene that could be used to
predict sensitivity to conventional drugs in patients with CRAC.
Therefore, further studies are warranted to explore the molecular
mechanism of KRT-18 in tumorigenesis.
Acknowledgements
The authors would like to thank Dr Gerardo
Muñoz-Maldonado and Dr Marco Antonio Treviño-Lozano medical staff
of the University Hospital of the Autonomous University of Nuevo
Leon (Monterrey, Mexico) and Dr Absalon Espinoza-Velazco, Dr Irma
Sandra Garcia-Gonzalez and Dr Jose L. Vazquez-Reyes medical staff
(High Specialty Medical Unit 25 of the Mexican Social Security
Institute, Monterrey, Mexico) who helped obtain the tumor tissues.
The authors would like to thank Dr Mario Alberto Hernández Ordóñez
from the Department of Forensic Medicine of the University Hospital
of the Autonomous University of Nuevo Leon for donating normal
samples used in this study. Furthermore, the authors are grateful
for the help of Dr Sergio Lozano (Faculty of Medicine, Autonomous
University of Nuevo Leon) for reviewing the manuscript.
Funding
The present study was financed by the Sector Fund
for Basic Research, SEP/CONACYT (grant no. CB-2012-01-178641) and
the Support program for Scientific and Technological research of
the Autonomous University of Nuevo Leon (grant no. SA15-15).
Availability of data and materials
The datasets used and/or analyzed during the current
study are available from the corresponding author on reasonable
request. The sequencing datasets generated and/or analyzed during
the current study are available in the Kaggle, Inc., repository,
https://www.kaggle.com/elsangarzatrevio/rna-seq-crc?select=Tejidos+tumorales+y+sanos+normalizados+con+GADPH.csv.
Authors' contributions
ENGT contributed to designing and conceiving the
experiments, and analyzing and discussion of the results. HGMR
contributed to the standardization and design of the experiments,
and wrote, analyzed and corrected the manuscript. PDG obtained
informed consent, conducted sampling and evaluated cytotoxic
assays. OSC helped in the CSC cultures, characterization and
immunohistochemistry protocol. ROL led the experimental design and
analysis of the results obtained in sequencing. ASD helped in the
standardization of immunohistochemistry and with the software of
the fluorescence microscope. VMT performed some of the
bioinformatics analyses. GRPR performed statistical analysis. AGQR
contributed to data analysis and designed some of the figures. JFIC
performed data analysis and interpretation, and edited and
critically revised the manuscript. SLSF designed the experiments,
analyzed literature and discussed and managed the approval to
submit the manuscript. ENGT and PDG confirm the authenticity of all
the raw data. All authors have read and approved the final
manuscript.
Ethics approval and consent to
participate
This project was authorized by the Ethics Committee
of the UANL Medical School and University Hospital (approval no.
BI14-009; Monterrey, Mexico) and by the National Committee of
Bioethics of the IMSS (approval no. R-2012-785-075). All
participants signed an informed consent letter. In the letter,
participants authorized us to analyze a sample of their intestinal
cancer tumors and to use their sociodemographic and clinical data
for the present study.
Patient consent for publication
Not applicable.
Competing interests
The authors declare that they have no competing
interests.
Glossary
Abbreviations
Abbreviations:
|
ABCB1
|
ATP binding cassette subfamily B
member 1
|
|
CSC
|
cancer stem cells
|
|
CRAC
|
colorectal adenocarcinoma
|
|
CRC
|
colorectal cancer
|
|
EGF
|
epidermal growth factor
|
|
5FU
|
5-fluorouracil
|
|
GSTM1
|
glutathione S-transferase Mu 1
|
|
HGD
|
homogentisate 1,2-dioxygenase
|
|
KRT-18
|
keratin 18
|
|
MYC
|
Myc proto-oncogene protein
|
|
OXA
|
oxaliplatin
|
|
PARP1
|
poly-ADP-ribosyltransferase
|
|
PBS
|
phosphate-buffered saline
|
|
PCs
|
primary cultures
|
|
PCD
|
percentage of cell death
|
|
SAB
|
bovine serum albumin
|
References
|
1
|
Arnold M, Sierra MS, Laversanne M,
Soerjomataram I, Jemal A and Bray F: Global patterns and trends in
colorectal cancer incidence and mortality. Gut. 66:683–691. 2017.
View Article : Google Scholar : PubMed/NCBI
|
|
2
|
Rawla P, Sunkara T and Barsouk A:
Epidemiology of colorectal cancer: Incidence, mortality, survival,
and risk factors. Prz Gastroenterol. 14:89–103. 2019.PubMed/NCBI
|
|
3
|
Kannarkatt J, Joseph J, Kurniali PC,
Al-Janadi A and Hrinczenko B: Adjuvant chemotherapy for stage II
colon cancer: A clinical dilemma. J Oncol Pract. 13:233–241. 2017.
View Article : Google Scholar : PubMed/NCBI
|
|
4
|
Goldberg RM, Rothenberg ML, Van Cutsem E,
Benson AB III, Blanke CD, Diasio RB, Grothey A, Lenz HJ, Meropol
NJ, Ramanathan RK, et al: The continuum of care: A paradigm for the
management of metastatic colorectal cancer. Oncologist. 12:38–50.
2007. View Article : Google Scholar : PubMed/NCBI
|
|
5
|
Burgers K, Moore C and Bednash L: Care of
the colorectal cancer survivor. Am Fam Physician. 97:331–336.
2018.PubMed/NCBI
|
|
6
|
Muhammad S, Kaur K, Huang R, Zhang Q, Kaur
P, Yazdani HO, Bilal MU, Zheng J, Zheng L and Wang XS: MicroRNAs in
colorectal cancer: Role in metastasis and clinical perspectives.
World J Gastroenterol. 20:17011–17019. 2014. View Article : Google Scholar : PubMed/NCBI
|
|
7
|
Stewart CL, Warner S, Ito K, Raoof M, Wu
GX, Kessler J, Kim JY and Fong Y: Cytoreduction for colorectal
metastases: Liver, lung, peritoneum, lymph nodes, bone, brain. When
does it palliate, prolong survival, and potentially cure? Curr
Probl Surg. 55:330–379. 2018.PubMed/NCBI
|
|
8
|
Shibue T and Robert A: Weinberg. EMT CSCs
and drug resistance: The mechanistic link and clinical
implications. Nat Rev Clin Oncol. 14:611–629. 2017. View Article : Google Scholar : PubMed/NCBI
|
|
9
|
Garza-Trevino EN, Said-Fernandez SL and
Martinez-Rodriguez HG: Understanding the colon cancer stem cells
and perspectives on treatment. Cancer Cell Int. 15:22015.
View Article : Google Scholar : PubMed/NCBI
|
|
10
|
Bezuidenhout N and Shoshan M: A shifty
target: Tumor-initiating cells and their metabolism. Int J Mol Sci.
20:53702019. View Article : Google Scholar : PubMed/NCBI
|
|
11
|
Garza Treviño EN, González PD, Valencia
Salgado CI and Martinez Garza A: Effects of pericytes and colon
cancer stem cells in the tumor microenvironment. Cancer Cell Int.
19:1732019. View Article : Google Scholar
|
|
12
|
Prasetyanti PR and Medema JP: Intra-tumor
heterogeneity from a cancer stem cell perspective. Mol Cancer.
16:412017. View Article : Google Scholar : PubMed/NCBI
|
|
13
|
Singh M, Yelle N, Venugopal C and Singh
SK: EMT: Mechanisms and therapeutic implications. Pharmacol Ther.
182:80–94. 2018. View Article : Google Scholar : PubMed/NCBI
|
|
14
|
Kim WT and Ryu CJ: Cancer stem cell
surface markers on normal stem cells. BMB Rep. 50:285–298. 2017.
View Article : Google Scholar : PubMed/NCBI
|
|
15
|
Sahlberg SH, Spiegelberg D, Glimelius B,
Stenerlöw B and Nestor M: Evaluation of cancer stem cell markers
CD133, CD44, CD24: Association with AKT isoforms and radiation
resistance in colon cancer cells. PLoS One. 9:e946212014.
View Article : Google Scholar : PubMed/NCBI
|
|
16
|
Han L, Shi S, Gong T, Zhang Z and Sun X:
Cancer stem cells: Therapeutic implications and perspectives in
cancer therapy. Acta Pharm Sin B. 3:65–75. 2013. View Article : Google Scholar
|
|
17
|
Bao B, Ahmad A, Azmi AS, Ali S and Sarkar
FH: Overview of cancer stem cells (CSCS) and mechanisms of their
regulation: Implications for cancer therapy. Curr Protoc Pharmacol.
14:1–18. 2013.
|
|
18
|
Turdo A, Veschi V, Gaggianesi M, Chinnici
A, Bianca P, Todaro M and Stassi G: Meeting the challenge of
targeting cancer stem cells. Front Cell Dev Biol. 7:162019.
View Article : Google Scholar : PubMed/NCBI
|
|
19
|
Markowska A, Sajdak S, Markowska J and
Huczyński A: Angiogenesis and cancer stem cells: New perspectives
on therapy of ovarian cancer. Eur J Med Chem. 142:87–94. 2017.
View Article : Google Scholar : PubMed/NCBI
|
|
20
|
Hodgkinson N, Kruger CA and Abrahamse H:
Targeted photodynamic therapy as potential treatment modality for
the eradication of colon cancer and colon cancer stem cells. Tumor
Biol. 39:10104283177346912017. View Article : Google Scholar : PubMed/NCBI
|
|
21
|
Gonzalez-Villarreal CA, Quiroz-Reyes AG,
Islas JF and Garza-Treviño EN: Colorectal cancer stem cells in the
progression to liver metastasis. Front Oncol. 10:15112020.
View Article : Google Scholar : PubMed/NCBI
|
|
22
|
Spano JP, Milano G, Vignot S and Khayat D:
Potential predictive markers of response to EGFR-targeted therapies
in colorectal cancer. Crit Rev Oncol Hematol. 66:21–30. 2008.
View Article : Google Scholar : PubMed/NCBI
|
|
23
|
Deschoolmeester V, Baay M, Specenier P,
Lardon F and Vermorken JB: A review of the most promising
biomarkers in colorectal cancer: One step closer to targeted
therapy. Oncologist. 15:699–731. 2010. View Article : Google Scholar : PubMed/NCBI
|
|
24
|
Moradi Marjaneh R, Khazaei M, Ferns GA,
Avan A and Aghaee-Bakhtiari SH: MicroRNAs as potential therapeutic
targets to predict responses to oxaliplatin in colorectal cancer:
From basic evidence to therapeutic implication. IUBMB Life.
71:1428–1441. 2019. View Article : Google Scholar : PubMed/NCBI
|
|
25
|
Rodrigues D, Longatto-Filho A and Martins
SF: Predictive biomarkers in colorectal cancer: From the single
therapeutic target to a plethora of options. Biomed Res Int.
2016:68960242016. View Article : Google Scholar : PubMed/NCBI
|
|
26
|
Xie YH, Chen YX and Fang JY: Comprehensive
review of targeted therapy for colorectal cancer. Signal Transduct
Target Ther. 5:222020. View Article : Google Scholar : PubMed/NCBI
|
|
27
|
Péus D, Newcomb N and Hofer S: Appraisal
of the Karnofsky Performance Status and proposal of a simple
algorithmic system for its evaluation. BMC Med Inform Decis Mak.
13:722013. View Article : Google Scholar
|
|
28
|
Prager BC, Xie Q, Bao S and Rich JN:
Cancer stem cells: The architects of the tumor ecosystem. Cell Stem
Cell. 24:41–53. 2019. View Article : Google Scholar : PubMed/NCBI
|
|
29
|
Cammareri P, Lombardo Y, Francipane MG,
Bonventre S, Todaro M and Stassi G: Isolation and culture of colon
cancer stem cells. Methods Cell Biol. 86:311–324. 2008. View Article : Google Scholar : PubMed/NCBI
|
|
30
|
Zhang J, Hu S and Li Y: KRT18 is
correlated with the malignant status and acts as an oncogene in
colorectal cancer. Biosci Rep. 39:BSR201908842019. View Article : Google Scholar : PubMed/NCBI
|
|
31
|
Wang H, Gong P, Chen T, Gao S, Wu Z, Wang
X, Li J, Marjani SL, Costa J, Weissman SM, et al: Colorectal cancer
stem cell states uncovered by simultaneous single-cell analysis of
transcriptome and telomeres. Adv Sci (Weinh). 8:20043202021.
View Article : Google Scholar : PubMed/NCBI
|
|
32
|
Jahanafrooz Z, Mosafer J, Akbari M,
Hashemzaei M, Mokhtarzadeh A and Baradaran B: Colon cancer therapy
by focusing on colon cancer stem cells and their tumor
microenvironment. J Cell Physiol. 235:4153–4166. 2020. View Article : Google Scholar : PubMed/NCBI
|
|
33
|
Hammond WA, Swaika A and Mody K:
Pharmacologic resistance in colorectal cancer: A review. Ther Adv
Med Oncol. 8:57–84. 2016. View Article : Google Scholar : PubMed/NCBI
|
|
34
|
Blom K, Nygren P, Larsson R and Andersson
CR: Predictive value of ex vivo chemosensitivity assays for
individualized cancer chemotherapy: A meta-analysis. SLAS Technol.
22:306–314. 2017.PubMed/NCBI
|
|
35
|
Kwon HY, Kim IK, Kang J, Sohn SK and Lee
KY: In vitro adenosine triphosphate-based chemotherapy response
assay as a predictor of clinical response to fluorouracil-based
adjuvant chemotherapy in stage II colorectal cancer. Cancer Res
Treat. 48:970–977. 2016. View Article : Google Scholar : PubMed/NCBI
|
|
36
|
Garza-Trevino EN, Rodriguez-Gonzalez MS,
Gonzalez PD, Alonso-Cruz YG, Alonso-Cruz YG, Soto-Dominguez A,
Guerrero JFG, Castro-Govea Y, Sanchez EM, Fernandez SS and
Martinez-Rodriguez HG: Remarkably higher efficacy and a wider
safety window for nonfrontline over first-line drug combinations in
the adenocarcinoma Colo 320DM cell line. J BUON. 22:1115–1121.
2017.PubMed/NCBI
|
|
37
|
Casbas-Hernandez P, Sun X, Roman-Perez E,
D'Arcy MD, Sandhu R, Hishida A, McNaughton KK, Yang XR, Makowski L,
Sherman ME, et al: Tumor intrinsic subtype is reflected in
cancer-adjacent tissue. Cancer Epidemiol Biomarkers Prev.
24:406–414. 2015. View Article : Google Scholar : PubMed/NCBI
|
|
38
|
Hoesl C, Zanuttigh E, Fröhlich T,
Philippou-Massier J, Krebs S, Blum H and Dahlhoff M: The secretome
of skin cancer cells activates the mTOR/MYC pathway in healthy
keratinocytes and induces tumorigenic properties. Biochim Biophys
Acta Mol Cell Res. 1867:1187172020. View Article : Google Scholar : PubMed/NCBI
|
|
39
|
Trevino V, Tadesse MG, Vannucci M,
Al-Shahrour F, Antczak P, Durant S, Bikfalvi A, Dopazo J, Campbell
MJ and Falciani F: Analysis of normal-tumour tissue interaction in
tumours: Prediction of prostate cancer features from the molecular
profile of adjacent normal cells. PLoS One. 6:e164922011.
View Article : Google Scholar : PubMed/NCBI
|
|
40
|
Colacino JA, Azizi E, Brooks MD, Harouaka
R, Fouladdel S, McDermott SP, Lee M, Hill D, Madden J, Boerner J,
et al: Heterogeneity of human breast stem and progenitor cells as
revealed by transcriptional profiling. Stem Cell Reports.
10:1596–1609. 2018. View Article : Google Scholar : PubMed/NCBI
|
|
41
|
Michaelis M, Wass MN and Cinatl J:
Drug-adapted cancer cell lines as preclinical models of acquired
resistance. Cancer Drug Resist. 2:447–456. 2019.
|
|
42
|
Izumi D, Ishimoto T, Sakamoto Y, Miyamoto
Y and Baba H: Molecular insights into colorectal cancer stem cell
regulation by environmental factors. J Cancer Metastasis Treat.
1:156–162. 2015. View Article : Google Scholar
|
|
43
|
Bakker WJ, Harris IS and Mak TW: FOXO3a is
activated in response to hypoxic stress and inhibits HIF1-induced
apoptosis via regulation of CITED2. Mol Cell. 28:941–953. 2007.
View Article : Google Scholar : PubMed/NCBI
|
|
44
|
Lähdeniemi IAK, Misiorek JO, Antila CJM,
Landor SKJ, Stenvall CGA, Fortelius LE, Bergström LK, Sahlgren C
and Toivola DM: Keratins regulate colonic epithelial cell
differentiation through the Notch1 signalling pathway. Cell Death
Differ. 24:984–996. 2017. View Article : Google Scholar
|
|
45
|
Danilkovitch-Miagkova A and Zbar B:
Dysregulation of Met receptor tyrosine kinase activity in invasive
tumors. J Clin Invest. 109:863–867. 2002. View Article : Google Scholar : PubMed/NCBI
|
|
46
|
Rosario SR, Long MD, Affronti HC, Rowsam
AM, Eng KH and Smiraglia DJ: Pan-cancer analysis of transcriptional
metabolic dysregulation using the cancer genome atlas. Nat Commun.
9:53302018. View Article : Google Scholar : PubMed/NCBI
|
|
47
|
Jin N, Bi A, Lan X, Xu J, Wang X, Liu Y,
Wang T, Tang S, Zeng H, Chen Z, et al: Identification of metabolic
vulnerabilities of receptor tyrosine kinases-driven cancer. Nat
Commun. 10:27012019. View Article : Google Scholar : PubMed/NCBI
|
|
48
|
Nguyeni TN, Nguyen HQ and Le DH: Unveiling
prognostics biomarkers of tyrosine metabolism reprogramming in
liver cancer by cross-platform gene expression analyses. PLoS One.
15:e02292762020. View Article : Google Scholar : PubMed/NCBI
|
|
49
|
Wu Z, Liu H, Sun W, Du Y, He W, Guo S,
Chen L, Zhao Z, Wang P, Liang H and Deng J: RNF180 mediates STAT3
activity by regulating the expression of RhoC via the proteasomal
pathway in gastric cancer cells. Cell Death Dis. 11:8812020.
View Article : Google Scholar : PubMed/NCBI
|
|
50
|
Wei F, Ba S, Jin M, Ci R, Wang X, Fusheng
E and Long Z: RNF180 inhibits proliferation and promotes apoptosis
of colorectal cancer through ubiquitination of WISP1. Front Cell
Dev Biol. 8:6234552021. View Article : Google Scholar : PubMed/NCBI
|
|
51
|
Feng Y, Dai X, Li X, Wang H, Liu J, Zhang
J, Du Y and Xia L: EGF signalling pathway regulates colon cancer
stem cell proliferation and apoptosis. Cell Prolif. 45:413–419.
2012. View Article : Google Scholar : PubMed/NCBI
|
|
52
|
Yin S, Song M, Zhao R, Liu X, Kang WK, Lee
JM, Kim YE, Zhang C, Shim JH, Liu K, et al: Xanthohumol inhibits
the growth of keratin 18-overexpressed esophageal squamous cell
carcinoma in vitro and in vivo. Front Cell Dev Biol. 8:3662020.
View Article : Google Scholar : PubMed/NCBI
|
|
53
|
Virag P, Fischer-Fodor E, Perde-Schrepler
M, Brie I, Tatomir C, Balacescu L, Berindan-Neagoe I, Victor B and
Balacescu O: Oxaliplatin induces different cellular and molecular
chemoresistance patterns in colorectal cancer cell lines of
identical origins. BMC Genomics. 14:4802013. View Article : Google Scholar : PubMed/NCBI
|
|
54
|
Francipane MG, Bulanin D and Lagasse E:
Establishment and characterization of 5-fluorouracil-resistant
human colorectal cancer stem-like cells: Tumor dynamics under
selection pressure. Int J Mol Sci. 20:18172019. View Article : Google Scholar : PubMed/NCBI
|