Introduction
Type 2 diabetes (T2D) affects >30 million
individuals in the United States and its treatment costs $245
billion annually. Individuals diagnosed with T2D experience
numerous severe complications, such as cardiovascular diseases,
retinopathy and renal disease (1). One of the primary challenges to
prevent and treat T2D is its multifactorial etiology (2). Several genetic risk factors for T2D
have been reported (3), including
modifiable lifestyle and behavioral characteristics (4). Previous studies have identified
various T2D subtypes with unique clinical characteristics (5–8).
Although some differences exist in these subtypes among different
racial and ethnic groups, the majority of characteristics are
similar across groups, with the main difference being the
prevalence of a subtype within each group (6,7).
Ancestral genetic risk may be associated with the prevalence of
these subtypes; however, the impact of environmental (e.g.,
lifestyle/behavioral) factors is well established. The increasing
importance of the presence of T2D subtypes and the contribution of
gene-environment interactions to T2D risk within the subtypes has
led to interest in identifying and characterizing biomarkers that
can reflect these complex relationships (9). Biomarkers that can characterize
these relationships could present important implications for early
risk detection before the onset of impaired fasting glucose (IFG)
or T2D in order to prevent major complications and morbidities.
MicroRNAs (miRNAs/miRs) are short (18–26
nucleotides) regulatory elements that function during the
translation of messenger RNAs (mRNAs) to amino acids. As miRNAs
function by regulating gene expression, they regulate the
underlying genetic risk factors for diseases as well as responses
to the environment, including individual behaviors (10,11). Circulating miRNAs found in the
serum and plasma are easily measured in blood, and are potential
risk biomarkers for the development of T2D (12,13), thereby exhibiting changes in their
expression levels before the onset of T2D (14,15). Some circulating miRNAs may reflect
the underlying physiological changes that are common across the
subtypes of T2D, whereas others may provide information about the
mechanisms that are unique to individual subtypes, based on both
genetic predisposition and environmental factors.
miRNAs coregulate mRNAs using a combined approach
that influences the sets of genes that operate in biological
pathways (16). This indicates
that coordinated changes in the expression of individual miRNAs
would be associated with changes in their mRNAs and biological
pathway targets to achieve a coherent impact on biological
processes. A previous study on miRNAs related to T2D risk have
mainly focused on single or a few candidate miRNAs (17). Furthermore, a previous study used
an agnostic approach to identify individual miRNAs associated with
IFG to define biomarkers that could identify the individuals at
high risk of developing T2D (18); however, the study primarily
focused on the associations between individual miRNAs and known
clinical risk factors [e.g., fasting blood glucose (FBG) levels and
hemoglobin A1c (HbA1c) levels], as well as the predicted mRNA
targets located within pathways known to be associated with T2D
risk (e.g., ‘Type II diabetes mellitus’ and ‘Insulin signaling
pathway’).
The present study aimed to determine whether miRNAs
can characterize individuals at risk for T2D into subgroups and
whether any common mechanisms persist, inferred by genes and
pathways targeted by miRNAs, both across and within the subgroups.
The present study intended to build upon the results from previous
studies by leveraging agnostic statistical approaches to determine
the optimal sets of miRNAs based on their co-expression and to
identify the common pathways that are responsible for T2D risk; in
addition, the study aimed to elucidate the potential subsets of
pathways that may be associated with the observed subtypes of T2D
based on combined genetic and environmental risk factors. The
overall goal of this research was early identification of T2D risk,
as well as more refined detection of risk profiles, which could
lead to the optimization of treatment strategies based on the
improved understanding of underlying mechanisms within the
subgroups.
Materials and methods
Study sample
The study sample included a subset of participants
from the previously completed Practicing Restorative Yoga versus
Stretching for the Metabolic Syndrome (PRYSMS) clinical trial
(identifier NCT01024816; clinicaltrials.gov), which compared the
effects of restorative yoga with those of active stretching on FBG
in overweight adults at risk of T2D (19). Participants in the PRYSMS study
were recruited from the San Francisco and San Diego areas, and met
the International Diabetes Federation criteria for metabolic
syndrome (20). The present study
included a subset of participants with stored plasma specimens from
the baseline visit with availability of at least two additional
follow-up timepoints (n=82). Exclusion criteria of the PRYSMS trial
included FBG level ≥126 mg/dl; HbA1c level ≥7.0%; fasting
triglyceride level ≥300 mg/dl; weight ≥400 lb; neurological
conditions that limited mobility; hospitalization for coronary
heart disease within the past 6 months; current pregnancy or
lactation; history of bariatric surgery; substance abuse; and use
of medications affecting metabolic factors. Demographic and
lifestyle characteristics, and medical history were collected by
trained study personnel at the baseline visit.
Clinical data were collected at baseline, and at 3,
6, 9 and 12 months from the baseline. Participant weight and height
were measured on a standard balance beam scale and stadiometer,
respectively. Waist circumference was measured using a Gullick II
tape spring-tension measure at the site of maximum circumference
midway between the lower ribs and the anterior superior iliac
spine. The mean of two waist circumference measurements was
calculated. Body mass index (BMI) was calculated as weight in
kilograms divided by height in meters squared.
FBG was measured using an automated analyzer with an
immobilized enzyme biosensor (YSI 2300 STAT Plus; YSI Life
Sciences). The levels of total cholesterol, triglycerides and
high-density lipoprotein (HDL)-cholesterol were measured using
enzymatic calorimetric methods (Quest Diagnostics), and low-density
lipoprotein (LDL)-cholesterol levels were calculated using the
Friedewald equation (21). All
participants completed a 2-h oral glucose tolerance test. Blood
used for plasma banking was collected by venipuncture into
vacutainers containing the preservative EDTA, centrifuged at 4°C
for 30,000 × g minutes to separate plasma from the cellular blood
components, and was stored at −80°C.
Molecular data collection
The Firefly Bioworks Multiplex Circulating MicroRNA
Assay (Abcam) was used for direct quantification of miRNAs from the
plasma samples according to the manufacturer's protocol. After 25
µl participant plasma was resuspended in 25 µl hybridization
buffer, miRNAs were hybridized to complementary oligonucleotides
covalently attached to the encoded hydrogel microparticles. The
bound target was ligated to the oligonucleotide adapter sequences
that serve as universal PCR priming sites. Thereafter, reverse
transcription PCR was performed using a fluorescent forward primer
from the proprietary FirePlex miRNA Core Reagent Kit. The
thermocycling conditions were as follows: One cycle at 93°C for 15
sec; followed by 32 cycles of 93°C for 5 sec, 57°C for 30 sec and
68°C for 60 sec. Subsequently, 1 cycle at 68°C for 5 min and 1
cycle at 94°C for 4 min was performed, after which 1 cycle at 4°C
was maintained until the assay was complete. Once amplified, the
fluorescent target was rehybridized to the original capture
particles and scanned on a Guava 6HT flow cytometer (Merck KGaA).
Expression levels of 59 miRNAs were measured from the plasma
specimens collected at each of the five time points from a subset
of 86 participants of the PRYSMS trial. The selection of these 59
miRNAs was based on a previous discovery analysis from a broader
set of 402 miRNAs from an independent subset of participants from
the PRYSMS trial (13). The
samples were not previously thawed. All miRNAs and sample wells
included in the assay passed the quality control criteria.
Statistical analysis
The expression of individual miRNAs was normalized
using a set of miRNA probes (i.e., hsa-miR-92a-3p, hsa-mir-93-5p,
hsa-miR-17-5p) identified by the geNorm algorithm for this
experiment (22) using Fireplex
Analysis Workbench software (https://www.abcam.com/kits/fireplex-analysis-workbench-software).
All included miRNA targets passed the quality control check and
were retained in the analysis.
Data were summarized using descriptive statistics
(means and standard deviations for continuous variables, and counts
and percentages for categorical variables). Missing values for FBG
were imputed using the mean FBG level for an individual
participant. An agnostic approach was applied to detect
relationships between miRNAs based on observed expression levels in
the present study compared with a priori hypotheses. A
factor analysis was performed using a Varimax rotation on the
covariance matrix to identify miRNAs that were related to baseline
FBG level, final (12-month) FBG level and change in FBG levels.
Eigenvalues >1 were the criteria for selecting important factors
and miRNAs with values >0.6 were included in these factors.
Pathway analysis
An overrepresentation pathway analysis was performed
for each factor of co-expressed miRNAs using the Kyoto Encyclopedia
of Genes and Genomes (KEGG) database (June 2011 update) (23). Human miRNA data from three
available regions (i.e., 5′untranslated, coding sequences and
3′untranslated) were downloaded from the miRWalk database (24) and merged into a single file. The
inclusion criterion to identify mRNA targets was set to 1.0 for the
binding probability score. The predicted mRNA targets were
extracted for each miRNA included within the factors. Identified
genes were then filtered to retain only one unique entry per
targeted gene and Entrez IDs were determined using the Homo.sapiens
v1.3.1 package (https://bioconductor.org/packages/Homo.sapiens/).
These IDs were used to assess the overrepresentation within
pathways using the ClusterProfiler package (version 3.16.1;
http://bioconductor.org/packages/clusterProfiler/) and
KEGG database. The default gene set background selected by
ClusterProfiler was applied. Multiple comparisons were addressed by
estimating the false discovery rate (25). The pathways within each factor
were ranked by q-value. The Accelerating Medicines Partnership
database was explored using the T2D phenotype to identify genes
that revealed statistical associations with T2D in genome-wide
association studies (GWAS) (26).
These genes were cross-referenced with the genes present within the
top 10 KEGG pathways (q<0.05) identified as targets of the
miRNAs within each factor.
In silico target gene
identification
Using the miRWalk database (24), mRNAs were identified that are
predicted targets of the miRNAs included in each factor.
Thereafter, two lists (i.e., intersection of overlapping mRNAs and
union of all mRNAs) of mRNA targets for each factor were generated.
The Common Metabolic Diseases portal was used to cross-reference
the mRNAs identified by the miRWalk database that were also
associated with T2D in GWAS (26). In addition, a literature review
was performed to assess the previously observed associations
between identified mRNA targets for the miRNAs within the smallest
identified factor and fourteen terms (i.e., endocrine, diabetes,
glucose, glycemic impairment, fasting glucose, gestational
diabetes, insulin, β-cells, pancreatic β-cells, pancreas,
overweight, obesity, adipose tissue, metabolic syndrome and heart
disease) related to T2D risk.
Results
Demographic and clinical characteristics of the
samples are summarized in Table I
(13). The mean age of the
patients was 55±7 years and the majority of patients were women
(n=60; 73%) who were Caucasian (n=57; 70%). The patients presented
with prediabetes and an average FBG level of 104±13 mg/dl. The
change in FBG level after 12 months was −1±26 mg/dl.
 | Table I.Demographic information concerning
patients (n=82) and clinical results determined from samples. |
Table I.
Demographic information concerning
patients (n=82) and clinical results determined from samples.
| Characteristic | Value |
|---|
| Age, years | 55±7 |
| Male sex | 27 (22) |
| Completed
college | 66 (54) |
| Race |
|
|
Asian | 13 (11) |
|
Black | 5 (4) |
|
Latinx | 10 (8) |
|
Caucasian | 70 (57) |
|
Other/Mixed | 2 (2) |
| Glucose (plasma),
mg/dl | 104±13 |
| Total cholesterol,
mg/dl | 206±39 |
| Triglycerides,
mg/dl | 167±63 |
| LDL-cholesterol,
mg/dl | 125±35 |
| HDL-cholesterol,
mg/dl | 49±11 |
| Waist
circumference, cm | 110±13 |
| Body mass index,
kg/m2 | 35.1±7.2 |
| Systolic blood
pressure, mmHg | 124±15 |
| Diastolic blood
pressure, mmHg | 72±8 |
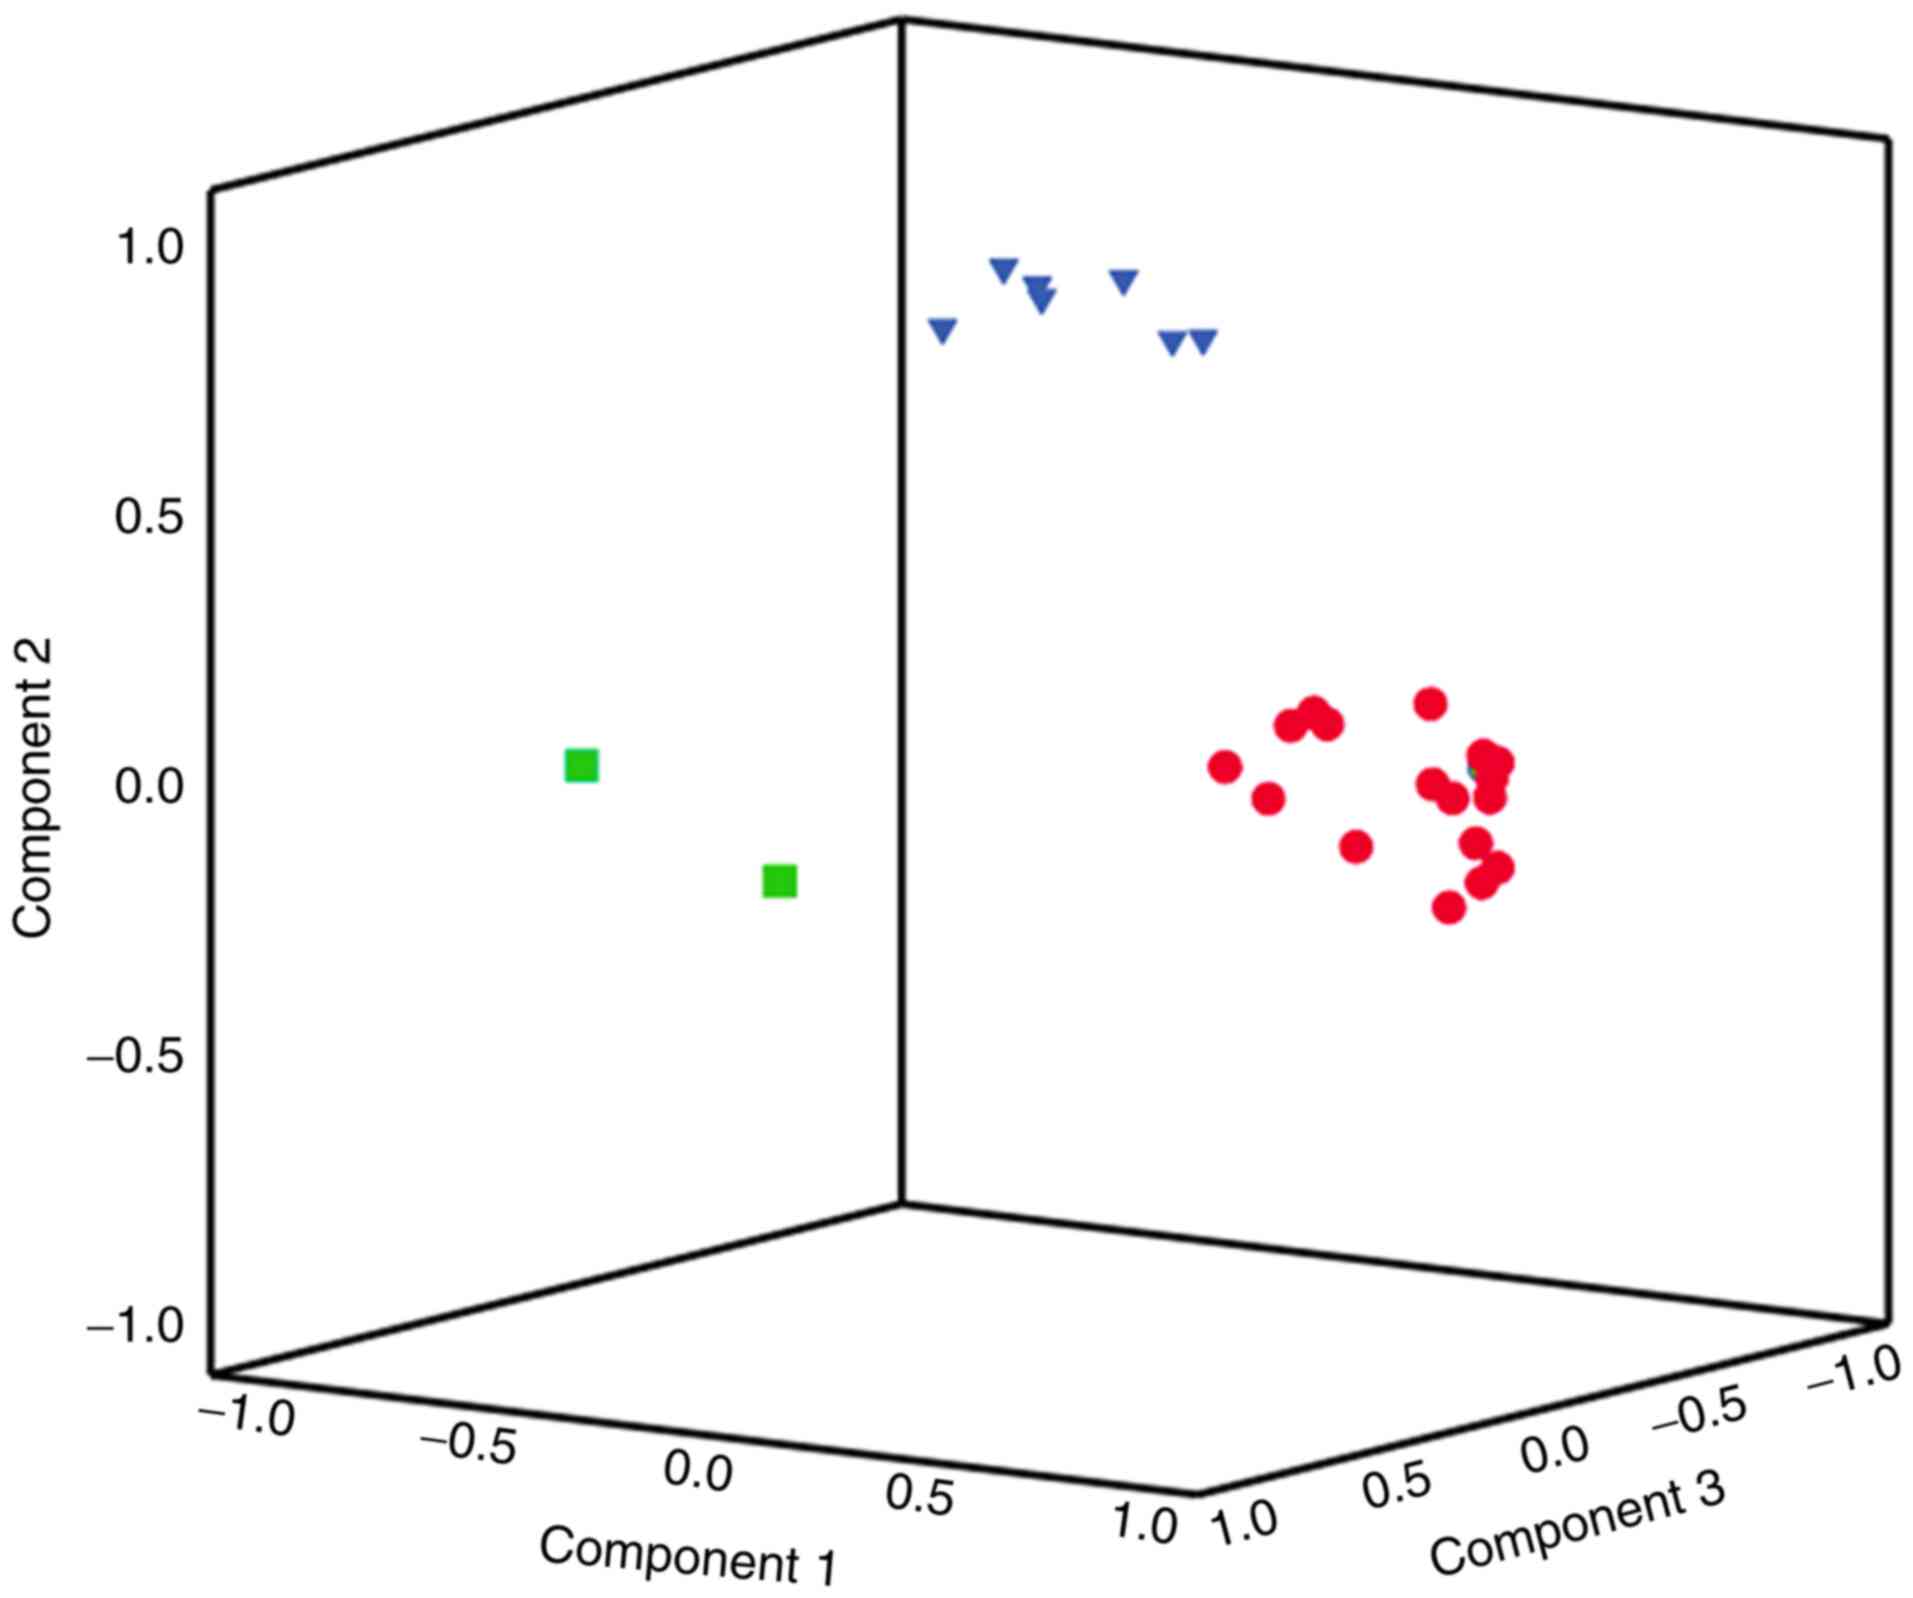
In total, 59 miRNAs were included in the assay; of
these, 27 belonged to the identified factors (Fig. 1). The largest (‘red’), second
largest (‘blue’) and smallest (‘green’) factors comprised 17, seven
and two miRNAs, respectively (Table
II). The three factors with eigenvalues >1 explained 45% of
the total variability in miRNA expression. The red, blue and green
factors explained 30, 10 and 5% of miRNA variability,
respectively.
| Table II.miRNAs comprising each factor. |
Table II.
miRNAs comprising each factor.
|
| Factor loading
values |
|---|
| miRNA | Red | Blue | Green |
|---|
| let-7f-5p |
| 0.897 |
|
| miR-126-3p | 0.749 |
|
|
| miR-126-5p |
| 0.797 |
|
| miR-130b-3p | 0.881 |
|
|
| miR-151a-3p | 0.938 |
|
|
| miR-151a-5p | 0.957 |
|
|
| miR-151b | 0.919 |
|
|
| miR-186-5p |
| 0.878 |
|
| miR-197-3p | 0.895 |
|
|
| miR-221-3p | 0.950 |
|
|
| miR-23a-3p | 0.774 |
|
|
| miR-24-3p | 0.977 |
|
|
| miR-27a-3p | 0.946 |
|
|
| miR-29b-3p |
| 0.828 |
|
| miR-320c | 0.640 |
|
|
| miR-323a-3p | 0.610 |
|
|
| miR-326 | 0.953 |
|
|
| miR-330-3p | 0.737 |
|
|
| miR-342-3p |
|
| 0.917 |
| miR-374b-5p |
| 0.788 |
|
| miR-379-5p |
|
|
|
| miR-424-5p |
| 0.892 |
|
| miR-425-3p | 0.838 |
|
|
| miR-652-3p | 0.914 |
|
|
| miR-98-5p |
| 0.862 |
|
| miR-15b-5p | 0.866 |
|
|
| miR-16-5p |
|
| 0.700 |
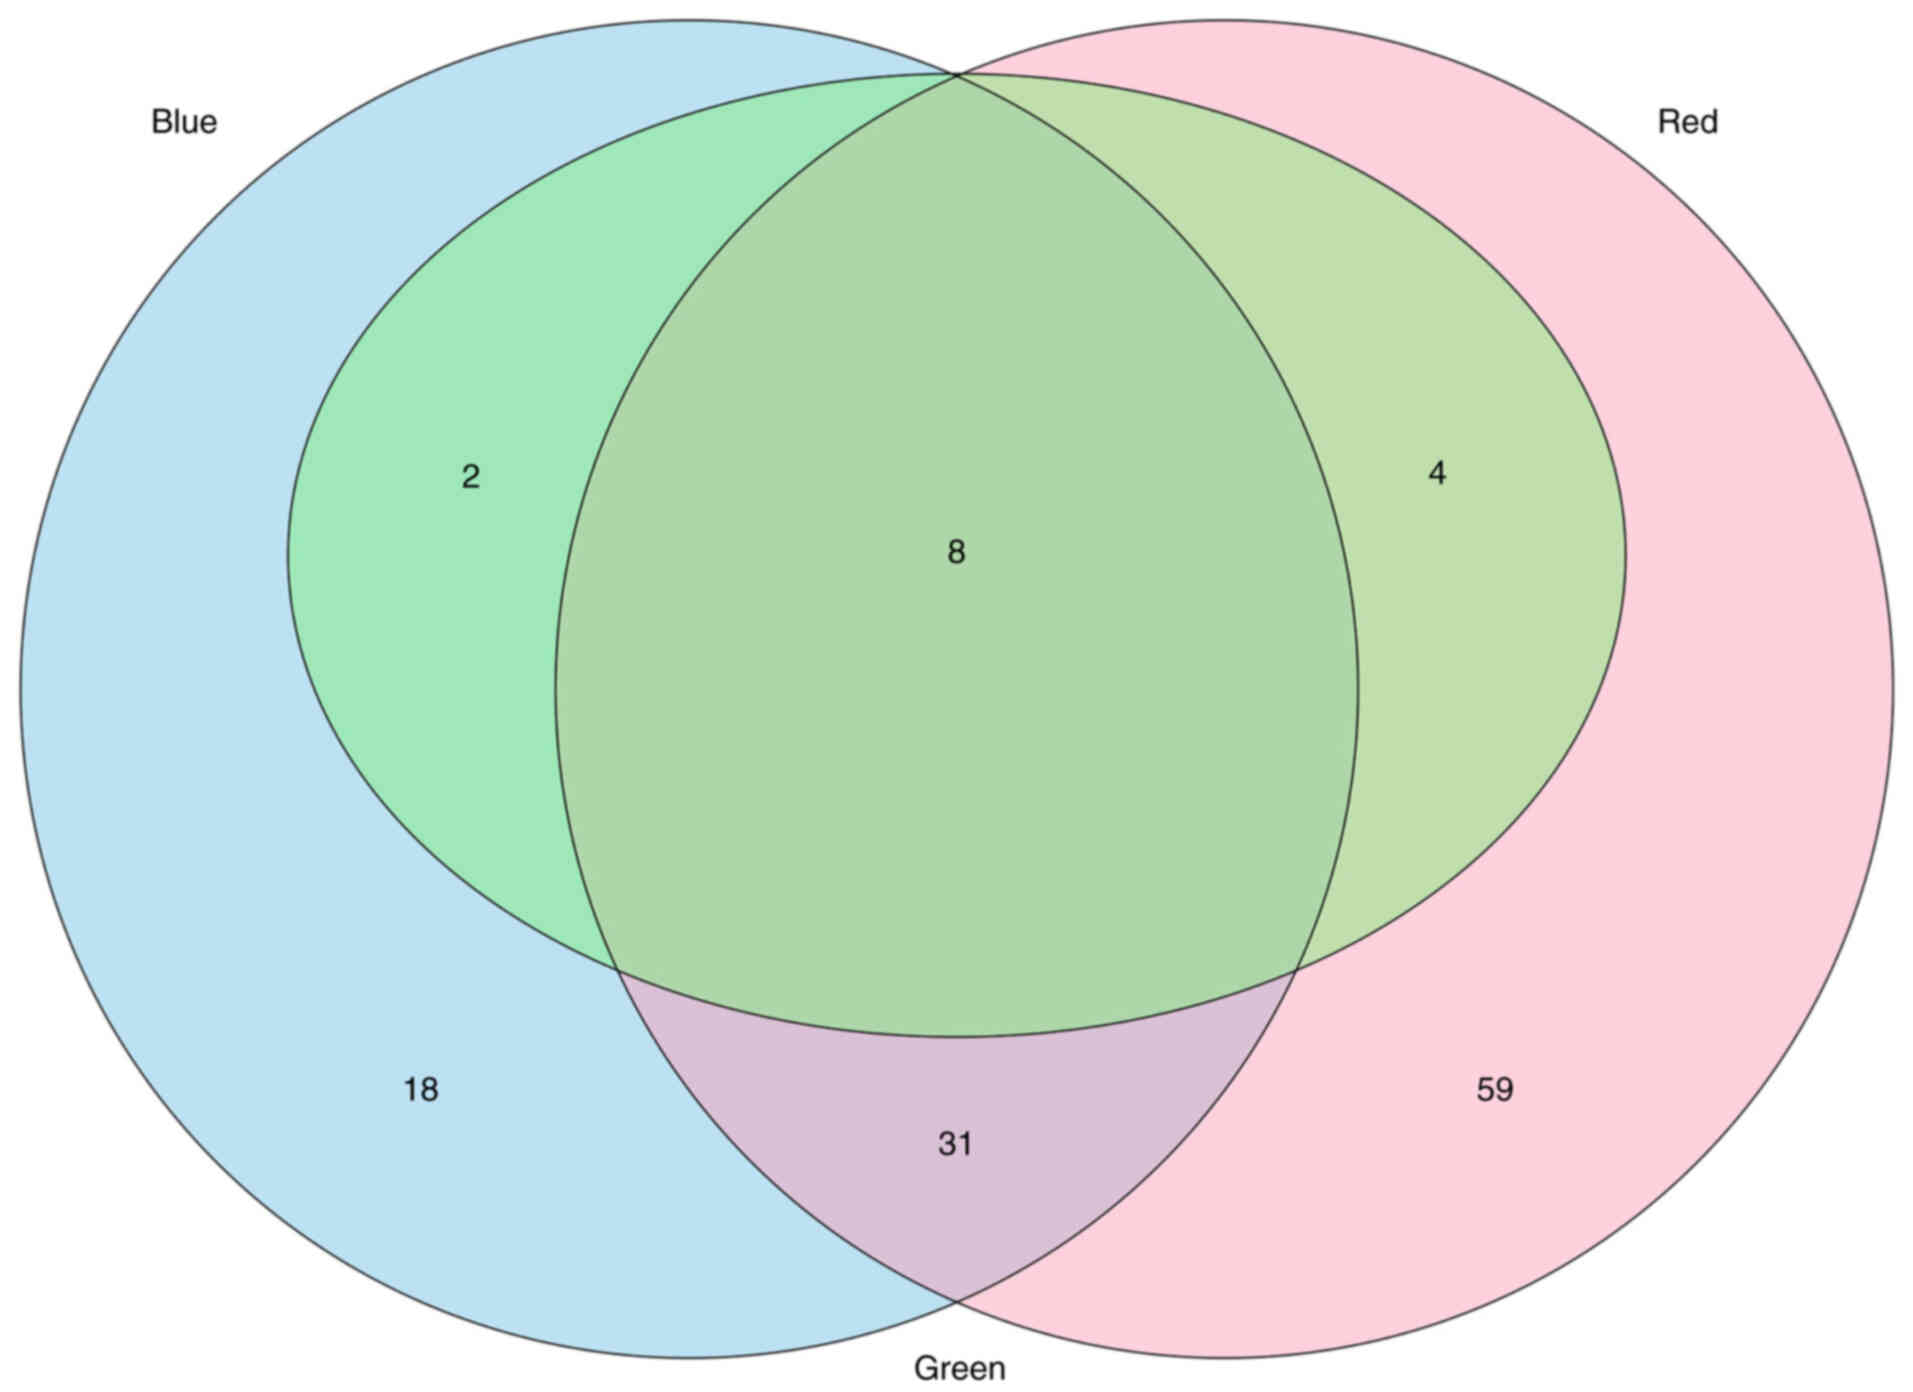
Pathway analysis of the genes targeted by the
miRNA-based factors revealed that 99, 59 and 17 KEGG pathways were
targeted by the miRNAs in the red, blue and green factors,
respectively (q<0.05 for all; Table SI). When the KEGG pathways were
ranked on the basis of q-values within each factor, eight pathways
were targeted by the miRNAs in all three factors, and 38 were
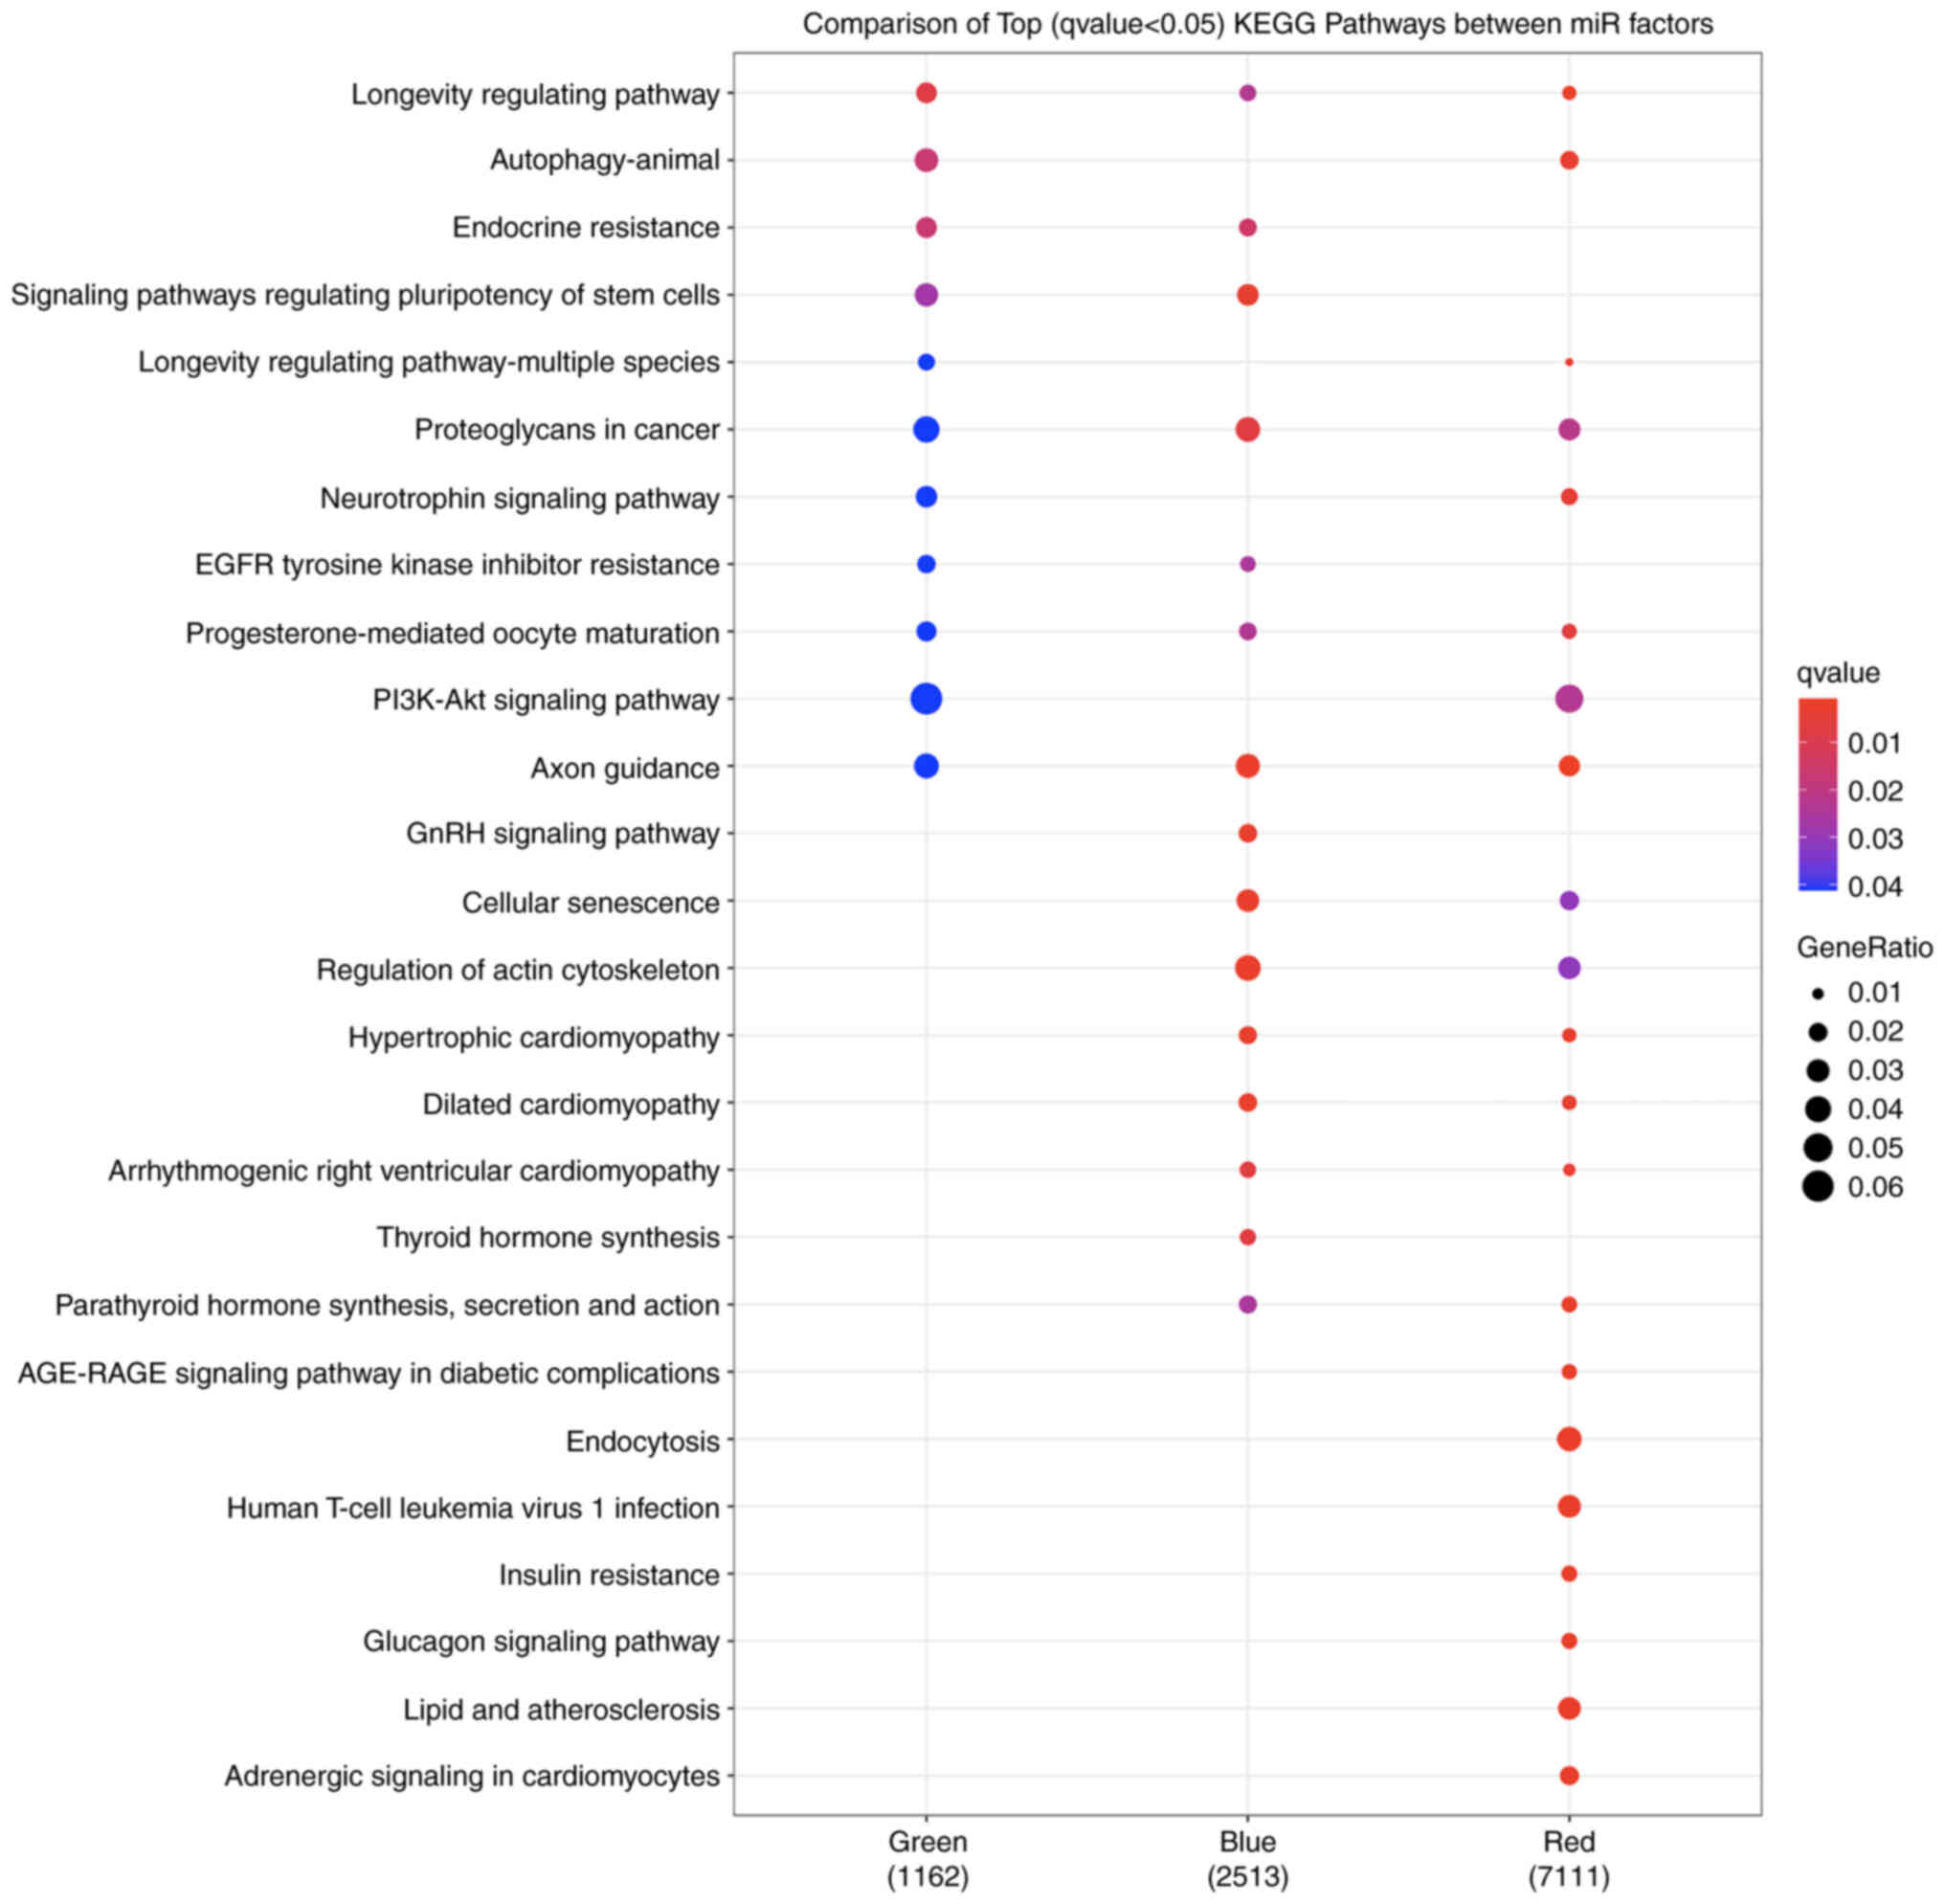
targeted by the miRNAs in two factors (Fig. 2). In total, 26 pathways were
included by focusing on the top 10 most differentially perturbed
pathways ranked by q-value in each factor (Fig. 3). The miRNAs in the red factor
targeted seven unique pathways, including those with known
relationships with the risk of T2D (e.g., ‘AGE-RAGE signaling
pathway’ in diabetic complications, insulin resistance, glucagon
signaling pathway, and lipid and atherosclerosis) (Table III). The miRNAs in the blue
factor targeted two unique pathways that were related to endocrine
and hormone activity: GnRH signaling and thyroid hormone synthesis
(Table III).
| Table III.Kyoto Encyclopedia of Genes and
Genomes pathwaya by
factor. |
Table III.
Kyoto Encyclopedia of Genes and
Genomes pathwaya by
factor.
| Pathway |
Percentageb |
|---|
| Metabolism and
inflammation (red) |
|
|
AGE-RAGE signaling pathway in
diabetic complications | 8.1 |
|
Endocytosis | 4.2 |
| Human
T-cell leukemia virus 1 infection | 12.4 |
| Insulin
resistance | 6.6 |
|
Glucagon signaling
pathway | 7.6 |
| Lipid
and atherosclerosis | 3.9 |
|
Adrenergic signaling in
cardiomyocytes | 6.9 |
| Endocrine-hormone
(blue) |
|
| GnRH
signaling pathway | 4.2 |
| Thyroid
hormone synthesis | 2.6 |
Moreover, 17,958 total mRNA targets were identified
for all miRNAs included in the three factors from the miRWalk tool.
The 18, seven and two miRNAs from the red, blue, and green factors
were predicted to target 17,728, 6,283 and 2,905 genes in total,
respectively.
In total, 559 loci in 438 genes that are
significantly associated with T2D in GWAS were identified from the
Common Metabolic Diseases portal (26). These 438 genes were
cross-referenced with those located in the KEGG pathways and
comprised statistically significant gene targets of the miRNAs in
each factor. The miRNAs in the red, blue and green factors targeted
a total of 3,885, 1,015 and 252 genes in 99, 59 and 17 pathways,
respectively; of these, 113 (2.9%), 52 (5.1%) and 18 (7.1%) from
the red, blue and green factors were associated with T2D,
respectively (Table SII). Within
the top 10 targeted pathways ranked on the basis of q-value, the
proportion of these genes in the red, blue and green factors
increased to 4.9% (51 genes), 6.2% (23 genes) and 8.5% (15 genes),
respectively.
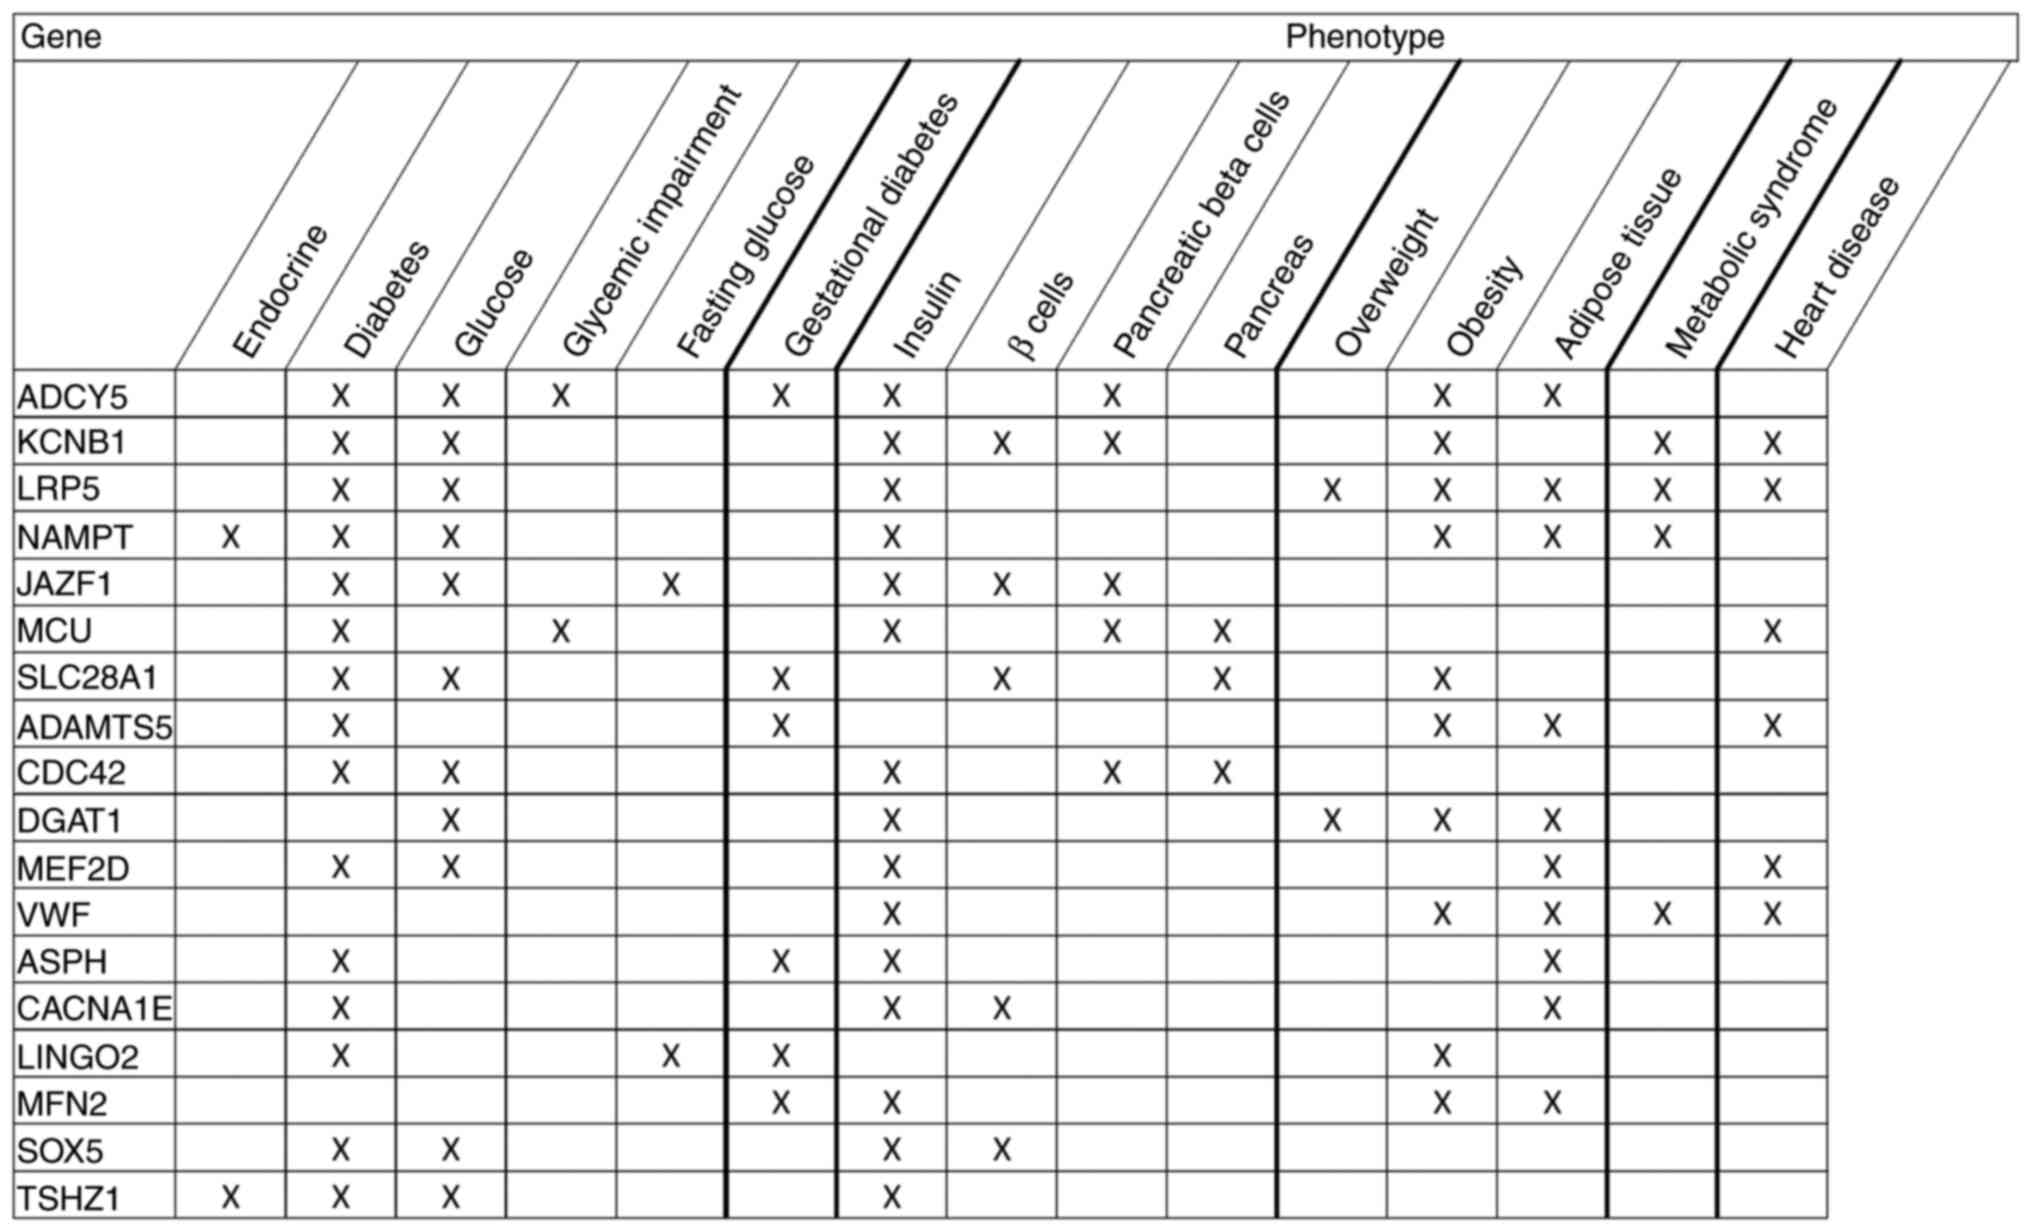
A total of 192 genes were identified that represent
the intersection of the predicted mRNA targets of the two miRNAs
contained within the green factor (miR-16 and miR-342). A
literature review on these predicted mRNAs along with 15 terms
associated with T2D risk revealed that three, one, three, five and
six genes were reported in association with eight, seven, six, five
and four search terms related to T2D, respectively (Fig. 4). Other genes from this set of
mRNA targets were associated with <4 terms. None of these 192
genes were located within the top 10 KEGG pathways targeted by
miR-16 and miR-342.
Discussion
MicroRNAs coregulate their mRNA targets to perform
coordinated regulation of biological processes (16); therefore, it was hypothesized that
miRNAs with overlapping functions could be grouped based on
associated expression levels. The present study used an agnostic,
data-driven statistical approach to identify the co-expression
patterns of circulating miRNAs, which resulted in the
identification of three distinct factors. Furthermore, an in
silico approach was used to identify the individual genes and
biological pathways that were targeted by the miRNAs within each
factor, and assessed them for overlap, common themes and
concordance with the results from previous GWAS.
While pathway annotations provide a framework to
infer the involvement of physiological processes, their
interpretations are challenging. For example, the pathways in the
KEGG database are assigned names based on their initial
characterization (e.g., a cancer model); however, some pathways may
serve a crucial role in the pathogenesis of diseases and conditions
other than the one for which they were initially named, and these
misnomers can obfuscate biologically related processes when
hypothesis-driven approaches are applied. Considering the variable
etiology of T2D, agnostic approaches to identify the underlying
mechanisms may provide novel insights into the interactions between
multiple risk factors and disease development.
In the present study, the red factor could be
renamed as the metabolism and inflammation factor, as it targeted
pathways related to insulin and glucose metabolism, and
inflammation/immune function. Some pathways, such as the AGE-RAGE
signaling pathway in diabetic complications, insulin resistance,
glucagon signaling pathway, and lipid and atherosclerosis, are
linked to T2D. The functions of the other pathways targeted by the
miRNAs in the red factor may plausibly be involved in the etiology
of T2D, despite the names lacking a clear association with T2D.
Notably, the endocytosis pathway has been reported to contribute to
autoimmune activity (23), and
the human T-cell leukemia virus 1 infection pathway may contribute
to immune activity as well as inflammation (23). Furthermore, the adrenergic
signaling in cardiomyocytes pathway has been shown to serve a
pivotal role in stimulating the sympathetic nervous system, thereby
causing increased inflammation (23). Both immune function and
inflammation are related to insulin sensitivity and other processes
that are responsible for T2D risk (27).
The blue factor could be renamed as the
endocrine-hormone factor, as it comprised miRNAs that uniquely
target two KEGG pathways associated with endocrine function. The
GnRH signaling pathway represents the release of sex hormones from
the hypothalamus to the pituitary gland. (23) A previous animal model study
identified seven genes located in the ‘Type II diabetes’ KEGG
pathway that were downregulated in association with high GnRH
release, which suggests a plausible role for this pathway in the
development of T2D (28). The
thyroid hormone synthesis pathway produces triiodothyronine and
thyroxine, which are essential for metabolic homeostasis (23). Thyroid disease is more prevalent
in individuals with T2D compared with in individuals with normal
glucose tolerance, and thyroid hormones help to regulate glucose
absorption, insulin secretion and glycogen metabolism (29). Collectively, the pathways targeted
by the endocrine factor may contribute to the overall
pathophysiology of T2D.
As the green factor did not uniquely target any
pathways, an alternative name was not suggested. A total of 192
genes were identified that were targeted by one or both of the
miRNAs in the green factor (i.e., miR-16 and miR-342); furthermore,
several of these 192 genes have previously been associated with T2D
and related conditions. The associations between the most commonly
identified genes and the search terms can be categorized into
discrete aspects of T2D risk. Three genes were primarily associated
with terms related to glucose and diabetes. These included
adenylate cyclase 5 (ADCY5), which has been reported to be
associated with T2D and fasting blood glucose in GWAS (30), and nicotinamide
phosphoribosyltransferase, which has been shown to be independently
associated with T2D after controlling for obesity and insulin
sensitivity, and may be more related to glucose control (31). Polymorphisms in the potassium
voltage-gated channel subfamily B member 1 may be associated with
insulin resistance (32), the
protein coded by tea shirt zinc finger homeobox 1 regulates β-cell
maturation (33), and alleles in
JAZ zinc finger 1 reveal differential transcription specifically in
the pancreatic tissue (34).
Clearly linked to lipid metabolism, numerous polymorphisms in LDL
receptor protein 5 are associated with obesity and body composition
(35,36). Moreover, an overlap has been
observed between these categories (i.e., glucose control, insulin
sensitivity and obesity), and several of these genes presumably
exhibit coordinated functions involving multiple mechanisms. For
example, ADCY5 is associated with T2D, as well as with BMI
and obesity (37,38). Some of the genes associated with
numerous search terms may appear frequently, as they are related to
fundamental cellular processes as opposed to mechanisms unique to
T2D risk. Two examples include mitogen-activated protein kinase 9,
which is involved in numerous cellular processes (e.g.,
proliferation, differentiation, transcription regulation) and cell
division cycle 4, which regulates signaling pathways to control
multiple cellular functions (e.g., morphology, migration,
endocytosis, cell cycle progression) (39).
Some pathways targeted by miRNAs in multiple factors
may serve physiological roles that are common across multiple
subtypes of T2D. The longevity regulating pathway and longevity
regulating pathway-multiple species were targeted by the miRNAs in
all three factors and two factors, respectively. Aging is a major
risk factor for β-cell dysfunction and T2D (40); notably, caloric restriction is one
of the only known interventions to increase lifespan (41). Animal model studies have provided
evidence that caloric restriction improves β-cell function and
decreases insulin resistance (42,43). These longevity pathways are
involved in the responses triggered by caloric restriction,
including improved cellular fitness and inflammation suppression
(23). Autophagy is an important
aspect used to protect β-cells from oxidative stress, and the
resulting dysfunction associated with insulin resistance and
progression to T2D (44);
moreover, the autophagy-animal pathway was targeted by the miRNAs
within two factors in the present study. Further studies are
required to determine whether perturbation of this pathway is a
precursor to, or consequence of T2D, as autophagy is also related
to adipocyte function and obesity-related inflammation that can
lead to T2D (44). Autophagy is
strongly related to aging, and further research is required to
determine whether any interactions exist between the autophagy and
longevity pathways, and T2D risk. The mechanisms represented by
these pathways are not unique to a single aspect of T2D risk, but
may be broadly fundamental to maintaining healthy homeostasis
overall.
Based on the pathway analysis, the present study
cross-referenced whether genes present within the pathways targeted
by the combination of miRNAs in each factor had been identified by
GWAS focused on T2D. A limitation of GWAS findings is that complex
physiological processes that require coordinated activity of
multiple gene products are not necessarily characterized; however,
genetic polymorphisms that result in functional changes have the
potential to alter these physiological processes, and therefore
parallels between genetic associations with T2D and transcriptomic
and biological pathway associations with T2D may be identified. The
present study identified numerous genes within the targeted
pathways that have also been discovered in GWAS focused on T2D,
providing more evidence for a potential putative role of these
genes in T2D risk. In addition, this layered approach provides
evidence to prioritize findings from GWAS for functional validation
studies.
Several risk factors for T2D are important for the
etiology of other complex diseases (e.g., coronary heart disease,
stroke). For example, the atherogenic dyslipdemia profile, which is
characterized by low HDL and elevated triglycerides, is indicative
of insulin resistance that is associated risk for T2D (45). This dyslipdemia risk profile is
also associated with increased risk for both coronary heart disease
and stroke (45). Hypertension,
one of the most significant risk factors for coronary artery
disease and stroke, also frequently co-occurs with T2D (45). Potential clinical applications of
miRNAs as biomarkers extend beyond T2D (46), and the findings from this study
may have implications for these related conditions. Additional
studies focusing on these outcomes in addition to T2D may elucidate
potential mechanisms that result from the overlap in risk factors,
with the potential to differentiate similarities and differences in
the underlying risk profiles and potential new therapeutic targets
(47).
The present study identified three factors of
miRNAs, defined by their associated expression levels, with common
themes within their biological pathways and predicted mRNA targets.
Some of these targets are known to be associated with the
pathophysiology of T2D, whereas others may reveal new mechanisms
that underlie the complex interactions among T2D risk factors.
Subsets of these miRNA factors, and their targeted genes and
pathways, may be discretely associated with recently described
subtypes of T2D. A potential limitation of the present study was
the focus on the KEGG database for pathway annotation, in
particular high-quality annotations (i.e., those with the most
rigorous level of evidence). Additional pathway annotation
databases are available, and future studies may consider
overlapping evidence from multiple databases. Functional validation
of the observed relationships is also required to determine causal
relationships between miRNAs and their targets. We previously
performed a discovery analysis using an independent sample of
participants from the PRYSMS trial that measured the subset of
reliably detectable circulating miRNAs, thus revealing the
selection of the 59 miRNAs included in the design of the custom
assay used in the present study (13). Additional miRNAs not included in
this assay may be relevant for T2D risk. Future studies that are
designed to include a larger number of miRNAs may identify
additional miRNAs that are relevant to the three factors identified
in the present study or that define an additional novel factor(s).
Additionally, a possible bias exists in the findings from the
literature review because genes with a known association with T2D
risk are more likely to be studied, whereas genes with little known
information about their function may be less commonly reported. In
addition to replication and functional analyses, another important
future direction is to identify the subgroups of individuals with
similar patterns of expression of miRNAs and the miRNA-derived
factors to determine any associations with the observed subgroups
of T2D that present specific clinical characteristics (5–8).
The long-term implications include improved understanding of the
specific mechanisms that underlie T2D risk within subtypes based on
their overall risk profile and interactions between the risk
factors.
Supplementary Material
Supporting Data
Acknowledgements
The authors would like to thank Ms. Julinna Cheung
(University of California, USA) and Ms. Lena Noya (Brown
University, USA) for their contributions to the literature review
of the current study. The authors would also like to thank Ms. Lisa
Chang (Keck Graduate Institute, USA) for assisting with the
development of figures. Finally, the authors acknowledge Ms.
Xingyue Gong (University of California, USA) for contributing to
the literature review and data analysis of the present study.
Funding
Dr Flowers was supported by the National Center for Advancing
Translational Sciences of the National Institutes of Health (grant
no. KL2TR000143) and the Hellman Family Foundation. The PRYSMS
study was supported by the National Center for Complementary and
Alternative Medicine of the National Institutes of Health (grant
no. R01AT004569). Molecular data collection from the PRYSMS study
was supported by the National Institute of Diabetes, Digestive, and
Kidney Disease of the National Institutes of Health (grant no.
R21DK117346). Dr Kanaya is supported by National Heart Lung, and
Blood Institute of the National Institutes of Health (grant no.
2K24HL112827).
Availability of data and materials
The datasets used and/or analyzed during the current
study are available from the corresponding author on reasonable
request.
Authors' contributions
EF was the principal investigator of the grant that
supported this project, and conceived of and executed the overall
study and design, oversaw all molecular data collection, directed
the analysis plan, and wrote and revised the manuscript. KA
contributed to the analysis plan and performed bioinformatics
analyses. IEA contributed to the analysis plan, performed all
statistical modeling, contributed to the interpretation of the
results and approved the final manuscript. AMK was the principal
investigator of the PRYSMS trial and oversaw all clinical data
collection, contributed to the design and interpretation of results
for this study, and approved the final manuscript. BEA provided
overall scientific guidance for this study, consulted on the
bioinformatic analyses, contributed to interpretation of the
results and approved the final manuscript. EF, IEA and AMK confirm
the authenticity of the raw data. All authors read and approved the
final manuscript.
Ethics approval and consent to
participate
All participants in the parent PRYSMS trial provided
written informed consent for all trial procedures, including
banking of biospecimens for future analyses. The present study was
approved by the Institutional Review Board at the University of
California San Francisco (approval no. #10-02436).
Patient consent for publication
Not applicable.
Competing interests
The authors declare that they have no competing
interests.
Glossary
Abbreviations
Abbreviations:
|
BMI
|
body mass index
|
|
FBG
|
fasting blood glucose
|
|
GWAS
|
genome wide association studies
|
|
HbA1c
|
hemoglobin A1c
|
|
KEGG
|
Kyoto Encyclopedia of Genes and
Genomes
|
|
miRNA/miR
|
microRNA
|
|
mRNA
|
messenger RNA
|
|
PRYSMS
|
Practicing Restorative Yoga versus
Stretching for the Metabolic Syndrome
|
|
T2D
|
type 2 diabetes
|
References
|
1
|
National Diabetes Statistics Report, .
Centers for Diseaes Control and Prevention, U.S. Department of
Health and Human Services; Atlanta, GA: 2017
|
|
2
|
Manolio TA, Collins FS, Cox NJ, Goldstein
DB, Hindorff LA, Hunter DJ, McCarthy MI, Ramos EM, Cardon LR,
Chakravarti A, et al: Finding the missing heritability of complex
diseases. Nature. 461:747–753. 2009. View Article : Google Scholar : PubMed/NCBI
|
|
3
|
Xue A, Wu Y, Zhu Z, Zhang F, Kemper KE,
Zheng Z, Yengo L, Lloyd-Jones LR, Sidorenko J, Wu Y, et al:
Genome-wide association analyses identify 143 risk variants and
putative regulatory mechanisms for type 2 diabetes. Nat Commun.
9:29412018. View Article : Google Scholar : PubMed/NCBI
|
|
4
|
Bagchi D: Nutritional and therapeutic
interventions for diabetes and metabolic syndrome. Elsevier;
Waltham, MA: 2018
|
|
5
|
Ahlqvist E, Storm P, Käräjämäki A,
Martinell M, Dorkhan M, Carlsson A, Vikman P, Prasad RB, Aly DM,
Almgren P, et al: Novel subgroups of adult-onset diabetes and their
association with outcomes: A data-driven cluster analysis of six
variables. Lancet Diabetes Endocrinol. 6:361–369. 2018. View Article : Google Scholar : PubMed/NCBI
|
|
6
|
Zou X, Zhou X, Zhu Z and Ji L: Novel
subgroups of patients with adult-onset diabetes in Chinese and US
populations. Lancet Diabetes Endocrinol. 7:9–11. 2019. View Article : Google Scholar : PubMed/NCBI
|
|
7
|
Anjana RM, Baskar V, Nair ATN, Jebarani S,
Siddiqui MK, Pradeepa R, Unnikrishnan R, Palmer C, Pearson E and
Mohan V: Novel subgroups of type 2 diabetes and their association
with microvascular outcomes in an Asian Indian population: A
data-driven cluster analysis: The INSPIRED study. BMJ Open Diabetes
Res Care. 8:e0015062020. View Article : Google Scholar : PubMed/NCBI
|
|
8
|
Herder C, Maalmi H, Strassburger K,
Zaharia OP, Ratter JM, Karusheva Y, Elhadad MA, Bódis K, Bongaerts
BWC, Rathmann W, et al: Differences in biomarkers of inflammation
between novel subgroups of recent-onset diabetes. Diabetes.
70:1198–1208. 2021. View Article : Google Scholar : PubMed/NCBI
|
|
9
|
Hill-Briggs F, Adler NE, Berkowitz SA,
Chin MH, Gary-Webb TL, Navas-Acien A, Thornton PL and Haire-Joshu
D: Social determinants of health and diabetes: A scientific review.
Diabetes Care. 44:258–279. 2020. View Article : Google Scholar : PubMed/NCBI
|
|
10
|
Flowers E, Won GY and Fukuoka Y: MicroRNAs
associated with exercise and diet: A systematic review. Physiol
Genomics. 47:1–11. 2015. View Article : Google Scholar : PubMed/NCBI
|
|
11
|
Parr EB, Camera DM, Burke LM, Phillips SM,
Coffey VG and Hawley JA: Circulating microRNA responses between
‘high’ and ‘low’ responders to a 16-Wk diet and exercise weight
loss intervention. PLoS One. 11:e01525452016. View Article : Google Scholar : PubMed/NCBI
|
|
12
|
Vaishya S, Sarwade RD and Seshadri V:
MicroRNA, proteins, and metabolites as novel biomarkers for
prediabetes, diabetes, and related complications. Front Endocrinol
(Lausanne). 9:1802018. View Article : Google Scholar : PubMed/NCBI
|
|
13
|
Flowers E, Allen IE, Kanaya AM and
Aouizerat BE: Circulating microRNAs predict glycemic improvement
and response to a behavioral intervention. Biomark Res. 9:652021.
View Article : Google Scholar : PubMed/NCBI
|
|
14
|
Flowers E, Aouizerat BE, Abbasi F,
Lamendola C, Grove KM, Fukuoka Y and Reaven GM: Circulating
microRNA-320a and microRNA-486 predict thiazolidinedione response:
Moving towards precision health for diabetes prevention.
Metabolism. 64:1051–1059. 2015. View Article : Google Scholar : PubMed/NCBI
|
|
15
|
Flowers E, Gadgil M, Aouizerat BE and
Kanaya AM: Circulating micrornas associated with glycemic
impairment and progression in Asian Indians. Biomark Res. 3:1–8.
2015. View Article : Google Scholar : PubMed/NCBI
|
|
16
|
Wang Y, Luo J, Zhang H and Lu J: MicroRNAs
in the same clusters evolve to coordinately regulate functionally
related genes. Mol Biol Evol. 33:2232–2247. 2016. View Article : Google Scholar : PubMed/NCBI
|
|
17
|
Zhu H and Leung SW: Identification of
microRNA biomarkers in type 2 diabetes: A meta-analysis of
controlled profiling studies. Diabetologia. 58:900–911. 2015.
View Article : Google Scholar : PubMed/NCBI
|
|
18
|
Mononen N, Lyytikäinen LP, Seppälä I,
Mishra PP, Juonala M, Waldenberger M, Klopp N, Illig T, Leiviskä J,
Loo BM, et al: Whole blood microRNA levels associate with glycemic
status and correlate with target mRNAs in pathways important to
type 2 diabetes. Sci Rep. 9:88872019. View Article : Google Scholar : PubMed/NCBI
|
|
19
|
Kanaya AM, Araneta MR, Pawlowsky SB,
Barrett-Connor E, Grady D, Vittinghoff E, Schembri M, Chang A,
Carrion-Petersen ML, Coggins T, et al: Restorative yoga and
metabolic risk factors: the practicing restorative yoga vs.
stretching for the metabolic syndrome (PRYSMS) randomized trial. J
Diabetes Complications. 28:406–412. 2014. View Article : Google Scholar : PubMed/NCBI
|
|
20
|
Alberti KG, Eckel RH, Grundy SM, Zimmet
PZ, Cleeman JI, Donato KA, Fruchart JC, James WP, Loria CM, Smith
SC Jr, et al: Harmonizing the metabolic syndrome: A joint interim
statement of the international diabetes federation task force on
epidemiology and prevention; national heart, lung, and blood
institute; American heart association; world heart federation;
international atherosclerosis society; and international
association for the study of obesity. Circulation. 120:1640–1645.
2009. View Article : Google Scholar : PubMed/NCBI
|
|
21
|
Friedewald WT, Levy RI and Fredrickson DS:
Estimation of the concentration of low-density lipoprotein
cholesterol in plasma, without use of the preparative
ultracentrifuge. Clin Chem. 18:499–502. 1972. View Article : Google Scholar : PubMed/NCBI
|
|
22
|
Vandesompele J, De Preter K, Pattyn F,
Poppe B, Van Roy N, De Paepe A and Speleman F: Accurate
normalization of real-time quantitative RT-PCR data by geometric
averaging of multiple internal control genes. Genome Biol.
3:RESEARCH00342002. View Article : Google Scholar : PubMed/NCBI
|
|
23
|
Kanehisa M and Goto S: KEGG: Kyoto
encyclopedia of genes and genomes. Nucleic Acids Res. 28:27–30.
2000. View Article : Google Scholar : PubMed/NCBI
|
|
24
|
Dweep H, Sticht C, Pandey P and Gretz N:
MiRWalk-database: Prediction of possible miRNA binding sites by
‘walking’ the genes of three genomes. J Biomed Inform. 44:839–847.
2011. View Article : Google Scholar : PubMed/NCBI
|
|
25
|
Benjamini Y and Hochberg Y: Controlling
the false discovery rate: A practical and powerful approach to
multiple testing. J Royal Statistical Society. Series B
(Methodological). 57:289–300. 1995. View Article : Google Scholar : PubMed/NCBI
|
|
26
|
Common Metabolic Diseases Knowledge
Portal. https://hugeamp.org/phenotype.html?phenotype=T2DMay
26–2021
|
|
27
|
Sell H, Habich C and Eckel J: Adaptive
immunity in obesity and insulin resistance. Nat Rev Endocrinol.
8:709–716. 2012. View Article : Google Scholar : PubMed/NCBI
|
|
28
|
Xiang W, Zhang B, Lv F, Feng G, Chen L,
Yang F, Zhang K, Cao C, Wang P and Chu M: The potential regulatory
mechanisms of the gonadotropin-releasing hormone in gonadotropin
transcriptions identified with bioinformatics analyses. Reprod Biol
Endocrinol. 15:462017. View Article : Google Scholar : PubMed/NCBI
|
|
29
|
Johnson JL: Diabetes control in thyroid
disease. Diabetes Spectrum. 19:148–153. 2006. View Article : Google Scholar
|
|
30
|
Dupuis J, Langenberg C, Prokopenko I,
Saxena R, Soranzo N, Jackson AU, Wheeler E, Glazer NL, Bouatia-Naji
N, Gloyn AL, et al: New genetic loci implicated in fasting glucose
homeostasis and their impact on type 2 diabetes risk. Nat Genet.
42:105–116. 2010. View
Article : Google Scholar : PubMed/NCBI
|
|
31
|
Esteghamati A, Alamdari A, Zandieh A,
Elahi S, Khalilzadeh O, Nakhjavani M and Meysamie A: Serum visfatin
is associated with type 2 diabetes mellitus independent of insulin
resistance and obesity. Diabetes Res Clin Pract. 91:154–158. 2011.
View Article : Google Scholar : PubMed/NCBI
|
|
32
|
Yu Y, Wang J, Kang R, Dong J, Zhang Y, Liu
F, Yan Y, Zhu R, Xia L, Peng X, et al: Association of KCNB1
polymorphisms with lipid metabolisms and insulin resistance: A
case-control design of population-based cross-sectional study in
Chinese Han population. Lipids Health Dis. 14:1122015. View Article : Google Scholar : PubMed/NCBI
|
|
33
|
Raum JC, Soleimanpour SA, Groff DN, Coré
N, Fasano L, Garratt AN, Dai C, Powers AC and Stoffers DA: Tshz1
regulates pancreatic β-cell maturation. Diabetes. 64:2905–2914.
2015. View Article : Google Scholar : PubMed/NCBI
|
|
34
|
Fogarty MP, Panhuis TM, Vadlamudi S,
Buchkovich ML and Mohlke KL: Allele-specific transcriptional
activity at type 2 diabetes-associated single nucleotide
polymorphisms in regions of pancreatic islet open chromatin at the
JAZF1 locus. Diabetes. 62:1756–1762. 2013. View Article : Google Scholar : PubMed/NCBI
|
|
35
|
Adabi E, Omidfar A, Farahani NA, Faghihi
F, Asghar Malek Hosseini SA, Maghbooli Z and Shirvani A: The
association of LRP5 (rs556442) polymorphism with body composition
and obesity in postmenopausal women. Diabetes Metab Syndr.
13:2381–2385. 2019. View Article : Google Scholar : PubMed/NCBI
|
|
36
|
Zhang L, Wang J, Zhang M, Wang G, Shen Y,
Wu D, Wang C, Li L, Ren Y, Wang B, et al: Association of type 2
diabetes mellitus with the interaction between low-density
lipoprotein receptor-related protein 5 (LRP5) polymorphisms and
overweight and obesity in rural Chinese adults. J Diabetes.
9:994–1002. 2017. View Article : Google Scholar : PubMed/NCBI
|
|
37
|
Perry JR, Voight BF, Yengo L, Amin N,
Dupuis J, Ganser M, Grallert H, Navarro P, Li M, Qi L, et al:
Stratifying type 2 diabetes cases by BMI identifies genetic risk
variants in LAMA1 and enrichment for risk variants in lean compared
to obese cases. PLoS Genet. 8:e10027412012. View Article : Google Scholar : PubMed/NCBI
|
|
38
|
Manning AK, Hivert MF, Scott RA, Grimsby
JL, Bouatia-Naji N, Chen H, Rybin D, Liu CT, Bielak LF, Prokopenko
I, et al: A genome-wide approach accounting for body mass index
identifies genetic variants influencing fasting glycemic traits and
insulin resistance. Nat Genet. 44:659–669. 2012. View Article : Google Scholar : PubMed/NCBI
|
|
39
|
Gene (Internet), . National Library of
Medicine (US). National Center for Biotechnology Information;
Bethesda, MD: 1988
|
|
40
|
Chang AM and Halter JB: Aging and insulin
secretion. Am J Physiol Endocrinol Metab. 284:E7–E12. 2003.
View Article : Google Scholar : PubMed/NCBI
|
|
41
|
Newgard CB and Pessin JE: Recent progress
in metabolic signaling pathways regulating aging and life span. J
Gerontol A Biol Sci Med Sci. 69 (Suppl 1):S21–S27. 2014. View Article : Google Scholar : PubMed/NCBI
|
|
42
|
Corezola do Amaral ME, Kravets V, Dwulet
JM, Farnsworth NL, Piscopio R, Schleicher WE, Miranda JG and
Benninger RK: Caloric restriction recovers impaired β-cell-β-cell
gap junction coupling, calcium oscillation coordination, and
insulin secretion in prediabetic mice. Am J Physiol Endocrinol
Metab. 319:E709–E720. 2020. View Article : Google Scholar : PubMed/NCBI
|
|
43
|
He XY, Zhao XL, Gu Q, Shen JP, Hu Y and Hu
RM: Calorie restriction from a young age preserves the functions of
pancreatic β cells in aging rats. Tohoku J Exp Med. 227:245–252.
2012. View Article : Google Scholar : PubMed/NCBI
|
|
44
|
Stienstra R, Haim Y, Riahi Y, Netea M,
Rudich A and Leibowitz G: Autophagy in adipose tissue and the beta
cell: Implications for obesity and diabetes. Diabetologia.
57:1505–1516. 2014. View Article : Google Scholar : PubMed/NCBI
|
|
45
|
American Diabetes Association. 10.
Cardiovascular disease, risk management, . Standards of medical
care in diabetes-2021. Diabetes Care. 44 (Suppl 1):S125–S150. 2021.
View Article : Google Scholar : PubMed/NCBI
|
|
46
|
Condrat CE, Thompson DC, Barbu MG, Bugnar
OL, Boboc A, Cretoiu D, Suciu N, Cretoiu SM and Voinea SC: miRNAs
as biomarkers in disease: Latest findings regarding their role in
diagnosis and prognosis. Cells. 9:2762020. View Article : Google Scholar : PubMed/NCBI
|
|
47
|
Rupaimoole R and Slack FJ: MicroRNA
therapeutics: Towards a new era for the management of cancer and
other diseases. Nat Rev Drug Discov. 16:203–222. 2017. View Article : Google Scholar : PubMed/NCBI
|