Introduction
Advances in single-cell RNA sequencing (scRNA-seq)
have revolutionized the ability to further investigate the
transcriptional status of individual cells. ScRNA-seq has been
successfully applied to identify cell types and understand complex
subsets in various cancers, including lung (1), breast (2) and colon cancer (3). By contrast, single cells are
challenging to recover entirely from certain tissues, such as brain
tissue (4), and certain single
cells, such as adipocytes (5),
are incompatible with the droplet-based single-cell approach.
Furthermore, scRNA-seq is restricted to fresh tissues and cannot be
used in frozen tissues.
Single-nucleus RNA-seq (snRNA-seq) provides a
solution to the aforementioned issues, and has been used in
pancreas, brain and archive tissues (6–8).
SnRNA-seq may be applied to preserved or inseparable tissues,
avoiding the need to separate cells into single-cell suspensions.
It can preclude the potential changes in gene expression resulting
from enzymatic cell separation methods (9,10).
Previous studies have demonstrated a high degree of concordance in
sensitivity and cell-type classification between snRNA-seq and
scRNA-seq (1,11,12). In addition, snRNA-seq has been
indicated to possess unique advantages in capturing long non-coding
RNAs and precursor microRNAs in the nucleus (13). However, snRNA-seq exhibits a
number of limitations. For example, Thrupp et al (14) demonstrated that a small number of
genes enriched in microglial activation genes were missing from
snRNA-seq data compared with scRNA-seq data in human microglia.
This suggested that snRNA-seq is not suitable for detecting
microglial activation in humans (14,15).
Hepatocellular carcinoma (HCC) is the fourth leading
cause of cancer-related death worldwide (16). In 2015, there were 854,000 cases
of liver cancer and 810,000 deaths worldwide (17). HCC often develops from liver
fibrosis, making it difficult to isolate tumor cells. To date, the
majority of single-cell sequencing studies in HCC have focused on
nonparenchymal cells (18), such
as immune cells. There are few studies based on hepatocytes and
hepatocellular-nonparenchymal cell interactions (19,20).
The present study aimed to explore the differences
between the two sequencing methods, to determine whether snRNA-seq
can replace or complement scRNA-seq.
Materials and methods
Sample preparation
Tumor tissue samples obtained in March 2021 from a
65-year-old male patient with HCC who underwent curative resection
at Qingdao Municipal Hospital (Qingdao, China) were used to perform
scRNA-seq and snRNA-seq. The present study was approved (approval
no. 2022003) by the ethics committee of Qingdao Municipal Hospital
(Qingdao, China) and informed consent was obtained from the
patient. Diagnosis was confirmed histologically.
For scRNA-seq, freshly excised tissue was rinsed
with RPMI-1640 medium (Thermo Fisher Scientific, Inc.) and cut into
1-2-mm pieces. The samples were incubated at 37°C for 40 min with
digestive solution, containing 0.25% trypsin (Thermo Fisher
Scientific, Inc.) and 10 µg/ml DNase I (MilliporeSigma; Merck KGaA)
dissolved in 5% FBS (Thermo Fisher Scientific, Inc.). Samples were
manually oscillated every 5 min, and filtered twice using a 40-µm
nylon mesh (Thermo Fisher Scientific, Inc.). Erythrocytes were
removed using 1X Red Blood Cell Lysis Solution (Thermo Fisher
Scientific, Inc.).
To ensure that each cell was paired with the beads
in the gel bead emulsion, 10X library preparation, and sequencing
beads with a unique molecular identifier (UMI) and cell barcode
were loaded to a near saturation position. Polyadenylated RNA
molecules were hybridized with microbeads after exposure to cell
lysis buffers. The beads are recycled into a test tube for reverse
transcription. During cDNA synthesis, the 5′ end of each cDNA
molecule identifies its cell of origin with the UMI and cell
markers. In brief, 10X microbeads perform second strand cDNA
synthesis, splicing and universal amplification. Sequencing
libraries were prepared using randomly interrupted whole
transcriptome amplifications to enrich the 3′ ends of transcripts
associated with cell barcodes and UMI.
For snRNA-seq, chopped liver tissue was resuspended
in 0.5 ml cold Nuclei EZ lysis buffer (NUC-101; MilliporeSigma) and
homogenized on ice with a Dounce grinder. The homogenates were
sequentially filtered through 70- and 40-mm cell filters (Thermo
Fisher Scientific, Inc.) and centrifuged at 4°C (speed, 1,000 × g)
for 5 min to precipitate the nuclei. The precipitate was
resuspended in 1 ml cold washing buffer (PBS containing 2% bovine
serum albumin; MilliporeSigma) and subsequently filtered through a
20-µm cell filter (500 g).
Sequencing on the 10X Chromium
platform
The Chromium single cell 3′ library was constructed
using the Chromium single cell 3′ library, gel beads, and multiple
kits and chip kits (10X Genomics) according to the manufacturer's
instructions. Cell suspensions with reverse transcription premixes
and single cell 3′-gel beads were loaded onto a chrome single cell
chip, with a single cell count of 2,000-8,000 per reaction. Samples
were treated using a 10X Genomics V2 kit. After cell lysis, the
first strand cDNA was synthesized and amplified according to the
manufacturer's instructions. The amplification cycle was set to 12
cycles. The library was sequenced using Illumina HiSeq X Ten
sequencing system and the human reference genome was mapped using
CellRanger (10X Genomics) software (version 5.0.0, http://www.10×genomics.com/).
Data analysis
Read demultiplexing and alignment to the GRCh38
human reference genome were performed using CellRanger. Additional
conservative cut-off values were further applied based on the
number of genes detected per cell (>200) and the percentage of
mitochondrial UMI counts (<20%). Seurat (version 4.1.1,
http://satijalab.org/seurat/) was used
for further data processing and integration.
Anchors were identified using the
FindIntegrationAnchors function with the default settings, which
takes a list of Seurat objects as input. These anchors were used to
integrate the two sets of data with the IntegrateData function.
Identification of highly variable genes was
performed using Seurat and the MeanVarPlot function with the
default settings to identify the top ~2,000 variable genes.
Cluster analysis was performed with Seurat using a
graph-based clustering approach. Briefly, the JackStraw function
with the default settings was used to determine significant
principal components (P<0.0001), and these principal components
were utilized to generate the k-nearest neighbours (KNN) graph
based on the Euclidean distance in PCA (Principal component
analysis) space. The edge weights between any two cells were
refined based on the shared overlap in their local neighborhoods
(Jaccard distance). Cells were subsequently clustered according to
a smart local moving algorithm, which iteratively clusters cell
groups together with the goal of optimizing the standard modularity
function. The resolution for the FindClusters function was set to
0.5. High modularity networks possess dense connections between the
nodes within a given module, and sparse connections between nodes
in different modules. Clusters were visualized using a uniform
manifold approximation and projection for dimension reduction
(UMAP) plot.
Differential expression analysis was performed in
Seurat utilizing the FindAllMarkers function with the default
settings.
Gene Ontology (GO) annotations were analyzed using
clusterProfiler (version 4.2.2, http://bioconductor.org/packages/release/bioc/html/clusterProfiler.html).
Adusted P<0.05 was considered to indicate a statistically
significant difference. The barplot function was used in
clusterProfiler for graphical visualization.
Monocle2 (version 2.22.0, http://cole-trapnell-lab.github.io/monocle-release/docs/)
(21) algorithm was used to
analyze the differentiation status of hepatocytes. The orderCells
function was used to sort and visualize cells arranged along a
quasi-chronological trajectory. Using the differentialGeneTest
function, the differentially expressed genes were calculated and
visualized.
The CellphoneDB (version 3.0.0, http://pypi.org/project/CellPhoneDB/)
(22) algorithm was used to
obtain receptor-ligand pairs to analyze the interaction between HCC
cells and T cells. Extracted normalized count data from the Seurat
object were used as input.
All UMAP plots, violin plots and heatmaps in the
present study were generated using Seurat functions combined with
the ggplot2 and pheatmap R packages (version 4.1.2).
Results
RNA-seq profiling and comparison of
transcriptomes between single nuclei and single cells
In total, 14,349 single nuclei and 9,504 single
cells were isolated from the same HCC sample and sequencing was
performed. The integration and clustering results are presented in
Fig. 1. Notably, 97.1% single
nuclei and 97.9% single cells passed quality control (Table I). SnRNA-seq matched an increased
number of genes (nFeature, 2,933 vs. 1,297) than scRNA-seq.
Moreover, scRNA-seq detected a higher number of counts (nCount,
42,940 vs. 25,070) than snRNA-seq (Table I). Ribosome- and
mitochondria-associated genes were identified at a higher rate
using scRNA-seq than by using snRNA-seq (Fig. 1A and C), suggesting that the
sample digestion step prior to scRNA-seq exerts an influence on
cell activity, and snRNA-seq may maintain cell activity at an
improved rate.
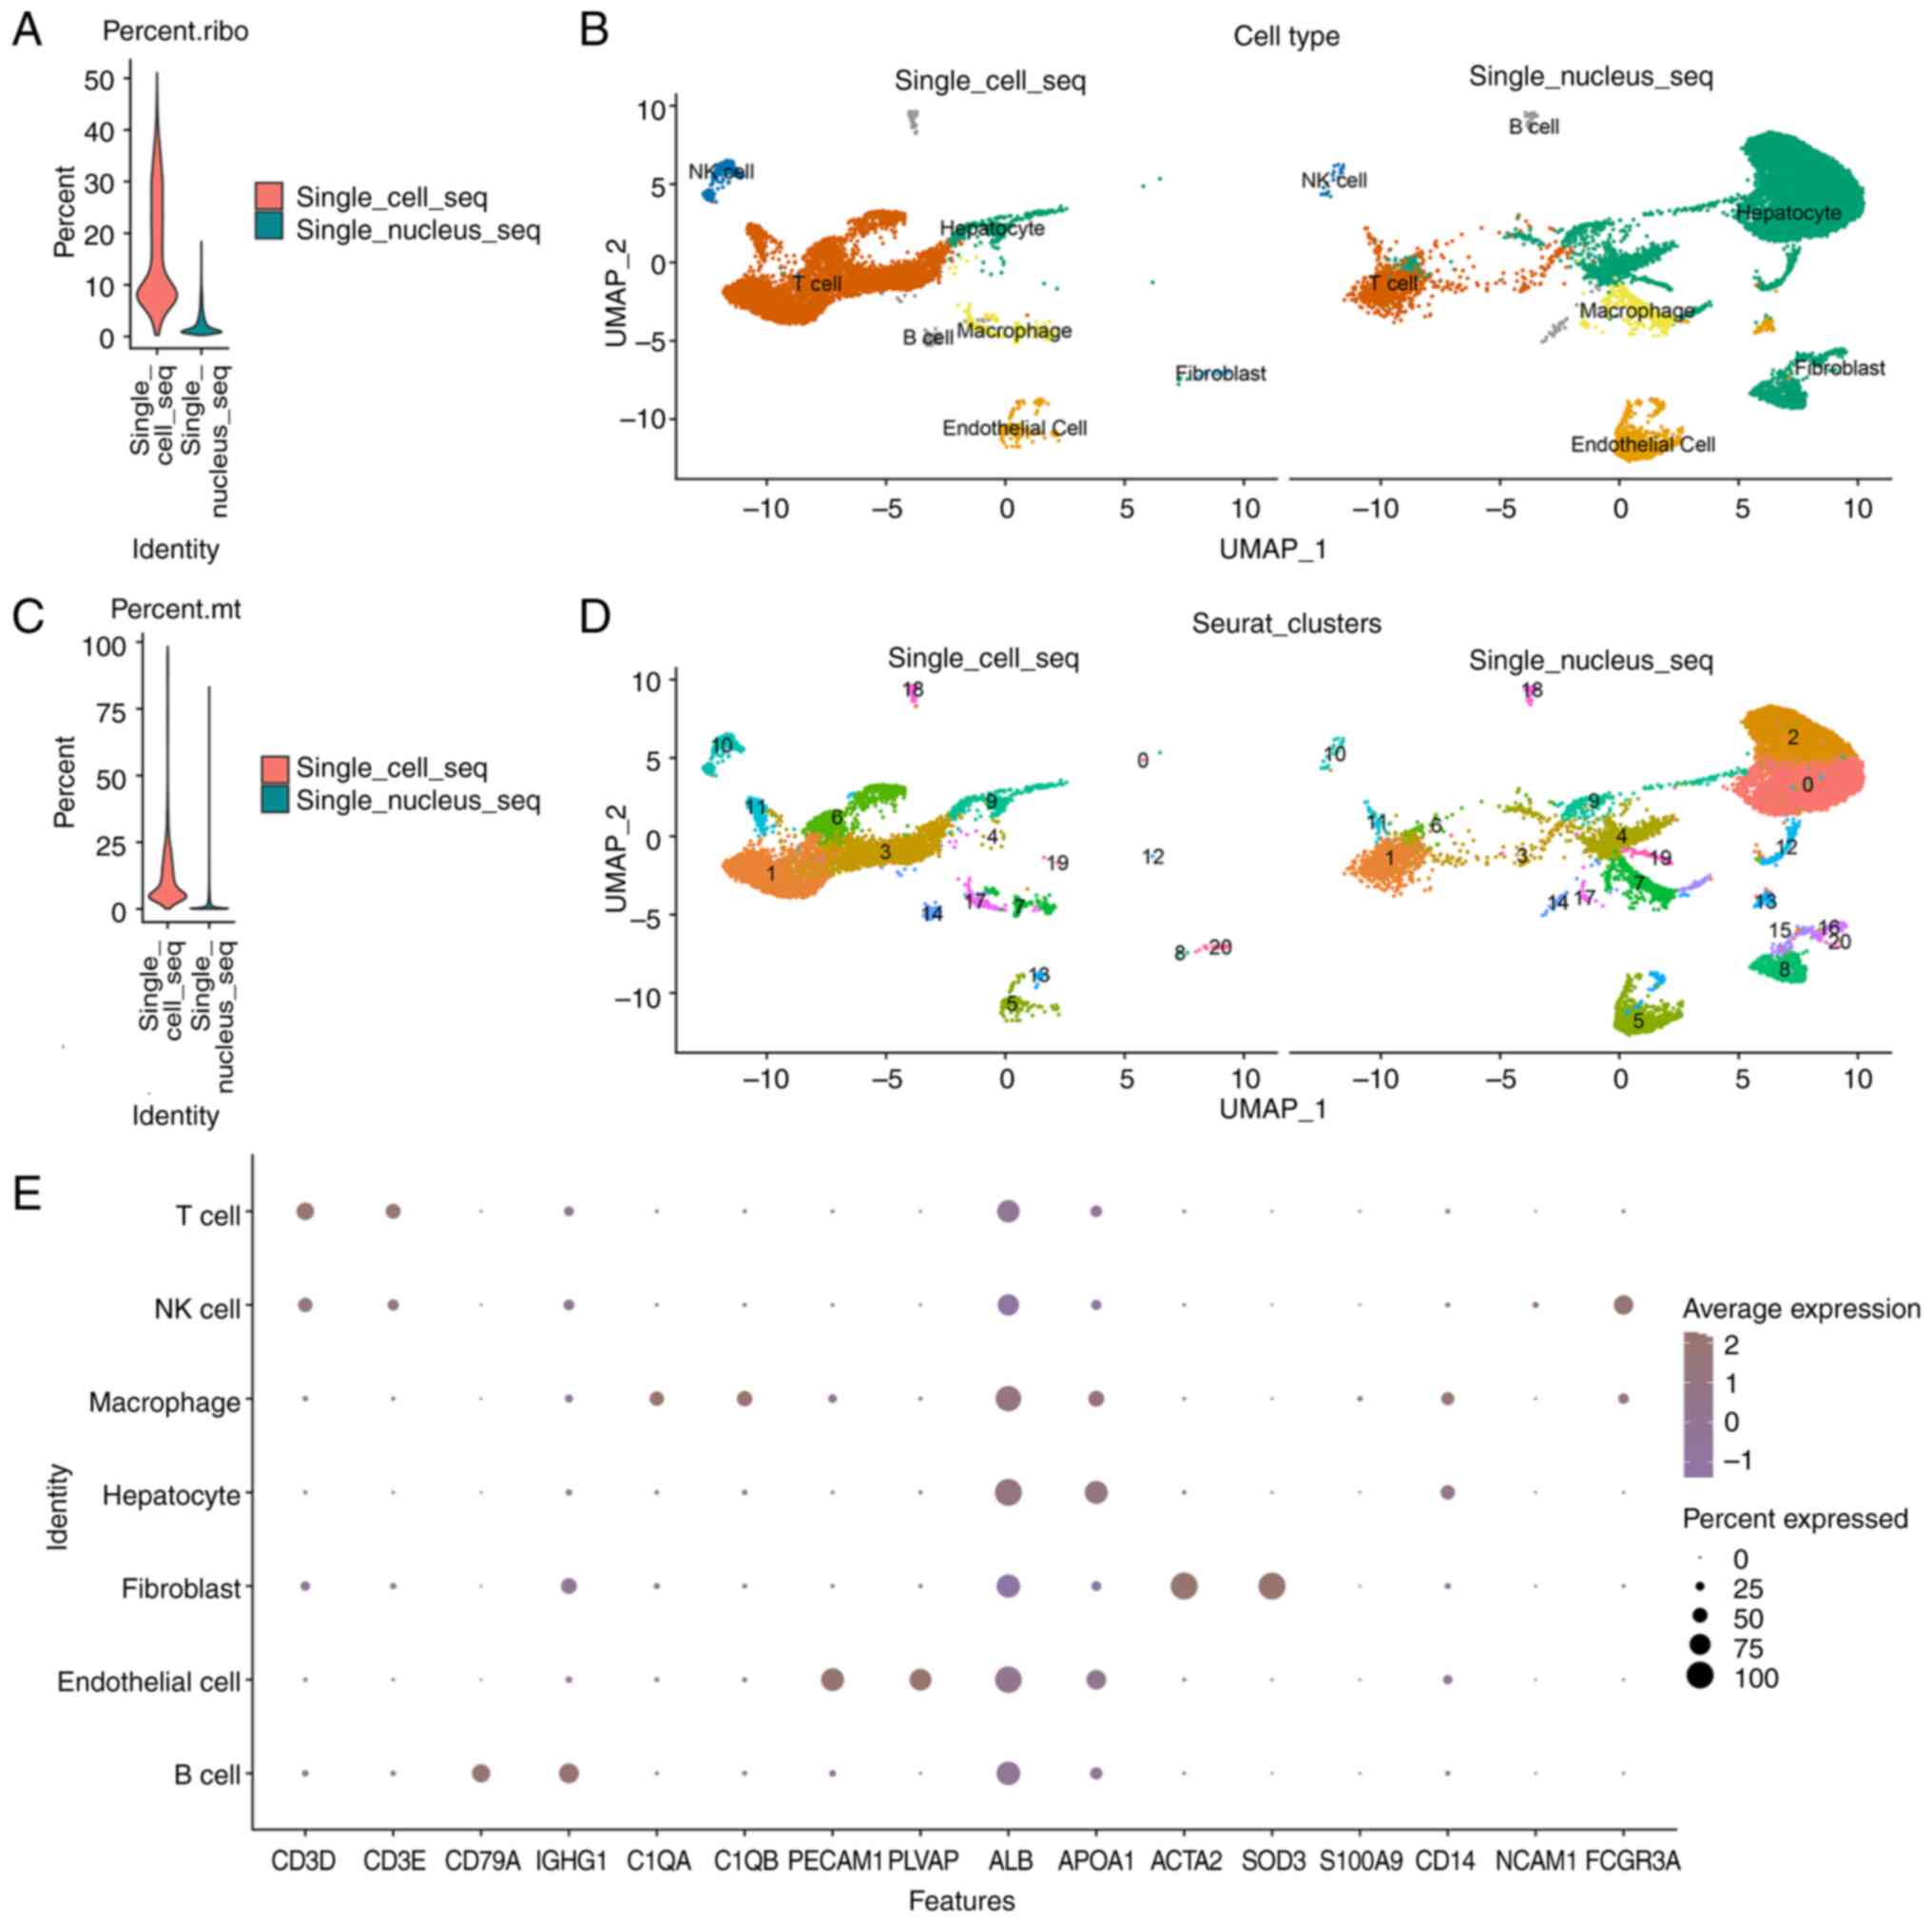 | Figure 1.Integrated scRNA-seq and snRNA-seq
datasets in HCC to identify and characterize cell types. (A)
Vlnplot of the ribosome proportion of two sequencing methods. (B)
Uniform Manifold Approximation and Projection visualization of
14,349 single nuclei and 9,504 single cells from the same HCC
sample. Clustering was divided into 7 main cell types. (C) Vlnplot
of the mitochondrial proportion of two sequencing methods. (D)
Clustering was divided into 21 clusters. (E) Dotplot of marker
genes expressed in T cells (CD3D and CD3E), macrophages/monocytes
(C1QA and C1QB), B cells (CD79A and IGHG1), NK cells (NCAM1 and
FCGR3A), endothelial cells (PECAM1 and PLVAP), hepatocytes (ALB and
APOA1) and fibroblasts (SOD3 and ACTA2). snRNA-seq, single-nucleus
RNA sequencing; scRNA-seq, single-cell RNA sequencing; HCC,
hepatocellular carcinoma. |
 | Table I.Quality control indicators from the
Cell Ranger analysis. |
Table I.
Quality control indicators from the
Cell Ranger analysis.
| Quality control
indicator | snRNA-seq | scRNA-seq |
|---|
| Valid Barcodes,
% | 97.1 | 97.9 |
| Valid UMIs, % | 99.9 | 100.0 |
| Reads Mapped
Confidently to Intronic Regions, % | 44.7 | 15.2 |
| Mean Reads per
Cell, n | 25,070 | 42,940 |
| Median Genes per
Cell, n | 2,933 | 1,297 |
Cell types identified with nuclei and
cells
A total of 21 clusters were identified in the
integrated data and were matched to seven cell types, according to
the expression levels of marker genes (Fig. 1B, D and E). There were four types
of immune cells: T cells (n, 6,903; represented by the marker genes
CD3D and CD3E), macrophages/monocytes (n, 950; C1QA and C1QB), B
cells (n, 426; CD79A and IGHG1) and natural killer (NK) cells (n,
453; NCAM1 and FCGR3A). A total of three types of nonimmune cells
were identified: Endothelial cells (n, 1,361; PECAM1 and PLVAP),
hepatocytes [n, 9,999; ALB and apolipoprotein (APO)A1] and
fibroblasts (n, 61; SOD3 and ACTA2). The expression of marker genes
in each cluster is displayed in Fig.
1B. The cell number/proportion of each cluster is displayed in
the supplementary files (Tables
SI and SII).
The cell types and cell numbers identified by
snRNA-seq and scRNA-seq were compared and the results are provided
in Figs. 2 and 3. An increased number of hepatocytes and
endothelial cells were detected using snRNA-seq, and an increased
number of T cells, B cells and NK cells were detected using
scRNA-seq (Fig. 2A and B).
Moreover, ~95% of the hepatocytes and 87% of the endothelial cells
were obtained from the snRNA-seq data, and 82% of the T cells, 77%
of the B cells and 95% of the NK cells were obtained from the
scRNA-seq data. By comparison, the snRNA-seq data was mainly
composed of hepatocytes and endothelial cells, accounting for 75
and 9% of the cells, respectively. The scRNA-seq data was mainly
composed of T cells, B cells, macrophages and NK cells, accounting
for 75.5, 4, 5 and 5% of the cells, respectively (Fig. 2C).
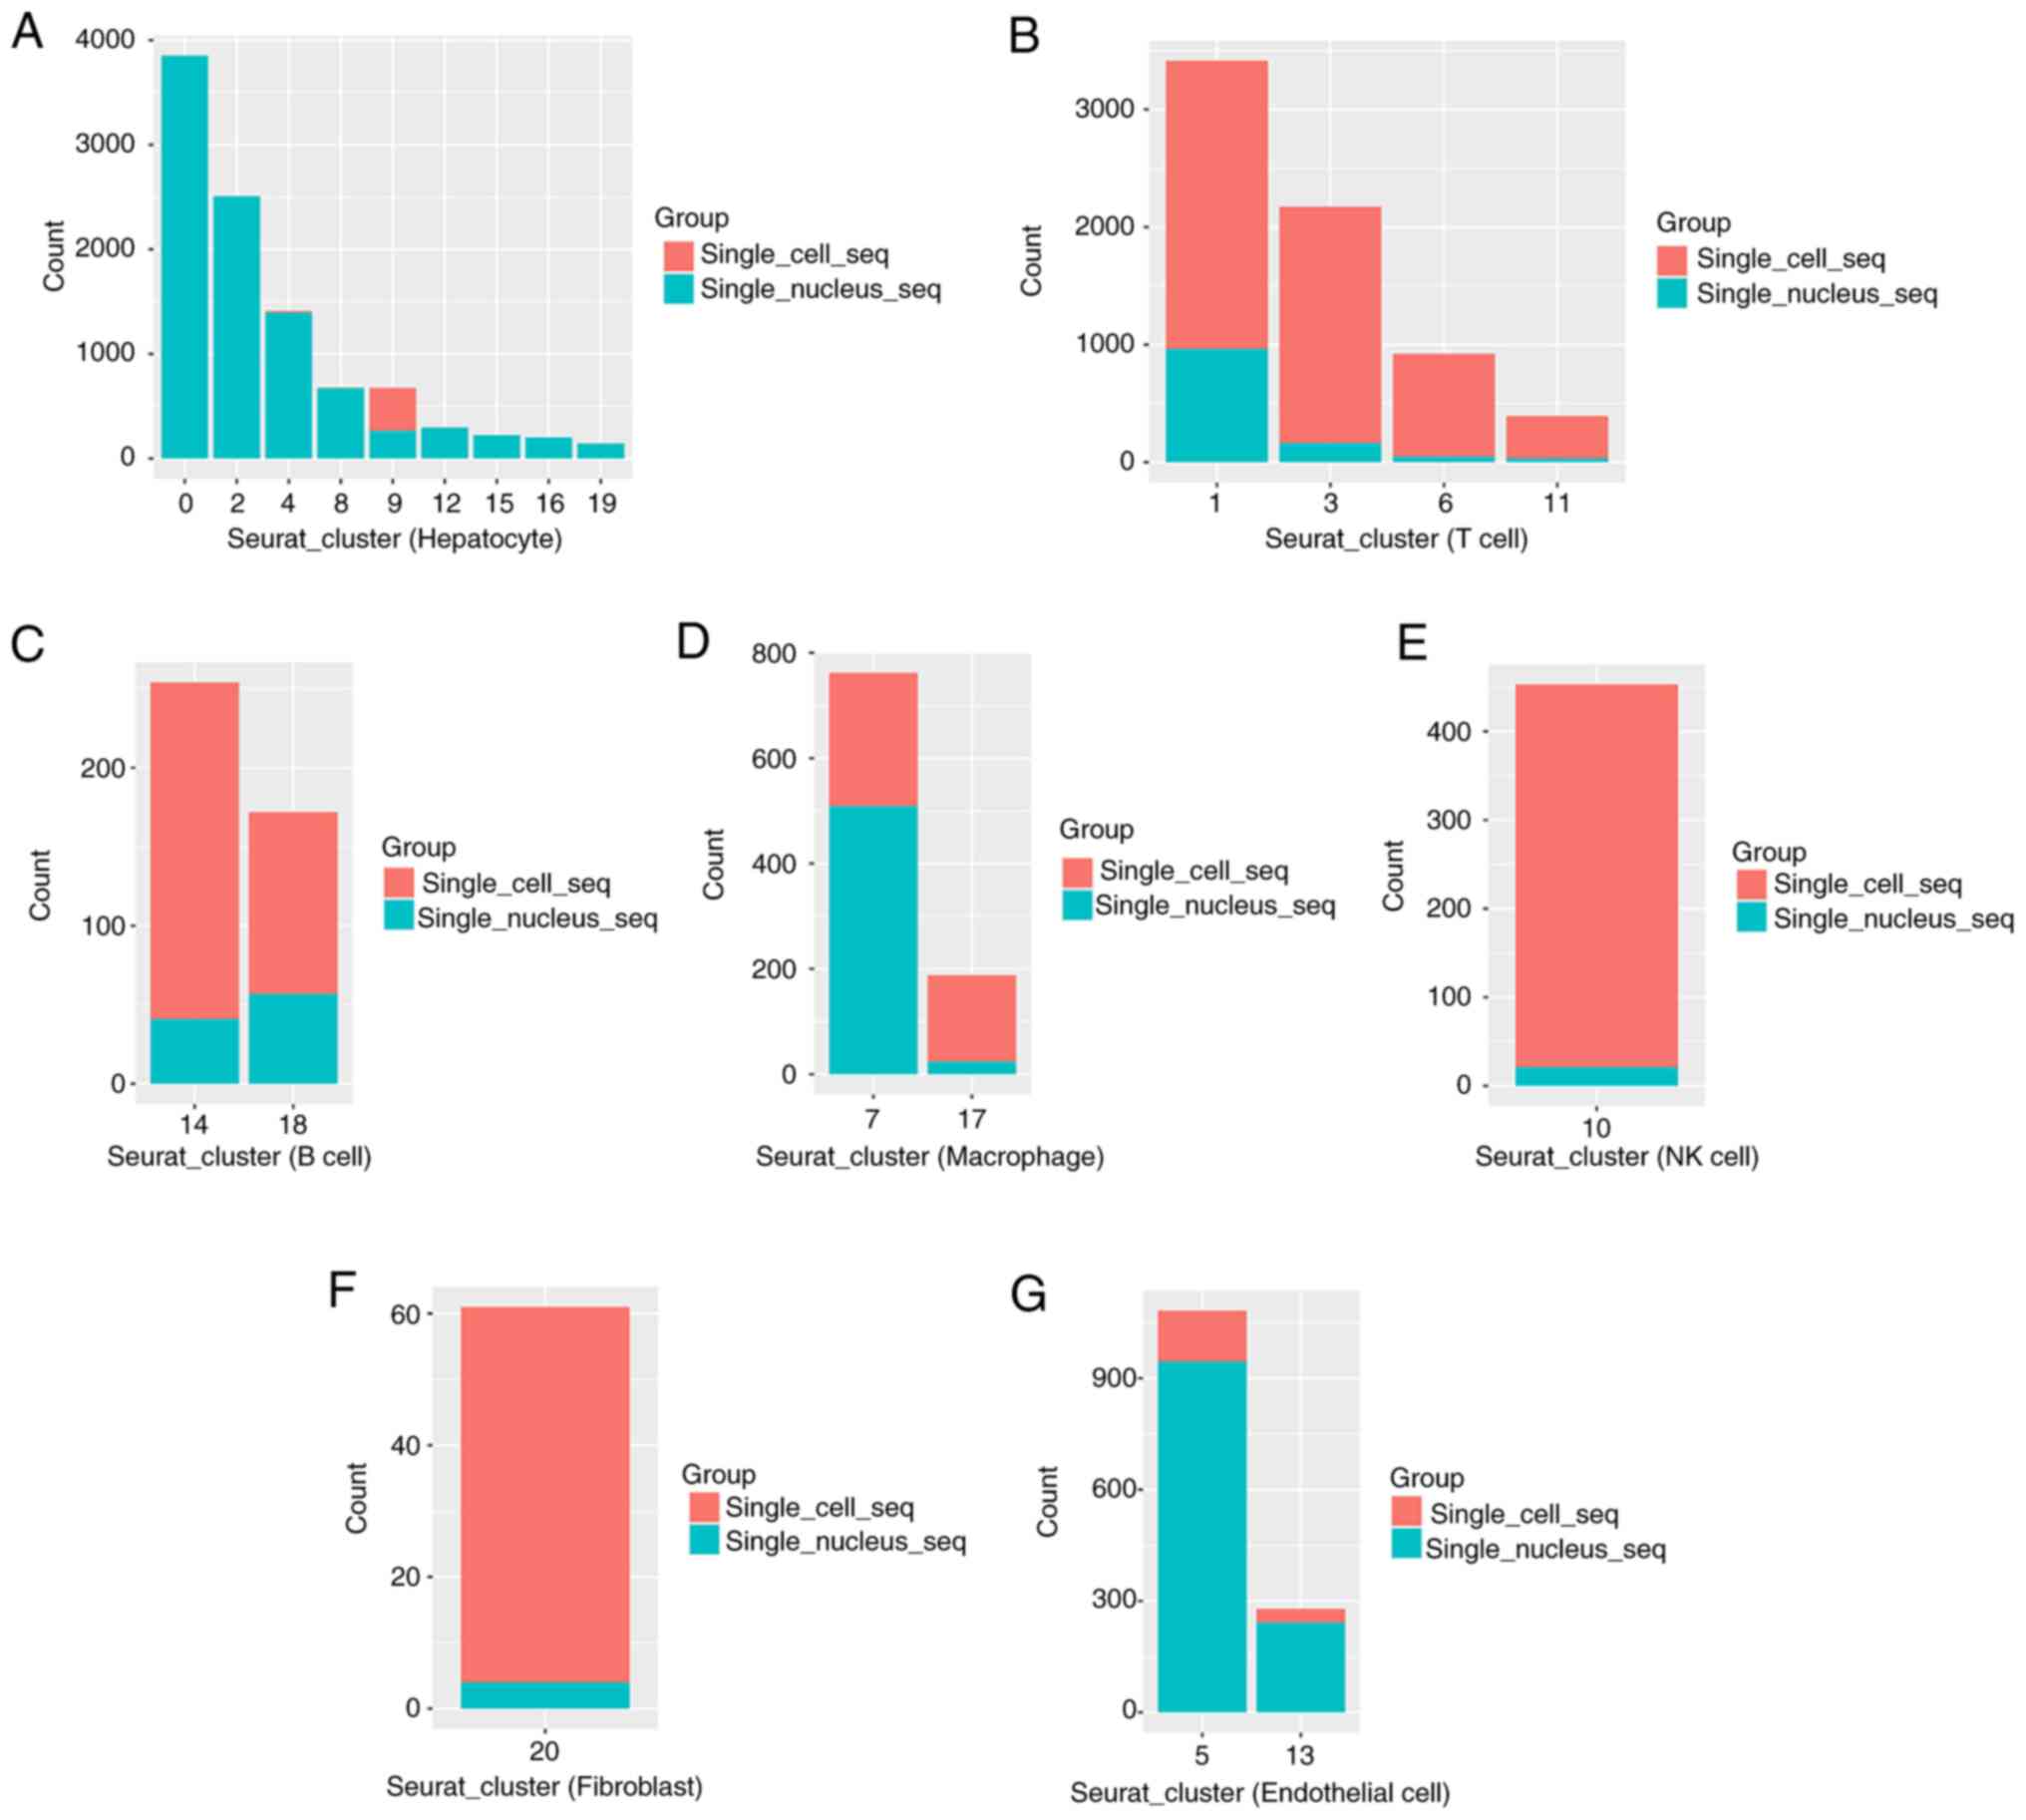
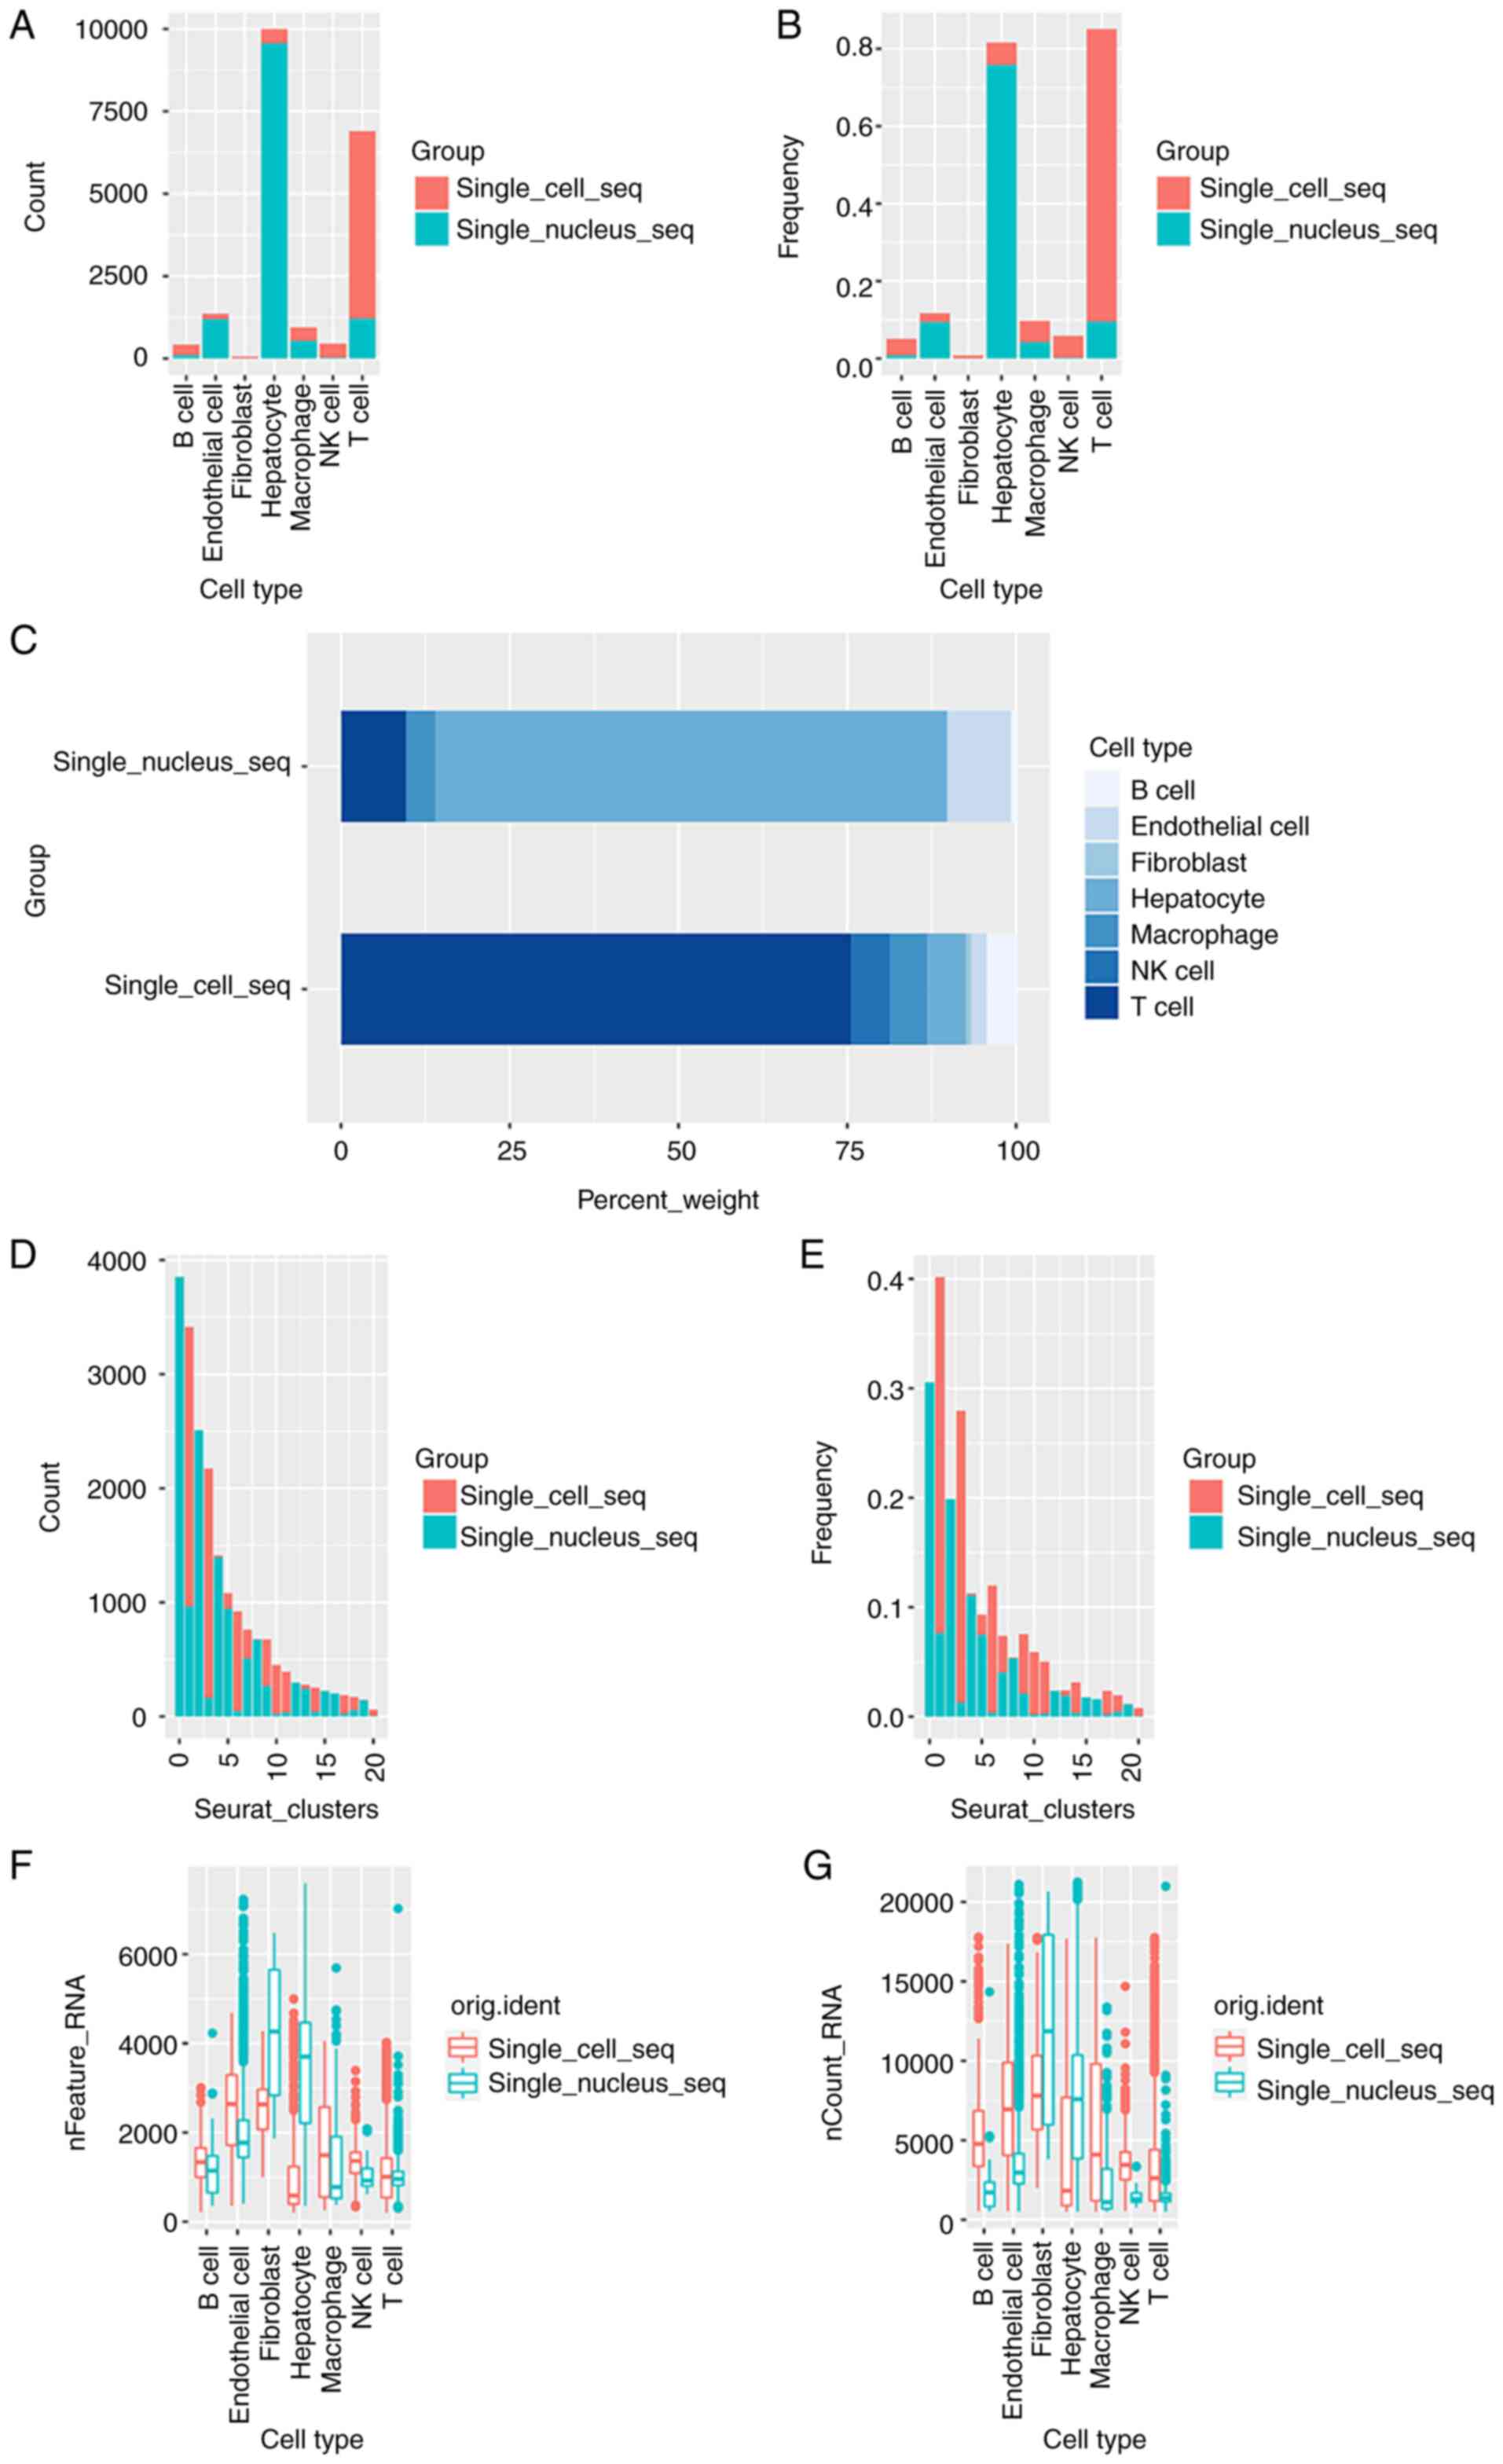 | Figure 2.Comparison of cell types and cell
numbers identified using scRNA-seq and snRNA-seq. (A) Barplot of
numbers of T cells, macrophages/monocytes, B cells, NK cells,
endothelial cells, hepatocytes and fibroblasts identified using
scRNA-seq and snRNA-seq. (B) Barplot of proportions of T cells,
macrophages/monocytes, B cells, NK cells, endothelial cells,
hepatocytes and fibroblasts identified using scRNA-seq and
snRNA-seq. (C) Barplot of cell compositions identified using
scRNA-seq and snRNA-seq. (D) Barplot of numbers of 0-20 clusters
identified using scRNA-seq and snRNA-seq. (E) Barplot of
proportions of 0-20 clusters identified using scRNA-seq and
snRNA-seq. (F) Barplot of nFeatures of T cells,
macrophages/monocytes, B cells, NK cells, endothelial cells,
hepatocytes and fibroblasts identified using scRNA-seq and
snRNA-seq. (G) Barplot of nCount of T cells, macrophages/monocytes,
B cells, NK cells, endothelial cells, hepatocytes and fibroblasts
identified using scRNA-seq and snRNA-seq. snRNA-seq, single-nucleus
RNA sequencing; scRNA-seq, single-cell RNA sequencing; NK, natural
killer. |
SnRNA-seq identified a higher number of genes
(nCount and nFeature) in hepatocytes and fibroblasts (Tables II and III; Fig.
2F and G). In the hepatocyte population, 1,089.046 genes (mean
nFeature) were identified using scRNA-seq, and 3,361.830 genes were
identified using snRNAseq (4,634.638 vs. 7,479.514 mean nCount). In
the fibroblast subpopulation, 2,621.561 genes were identified using
scRNA-seq, and 4,219.500 genes were identified using snRNAseq
(8,661.491 vs. 12,047.000 mean nCount). Notably, other cell type
clusters demonstrated a different trend. For example, in the T cell
subpopulation, 1,061.945 genes were identified using scRNA-seq, and
1,015.813 genes were identified using snRNAseq (3,121.749 vs.
1,524.906 mean nCount).
| Table II.Number of counts of each cell type
using different sequencing methods. |
Table II.
Number of counts of each cell type
using different sequencing methods.
| A,
Single_cell_seq |
|---|
|
|---|
| Cell type | nCount_RNA
(mean) |
|---|
| B cell | 5,615.354 |
| Endothelial
cell | 7,232.253 |
| Fibroblast | 8,661.491 |
| Hepatocyte | 4,634.638 |
| Macrophage | 5,799.175 |
| NK cell | 3,581.912 |
| T cell | 3,121.749 |
|
| B,
Single_nucleus_seq |
|
| Cell
type | nCount_RNA
(mean) |
|
| B cell | 1,861.378 |
| Endothelial
cell | 4,152.666 |
| Fibroblast | 12,047.000 |
| Hepatocyte | 7,479.514 |
| Macrophage | 2,213.186 |
| NK cell | 1,509.762 |
| T cell | 1,524.906 |
| Table III.Number of genes in each cell type
using different sequencing methods. |
Table III.
Number of genes in each cell type
using different sequencing methods.
| A,
Single_cell_seq |
|---|
|
|---|
| Cell type | nFeature_RNA
(mean) |
|---|
| B cell | 1,338.933 |
| Endothelial
cell | 2,511.374 |
| Fibroblast | 2,621.561 |
| Hepatocyte | 1,089.046 |
| Macrophage | 1,618.307 |
| NK cell | 1,336.354 |
| T cell | 1,061.945 |
|
| B,
Single_nucleus_seq |
|
| Cell
type | nFeature_RNA
(mean) |
|
| B cell | 1,154.816 |
| Endothelial
cell | 2,160.562 |
| Fibroblast | 4,219.500 |
| Hepatocyte | 3,361.830 |
| Macrophage | 1,248.745 |
| NK cell | 1,056.952 |
| T cell | 1,015.813 |
Hepatocyte cluster analysis
A total of 9,999 hepatocytes were obtained,
composing of clusters 0, 2, 4, 8, 9, 12, 15, 16 and 19. Overall,
the snRNA-seq data contained the majority of cells (n=9,563) in the
hepatocyte clusters, while the scRNA-seq data contained only part
of the hepatocytes (n=436) in cluster 9 (Fig. 2D and E; Fig. 3A; Table SI).
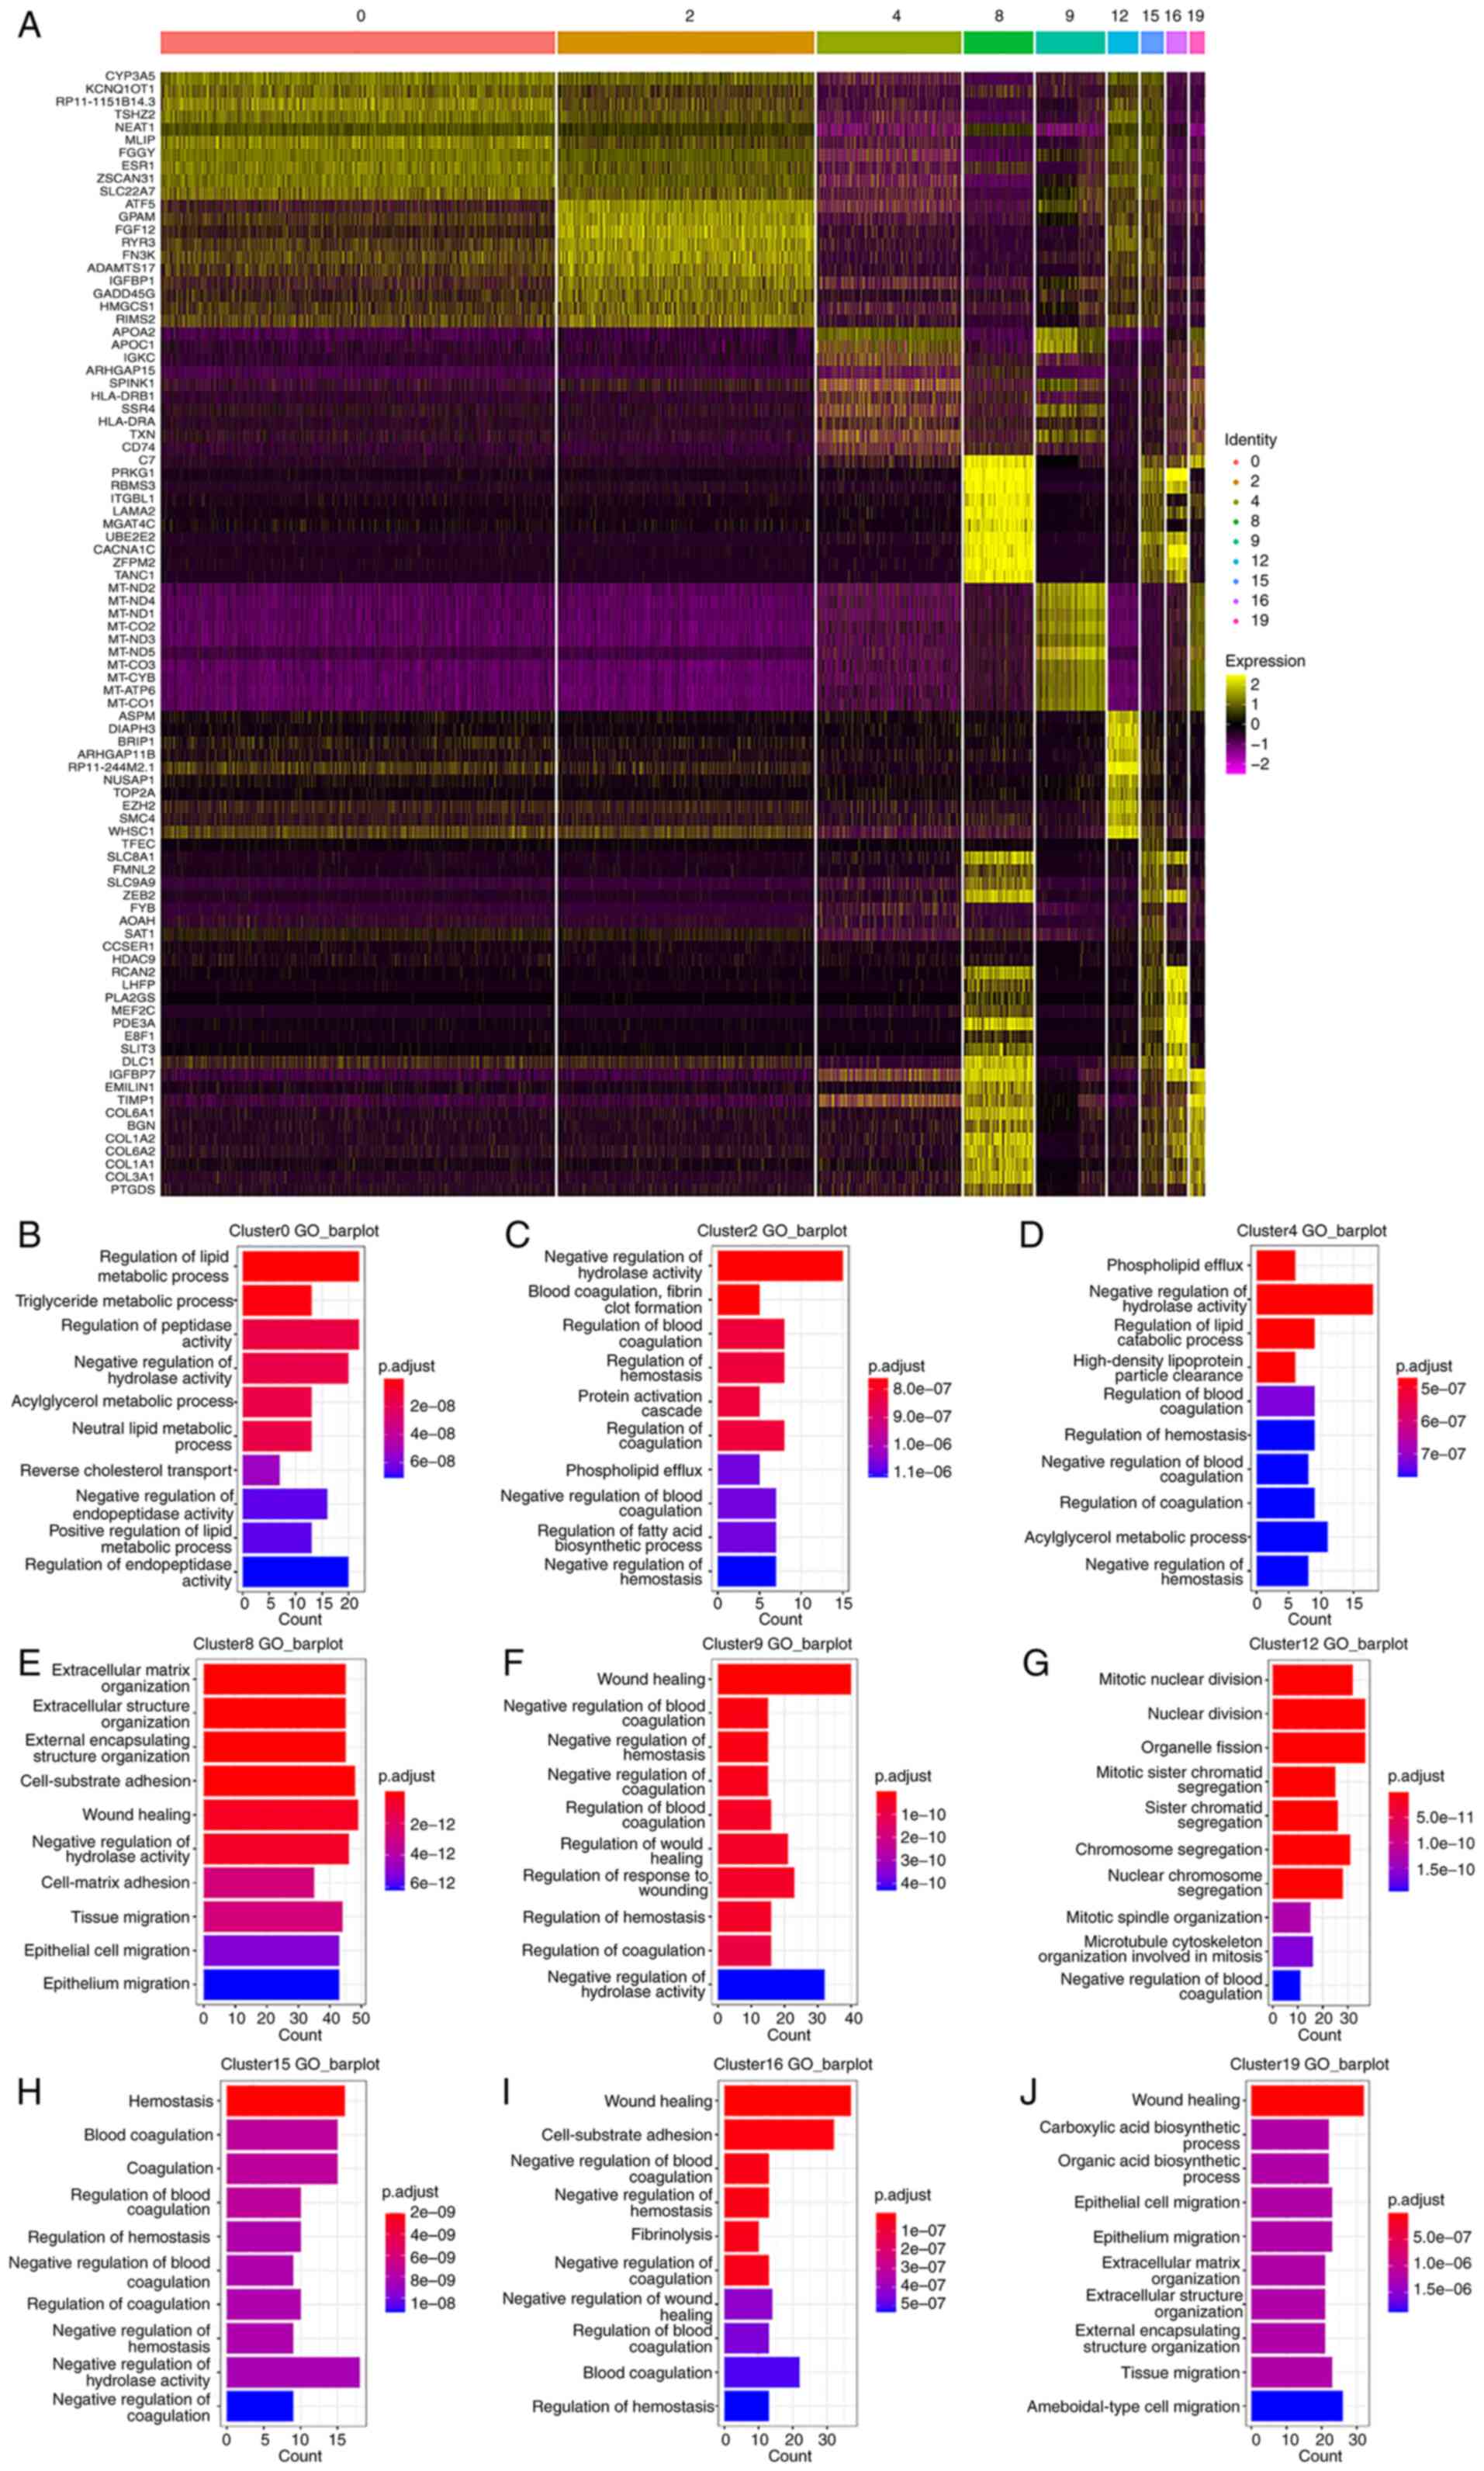
Results presented in Fig. 4A demonstrated the differentially
expressed genes in the hepatocyte clusters, and the top 20 genes
are displayed in the heatmap. GO enrichment (biological process)
results presented in Fig. 4B-J
demonstrated the differentially expressed genes in the hepatocyte
clusters. By combining the differential gene expression and GO
enrichment analysis results, the function of each hepatocyte was
analyzed in the subpopulation.
Cluster 0 exhibited differential expression of
CYP3A5, MLIP and ESR1, and ‘regulation of lipid metabolic process’
and ‘triglyceride metabolic process’ were identified as the
enriched terms in GO analysis (Fig.
4B). Cluster 2 exhibited high expression of ATF5, GPAM and
FGF12, and the enriched terms were mainly associated with ‘negative
regulation of hydrolase activity’ and ‘blood coagulation, fibroclot
formation’ (Fig. 4C). Cluster 4
was marked by APOA2 and APOC1, and ‘regulation of lipid catabolic
process’ was enriched (Fig. 4D).
Cluster 8 exhibited high expression of extracellular matrix-related
proteins, such as PRKG1, RBMS3 and ITGBL1, suggesting a function in
matrix remodeling and cell migration (Fig. 4E). Cluster 9 exhibited
differential expression of MT-ND2, MT-ND4 and MT-ND1, and ‘negative
regulation of blood coagulation’ and ‘negative regulation of
haemostasis’ were identified as the enriched terms in GO analysis
(Fig. 4F). Cluster 12 was marked
by ASPM, DIAPH3 and BRIP1, and cell proliferation-related pathways,
including ‘mitotic nuclear division’ and ‘mitotic sister chromatid
segregation’ were enriched (Fig.
4G).
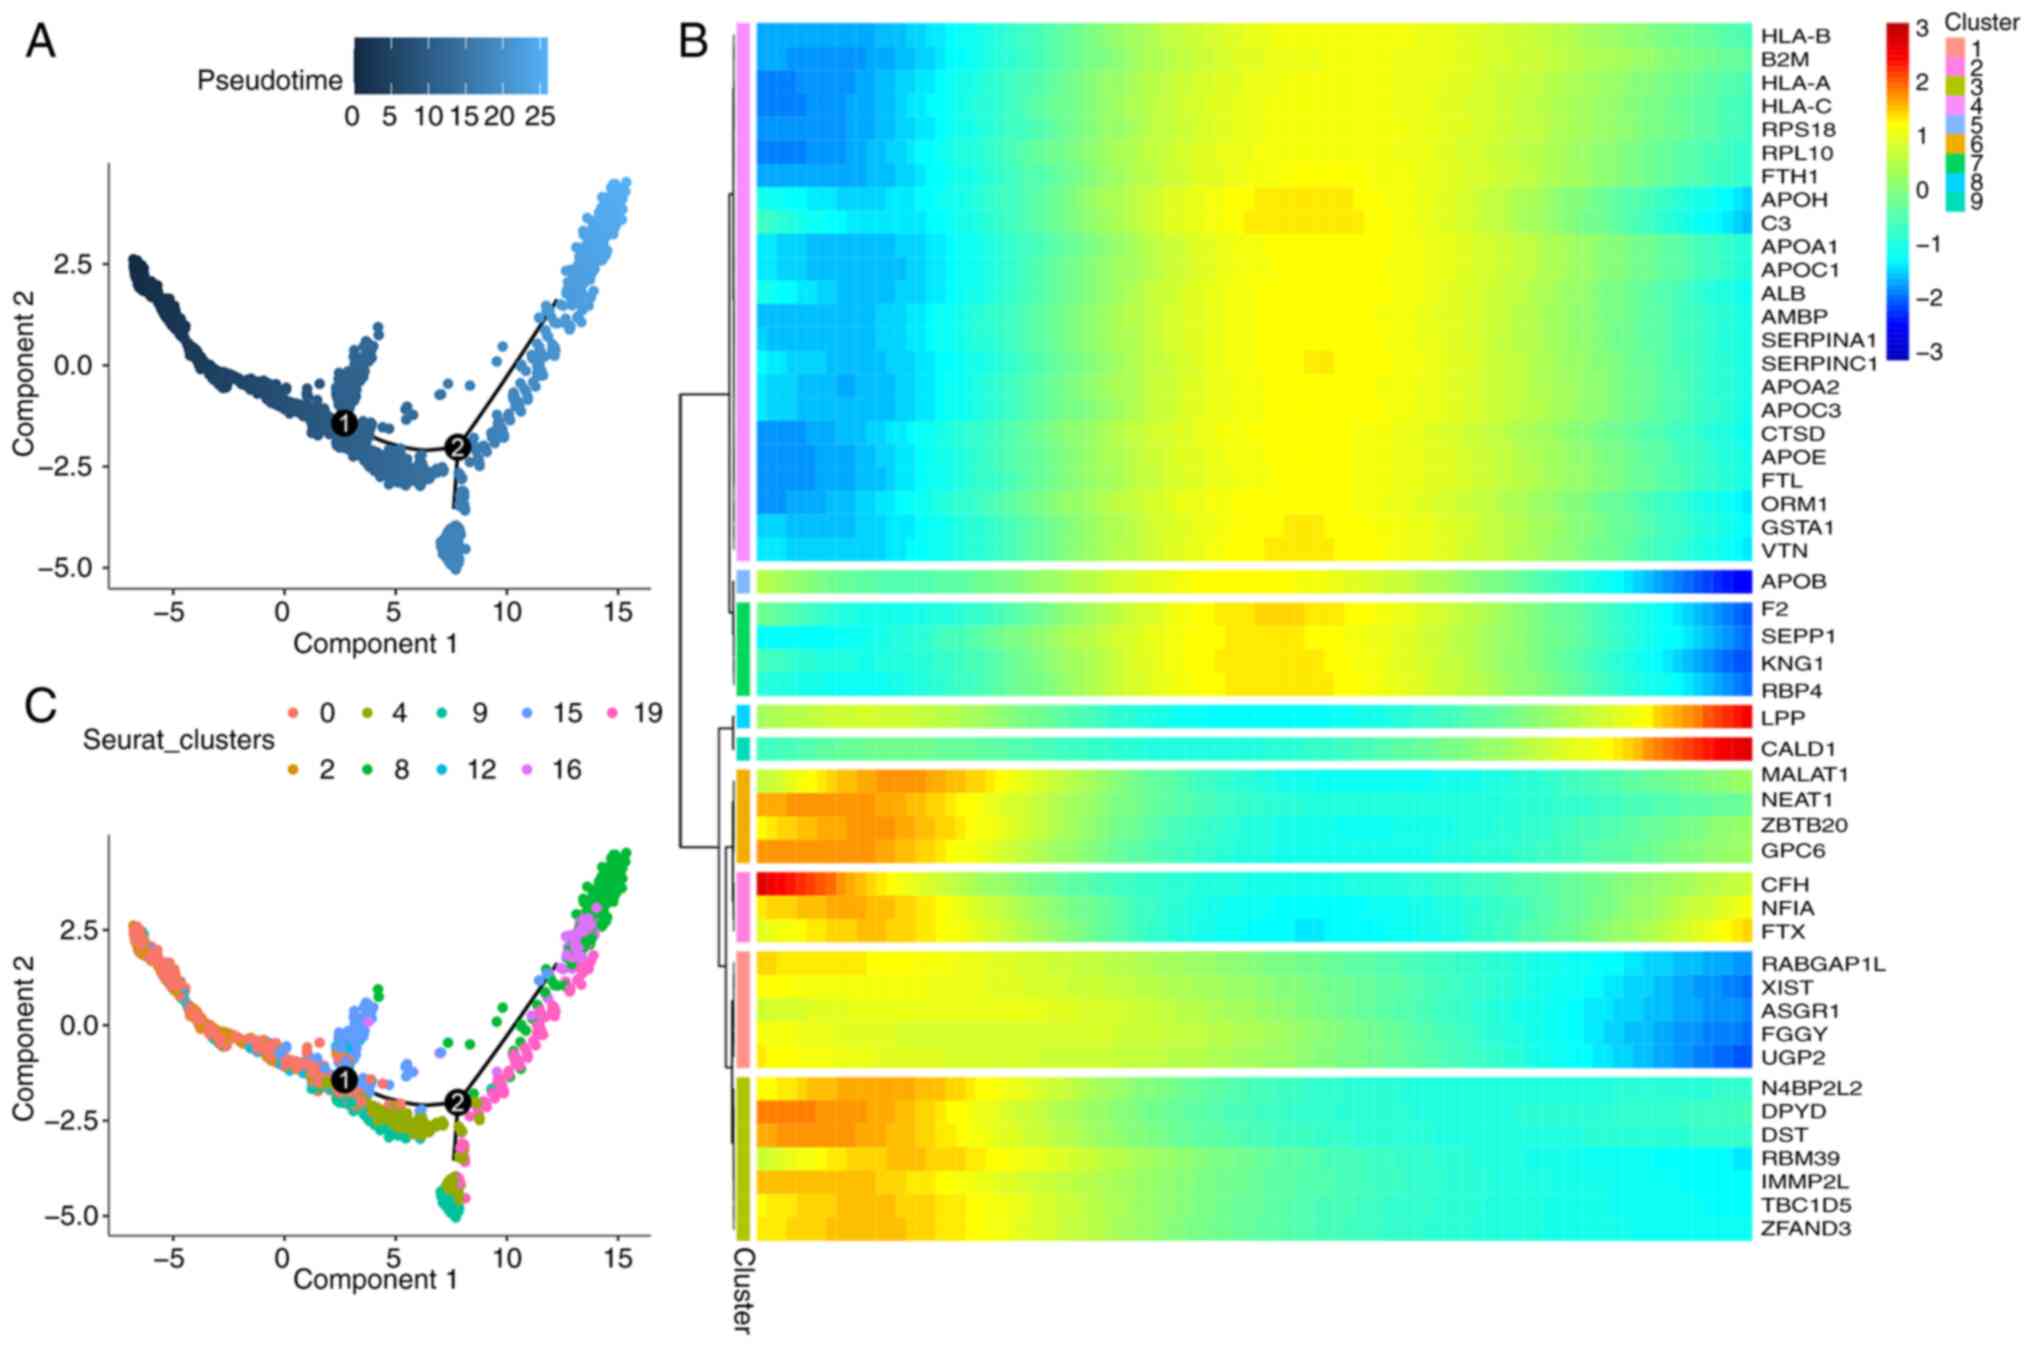
To analyze the temporal dynamics of hepatocyte
differentiation, single cells were rearranged into a
pseudo-timeline using Monocle2, and the results of the analysis are
presented in Fig. 5. Results of
the present study demonstrated the differentiation status of
hepatocytes (Fig. 5A), and the
distribution of different clusters was concentrated (Fig. 5C). The differential expression of
cells in different states of differentiation were analyzed, and
genes with increased expression levels are demonstrated in heatmaps
(Fig. 5B).
In summary, snRNA-seq retained multiple
heterogeneous hepatocyte subpopulations, whereas scRNA-seq only
retained a single subpopulation (Cluster 9), suggesting that this
subpopulation may be insensitive to the digestion step prior to
scRNA-seq and is easy to retain. SnRNA-seq possesses notable
advantages in maintaining the heterogeneity of tumor cells in HCC
tissues.
T cell cluster analysis
T cells were the largest subset of immune cells, and
there were significant differences between the two sequencing
methods; thus, a detailed analysis was conducted.
A total of 6,904 T cells were obtained, including
clusters 1, 3, 6 and 11. The scRNA-seq data contained most of the
cells in clusters 1, 3, 6 and 11, while the snRNA-seq data only
contained part of the Cluster 1 cells (Figs. 2D and E and 3B).
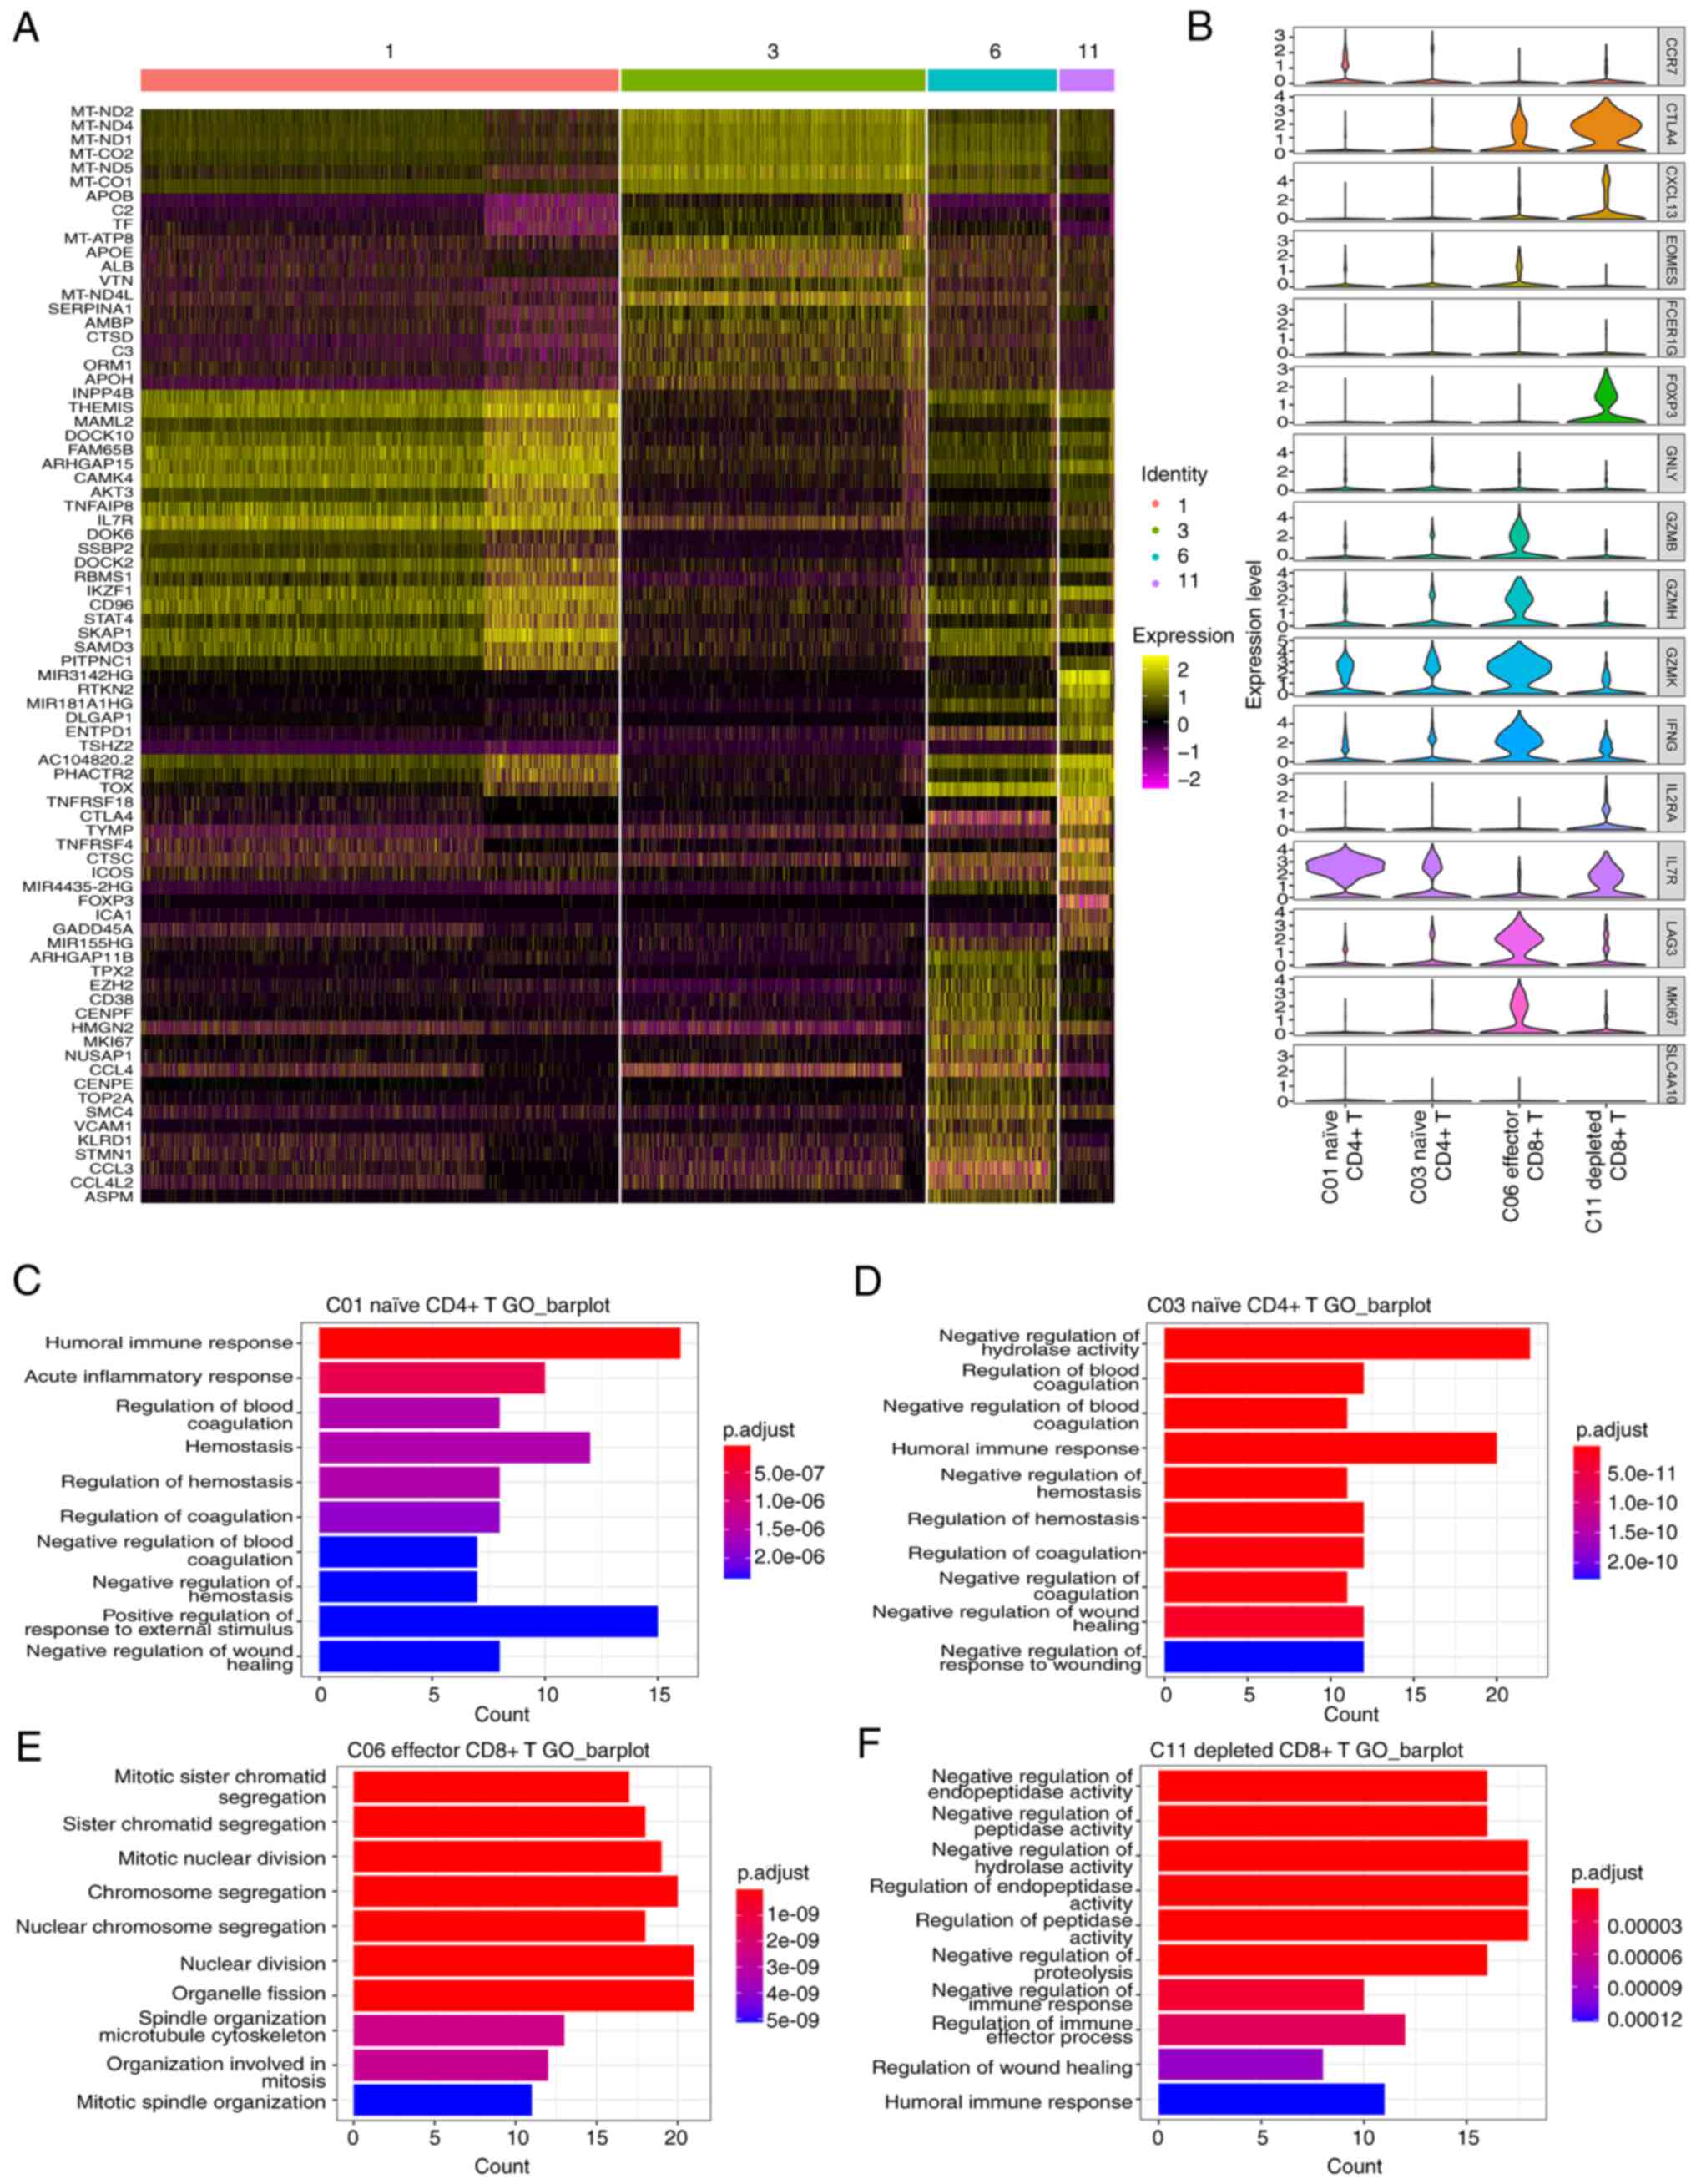
The results displayed in Fig. 6A demonstrate the differentially
expressed genes in the T cell clusters, and the top 20 genes are
displayed in the heatmap. Fig. 6B
demonstrates the marker genes of the four T cell clusters. Fig. 6C-F demonstrates the GO enrichment
(biological process) results for the differentially expressed genes
in the T cell clusters. By combining the differential gene
expression and GO enrichment analysis results, the function of each
T cell cluster was analyzed.
Cluster 1 exhibited differential expression of
INPP4B, THEMIS and CCR7, and ‘regulation of humoral immune
response’ was identified as the enriched term in the GO analysis
(Fig. 6C); thus, these cells were
classified as naïve CD4+ T cells. Cluster 3 exhibited
differential expression of mitochondrially encoded MT-ND1, MT-ND2
and MT-ND4, and ‘negative regulation of blood coagulation’ was
identified as the enriched term in the GO analysis (Fig. 6D). Cluster 6 exhibited
differential expression of TPX2, EZH2, GZMB and ‘mitotic sister
chromatid segregation’ and ‘sister chromatid segregation’ were
identified as the enriched terms in the GO analysis; thus, these
cells were classified as effector CD8+ T cells (Fig. 6E). Cluster 11 exhibited the
differential expression of CTLA4, DLGAP1 and TNFRSF18, and
‘negative regulation of endopeptidase activity’ and ‘negative
regulation of peptidase activity’ were identified as the enriched
terms in the GO analysis (Fig.
6F); thus, these cells were classified as depleted
CD8+ T cells. Overall, these results indicated that
cluster 1 is associated with immune regulation, cluster 3 is
associated with coagulation, cluster 6 is associated with cell
division and cluster 11 is associated with regulation of enzyme
activity.
By comparison, results of the present study
demonstrated that scRNA-seq retains multiple heterogeneous T cell
subsets, while snRNA-seq retains only a single subset (cluster 1).
These results suggested that scRNA-seq exhibits notable advantages
in maintaining the heterogeneity of immune cells, particularly T
cells.
The interaction between hepatocytes
and T cells (ligand-receptor interactions)
T cells primarily act as tumor-infiltrating
lymphocytes, and their interactions with tumor cells have received
extensive attention. Thus, a comparative analysis was carried out
in the present study (Table
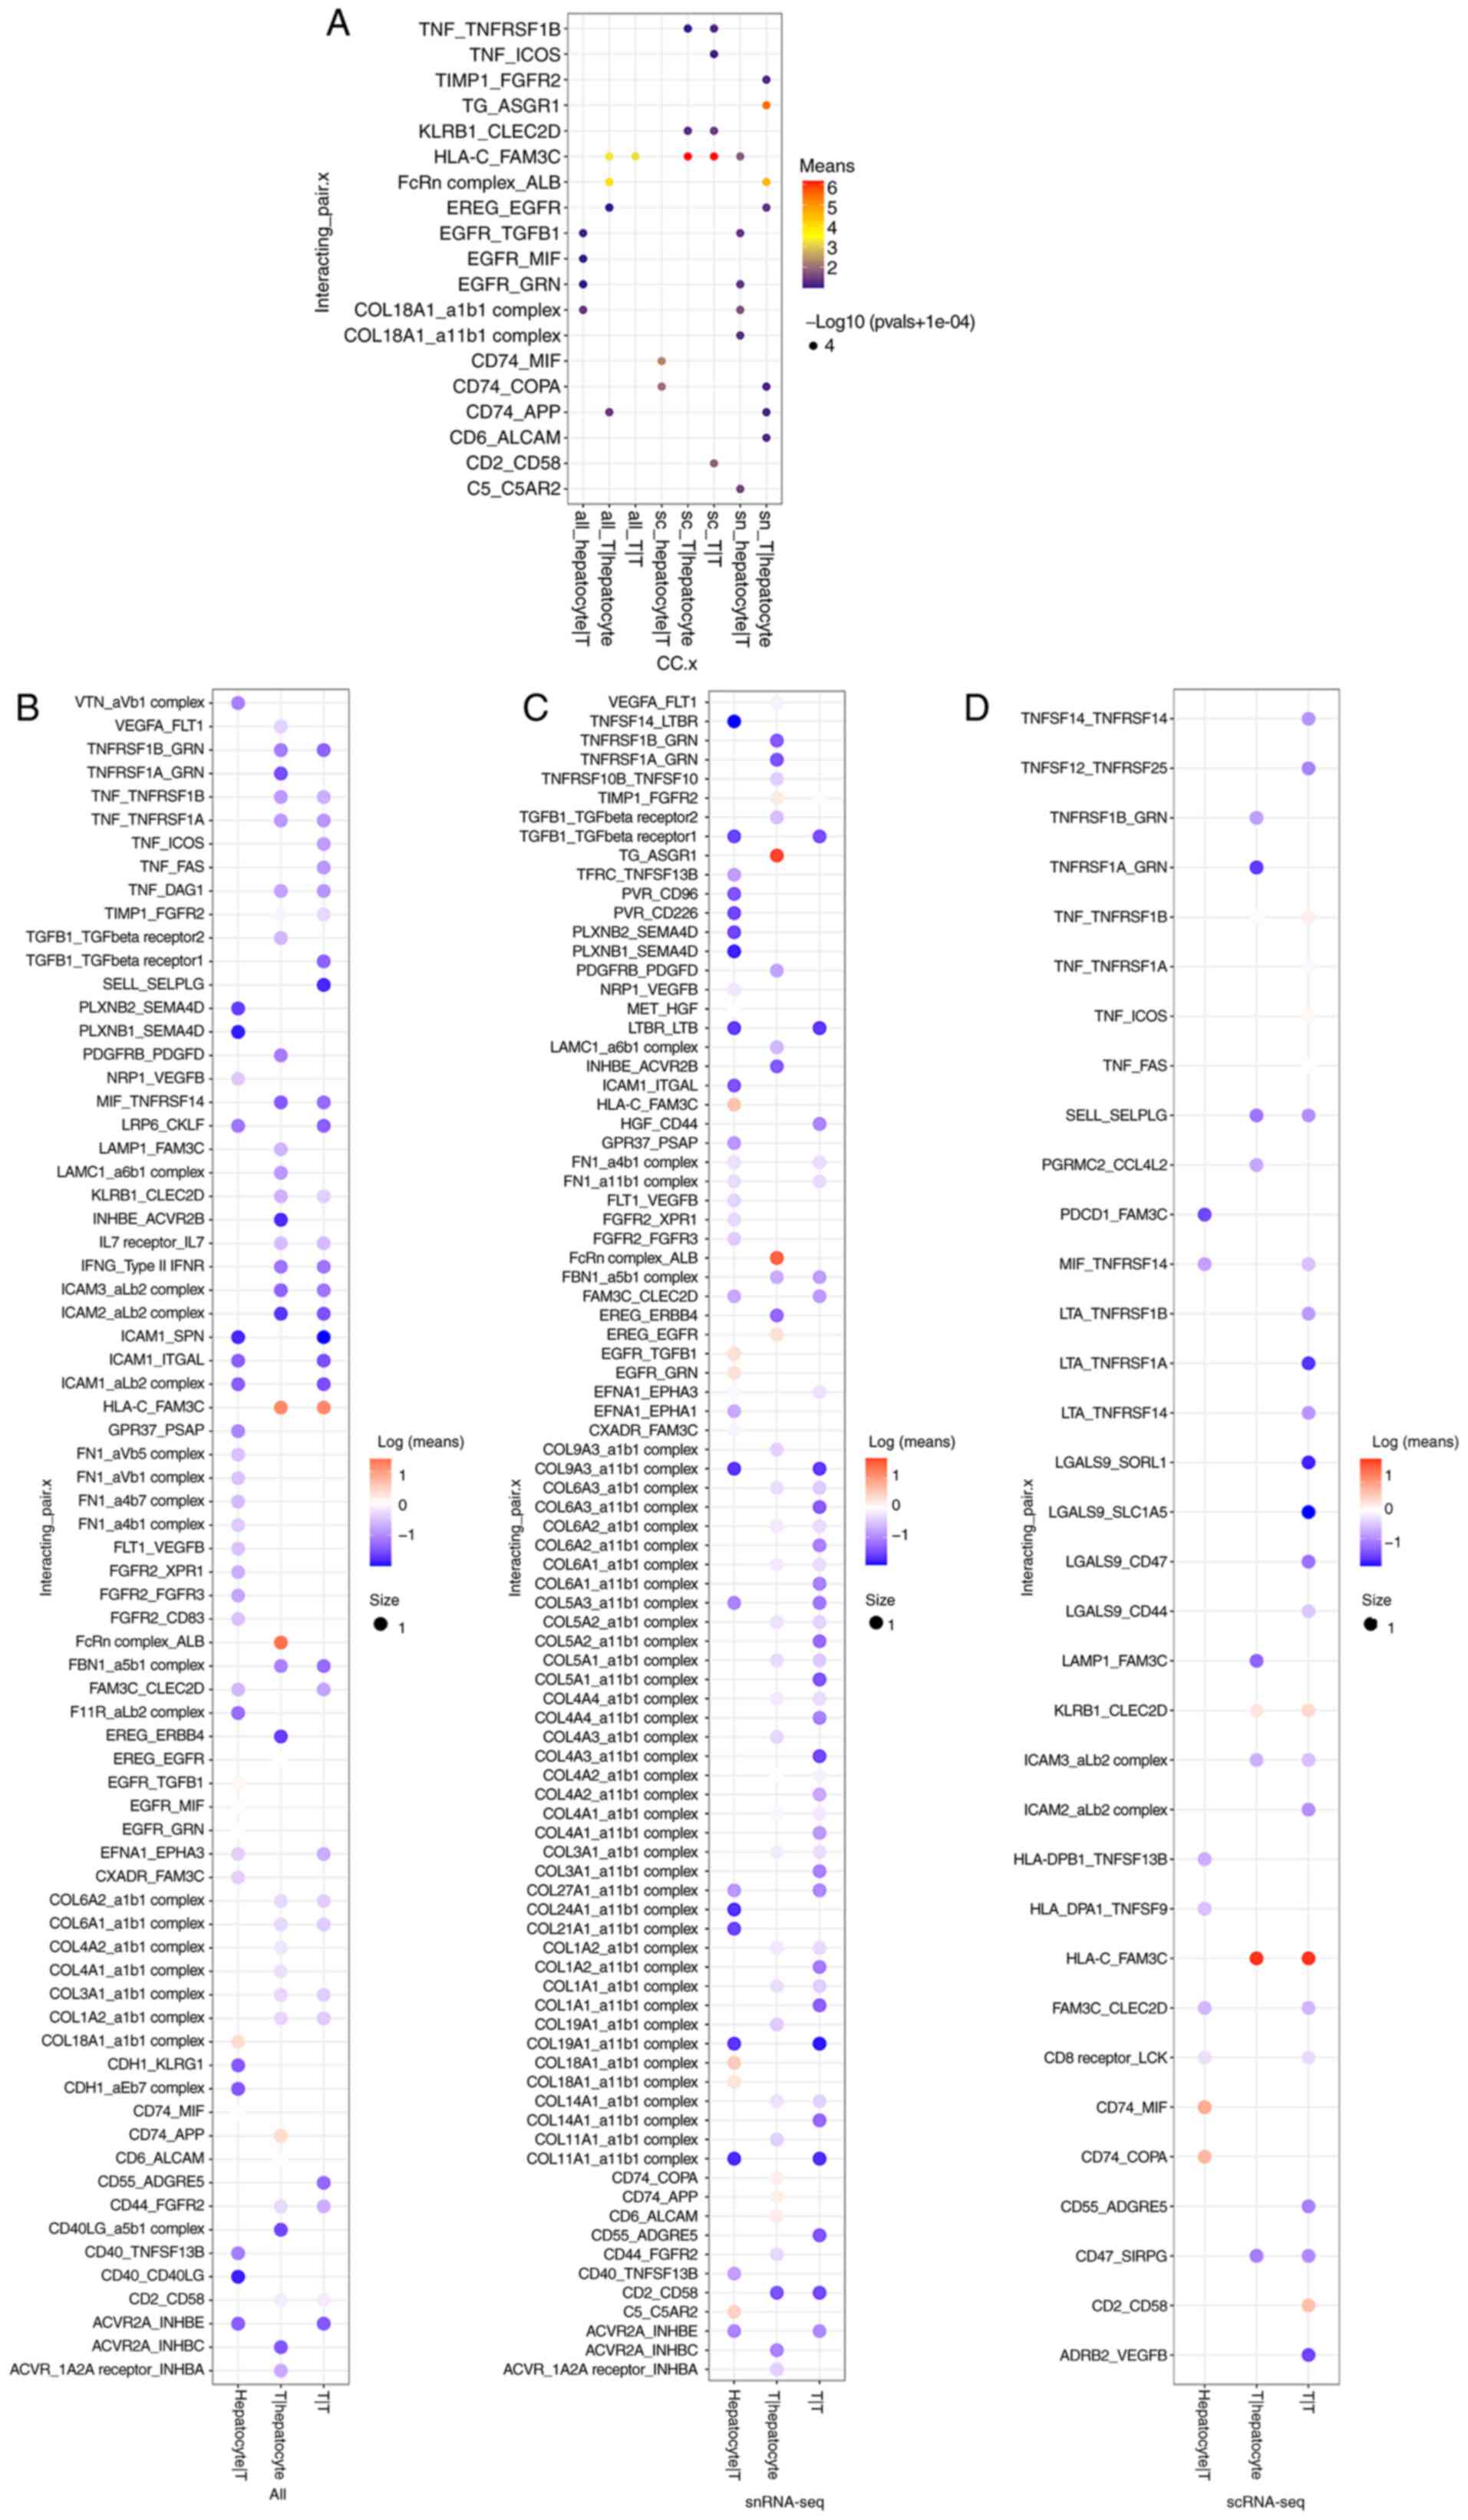
SIII, Fig. 7). The results
demonstrated that snRNA-seq identified a higher number of
ligand-receptor interactions (snRNA-seq, 115; combination, 98;
scRNA-seq, 43) between hepatocytes and T cells than the combination
or single-cell analyses (Fig.
7B-D). In addition, snRNA-seq identified a similar number of
‘ligand-receptor interactions’ between hepatocytes and T cells
during the combined analysis, (Fig.
7B-D) which may be associated with the low number of
hepatocytes covered by scRNA-seq.
Moreover, the results displayed in Fig. 7A demonstrate the interactions
following further screening with a mean >1. Results of the
present study demonstrated that T-T interaction was not detected
using snRNA-seq (mean >1). Although snRNA-seq enriched a higher
number of interactions, results obtained from the scRNA-seq may be
more reliable.
Discussion
ScRNA-seq provides an advanced approach to the study
of tumor cell heterogeneity and microenvironment. In the present
study, the application of scRNA-seq and snRNA-seq methods in HCC
were analyzed, providing a novel reference for understanding the
application scope and selection of different sequencing
methods.
Cells identified using snRNA-seq were mainly
hepatocytes and fibroblasts, while the cells identified using
scRNA-seq were mainly immune cells. This difference may result from
the depletion of hepatocytes during the sorting phase of scRNA-seq,
while immune cells are free and less likely to be subject to
depletion. This result is also associated with the difference in
sample processing (12). In the
dissociation process of single-cell sequencing samples, different
cell types exhibit different dissociation efficiencies (23,24). Compared with immune cells,
epithelial cells are more embedded in the extracellular matrix, so
they are more difficult to decompose.
Results of the present study demonstrated that
scRNA-seq identified a low number of hepatocytes, which differed to
the results obtained from previous studies (25,26). This may be due to HCC exhibiting a
large organizational heterogeneity (27). Certain HCC tissues contain a high
number of HCC cells, while others contain an increased number of
non-parenchymal cells, such as fibroblasts (27,28). HCC develops from hepatitis B
cirrhosis, when liver tissue contains a lot of fiber and the number
of liver cells is reduced (29).
Moreover, cirrhosis makes tissue digestion difficult and
time-consuming; thus, liver cell activity decreases. On this basis,
cell screening conditions (mitochondrial ratio <20%) caused more
liver cell information to be deleted. In addition, in western
countries, HCC is often due to alcoholic liver disease or
non-alcoholic fatty liver disease (30), which differs from hepatitis
B-related HCC. Therefore, the number of hepatocytes identified by
scRNA-seq will differ. This further indicates that snRNA-seq may
produce improved results for HCC associated with hepatitis B
cirrhosis than scRNA-seq.
Epithelial cells in HCC tissue possess a high
heterogeneity, which is an important factor affecting the course of
disease and the corresponding therapeutic effects. Results of the
present snRNA-seq analysis revealed that there are numerous
different cell types in the tumor epithelium in HCC, which may play
different roles in the progression of HCC. However, results
obtained from the scRNA-seq analysis consisted of only a small
number of cells in a subpopulation. These results suggested that
nuclear sequencing exhibits an improved application value in the
study of tumor epithelial heterogeneity.
A large number of diverse immune cells, including T
cells, macrophages/monocytes, B cells and NK cells, were identified
using scRNA-seq. The T cell population included different
subgroups: Naïve CD4+ T cells, effector CD8+
T cells and depleted CD8+ T cells. Notably, similar
results were obtained during kidney studies (10). These results suggested that
scRNA-seq exhibits an improved application value compared with
snRNA-seq in the study of the tumor immune microenvironment.
The present study aimed to compare the differences
between scRNA-seq and snRNA-seq methods in liver tissue, which may
provide a novel theoretical basis for the selection of sequencing
methods. In conclusion, the two sequencing methods may be used in
combination to include both immune and epithelial cells.
Supplementary Material
Supporting Data
Supporting Data
Supporting Data
Acknowledgements
Not applicable.
Funding
The present study was supported by the Qingdao Outstanding
Health Professional Development Fund.
Availability of data and materials
The datasets used and analyzed during the current
study are available from the GEO database (accession no.
GSE210679).
Authors' contributions
HXQ and LX designed the experiments. FW and XJT
performed the experiments and sample collection. FW conducted the
bioinformatics analysis. HXQ, LX and FW confirm the authenticity of
all the data. FW drafted the work manuscript. HXQ, LX and XJT
revised the manuscript critically for important intellectual
content. All authors read and approved the final manuscript.
Ethics approval and consent to
participate
The present study was approved (approval no.
2021016) by the Ethics Committee of Qingdao Municipal Hospital
(Qingdao, China). Informed consent was obtained from the
patient.
Patient consent for publication
Informed consent was obtained from the patient.
Competing interests
The authors declare that they have no competing
interests.
References
|
1
|
Slyper M, Porter CBM, Ashenberg O, Waldman
J, Drokhlyansky E, Wakiro I, Smillie C, Smith-Rosario G, Wu J,
Dionne D, et al: A single-cell and single-nucleus RNA-Seq toolbox
for fresh and frozen human tumors. Nat Med. 26:792–802. 2020.
View Article : Google Scholar : PubMed/NCBI
|
|
2
|
Xu L and Li C: Single-Cell transcriptome
analysis reveals the M2 macrophages and exhausted T cells and
intratumoral heterogeneity in triple-negative breast cancer.
Anticancer Agents Med Chem. 22:294–312. 2022. View Article : Google Scholar : PubMed/NCBI
|
|
3
|
Wang Q, Wang Z, Zhang Z, Zhang W, Zhang M,
Shen Z, Ye Y, Jiang K and Wang S: Landscape of cell heterogeneity
and evolutionary trajectory in ulcerative colitis-associated colon
cancer revealed by single-cell RNA sequencing. Chin J Cancer Res.
33:271–288. 2021. View Article : Google Scholar : PubMed/NCBI
|
|
4
|
Habib N, Avraham-Davidi I, Basu A, Burks
T, Shekhar K, Hofree M, Choudhury SR, Aguet F, Gelfand E, Ardlie K,
et al: Massively parallel single-nucleus RNA-seq with DroNc-seq.
Nat Methods. 14:955–958. 2017. View Article : Google Scholar : PubMed/NCBI
|
|
5
|
Van Hauwaert EL, Gammelmark E, Sarvari AK,
Larsen L, Nielsen R, Madsen JGS and Mandrup S: Isolation of nuclei
from mouse white adipose tissues for single-nucleus genomics. STAR
Protoc. 2:1006122021. View Article : Google Scholar : PubMed/NCBI
|
|
6
|
Basile G, Kahraman S, Dirice E, Pan H,
Dreyfuss JM and Kulkarni RN: Using single-nucleus RNA-sequencing to
interrogate transcriptomic profiles of archived human pancreatic
islets. Genome Med. 13:1282021. View Article : Google Scholar : PubMed/NCBI
|
|
7
|
Fullard JF, Lee HC, Voloudakis G, Suo S,
Javidfar B, Shao Z, Peter C, Zhang W, Jiang S, Corvelo A, et al:
Single-nucleus transcriptome analysis of human brain immune
response in patients with severe COVID-19. Genome Med. 13:1182021.
View Article : Google Scholar : PubMed/NCBI
|
|
8
|
Maitra M, Nagy C, Chawla A, Wang YC,
Nascimento C, Suderman M, Théroux JF, Mechawar N, Ragoussis J and
Turecki G: Extraction of nuclei from archived postmortem tissues
for single-nucleus sequencing applications. Nat Protoc.
16:2788–2801. 2021. View Article : Google Scholar : PubMed/NCBI
|
|
9
|
Grindberg RV, Yee-Greenbaum JL, McConnell
MJ, Novotny M, O'Shaughnessy AL, Lambert GM, Araúzo-Bravo MJ, Lee
J, Fishman M, Robbins GE, et al: RNA-sequencing from single nuclei.
Proc Natl Acad Sci USA. 110:19802–19807. 2013. View Article : Google Scholar : PubMed/NCBI
|
|
10
|
Wu H, Kirita Y, Donnelly EL and Humphreys
BD: Advantages of single-nucleus over single-cell RNA sequencing of
adult kidney: Rare cell types and novel cell states revealed in
fibrosis. J Am Soc Nephrol. 30:23–32. 2019. View Article : Google Scholar : PubMed/NCBI
|
|
11
|
Lake BB, Codeluppi S, Yung YC, Gao D, Chun
J, Kharchenko PV, Linnarsson S and Zhang K: A comparative strategy
for single-nucleus and single-cell transcriptomes confirms accuracy
in predicted cell-type expression from nuclear RNA. Sci Rep.
7:60312017. View Article : Google Scholar : PubMed/NCBI
|
|
12
|
Ding J, Adiconis X, Simmons SK, Kowalczyk
MS, Hession CC, Marjanovic ND, Hughes TK, Wadsworth MH, Burks T,
Nguyen LT, et al: Systematic comparison of single-cell and
single-nucleus RNA-sequencing methods. Nat Biotechnol. 38:737–746.
2020. View Article : Google Scholar : PubMed/NCBI
|
|
13
|
Zeng W, Jiang S, Kong X, El-Ali N, Ball AR
Jr, Ma CI, Hashimoto N, Yokomori K and Mortazavi A: Single-nucleus
RNA-seq of differentiating human myoblasts reveals the extent of
fate heterogeneity. Nucleic Acids Res. 44:e1582016.PubMed/NCBI
|
|
14
|
Thrupp N, Sala Frigerio C, Wolfs L, Skene
NG, Fattorelli N, Poovathingal S, Fourne Y, Matthews PM, Theys T,
Mancuso R, et al: Single-nucleus RNA-Seq is not suitable for
detection of microglial activation genes in humans. Cell Rep.
32:1081892020. View Article : Google Scholar : PubMed/NCBI
|
|
15
|
Morsey B, Niu M, Dyavar SR, Fletcher CV,
Lamberty BG, Emanuel K, Fangmeier A and Fox HS: Cryopreservation of
microglia enables single-cell RNA sequencing with minimal effects
on disease-related gene expression patterns. iScience.
24:1023572021. View Article : Google Scholar : PubMed/NCBI
|
|
16
|
Yang JD, Hainaut P, Gores GJ, Amadou A,
Plymoth A and Roberts LR: A global view of hepatocellular
carcinoma: Trends, risk, prevention and management. Nat Rev
Gastroenterol Hepatol. 16:589–604. 2019. View Article : Google Scholar : PubMed/NCBI
|
|
17
|
Global Burden of Disease Cancer
Collaboration, . Fitzmaurice C, Allen C, Barber RM, Barregard L,
Bhutta ZA, Brenner H, Dicker DJ, Chimed-Orchir O, Dandona R, et al:
Global, regional, and national cancer incidence, mortality, years
of life lost, years lived with disability, and disability-adjusted
life-years for 32 cancer groups, 1990 to 2015: A systematic
analysis for the global burden of disease study. JAMA Oncol.
3:524–548. 2017. View Article : Google Scholar : PubMed/NCBI
|
|
18
|
Heinrich B, Gertz EM, Schäffer AA, Craig
A, Ruf B, Subramanyam V, McVey JC, Diggs LP, Heinrich S, Rosato U,
et al: The tumour microenvironment shapes innate lymphoid cells in
patients with hepatocellular carcinoma. Gut. 71:1161–1175. 2022.
View Article : Google Scholar : PubMed/NCBI
|
|
19
|
Payen VL, Lavergne A, Alevra Sarika N,
Colonval M, Karim L, Deckers M, Najimi M, Coppieters W, Charloteaux
B, Sokal EM and El Taghdouini A: Single-cell RNA sequencing of
human liver reveals hepatic stellate cell heterogeneity. JHEP Rep.
3:1002782021. View Article : Google Scholar : PubMed/NCBI
|
|
20
|
Saviano A, Henderson NC and Baumert TF:
Single-cell genomics and spatial transcriptomics: Discovery of
novel cell states and cellular interactions in liver physiology and
disease biology. J Hepatol. 73:1219–1230. 2020. View Article : Google Scholar : PubMed/NCBI
|
|
21
|
Qiu X, Mao Q, Tang Y, Wang L, Chawla R,
Pliner HA and Trapnell C: Reversed graph embedding resolves complex
single-cell trajectories. Nat Methods. 14:979–982. 2017. View Article : Google Scholar : PubMed/NCBI
|
|
22
|
Efremova M, Vento-Tormo M, Teichmann SA
and Vento-Tormo R: CellPhoneDB: Inferring cell-cell communication
from combined expression of multi-subunit ligand-receptor
complexes. Nat Protoc. 15:1484–1506. 2020. View Article : Google Scholar : PubMed/NCBI
|
|
23
|
Uniken Venema WTC, Ramirez-Sanchez AD,
Bigaeva E, Withoff S, Jonkers I, McIntyre RE, Ghouraba M, Raine T,
Weersma RK, Franke L, et al: Gut mucosa dissociation protocols
influence cell type proportions and single-cell gene expression
levels. Sci Rep. 12:98972022. View Article : Google Scholar : PubMed/NCBI
|
|
24
|
Burja B, Paul D, Tastanova A, Edalat SG,
Gerber R, Houtman M, Elhai M, Bürki K, Staeger R, Restivo G, et al:
An optimized tissue dissociation protocol for single-cell RNA
sequencing analysis of fresh and cultured human skin biopsies.
Front Cell Dev Biol. 10:8726882022. View Article : Google Scholar : PubMed/NCBI
|
|
25
|
Aizarani N, Saviano A, Sagar Mailly L,
Durand S, Herman JS, Pessaux P, Baumert TF and Grün D: A human
liver cell atlas reveals heterogeneity and epithelial progenitors.
Nature. 572:199–204. 2019. View Article : Google Scholar : PubMed/NCBI
|
|
26
|
MacParland SA, Liu JC, Ma XZ, Innes BT,
Bartczak AM, Gage BK, Manuel J, Khuu N, Echeverri J, Linares I, et
al: Single cell RNA sequencing of human liver reveals distinct
intrahepatic macrophage populations. Nat Commun. 9:43832018.
View Article : Google Scholar : PubMed/NCBI
|
|
27
|
Ng CKY, Dazert E, Boldanova T,
Coto-Llerena M, Nuciforo S, Ercan C, Suslov A, Meier MA, Bock T,
Schmidt A, et al: Integrative proteogenomic characterization of
hepatocellular carcinoma across etiologies and stages. Nat Commun.
13:24362022. View Article : Google Scholar : PubMed/NCBI
|
|
28
|
Heinrich S, Craig AJ, Ma L, Heinrich B,
Greten TF and Wang XW: Understanding tumour cell heterogeneity and
its implication for immunotherapy in liver cancer using single-cell
analysis. J Hepatol. 74:700–715. 2021. View Article : Google Scholar : PubMed/NCBI
|
|
29
|
Deng R, Liu S, Shen S, Guo H and Sun J:
Circulating hepatitis B virus RNA: From biology to clinical
applications. Hepatology. Mar 28–2022.(Epub ahead of print).
View Article : Google Scholar
|
|
30
|
Shah PA, Patil R and Harrison SA:
NAFLD-related hepatocellular carcinoma: The growing challenge.
Hepatology. Apr 28–2022.(Epub ahead of print). View Article : Google Scholar
|