Introduction
Honey and other bee products contain plant
antioxidants that have high bioactivity levels and chemical
diversity (1). For instance,
various compounds are transported from plants and accumulate in the
finished product as nectar or plant secretions and are used to
manufacture honey by bees (2). As
a result, the composition of honey, including its physical,
chemical, organoleptic and nutraceutical features, is directly
influenced by the geographic, climatic and environmental
characteristics of the areas from which it is produced. These
variances function effectively as a classification and
identification tool for honey (3).
The western honeybee, Apis melifera, produces
a natural product produced by flower and plant nectar or insect
exudates, known as honey (4). The
beneficial properties of honey have been known for millennia. To be
more specific, the Babylonians, Mayans, Greeks, Romans, Egyptians
and Chinese used honey both for nutritional aims and for their
therapeutic properties (5). Of
note, honey was a major carbohydrate source and the only available
sweetener until the industrial production of sugar, which commenced
after 1800. Honey is also used in alternative medicine as ointment
to heal burns, infections and wounds (6).
Honey is a complex mixture, which consists of a
variety of ~180 compounds, such as carbohydrates, mainly including
glucose and fructose (60–85%), water and minority compounds, such
us phenolic compounds, minerals, proteins, enzymes, free amino
acids and vitamins (7). The
scientific literature indicates that honey can exert several
beneficial effects on health, including antioxidant (8,9),
anti-inflammatory (10),
antibacterial (11) and
antidiabetic (12) effects, as
well as protective effects on the gastrointestinal (13) and nervous systems (14). The health benefits of honey may be
attributed to pharmacologically-related components, such as
flavonoids and phenolics, with the most abundant of these being
chrysin, kaempferol, quercetin, luteolin, gallic acid, etc.
(15–18).
Some of the minor constituents of honey, compared to
its major sugar levels, are considered to have antioxidant
properties (19). The majority of
the antioxidant activity of honey is determined by its chemical
compounds, which includes phenolics, flavonoids, enzymes, organic
acids, amino acids, ascorbic acid and carotenoids (20). Chemicals known as phytochemicals
are naturally found in plants (21). Bees can feed on phytochemical-rich
plants, which allows them to transfer the beneficial components to
honey (22). The concentration of
the carbohydrates and other minor chemicals varies greatly,
depending on their botanical source, processing techniques,
seasonal and environmental circumstances and other variables
(23). Some components of honey
are contributed by honeybees, while others are a result of
biological reactions that occur as the honey matures (24).
Honey may emanate both from single (unifloral honey)
or multiple (multifloral honey) plant species depending on the diet
of bees (25). In order to define
the pollen inside the honey sample and therefore its type,
melissopalynological analysis has been proven to be a reliable
method (26). Current research has
led to the acknowledgement of the fact that honey possesses a
promising antioxidant capacity, although its antioxidant mechanisms
are not yet fully understood (5).
According to previous research, honey may represent
an anticancer agent (27).
Specifically, honey inhibits a number of cell signaling pathways,
including those that induce apoptosis, as well as pathways
associated with anti-mutagenic, anti-proliferative and
anti-inflammatory effects (5,15).
Due to its capacity to reduce acute inflammation by increasing the
immune response, honey and its components are gaining interest as
an efficient natural therapeutic (28). Previous studies have provided
evidence that honey inhibits the proliferation, induces the
apoptosis, modifies the cell cycle progression, and causes the
mitochondrial membrane depolarization of adenocarcinoma epithelial
cells, liver cancer cells, bone cancer cells (osteosarcoma) and
leukemia cells (5,29–31).
However, in order to better understand the protective effects of
honey on cancer, further research is required.
There are a few studies investigating the antitumor
effects of honey on liver cancer cells, demonstrating that honey is
able to reduce the levels of nitric oxide (NO) in the cells and
decrease the HepG2 population as well, improving the total
antioxidant profile of the cells (15,32).
Other studies have reported the concentration-dependent cytotoxic,
anti-metastatic and antiangiogenic effects on HepG2 cells (33,34).
Within this context, six honey samples produced in Greece were
evaluated for their potential antioxidant properties. The aim of
the present study was to estimate the antioxidant capacity of honey
collected form areas around Greece by small scale producers i)
using in vitro cell-free assays; and ii) by examining the
effects of the honey varieties on the redox status of a liver
cancer cell line (HepG2) at non-cytotoxic concentrations. The
findings presented herein will allow for the identification of
Greek honeys with promising antioxidant capacity.
Materials and methods
Honey samples
Honey samples were collected from two different
regions in Greece from small-scale producers. Specifically, the
first region was Taygetos mountain in Peloponnisos and from
different areas of the longest mountain range in Greece,
particularly from Pindos. For the purpose of the study, blind
sampling was used. The only data available were the type of honey,
the beehive location and the harvest date. In total, six different
types of raw honey were collected (Table SI), with the aim of evaluating
these according to their antioxidant properties. In order to
prepare the honey samples, they were diluted in 1:1 w/v deionized
water (dH2O), followed by 5 min of heating at 35–40°C.
The heated samples were allowed to stand for 15 min and then used
to evaluate their bioactivity using a series of in vitro
cell-free and cell-based assays.
In vitro cell-free assays
Total phenolic content (TPC)
The estimation of TPC of the different types of
honey was performed by the use of Folin-Ciocalteu (FC) reagent. A
total of 20 µl of each sample, 1 ml dH2O and 100 µl FC
reagent were added to test tubes, followed by incubation for 3 min
in room temperature (RT), in the dark. Subsequently, 25%w/v of
sodium carbonate solution (280 µl) and 600 µl dH2O were
added followed by incubation for 1 h at RT and under dark
conditions. A test tube including only FC and dH2O was
used as a blank and the absorbance was measured at 765 nm using a
spectrophotometer (Hitachi, U 1900 UV/VIS, Hitachi
High-Technologies Corporation). For the estimation of TPC, a gallic
acid standard curve was made (at concentrations of 0, 50, 150, 250
and 500 µg/ml) and later used for the expression of the results
as/mg of gallic acid equivalents (GAEs) per g of honey (mg GAE/g
honey) (35). The experiment
conducted at least three independent times.
2,2 Diphenyl 1 picrylhydrazyl
(DPPH•) radical scavenging assay
The free-radical scavenging capacity (RSC) of the
honey samples was evaluated using an assay originally described by
Brand-Williams et al (36),
with slight modifications, as previously described (37). First, 50 µl methanolic solution of
DPPH• (100 µΜ) was mixed with 900 µl methanol (MeOH) and
the honey sample in a range of concentrations between 50 and 1.56
mg/ml. The samples were then incubated in the absence of light, for
20 min and RT followed by the measurement of the optial density at
517 nm using a spectrophotometer (Hitachi, U 1900 UV/VIS, Hitachi
High-Technologies Corporation). As a blank, 1 ml methanol has used,
and a solution of DPPH• and methanol was used as a
control. The RSC was calculated using the following equation:
where ODcontrol is the absorbance value
of the control solution, and ODsample is the absorbance
value of the sample. Through the graph-plotted RSC percentage
against the honey concentration, the half maximal inhibitory
concentration (IC50) was calculated to compare the
inhibition of radical capacity of the honey samples. The experiment
was conducted at least three times independently.
2,2′-Azino-bis(3-ethylbenzothiazoline-6-sulfonic acid
(ABTS•+) radical scavenging assay
A slightly modified version of the original one was
used to evaluate the ability of the honey samples to inhibit
radicals (38). Firstly, 400 µl
dH2O, mixed with 1 mM (500 µl) ABTS solution, 30 µM (50
µl) hydrogen peroxide (H2O2) and 6 µM (50 µl)
horseradish peroxidase (HRP) were added in the test tubes, followed
by incubation at RT for 45 under dark conditions, for
ABTS•+ formation. Subsequently, 50 µl of sample (in a
range of concentrations between 12.5 and 0.78 mg/ml) was added and
the optical density was monitored at 730 nm using a
spectrophotometer (Hitachi, U 1900 UV/VIS, Hitachi
High-Technologies Corporation). The mixture with the lack of sample
was as a control and the ABTS solution combined with
H2O2 was used as a blank. The percentage RSC
and the IC50 value were determined as described above.
The experiment was conducted at least three times
independently.
Hydroxyl radical scavenging assay
An altered version of the one described by Chung
et al (39) was used for
the determination of the hydroxyl radical scavenging activity of
the honey samples, as previously described (40). Initially, 75 µl of sample in a
range of concentrations between 3.125 and 0.19 mg/ml were mixed
with 0.2 M (225 µl) and pH 7.4 of sodium phosphate buffer, 10 mM
(75 µl) 2-deoxyribose, 10 mM (75 µl) FeSO4-EDTA
solution, 300 µl dH2O and 10 mM (30 µl)
H2O2. Incubation was performed for 1 h at
37°C, followed by the addition of 2.8% w/v (375 µl) trichloroacetic
acid (TCA), and 375 µl of 1% 2-thiobarbituric acid (TBA) dissolved
in 50 mM NaOH and a new incubation was performed for 10 min at
95°C. After 10 min, the samples were cooled on ice for 6 min,
centrifuged at 3,000 × g for 10 min at 25°C, and the optical
density was monitored at 520 nm using a spectrophotometer (Hitachi,
U 1900 UV/VIS, Hitachi High-Technologies Corporation). As a blank a
mixture without H2O2 was used and a mixture
with the presence of sample and the absence of
H2O2 was used as a control. The percentage
RSC and the IC50 value were determined as described
above. The experiment was conducted at least three times
independently.
Superoxide radical scavenging
assay
For the evaluation of the superoxide anion
radical-scavenging ability of the honey, an altered version of the
method described by Gülçin et al (41) was used, as later described by
Priftis et al (42).
Initially, 50 µl of the honey samples in a range of concentrations
between 25 and 0.78 mg/ml was mixed with 16 mM (625 µl), pH 8.0
Tris-HCl buffer, 300 µM (125 µl) nitroblue tetrazolium (NBT), 468
µM (125 µl) 2-deoxyribose, nicotinamide adenine dinucleotide (NADH)
and 60 µM (125 µl) of phenazine methosulfate (PMS). The samples
were vortexed, incubated at RT for 5 min in the dark, and the
optical density then measured at 560 nm using a spectrophotometer
(Hitachi, U 1900 UV/VIS, Hitachi High-Technologies Corporation). As
a blank, a test tube without PMS was used, and a test tube with the
absence of the sample was used as a control. The percentage RSC and
the IC50 value were determined as described above. The
experiment was conducted at least three times independently.
Peroxyl radical-induced DNA plasmid
strand cleavage
The assay was performed with some modifications, as
previously described by Tekos et al (43). The thermal decomposition of the
2,2′-azobis(2-amidinopropane) dihydrochloride (AAPH) creates
peroxyl radicals (ROO•). The reaction included a total volume of 10
µl containing 3.2 µg pBluescript (SK+) plasmid DNA, 2.5 mM AAPH
dissolved in PBS and the honey samples in a range of concentrations
between 25 and 0.78 mg/ml. The mixture was incubated at 37°C for 45
min, followed by the addition of 3 µl loading buffer (0.25%
bromophenol blue and 30% glycerol) in order to terminate the
reaction. Analysis was performed using electrophoresis on a 0.8%
agarose gel tagged with the fluorescent ethidium bromide (10
mg/ml), and running for ~1 h at 80 V. The acquisition of images was
performed using a MultiImage Light Cabinet (Alpha Innotech
Corporation). Alpha View suite (Alpha Innotech software, Alpha
Innotech Corporation; ProteinSimple) was used to analyze the
UV-exposed gels. Antioxidant compounds have the ability to scavenge
peroxyl radicals. As a result, they can prevent single-strand
breaks, preserving the plasmid-DNA in its supercoiled conformation.
To estimate the inhibition of peroxyl radicals by the tested
samples, the following equation was used:
In the equation, S represents the percentage of the
supercoiled plasmid DNA in the tested samples, S° refers to the
percentage of the supercoiled plasmid DNA in the positive control,
and Scontrol represents the percentage of the
supercoiled DNA in the negative control. The IC50 value
was determined as described above. The experiment was conducted at
least three times independently.
Reducing power assay
The reducing power assay was performed as previously
described by Yen and Duh (44),
with some modifications, as previously described (45). Briefly, the sample containing
various concentrations of sample (between 25 and 0.78 mg/ml) was
dissolved in a 0.2 M (200 µl), pH 6.6 phosphate buffer, mixed with
a 1% (250 µl) potassium ferricyanide and later incubated in a dry
bath for 20 min at 50°C followed by cooling on ice for 5 min. TCA
[10% w/v (250 µl)] was added prior to centrifugation for 10 min at
3,000 × g at 25°C. Finally, 700 µl of the mixture transferred to
clean test tubes, and 250 µl dH2O and 0.1% (50 µl)
ferric chloride were added, followed by incubation at RT for 10
min. The optical density was then measured at 700 nm using a
spectrophotometer (Hitachi, U 1900 UV/VIS, Hitachi
High-Technologies Corporation). The results are represented as
AU0.5. The AU0.5 value was defined as the concentration needed to
achieve an absorbance at 0.5 and arises from a graph-plotted
absorbance against the sample concentration. The experiment was
conducted at least three times independently.
In vitro cell-based assays
Cells and cell culture
The HepG2 cell line was donated by Assistant
Professor Kalliopi Liadaki (Department of Biochemistry and
Biotechnology, University of Thessaly, Larissa, Greece). HepG2
cells are frequently used to examine the effects of unidentified
compounds with potential anticancer activity, as they maintain the
activities of numerous enzymes crucial for xenobiotic metabolisms.
When studying complex matrices such as honey, which contains a
variety of biologically active chemicals and whose efficacy may
fluctuate due to metabolic transformation, the selection of the
cell line is crucial (46).
The cells were cultured in normal Dulbecco's
modified Eagle's medium (DMEM), containing 10% (v/v) fetal bovine
serum (FBS), 2 mM L-glutamine, 100 U/ml of penicillin and 100 U/ml
of streptomycin (all from Gibco; Thermo Fisher Scientific, Inc.;
complete medium) in plastic disposable tissue culture flasks at
37°C in 5% carbon dioxide. The experiment was conducted at least
three times independently.
Cell proliferation assay
Cell proliferation was examined using the XTT assay
kit (R&D Systems, Inc.). A total of 10,000 cells were placed in
each well of a 96-well plate in complete DMEM and incubated for 24
h at 37°C. The cells later treated with a range of concentrations
of raw honey in DMEM in the absence of FBS. After 24 h, 50 µl of
the XTT solution, containing 49 µl XTT-labeling reagent with 1 µl
XTT activator were added to each well of the plate followed by
incubation for 4 h at 37°C and the measurement of the optical
density at 450 and 630 nm (which is the reference wavelength) using
a plate reader (Bio-Tek ELx800; Bio-Tek Instruments, Inc.). The
absorbance of each tested concentration of each tested honey was
measured without cells, as well as cell cultures in the absence of
sample (control), and in the absence of cells (negative control),
using the same plate reader. The absorbance values obtained in
wells that contained only raw honey samples were subtracted from
those acquired from wells that contained the respective extract
concentration and seeded cells. Data were calculated as follows: %
(of control) cell
viability=(ABsampe/ABcontrol) ×100, where
ABcontrol and ABsample indicate the optical
density of the negative control and the test compounds,
respectively. All experiments were carried out in triplicate and at
least on two separate occasions.
Flow cytometric analysis of
glutathione (GSH) and reactive oxygen species (ROS) levels
For the purpose of measuring the GSH and ROS levels,
the HepG2 cells were cultured in a six-well plate and incubated for
24 h at 37°C, 5% CO2 and 80–95% humidity in complete
medium, until they reached a confluency of 70–80%. On the following
day the complete medium was replaced with serum-free medium with
the following honey concentrations: 3.125-25 mg/ml of oak, EC, FOH,
F1 and 1.56-12.5 mg/ml of FV and F2, and incubated for 24 h at
37°C. In order to measure the GSH levels, the cells were collected
by trypsinization and washed with PBS twice following consecutive
centrifugations at 300 × g for 5 min at 4°C. Following each
centrifugation step, the supernatant was discarded, and the
cellular pellet (106 cells/ml) was resuspended in PBS.
Following the second wash, the cells were incubated in 1 ml PBS,
including 5 µl Thiol Green dye (Thiol Green Indicator, Abcam), at
37°C for 30 min under dark conditions with the obligation of
slightly mixing every 10 min under dark conditions followed by
centrifugation (300 × g, 5 min, 4°C) and resuspension in PBS. Thiol
Green accumulates primarily in the cytosol in normal cells;
however, when the cells are apoptotic, it is able to partially
translocate to the mitochondria, while its staining intensity is
decreased (47). For the
measurement of intracellular ROS levels, the cells stained were
with the DCF-DA fluorescent dye. Esterases found inside of the
cells deacetylate DCF-DA, which is then further transformed into
fluorescent DCF by the oxidative action of ROS (48). The cells were incubated in the
presence of DCF-DA 10 µM (of 400 µM stock), at 37°C for 30 min
under dark conditions, followed by trypsinization and
centrifugation (300 × g, 5 min, 4°C) to wash the excessive
fluorescent and resuspension in PBS. Subsequently, using a
FACSCalibur flow cytometer (BD Biosciences), which employs
excitation and emission lengths of 490 and 530 nm both for ROS and
GSH, the cells were exposed to flow cytometric analysis. As
measures of the cell size and internal complexity, respectively,
the forward angle and right-angle light scattering were assessed. A
flow rate of 1,000 events per second was used to analyze 10,000
cells per sample, and logarithmic fluorescence intensities were
recorded. The data were assessed using BD Cell Quest 6.0 software
(BD Biosciences). The experiment was conducted at least three times
independently.
For the determination of the levels of total
antioxidant capacity (TAC), TBA reactive substances (TBARS) and
protein carbonyls (PCARBS), the cells were lysed in PBS with
protease inhibitors (Complete™ mini protease inhibitors, Roche
Applied Science) at 1×10⁶ cells/ml by sonication. The
protein concentration was measured using the Bradford assay and
subsequently, a modified method as previously described by
Patsoukis et al (49) was
used.
TAC assay
The Janaszewska and Bartosz (50) technique was used to determine the
TAC levels. An amount of 500 ml of phosphate buffer (10 mM; pH 7.4)
in total with cellular suspension (50 µg protein), or 500 ml
phosphate buffer for the blank were added, followed by the addition
of DPPH• (0.1 mM) solution with final volume of 1 ml.
Following 60 min of incubation at room temperature in the dark a
centrifugation (15,000 × g, 3 min, RT) step followed, and the
optical density was measured at 520 nm using a spectrophotometer
(Hitachi, U 1900 UV/VIS, Hitachi High-Technologies Corporation).
The results were estimated by the reduction of DPPH• to
DPPH:H (2,2-diphenyl-1-picrylhydrazine) caused by the cell lysate
antioxidants. The experiment was conducted at least three times
independently.
Lipid oxidation (TBARS) assay
The assay was performed as previously described by
Keles et al (51), with
some modifications, as previously described by Skaperda et
al (52). A total amount of
(400-X) µl of PBS, (where X is the amount of cell suspension needed
to have 100 µg protein), or 400 µl PBS for the blank was mixed with
500 µl Tris-HCl (200 mM, pH 7.4) and 500 µl 35% TCA and incubated
for 10 min at RT. Subsequently, 2 M Na2SO4
and 55 mM TBA (1 ml) solution was added, followed by an incubation
at 95°C for 45 min. The samples were then placed in ice to cool,
where 1 ml of 70% TCA was added. Following centrifugation for 3 min
at 11,200 × g, the optical density was measured at 530 nm using a
spectrophotometer (Hitachi, U 1900 UV/VIS, Hitachi
High-Technologies Corporation). Τhe molar extinction co-efficient
of malondialdehyde (MDA) was used to calculate the TBARS levels.
The experiment conducted at least three times independently.
Protein oxidation (PCARBS) assay
The determination of PCARBS levels was based on the
method previously described by Patsoukis et al (49). In this assay, 400 µl PBS were used
combined with the amount of cell lysate needed required for 100 µg
protein, followed by the addition of 500 µl of 10 mM
2,4-dinitrophenylhydrazine (DNPH; in 2.5 N HCl) or 500 µl of 2.5 N
HCl for the blank. Following 1 h of incubation in RT, under dark
conditions (with the obligation of mixing vigorously every 15 min),
centrifugation was performed at 15,000 × g for 5 min at 4°C.
Subsequently, the supernatant discarded and 1 ml of 10% v/w TCA was
added followed by vortexing and the aforementioned centrifugation.
The supernatant was discarded again, and 1 ml ethanol-ethyl acetate
(1:1 v/v) was added, and the samples vortexed and centrifuged as
described above. This was followed by a washing step with
ethanol-ethyl acetate step, repeated 3 times. Finally, 1 ml 5 M
urea (pH 2.3) was added after the supernatant discarded, and the
samples incubated for 15 min at 37°C. A centrifugation step under
conditions as described above was performed and the optical density
was measured at 375 nm using a spectrophotometer (Hitachi, U 1900
UV/VIS, Hitachi High-Technologies Corporation). The molar
extinction co-efficient of DNPH was used to estimate the PCARBS
concentration. The experiment was conducted at least three times
independently.
Chemicals
All chemicals used for all the aforementioned assays
were supplied by Sigma-Aldrich; Merck KGaA.
Statistical analysis
For the in vitro cell-free assays, an
IC50 or AU0.5 value for each tested sample was
estimated. Each experiment was conducted in triplicate and on two
separate occasions. For the cell-based assays, all experiments were
conducted in triplicate and on three separate occasions. The data
were analyzed using one-way ANOVA, followed by Dunnett's post hoc
test to compare the mean value of each tested concentration with
the mean value of the control group. Spearman's correlation
analysis was used to determine the correlations between various
parameters in the in vitro cell free assays. Cell-free data
are presented as the mean ± SD, and cell-based data as the mean ±
SEM. A value of P<0.05 was considered to indicate a
statistically significant difference. All analyses were performed
using GraphPad Prism 8.0.1 (GraphPad Prism version 8.0.1 for
Windows, GraphPad Software, Inc.).
Results
In vitro cell-free assays for the
determination of the antioxidant, reducing and antigenotoxic
capacity of the raw honey samples
The results of the assays performed using in
vitro cell-free methods are presented in Table I. According to the results of the
TPC, the fir and vanilla (FV) honey was the one with the highest
polyphenolic content, although the oak and forest with oak honeydew
honeys also had a high polyphenolic content.
 | Table I.Total phenolic content, and
IC50 and AU0,5 values of the raw honey
samples obtained using in vitro cell-free assays. |
Table I.
Total phenolic content, and
IC50 and AU0,5 values of the raw honey
samples obtained using in vitro cell-free assays.
| Honey type | TPC (mg GAE/g) | DPPH•
IC50 (mg/ml) | ABTS•+
IC50 (mg/ml) | OH•
IC50 (mg/ml) | Superoxide radical
IC50 (mg/ml) | Reducing power
AU0,5 (mg/ml) | Plasmid relaxation
assay IC50 (mg/ml) |
|---|
| Oak | 1.24 | 7.14±0.02 | 2.96±0.81 | 1.22±0.04 | 1.98±0.04 | 1.87±0.19 | 2.98±0.11 |
| Eryngium
creticum | 0.84 | 9.95±0.025 | 4.03±0.08 | 1.04±0.06 | 7.48±0.37 | 3.60±0.3 | 6.04±0.19 |
| Fir and
vanilla | 1.32 | 6.51±0.32 | 1.03±0.01 | 1.05±0.06 | 1.01±0.01 | 2.41±0.01 | 1.60±0.17 |
| Forest with oak
honeydew | 1.16 | 4.61±0.29 | 0.90±0.01 | 1.24±0.02 | 1.24±0.01 | 1.79±0.06 | 1.55±0.15 |
| Flower (1) | 0.86 | 15.04±0.3 | 1.99±0.1 | 0.68±0.01 | 4.32±0.14 | 3.71±0.25 | 9.02±0.41 |
| Flower (2) | 0.89 | 8.47±0.69 | 1.45±0.02 | 0.66±0.01 | 2.63±0.02 | 2.28±0.01 | 6.86±0.68 |
In the DPPH• assay, a wide range of
IC50 values was observed. The FOH honey had the highest
scavenging activity, followed by the FV and oak honeys. The results
of the ABTS•+ assay revealed that the FOH and FV honeys
were those with the highest antioxidant capacity. In the hydroxyl
radical assay, the flower (F1 and F2) honeys exhibited the lowest
IC50 values, which indicates the highest antioxidant
capacity, despite the fact that they had the lowest polyphenolic
content. The FV and FOH honeys had the highest efficacy in the
superoxide radical assay, as shown by their capacity to scavenge
efficiently DPPH•, ABTS•+ and superoxide
radicals.
The antigenotoxic activity of the raw honey samples
was determined by the plasmid relaxation assay, in which the FOH
honey displayed the most potent antioxidant capacity as a result of
the lowest IC50 value.
The honey samples exhibiting the highest reducing
capacity were the oak and FOH honeys. The same samples followed by
the FV honey, exhibited the highest polyphenolic content, and the
highest ability to inhibit DPPH•, ABTS•+ and
superoxide radicals (Table I).
As demonstrated by the results presented in Table II, there is a very strong negative
(Rho=−0.943) and statistically significant (P=0.016) correlation
between the TPC and superoxide radical results, indicating that the
higher the polyphenolic content was, the lower the IC50
values were. There was also a strong negative correlation
(Rho=−0.771) between TPC and DPPH•, although this was
not statistically significant (P=0.102).
| Table II.Correlation coefficient (Rho) values
estimated from the correlation analysis between the TPC values and
the other in vitro cell-free assays. |
Table II.
Correlation coefficient (Rho) values
estimated from the correlation analysis between the TPC values and
the other in vitro cell-free assays.
| Correlation
analyzed | Rho value | P-value |
|---|
| TPC vs.
DPPH• | −0.771 | P=0.1028 |
| TPC vs.
ABTS•+ | −0.543 | P=0.2972 |
| TPC vs.
O2 | −0.943a |
P=0.0167a |
| TPC vs.
OH• | 0.543 | P=0.2972 |
| TPC vs. RP | −0.543 | P=0.2973 |
| TPC vs. ROO | −0.657 | P=0.175 |
In vitro cell-based results
In vitro cell-based assays for the
determination of the antioxidant capacity of the raw honey
samples
All six of the raw honey samples that were tested in
the in vitro cell-free assays, were also tested using the
HepG2 cells in order to evaluate antioxidant-related
parameters.
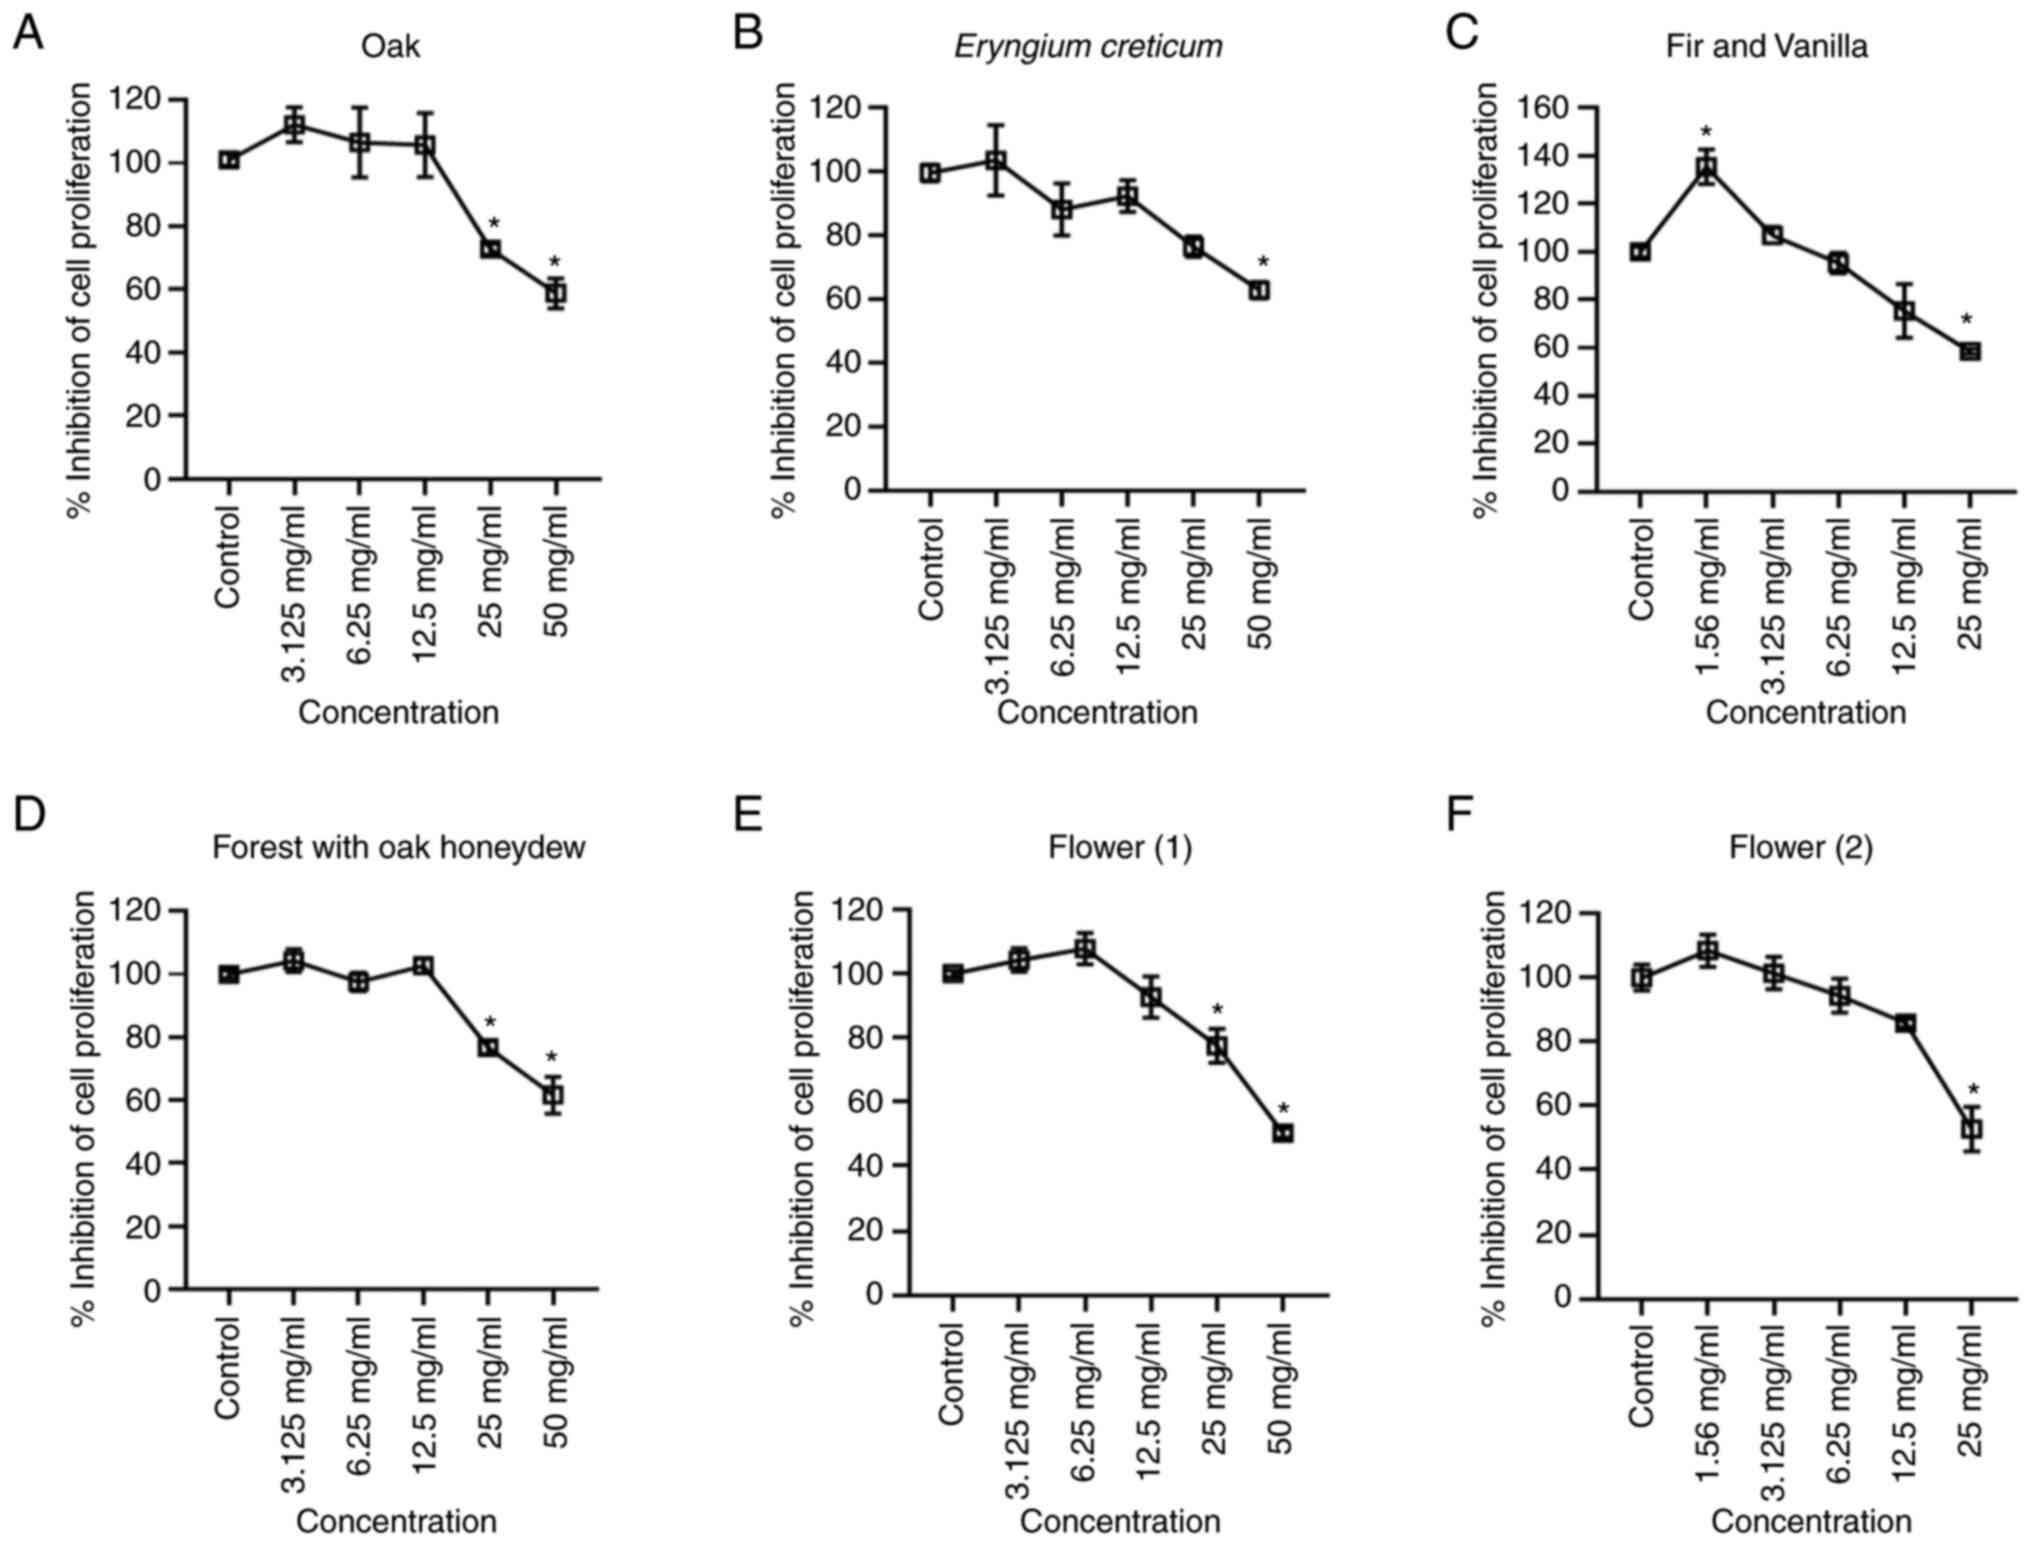
XTT cell proliferation assay
The manufacturer's instructions for the XTT assay
kit were followed in order to determine which concentration of the
samples impede cell growth (i.e., effect on cell viability). The
samples were administrated in a liver cancer cell line (HepG2;
Fig. 1, a sample was considered
cytotoxic at a concentration where the proliferation was <75%).
According to the results, the cells were able to tolerate higher
concentrations of the oak, Eryngium creticum (EC), FOH and
F1 honeys.
Effects of honey on the levels of redox
status biomarkers
In order to examine the effects of the raw honey
samples on the HepG2 cells, the highest non-cytotoxic
concentrations of each sample were selected. The selected
concentrations were used to treat the cells and their effects on
the intracellular GSH and ROS levels, as well as on the TAC, TBARS
and protein carbonyls levels were assessed.
According to the results obtained using the oak
honey, treatment of the cells with lowest concentration (3.125
mg/ml) increased the TAC and lipid peroxidation levels, as compared
to the control group. Furthermore, the highest administered
concentration (25 mg/ml) increased the GSH, TAC, and TBARS levels
in comparison with the control group (Fig. 2A).
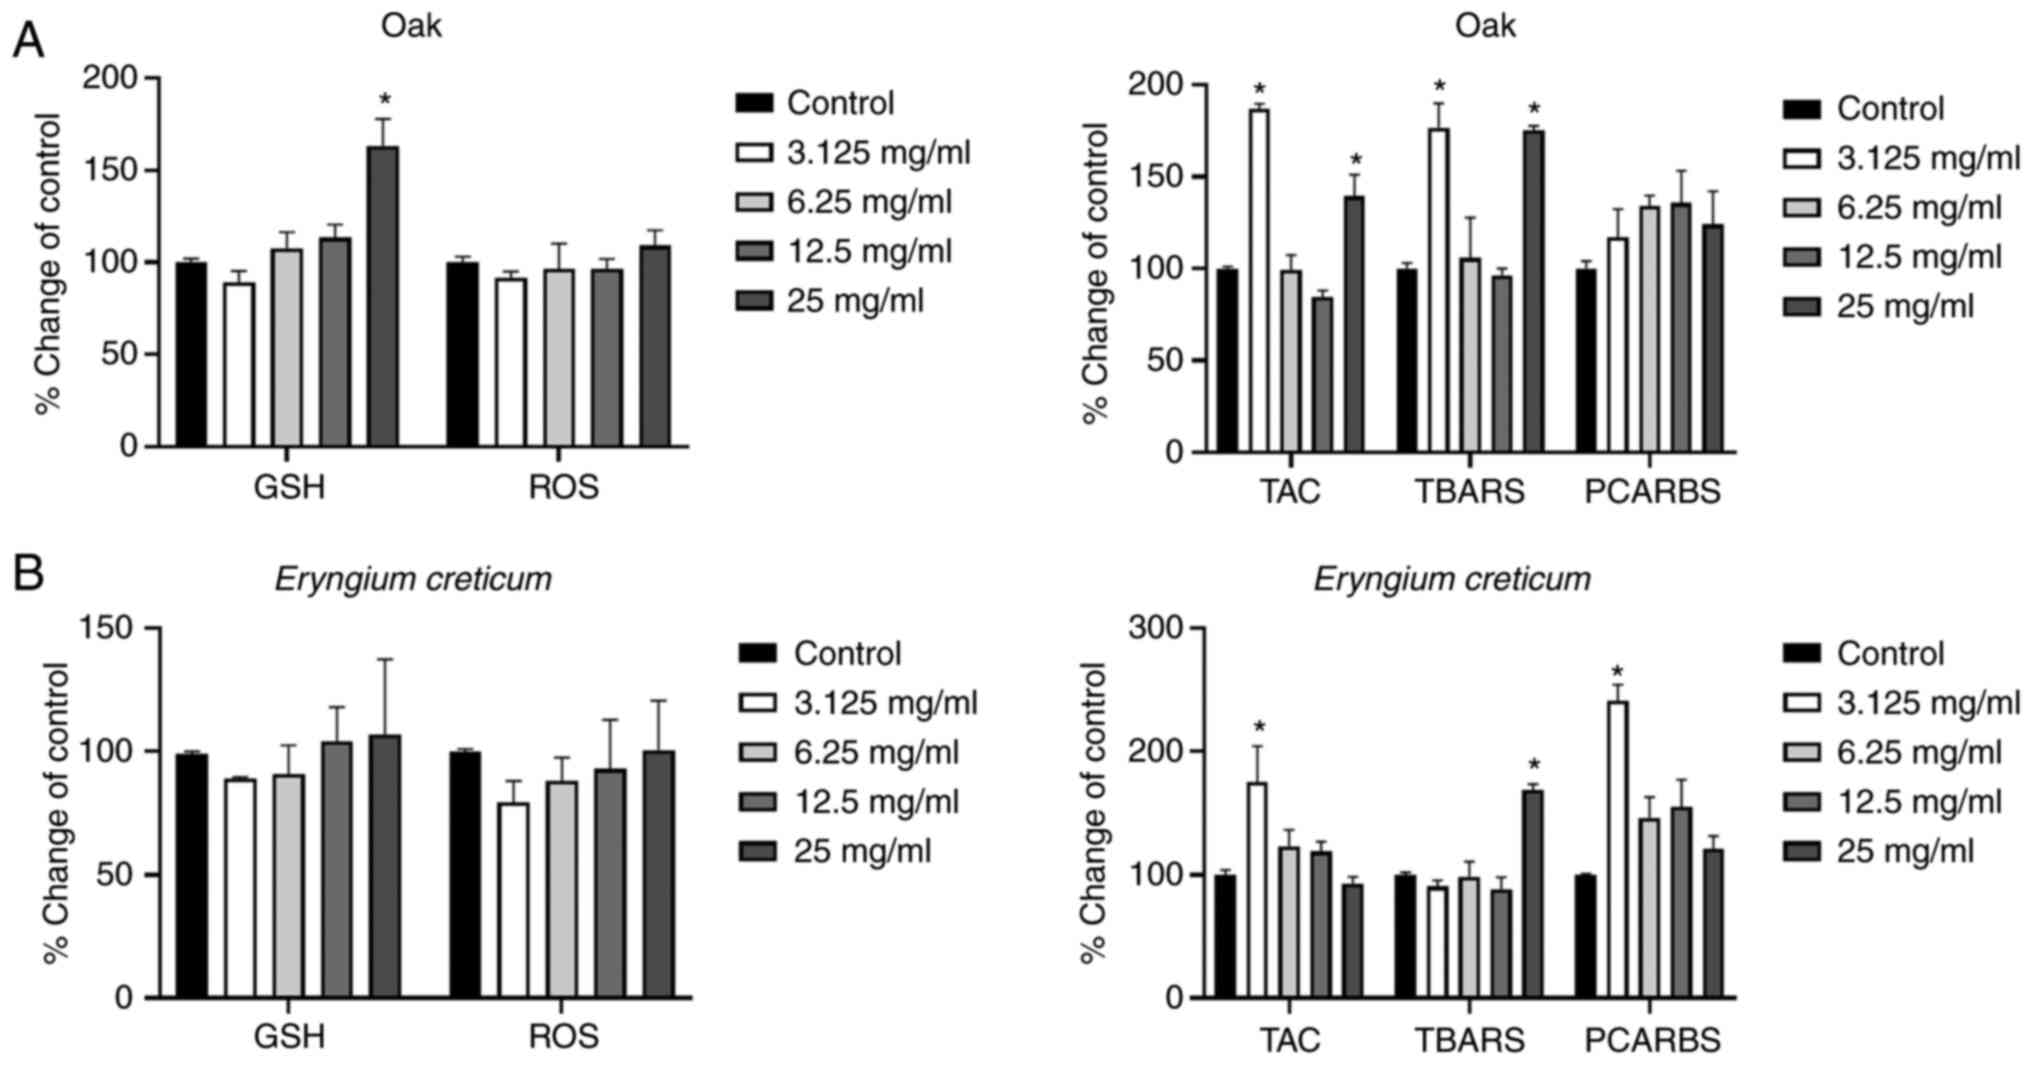 | Figure 2.Effects of the honeys on GSH, ROS,
TAC, TBARS and PCARBS levels in HepG2 cells following 24 h of
exposure. (A) Oak honey, and (B) Eryngium creticum honey.
*P<0.05, significant difference compared with untreated HepG2
cells (control). GSH, glutathione; ROS, reactive oxygen species;
TAC, total antioxidant capacity; TBARS, thiobarbituric reactive
substances; PCARBS, protein carbonyls. |
The results regarding the EC honey are presented in
Fig. 2B. In that case, the highest
and lowest administered concentrations induced statistically
significant changes, as compared to the control group. More
specifically, an increase in TAC levels was observed at the lowest
concentration, followed by an increase in PCARBS. Additionally, an
increase in lipid peroxidation levels was observed at the highest
administered concentration (25 mg/ml).
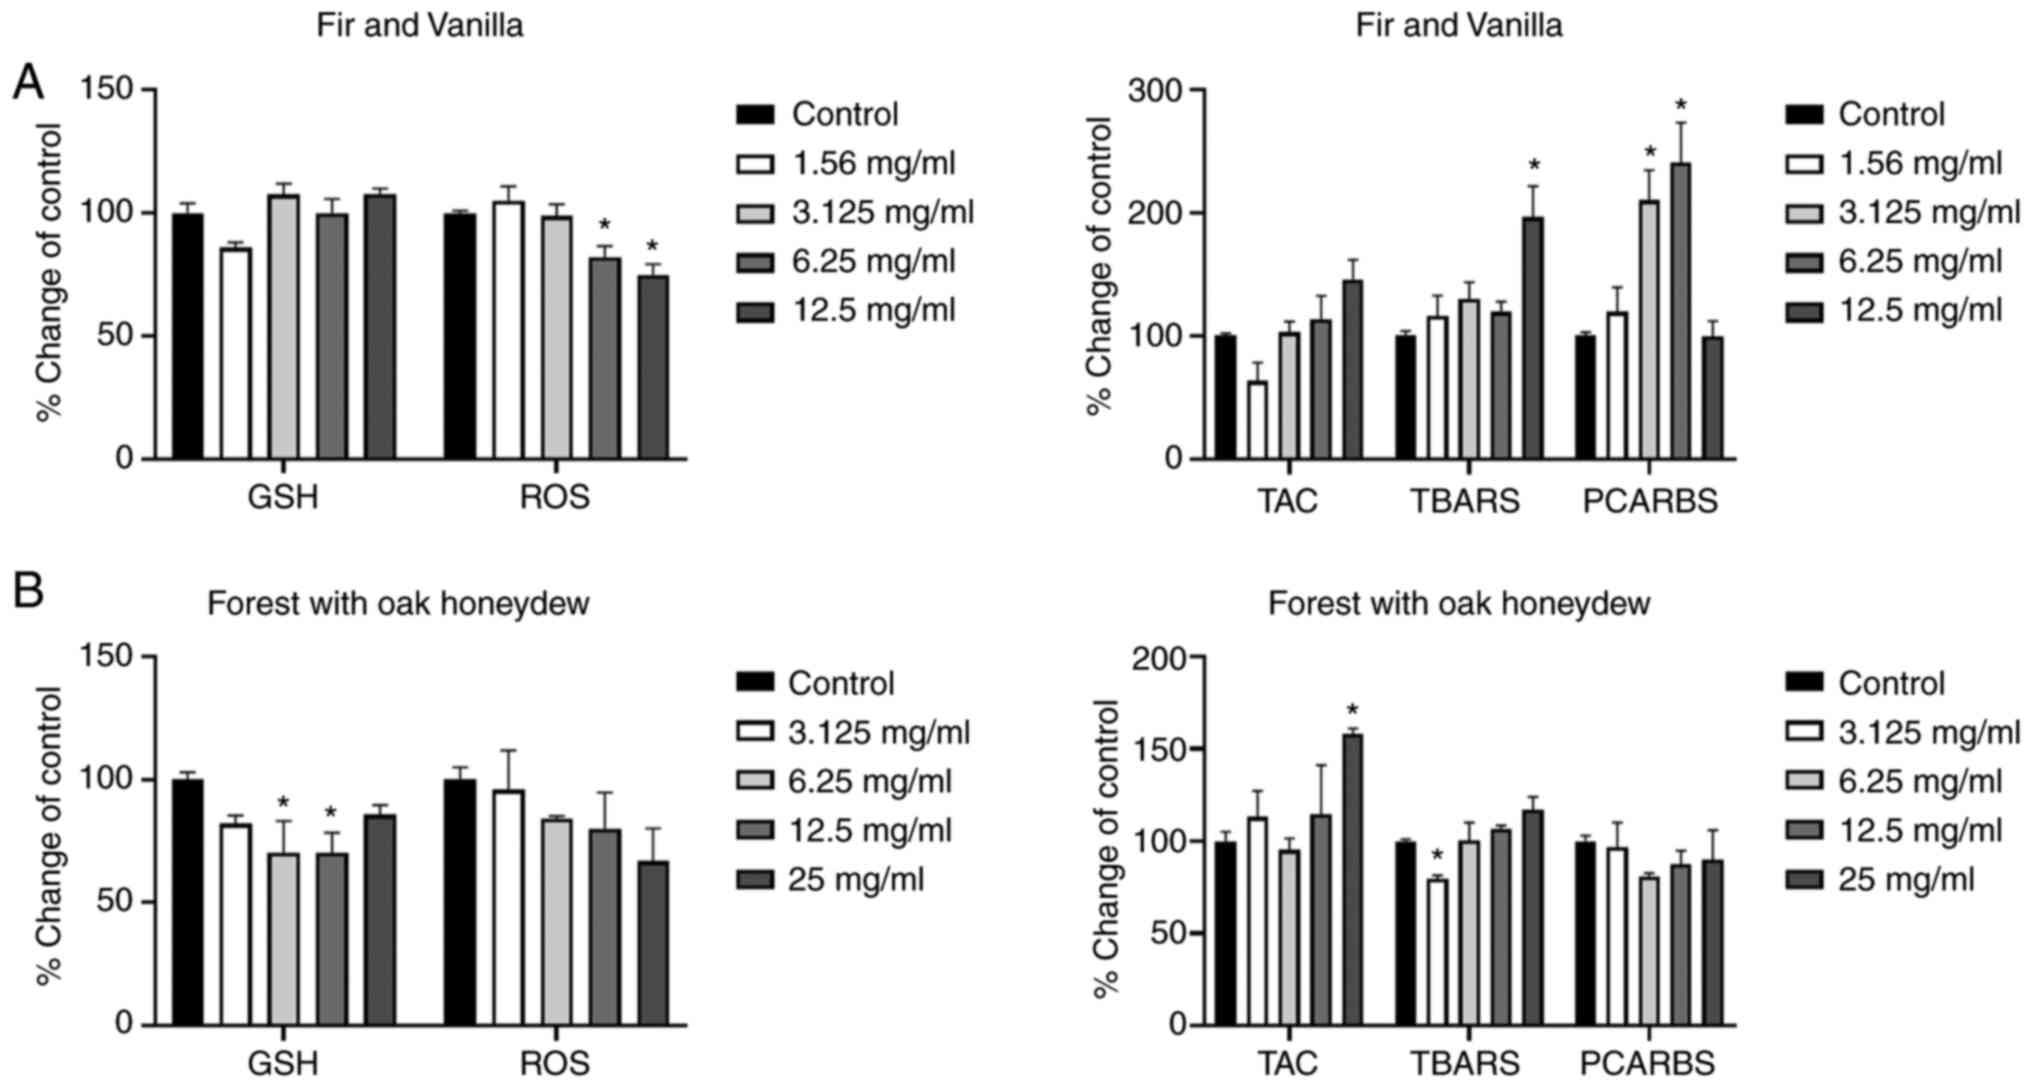
As regards the results of the FV honey (Fig. 3A), a statistically significant
decrease in ROS levels was observed at the 6.125 and 12.5 mg/ml
concentrations, as well as an increase in lipid peroxidation levels
at the highest administered concentration (12.5 mg/ml). Moreover,
PCARBS was promoted, supported by the statistically significant
increase in PCARBS at 3.125 and 6.25 mg/ml, as compared to the
control group.
The results of the FOH honey are presented in
Fig. 3B. The highest concentration
(25 mg/ml) increased the TAC levels in comparison with the control
group. As regards the intracellular GSH levels, a statistically
significant decreased was observed with the concentrations of 6.25
and 12.5 mg/ml. As for the TBARS levels, a decrease was observed
with the lowest concentration (3.125 mg/ml).
The results of the F1 honey presented in Fig. 4A, revealed a decrease in the
intracellular ROS levels at all tested concentrations. No
statistically significant differences were detected in the other
examined redox biomarkers, with the exception of the increase in
protein oxidation levels, with the concentration of 12.5 mg/ml.
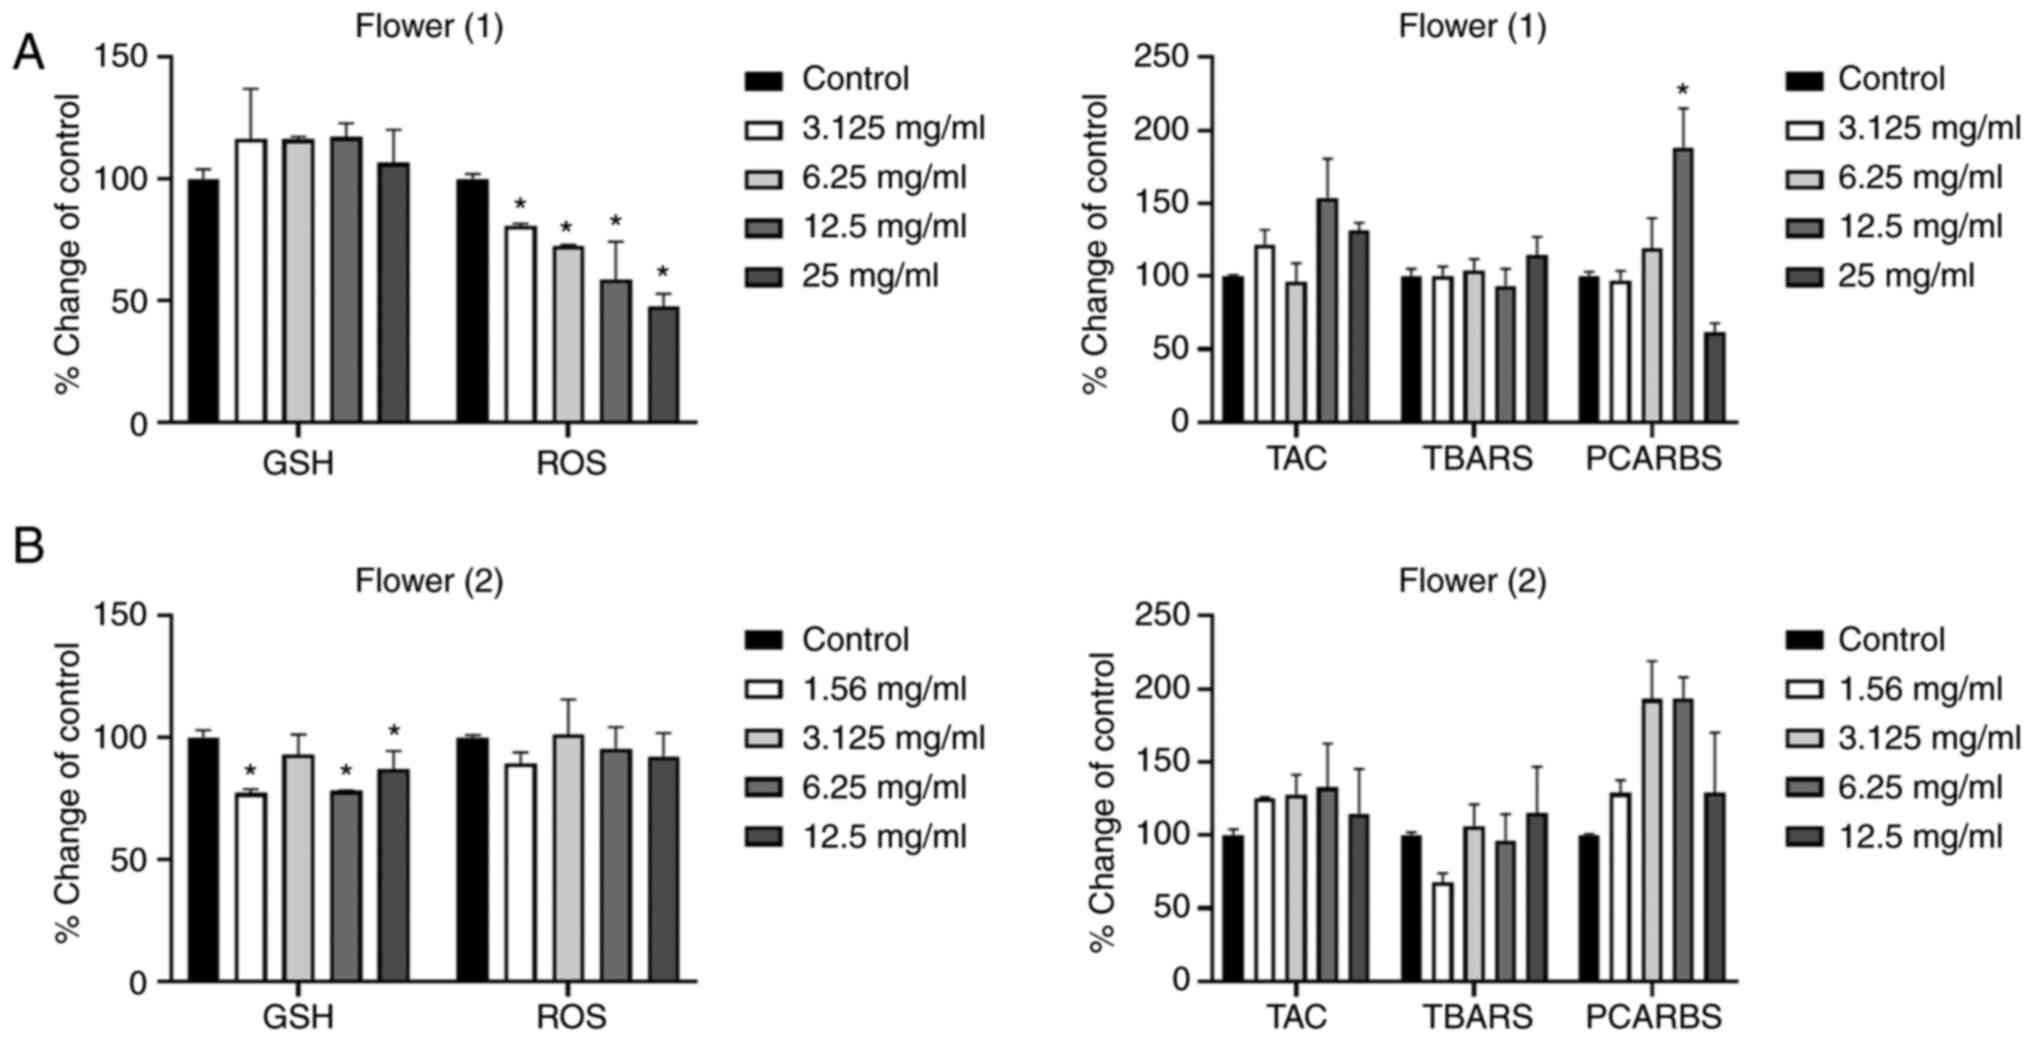 | Figure 4.Effects of the honeys on GSH, ROS,
TAC, TBARS and PCARBS levels in HepG2 cells following 24 h of
exposure. (A) Flower (1), and (B)
Flower (2) honeys. *P<0.05,
significant difference compared with untreated HepG2 cells
(control). GSH, glutathione; ROS, reactive oxygen species; TAC,
total antioxidant capacity; TBARS, thiobarbituric reactive
substances; PCARBS, protein carbonyls. |
As regards the results of the F2 honey (Fig. 4B), a statistically significant
decrease in GSH levels was observed at the concentrations of 1.56,
6.25 and 12.5 mg/ml. No marked effects were observed on the other
redox biomarkers examined.
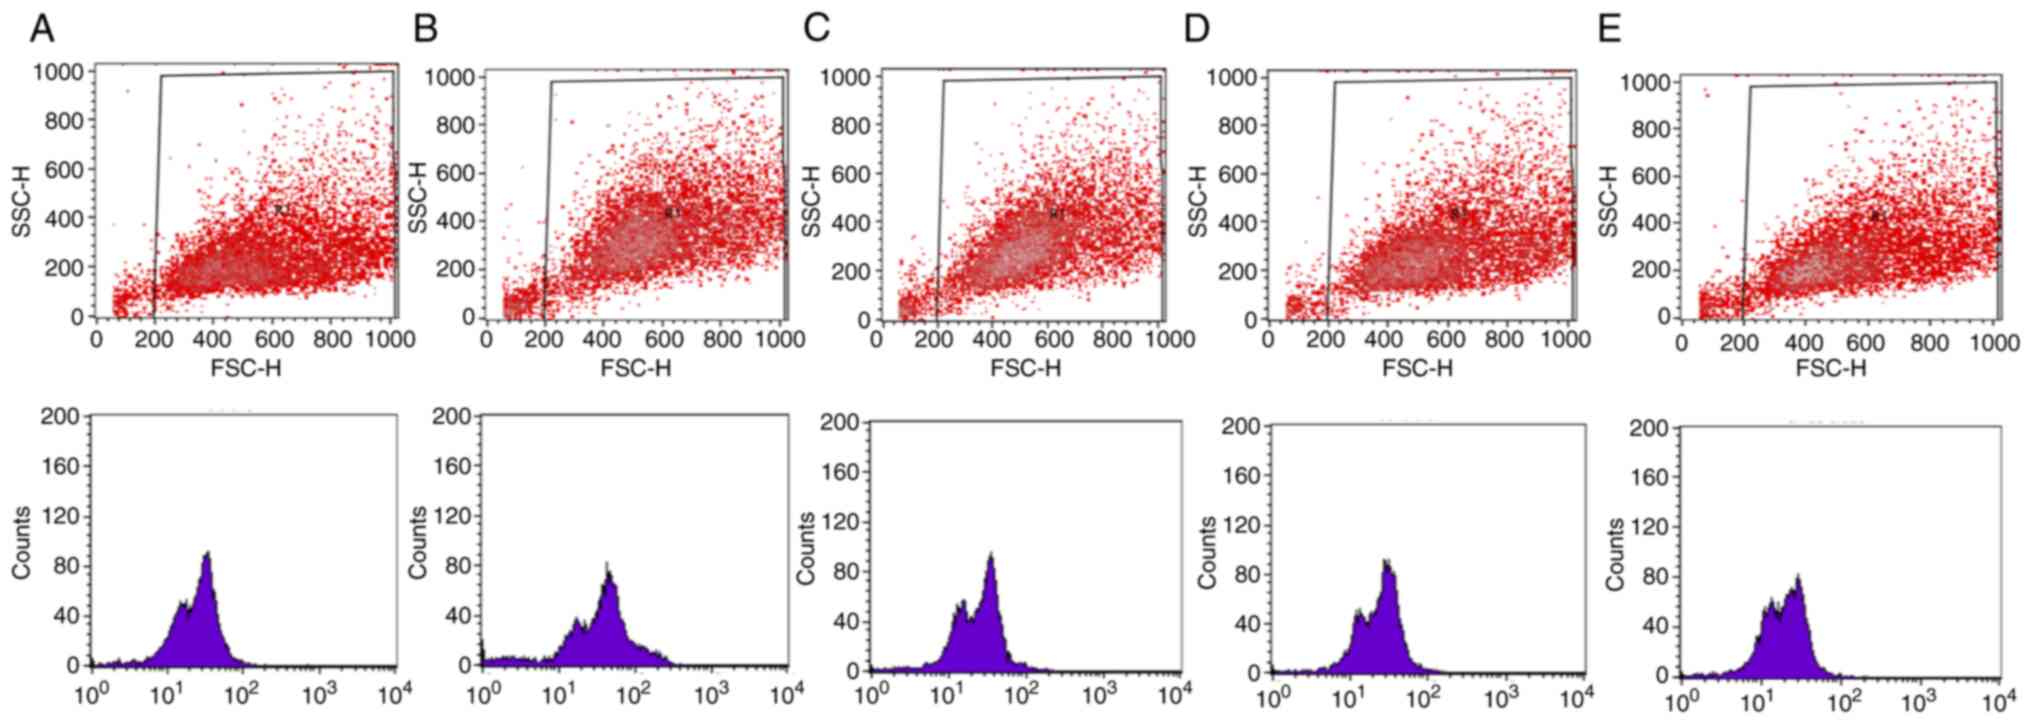
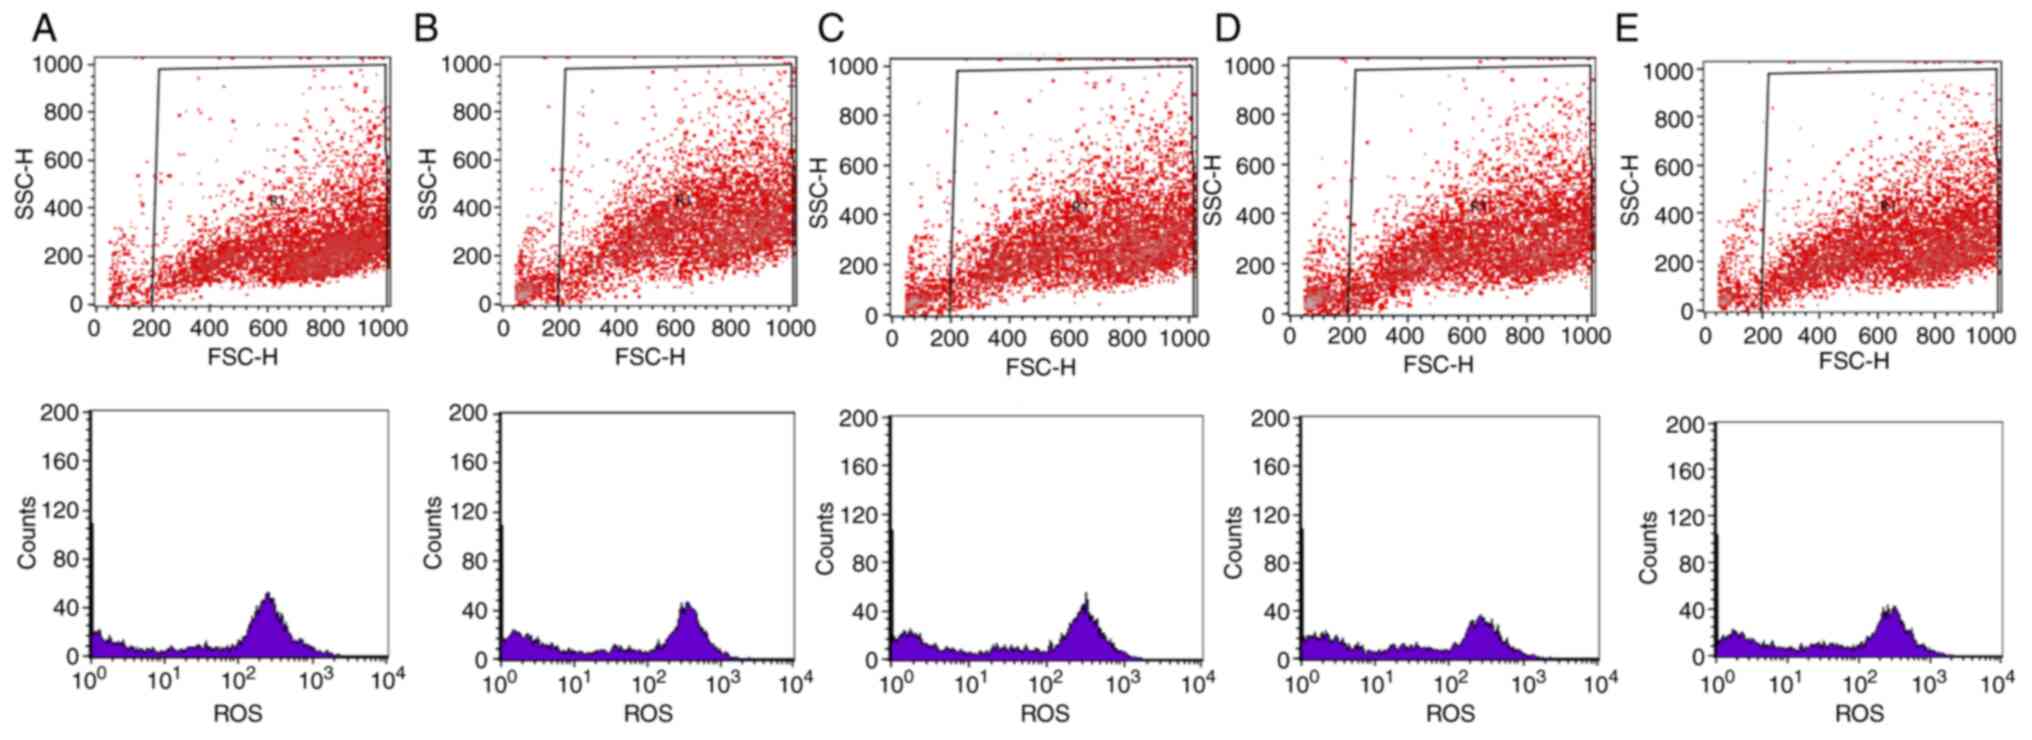
Representative results from the flow cytometry
experiment are presented in Figs.
5 and 6. In particular,
scatter plots and histograms are presented for the determination of
the intracellular GSH (Fig. 5) and
ROS levels (Fig. 6) in the HepG2
cell line, following treatment with the oak honey at concentrations
25–3.125 mg/ml.
Discussion
The objective of the present study was to determine
the antioxidant capacity of honey produced on a small scale
throughout Greece by analyzing its effects using cell-free assays,
and on a liver cancer cell line (HepG2) redox status using in
vitro cell-based assays in biologically relevant
concentrations. The HepG2 cell line was used as the liver is the
main metabolic organ. According to the findings, there are
variations depending on the type of honey in both cell-free and
cell-based assays. The cell-based results also revealed that the
effects are concentration-dependent.
Scientific research on antioxidants derived from
natural products has gained global interest mainly due to their
potential positive health effects. Oxidative stress is a condition
in which an imbalance between ROS production and antioxidants
occurs, leading to cellular damage and the dysregulation of
metabolism, associated with several pathological pathologies, such
as cancer, cardiovascular diseases, diabetes etc. (53,54).
Some phytochemicals are able to prevent damage induced by oxidative
stress, apart from scavenging free radicals (55). Recently, a number of plant and
honey phytochemicals have been recognized for their
health-promoting effects. For example, flavonoids and ascorbic acid
are some antioxidants contained in honey that have been largely
investigated for their chemopreventive effects in vivo and
in in vivo-like models (56–58).
Nevertheless, differences in the type and the quantity of these
substances that constitute the ingredients of honey, are mainly
attributed to the floral source of the honey. Findings in the
literature agree that honeys with a darker color have a higher
antioxidant capacity compared to the lighter-colored ones (59).
In order to determine the antioxidant capacity of
the raw honey samples, the present study performed cell-free and
cell-based assays. The TPC levels ranged between 1.32 mg GAE/g for
the FV honey to 0.84 mg GAE/g for the EC honey, which was the one
with the lowest polyphenol content. These levels reveal differences
from previous research, which may be due to the location of the
beehives affecting the biodiversity of the geographical region as
well (60).
Subsequently, the samples were tested for their
capacity to inhibit DPPH•, ABTS•+, and
hydroxyl and superoxide radicals. The FV, oak and FOH honeys were
the most effective in terms of their low IC50 values.
Honeydew is comprised of secretions of the living parts of plants
or the excretions sap-sucking insects; honeybees are able to find
this on plants and collect it (61). A honeydew honey has different
chemical composition compared to a nectar honey (62). Previous studies by the authors
examined the antioxidant and antimicrobial capacity of 21 types of
Greek honey and concluded that there was a correlation between the
antioxidant capacity and the polyphenolic content (63,64).
They also demonstrated the floral source-related differences in
their antioxidant activity (63).
The samples were also examined for their reducing
capacity that is strongly associated with their antioxidant
capacity. Substitutes with reducing activity are electron donors
and are able to reduce lipid peroxidation (65). According to the results obtained
herein, the oak and FOH honeys were those with the highest reducing
capacity, due to their low AU0.5 values. The study by Gül and
Pehlivan (26) demonstrated that
monofloral honeys (45% of a single pollen) had a higher reducing
capacity compared to multifloral honeys, a phenomenon which is
contradictory to the results of the present study, since the EC
honey had the lowest capacity and the oak honey exhibited similar
activity to that of the FOH honey.
In the plasmid relaxation assay, the results
revealed that the FOH and FV honeys were the most effective at
protect DNA from single-strand breaks induced by peroxyl radical
(ROO•). This assay is used in order to evaluate the antioxidant
capacity of a sample as ROO• constitute components of autoxidation
and can be easily formed by the decomposition of azo compounds
(66). A previous study
demonstrated the high efficiency of six forest honeys in inhibiting
ROO radicals compared to other types, such as chestnut and heather
honeys (67).
The antioxidant capacity of honey is
well-established, although the precise mechanisms of action are not
yet fully understood (68).
Mechanisms such as radical scavenging, hydrogen donation, metallic
ion chelation, flavonoids substrate action for hydroxyl and
superoxide radical actions are considered as possible antioxidant
mechanisms of honey (68).
Cell-free methods are reliable as a preliminary screening of the
effectiveness of the tested samples; therefore, further
investigations using cell lines may provide information regarding
the bioavailability, the metabolism and the uptake of the
antioxidants constituents of the honey (69). The use of cell-based methods can
also be used to examine the potential toxic or protective
mechanisms (48). In the present
study, a liver cancer cell line (HepG2) was used for several
reasons. These cells are characterized by a general shortage of CYP
enzymes, that are involved into the phase I metabolism of
xenobiotics in the liver. However, it is well-established that
HepG2 cells exhibit measurable activity levels of various CYP
enzymes that are responsible for the metabolic activation and
inactivation of diverse drugs and environmental compound (70). As a result, the use of the S9
fraction was not included in the present study.
GSH is the most abundant endogenous antioxidant,
playing crucial roles in the detoxification and metabolic processes
(71). GSH has the ability to
donate a hydrogen atom from its sulfhydryl group, thus scavenging
the free radicals and other electrophiles either directly or
indirectly used as a substrate by antioxidant enzymes (48,72).
In the present study, the honey samples did not induce the
production of GSH in HepG2 cells, apart from the oak honey.
Previously, a relatively high expression of some GST enzymes (e.g.,
GSTA4, GSTM2, or GSTT1) was identified in the specific cell line,
which may explain the current findings (70). Following this hypothesis, the
beneficial effects observed may not be due to GSH production. It is
worth mentioning that in the case of the F2 honey, the GSH levels
were decreased at all concentrations used, apart from the 3.125
mg/ml concentration. As regards the other examined redox
biomarkers, no effects were observed. The F1 honey sample did not
promote any alterations in the intracellular GSH levels in HepG2
cells, whereas ROS levels were decreased at all tested
concentrations. Additionally, a decrease in the levels of PCARBS
was observed at 12.5 mg/ml. Despite the fact that the F1 and F2
honey samples belong to the same floral type, significant
differences were observed in terms of their activity. Such
inconsistencies may be explained by the different locations of the
beehives, as well as the different weather conditions and soil
composition, all of these being major parameters that affect flower
biodiversity (60).
Considering the results for the EC honey, the
administration of the highest tested concentration, i.e., 25 mg/ml,
disrupted the intracellular redox balance and induced molecular
damage, as indicated by the significant increase in TBARS levels.
It may be hypothesized that the promotion of lipid peroxidation was
responsible for the increased cell death, which however was not
statistically significant, as observed in the XTT assay. In the
same sample, the lowest concentration used perturbed the redox
homeostasis, a finding supported by the elevation in PCARBS levels.
The activation of cellular antioxidant mechanisms, as indicated by
the significant increase in TAC levels, was not sufficient to
prevent oxidative protein damage. As regards the FV honey, the
highest concentrations used (6.25 and 12.5 mg/ml) reduced the
intracellular ROS levels, while an increase in lipid peroxidation
levels was observed at 12.5 mg/ml. Furthermore, the intermediate
concentrations (6.25 and 3.125 mg/ml) increased PCARBS in
comparison with the control group. Protein carbonylation is widely
used as a reliable indicator of oxidative damage (73). Protein carbonylation can impair the
functions or inhibit the activities of proteins, while the heavily
carbonylated proteins form aggregates that cannot be degraded by
the proteasomes, thus endangering cell viability (74).
FOH, a honeydew honey as previously described, is
characterized by its dark color and has a different composition due
to the plant and insect exudates (62). Previous studies have associated the
dark color of honey with the higher amount of phenolic compounds
compared to nectar honeys (62,75,76).
Some phenolic compounds, such as myricetin and pinobanksin are only
detected in honeydew honeys (62).
The antioxidant capacity is highly related to the presence of
phenolic compounds, even though constituents such as enzymes and
organic acids also affect it (62). In the present study, the FOH honey
exerted beneficial effects at the lowest and highest concentrations
used (3.125 and 25 mg/ml), whereas detrimental effects were
observed at the intermediate concentrations. To be more specific,
the concentration of 3.125 mg/ml prevented the promotion of
molecular damage, an assertion supported by the significant
decrease in TBARS levels. According to the study by Hilary et
al (77), honey is able to
reduce the MDA levels in erythrocytes produced by lipid
peroxidation, which is in agreement with the results obtained
herein for the sample forest with honeydew and F2 honey. By
contrast, the concentrations of 6.25 and 12.5 mg/ml disrupted the
redox homeostasis, as indicated by the significant decrease in the
intracellular GSH levels. Finally, the concentration of 25 mg/ml
activated the cellular antioxidant defenses, expressed by the
significant increase in TAC levels, which however, was not able to
prevent cell death, as demonstrated by the cell viability
assay.
As regards the oak honey, harmful effects were
detected at various concentrations. More elaborately, the lowest
concentration (3.125 mg/ml) perturbed the redox homeostasis, an
assertion supported by the elevated promotion in lipid
peroxidation. The activation of antioxidant defenses, expressed
through the significant increase in TAC levels, was not sufficient
to protect from the induction of molecular damage. Similarly, the
highest concentration used (25 mg/ml) disrupted the intracellular
redox homeostasis, as indicated by the significant increase in
lipid peroxidation levels. The intensification of the cellular
antioxidant defenses, evidenced by the significant increase in GSH
and TAC levels, was not able to prevent the severe oxidative damage
that led to cell death, as confirmed by the cell viability assay.
An interesting finding of the present study was the emergence of an
hormetic phenomenon in the TBARS levels. More specifically, the
elevated levels of lipid peroxidation by-products, which were
observed in the lowest concentration used, were followed by the
return of TBARS to normal levels, whereas the administration of the
highest concentration promoted lipid peroxidation once again. This
phenomenon was also observed in the TAC levels. Notably, it has
been demonstrated that moderate levels of reactive species cause
cell adaptations to stress conditions, a phenomenon known as
hormesis. Hormesis is a biological phenomenon that describes the
capability of living systems, from a single cell to an organism, to
adapt following exposure to low doses or intensity of a stressor
(78,79). The concentration-dependent response
can explain both mechanistic and biological processes, such as the
induction of toxicity, repair and recovery, giving the biological
systems an evolutionary adaptive system (80). There are several studies explaining
the emergence of biphasic dose responses in a wide range of natural
products, such as herbs, coffee and several polyphenolic compounds
(81–83).
The six samples in the present study appeared to
respond differently to the induction of the biomarkers examined,
without exhibiting any specific pattern to the honey concentration
used or in the type of biomarker measured. The global literature
indicates that honeys with different floral sources have different
biochemical profiles (84).
Factors such as the location, climatic conditions, soil composition
and the type of pollinators in the environment surrounding the
beehives affect the honey obtained (85). According to Kaškonienė and
Venskutonis (86), it is possible
that even honeys with same floral source from different locations
vary according to their composition. Apart from the floral source
and the environmental factors, the production techniques used by
the beekeepers and the storage conditions also affect the
composition (87). Tomczyk et
al (60) tested 30 types of
honey, in five subgroups, from two different countries. In order to
eliminate the floral source factor, the honeys were the same type
from both countries. The results revealed that samples of the same
variety, but from a different country, exhibited a variation in
their antioxidant capacity proving the importance of environmental
factors in terms of antioxidant activity (60). Moreover, it is possible that in the
case of investigating another cell line, the samples may exhibit a
different mode of action (37,88).
The limitations of the present study comprise the
lack of the evaluation of the bioactive compounds and of the
examination of pesticide contaminations in the honeys tested.
Nevertheless, in the present study, the aim was to investigate the
biological effects of the honey samples as a total mixture,
including all bioactive compounds. These biological effects are
categorized between the samples tested, without indicating the
biological action of specific compounds. The authors aim to conduct
measurements concerning the determination of the bioactive
compounds of these samples in future research.
According to the scientific literature, exposure to
pesticides has a substantial impact on the development and
progression of a wide spectrum of chronic diseases in human
populations, depending on the levels of environmental exposure.
Investigations using laboratory animals designed to evaluate the
toxicological profile of pesticide mixtures, administered at
concentrations below the existing regulatory limits, have revealed
the manifestation of detrimental effects when assessed by
metabolomics contrary to the conventional biochemical measurements
(89). Furthermore, previous
studies have reported that exposure to low levels of pesticides
under the long-term, low-dose regimen perturbs the redox
homeostasis and induces oxidative stress, thus causing adverse
effects on the organism level in the long term (90,91).
In the present study, organic raw honey samples were used, which
are free of pesticides (92).
In conclusion, the present study demonstrates that
the examined raw honey samples exhibited potent antiradical,
reducing and antigenotoxic properties in in vitro cell-free
systems. By contrast, most of these exerted harmful effects on the
HepG2 cell line by perturbing the redox homeostasis and by
promoting molecular damage through lipid peroxidation or protein
carbonylation. Notably, a hormetic phenomenon was observed
following treatment of the HepG2 cells with the oak honey.
Conclusively, the findings of the present study confirm the
promising role of the tested raw honey samples based on their
antioxidant capacity and on their ability to disrupt the redox
balance in HepG2 cells. Considering the complex effects that were
detected at various concentrations in the cell-based systems,
further investigations are required using biological systems of
higher levels to elucidate the molecular mechanisms of action of
the samples. Towards this direction, it is of paramount importance
to evaluate their redox-related properties in vivo.
Supplementary Material
Supporting Data
Acknowledgements
Not applicable.
Funding
Funding: No funding was received.
Availability of data and materials
The datasets used and/or analyzed during the
current study are available from the corresponding author on
reasonable request.
Authors' contributions
DK supervised the study and conceived the technical
details and designed the experiments. DAS participated in designing
the present study and in reviewing the data. AP performed the
experiments. AP, ZS and PV analyzed the data. AP and DK confirm the
authenticity of all the raw data. AP, PV and ZS wrote the
manuscript. All authors have read and approved the final version of
the manuscript.
Ethics approval and consent to
participate
Not applicable.
Patient consent for publication
Not applicable.
Competing interests
DAS is the Editor-in-Chief for the journal, but had
no personal involvement in the reviewing process, or any influence
in terms of adjudicating on the final decision, for this article.
The other authors declare that they have no competing
interests.
Glossary
Abbreviations
Abbreviations:
|
GSH
|
glutathione
|
|
ROS
|
reactive oxygen species
|
|
GST
|
glutathione S-transferase
|
|
CAT
|
catalase
|
|
MDA
|
malondialdehyde
|
|
dH2O
|
deionized water
|
|
TPC
|
total phenolic content
|
|
NO
|
nitric oxide
|
|
FC
|
folin-ciocalteu
|
|
GAEs
|
gallic acid equivalents
|
|
RSC
|
radical scavenging
|
|
HRP
|
horseradish peroxidase
|
|
RT
|
room temperature
|
|
TCA
|
trichloroacetic acid
|
|
TAC
|
total antioxidant capacity
|
|
TBARS
|
thiobarbituric acid reactive
substances
|
|
TBA
|
thiobarbituric acid
|
|
DNPH
|
2,4-dinitrophenylhydrazine
|
|
DPPH•
|
2,2-diphenyl-1-picrylhydrazyl
|
|
DPPH:H
|
2,2-diphenyl-1-picrylhydrazine
|
|
ROO
|
peroxyl radical
|
|
PCARBS
|
protein carbonyls
|
|
SD
|
standard error
|
|
SEM
|
standard error of the mean
|
References
|
1
|
Tahir HE, Xiaobo Z, Zhihua L, Jiyong S,
Zhai X, Wang S and Mariod AA: Rapid prediction of phenolic
compounds and antioxidant activity of Sudanese honey using Raman
and Fourier transform infrared (FT-IR) spectroscopy. Food Chem.
226:202–211. 2017. View Article : Google Scholar : PubMed/NCBI
|
|
2
|
Di Marco G, Manfredini A, Leonardi D,
Canuti L, Impei S, Gismondi A and Canini A: Geographical, botanical
and chemical profile of monofloral Italian honeys as food quality
guarantee and territory brand. Plant Biosyst. 151:450–463. 2017.
View Article : Google Scholar
|
|
3
|
Martinello M and Mutinelli F: Antioxidant
activity in bee products: A review. Antioxidants (Basel).
10:712021. View Article : Google Scholar : PubMed/NCBI
|
|
4
|
Alvarez-Suarez JM, Gasparrini M,
Forbes-Hernández TY, Mazzoni L and Giampieri F: The composition and
biological activity of honey: A focus on manuka honey. Foods.
3:420–432. 2014. View Article : Google Scholar : PubMed/NCBI
|
|
5
|
Samarghandian S, Farkhondeh T and Samini
F: Honey and health: A review of recent clinical research.
Pharmacognosy Res. 9:121–127. 2017.PubMed/NCBI
|
|
6
|
Bogdanov S, Jurendic T, Sieber R and
Gallmann P: Honey for nutrition and health: A review. J Am Coll
Nutr. 27:677–689. 2008. View Article : Google Scholar : PubMed/NCBI
|
|
7
|
Alvarez-Suarez J, Giampieri F and Battino
M: Honey as a source of dietary antioxidants: Structures,
bioavailability and evidence of protective effects against human
chronic diseases. Curr Med Chem. 20:621–638. 2013. View Article : Google Scholar : PubMed/NCBI
|
|
8
|
Gheldof N, Wang XH and Engeseth NJ:
Buckwheat honey increases serum antioxidant capacity in humans. J
Agric Food Chem. 51:1500–1505. 2003. View Article : Google Scholar : PubMed/NCBI
|
|
9
|
Meo SA, Al-Asiri SA, Mahesar AL and Ansari
MJ: Role of honey in modern medicine. Saudi J Biol Sci. 24:975–978.
2017. View Article : Google Scholar : PubMed/NCBI
|
|
10
|
Al-Waili NS and Boni NS: Natural honey
lowers plasma prostaglandin concentrations in normal individuals. J
Med Food. 6:129–133. 2003. View Article : Google Scholar : PubMed/NCBI
|
|
11
|
Patton T, Barrett J, Brennan J and Moran
N: Use of a spectrophotometric bioassay for determination of
microbial sensitivity to manuka honey. J Microbiol Methods.
64:84–95. 2006. View Article : Google Scholar : PubMed/NCBI
|
|
12
|
Erejuwa OO: Effect of honey in diabetes
mellitus: Matters arising. J Diabetes Metab Disord. 13:232014.
View Article : Google Scholar : PubMed/NCBI
|
|
13
|
Jiang L, Xie M, Chen G, Qiao J, Zhang H
and Zeng X: Phenolics and carbohydrates in buckwheat honey regulate
the human intestinal microbiota. Evid Based Complement Alternat
Med. 2020:64329422020. View Article : Google Scholar : PubMed/NCBI
|
|
14
|
Azman KF, Zakaria R, Othman Z and Abdul
Aziz CB: Neuroprotective effects of Tualang honey against oxidative
stress and memory decline in young and aged rats exposed to noise
stress. J Taibah Univ Sci. 12:273–284. 2018. View Article : Google Scholar
|
|
15
|
Erejuwa OO, Sulaiman SA and Ab Wahab MS:
Effects of honey and its mechanisms of action on the development
and progression of cancer. Molecules. 19:2497–2522. 2014.
View Article : Google Scholar : PubMed/NCBI
|
|
16
|
Candiracci M, Piatti E, Dominguez-Barragán
M, García-Antrás D, Morgado B, Ruano D, Gutiérrez JF, Parrado J and
Castaño A: Anti-inflammatory activity of a honey flavonoid extract
on lipopolysaccharide-activated N13 microglial cells. J Agric Food
Chem. 60:12304–12311. 2012. View Article : Google Scholar : PubMed/NCBI
|
|
17
|
Chan CW, Deadman BJ, Manley-Harris M,
Wilkins AL, Alber DG and Harry E: Analysis of the flavonoid
component of bioactive New Zealand mānuka (Leptospermum scoparium)
honey and the isolation, characterisation and synthesis of an
unusual pyrrole. Food Chem. 141:1772–1781. 2013. View Article : Google Scholar : PubMed/NCBI
|
|
18
|
Sergiel I, Pohl P and Biesaga M:
Characterisation of honeys according to their content of phenolic
compounds using high performance liquid chromatography/tandem mass
spectrometry. Food Chem. 145:404–408. 2014. View Article : Google Scholar : PubMed/NCBI
|
|
19
|
Jaganathan SK and Mandal M:
Antiproliferative effects of honey and of its polyphenols: A
review. J Biomed Biotechnol. 2009:8306162009. View Article : Google Scholar : PubMed/NCBI
|
|
20
|
Alshammari GM, Ahmed MA, Alsulami T,
Hakeem MJ, Ibraheem MA and Al-Nouri DM: Phenolic compounds,
antioxidant activity, ascorbic acid, and sugars in honey from
ingenious hail province of Saudi Arabia. Appl Sci. 12:83342022.
View Article : Google Scholar
|
|
21
|
Thakur M, Singh K and Khedkar R:
11-Phytochemicals: Extraction process, safety assessment,
toxicological evaluations, and regulatory issues. Funct Preserv
Prop Phytochem. 341–361. 2020.
|
|
22
|
Arathi HS and Bernklau E:
Context-dependent effect of dietary phytochemicals on honey bees
exposed to a pesticide, thiamethoxam. J Insect Sci. 21:112021.
View Article : Google Scholar
|
|
23
|
Liu JR, Ye YL, Lin TY, Wang YW and Peng
CC: Effect of floral sources on the antioxidant, antimicrobial, and
anti-inflammatory activities of honeys in Taiwan. Food Chem.
139:938–943. 2013. View Article : Google Scholar : PubMed/NCBI
|
|
24
|
Pita-Calvo C and Vázquez M: Differences
between honeydew and blossom honeys: A review. Trends Food Sci
Technol. 59:79–87. 2017. View Article : Google Scholar
|
|
25
|
Villalpando-Aguilar JL, Quej-Chi VH,
López-Rosas I, Cetzal-Ix W, Aquino-Luna VÁ, Alatorre-Cobos F and
Martínez-Puc JF: Pollen types reveal floral diversity in natural
honeys from campeche, Mexico. Diversity. 14:7402022. View Article : Google Scholar
|
|
26
|
Gül A and Pehlivan T: Antioxidant
activities of some monofloral honey types produced across Turkey.
Saudi J Biol Sci. 25:1056–1065. 2018. View Article : Google Scholar : PubMed/NCBI
|
|
27
|
Porcza LM, Simms C and Chopra M: Honey and
cancer: Current status and future directions. Diseases. 4:302016.
View Article : Google Scholar : PubMed/NCBI
|
|
28
|
Hossain KS, Hossain MG, Moni A, Rahman MM,
Rahman UH, Alam M, Kundu S, Rahman MM, Hannan MA and Uddin MJ:
Prospects of honey in fighting against COVID-19: Pharmacological
insights and therapeutic promises. Heliyon. 6:e057982020.
View Article : Google Scholar : PubMed/NCBI
|
|
29
|
Aliyu M, Odunola OA, Farooq AD, Rasheed H,
Mesaik AM, Choudhary MI, Channa IS, Khan SA and Erukainure OL:
Molecular mechanism of antiproliferation potential of Acacia honey
on NCI-H460 cell line. Nutr Cancer. 65:296–304. 2013. View Article : Google Scholar : PubMed/NCBI
|
|
30
|
Pichichero E, Cicconi R, Mattei M, Muzi MG
and Canini A: Acacia honey and chrysin reduce proliferation of
melanoma cells through alterations in cell cycle progression. Int J
Oncol. 37:973–981. 2010.PubMed/NCBI
|
|
31
|
Samarghandian S, Azimi Nezhad M and
Mohammadi G: Role of caspases, Bax and Bcl-2 in chrysin-induced
apoptosis in the A549 human lung adenocarcinoma epithelial cells.
Anticancer Agents Med Chem. 14:901–909. 2014. View Article : Google Scholar : PubMed/NCBI
|
|
32
|
Hassan MI, Mabrouk GM, Shehata HH and
Aboelhussein MM: Antineoplastic effects of bee honey and Nigella
sativa on hepatocellular carcinoma cells. Integr Cancer Ther.
11:354–363. 2012. View Article : Google Scholar : PubMed/NCBI
|
|
33
|
Pasupuleti VR, Sammugam L, Ramesh N and
Gan SH: Honey, propolis, and royal jelly: A comprehensive review of
their biological actions and health benefits. Oxid Med Cell Longev.
2017:12595102017. View Article : Google Scholar : PubMed/NCBI
|
|
34
|
Abdel Aziz Baiomy A, Rady HM, Amer MA and
Kiwan HS: Effect of some honey bee extracts on the proliferation,
proteolytic and gelatinolytic activities of the hepatocellular
carcinoma Hepg2 cell line. Aust J Basic Appl Sci. 3:2754–2769.
2009.
|
|
35
|
Singleton VL, Orthofer R and
Lamuela-Raventós RM: [14] Analysis of total phenols and other
oxidation substrates and antioxidants by means of folin-ciocalteu
reagent. Methods Enzymol. 299:152–178. 1999. View Article : Google Scholar
|
|
36
|
Brand-Williams W, Cuvelier ME and Berset
C: Use of a free radical method to evaluate antioxidant activity.
LWT-Food Sci Technol. 28:25–30. 1995. View Article : Google Scholar
|
|
37
|
Kouka P, Tekos F, Valta K, Mavros P,
Veskoukis AS, Angelis A, Skaltsounis AL and Kouretas D: Οlive tree
blossom polyphenolic extracts exert antioxidant and antimutagenic
activities in vitro and in various cell lines. Oncol Rep.
42:2814–2825. 2019.PubMed/NCBI
|
|
38
|
Kyriazis ID, Skaperda Z, Tekos F, Makri S,
Vardakas P, Vassi E, Patouna A, Terizi K, Angelakis C and Kouretas
D: Methodology for the biofunctional assessment of honey (review).
Int J Funct Nutr. 2:1–11. 2021. View Article : Google Scholar : PubMed/NCBI
|
|
39
|
Chung SK, Osawa T and Kawakishi S:
Hydroxyl radical-scavenging effects of spices and scavengers from
brown mustard (Brassica nigra). Biosci Biotechnol Biochem.
61:118–123. 1997. View Article : Google Scholar : PubMed/NCBI
|
|
40
|
Veskoukis A, Kerasioti E, Priftis A, Kouka
P, Spanidis Y, Makri S and Kouretas D: A battery of translational
biomarkers for the assessment of the in vitro and in vivo
antioxidant action of plant polyphenolic compounds: The biomarker
issue. Curr Opin Toxicol. 13:99–109. 2019. View Article : Google Scholar
|
|
41
|
Gülçin I, Küfrevioglu OI, Oktay M and
Büyükokuroglu ME: Antioxidant, antimicrobial, antiulcer and
analgesic activities of nettle (Urtica dioica L.). J
Ethnopharmacol. 90:205–215. 2004. View Article : Google Scholar : PubMed/NCBI
|
|
42
|
Priftis A, Mitsiou D, Halabalaki M, Ntasi
G, Stagos D, Skaltsounis LA and Kouretas D: Roasting has a distinct
effect on the antimutagenic activity of coffee varieties. Mutat Res
Toxicol Environ Mutagen. 829–830. 33–42. 2018.PubMed/NCBI
|
|
43
|
Tekos F, Makri S, Skaperda ZV, Patouna A,
Terizi K, Kyriazis ID, Kotseridis Y, Mikropoulou EV, Papaefstathiou
G, Halabalaki M and Demetrios K: Assessment of antioxidant and
antimutagenic properties of red and white wine extracts in vitro.
Metabolites. 11:4362021. View Article : Google Scholar : PubMed/NCBI
|
|
44
|
Yen GC and Duh PD: Antioxidative
properties of methanolic extracts from peanut hulls. J Am Oil Chem
Soc. 70:383–386. 1993. View Article : Google Scholar
|
|
45
|
Kerasioti E, Stagos D, Priftis A,
Aivazidis S, Tsatsakis AM, Hayes AW and Kouretas D: Antioxidant
effects of whey protein on muscle C2C12 cells. Food Chem.
155:271–278. 2014. View Article : Google Scholar : PubMed/NCBI
|
|
46
|
Jurič A, Huđek Turković A, Brčić Karačonji
I, Prđun S, Bubalo D and Durgo K: Cytotoxic activity of strawberry
tree (Arbutus unedo L.) honey, its extract, and homogentisic acid
on CAL 27, HepG2, and Caco-2 cell lines. Arh Hig Rada Toksikol.
73:158–168. 2022.PubMed/NCBI
|
|
47
|
Sun J, Zhang L, Zhang X, Hu Y, Ge C and
Fang J: An ultrafast turn-on thiol probe for protein labeling and
bioimaging. Analyst. 141:2009–2015. 2016. View Article : Google Scholar : PubMed/NCBI
|
|
48
|
Skaperda Z, Kyriazis ID, Vardakas P, Tekos
F, Antoniou K, Giannakeas N and Kouretas D: In vitro antioxidant
properties of herb decoction extracts derived from Epirus, Greece.
Int J Funct Nutr. 2:1–13. 2021. View Article : Google Scholar : PubMed/NCBI
|
|
49
|
Patsoukis N, Zervoudakis G, Panagopoulos
NT, Georgiou CD, Angelatou F and Matsokis NA: Thiol redox state
(TRS) and oxidative stress in the mouse hippocampus after
pentylenetetrazol-induced epileptic seizure. Neurosci Lett.
357:83–86. 2004. View Article : Google Scholar : PubMed/NCBI
|
|
50
|
Janaszewska A and Bartosz G: Assay of
total antioxidant capacity: Comparison of four methods as applied
to human blood plasma. Scand J Clin Lab Invest. 231–236. 2002.
View Article : Google Scholar : PubMed/NCBI
|
|
51
|
Keles MS, Taysi S, Sen N, Aksoy H and
Akçay F: Effect of corticosteroid therapy on serum and CSF
malondialdehyde and antioxidant proteins in multiple sclerosis. Can
J Neurol Sci. 28:141–143. 2001. View Article : Google Scholar : PubMed/NCBI
|
|
52
|
Skaperda Z, Argyriadou A, Nechalioti PM,
Alvanou M, Makri S, Bouroutzika E, Kyriazis ID, Tekos F, Veskoukis
AS, Kallitsis T, et al: Redox biomarker baseline levels in cattle
tissues and their relationships with meat quality. Antioxidants
(Basel). 10:9582021. View Article : Google Scholar : PubMed/NCBI
|
|
53
|
Zhou J, Li P, Cheng N, Gao H, Wang B, Wei
Y and Cao W: Protective effects of buckwheat honey on DNA damage
induced by hydroxyl radicals. Food Chem Toxicol. 50:2766–2773.
2012. View Article : Google Scholar : PubMed/NCBI
|
|
54
|
Kerasioti E, Stagos D, Georgatzi V, Bregou
E, Priftis A, Kafantaris I and Kouretas D: Antioxidant effects of
sheep whey protein on endothelial cells. Oxid Med Cell Longev.
2016:65857372016. View Article : Google Scholar : PubMed/NCBI
|
|
55
|
Yao Y, Wang H, Xu F, Zhang Y, Li Z, Ju X
and Wang L: Insoluble-bound polyphenols of adlay seed ameliorate
H2O2-induced oxidative stress in HepG2 cells via Nrf2 signalling.
Food Chem. 325:1268652020. View Article : Google Scholar : PubMed/NCBI
|
|
56
|
Rodríguez-García C, Sánchez-Quesada C and
J Gaforio J: Dietary flavonoids as cancer chemopreventive agents:
An updated review of human studies. Antioxidants (Basel).
8:1372019. View Article : Google Scholar : PubMed/NCBI
|
|
57
|
George VC, Dellaire G and Rupasinghe HPV:
Plant flavonoids in cancer chemoprevention: Role in genome
stability. J Nutr Biochem. 45:1–14. 2017. View Article : Google Scholar : PubMed/NCBI
|
|
58
|
Li Z, He P, Long Y, Yuan G, Shen W, Chen
Z, Zhang B, Wang Y, Yue D, Seidl C and Zhang X: Drug repurposing of
pantoprazole and vitamin C targeting tumor microenvironment
conditions improves anticancer effect in metastatic
castration-resistant prostate cancer. Front Oncol. 11:6603202021.
View Article : Google Scholar : PubMed/NCBI
|
|
59
|
Saranraj P, Sivasakthi S and Feliciano GD:
Pharmacology of honey: A review. Adv Biol Res. 10:271–289.
2016.
|
|
60
|
Tomczyk M, Tarapatskyy M and Dżugan M: The
influence of geographical origin on honey composition studied by
Polish and Slovak honeys. Czech J Food Sci. 37:232–238. 2019.
View Article : Google Scholar
|
|
61
|
Jerković I and Marijanović Z: Oak (Quercus
frainetto Ten.) honeydew honey-approach to screening of volatile
organic composition and antioxidant capacity (DPPH and FRAP assay).
Molecules. 15:3744–3756. 2010. View Article : Google Scholar : PubMed/NCBI
|
|
62
|
Seraglio SKT, Silva B, Bergamo G,
Brugnerotto P, Gonzaga LV, Fett R and Costa ACO: An overview of
physicochemical characteristics and health-promoting properties of
honeydew honey. Food Res Int. 119:44–66. 2019. View Article : Google Scholar : PubMed/NCBI
|
|
63
|
Stagos D, Soulitsiotis N, Tsadila C,
Papaeconomou S, Arvanitis C, Ntontos A, Karkanta F,
Adamou-Androulaki S, Petrotos K, Spandidos DA, et al: Antibacterial
and antioxidant activity of different types of honey derived from
Mount Olympus in Greece. Int J Mol Med. 42:726–734. 2018.PubMed/NCBI
|
|
64
|
Karydas C, Iatrou M, Kouretas D, Patouna
A, Iatrou G, Lazos N, Gewehr S, Tseni X, Tekos F, Zartaloudis Z, et
al: Prediction of antioxidant activity of cherry fruits from UAS
multispectral imagery using machine learning. Antioxidants (Basel).
9:1562020. View Article : Google Scholar : PubMed/NCBI
|
|
65
|
Lobo V, Patil A, Phatak A and Chandra N:
Free radicals, antioxidants and functional foods: Impact on human
health. Pharmacogn Rev. 4:118–126. 2010. View Article : Google Scholar : PubMed/NCBI
|
|
66
|
MacDonald-Wicks LK, Wood LG and Garg ML:
Methodology for the determination of biological antioxidant
capacity in vitro: A review. J Sci Food Agric. 86:2046–2056. 2006.
View Article : Google Scholar
|
|
67
|
Tahirović I, Helbet D, Gaštan A, Buza N,
Dizdar M, Topčagić A, Toromanović J, Čopra-Janićijević A and
Kurtagić H: Hydrophilic antioxidant scores against hydroxyl and
peroxyl radicals in honey samples from Bosnia and Herzegovina.
CMBEBIH 2017. IFMBE Proceedings. Badnjevic A: 62. Springer;
Singapore: pp. 429–434. 2017, View Article : Google Scholar
|
|
68
|
Ahmed S, Sulaiman SA, Baig AA, Ibrahim M,
Liaqat S, Fatima S, Jabeen S, Shamim N and Othman NH: Honey as a
potential natural antioxidant medicine: An insight into its
molecular mechanisms of action. Oxid Med Cell Longev.
2018:83678462018. View Article : Google Scholar : PubMed/NCBI
|
|
69
|
Deng J, Liu R, Lu Q, Hao P, Xu A, Zhang J
and Tan J: Biochemical properties, antibacterial and cellular
antioxidant activities of buckwheat honey in comparison to manuka
honey. Food Chem. 252:243–249. 2018. View Article : Google Scholar : PubMed/NCBI
|
|
70
|
Donato MT, Tolosa L and Gómez-Lechón MJ:
Culture and functional characterization of human hepatoma HepG2
cells. Vinken M and Rogiers V: Protocols in In Vitro Hepatocyte
Research. Methods in Molecular Biology. 1250. Humana Press; New
York, NY: pp. 77–93. 2015, View Article : Google Scholar : PubMed/NCBI
|
|
71
|
Townsend DM, Tew KD and Tapiero H: The
importance of glutathione in human disease. Biomed Pharmacother.
57:145–155. 2003. View Article : Google Scholar : PubMed/NCBI
|
|
72
|
Aquilano K, Baldelli S and Ciriolo MR:
Glutathione: New roles in redox signaling for an old antioxidant.
Front Pharmacol. 5:1962014. View Article : Google Scholar : PubMed/NCBI
|
|
73
|
Fernando N, Wickremesinghe S, Niloofa R,
Rodrigo C, Karunanayake L, de Silva HJ, Wickremesinghe AR,
Premawansa S, Rajapakse S and Handunnetti SM: Protein carbonyl as a
biomarker of oxidative stress in severe leptospirosis, and its
usefulness in differentiating leptospirosis from dengue infections.
PLoS One. 11:e01560852016. View Article : Google Scholar : PubMed/NCBI
|
|
74
|
Akagawa M: Protein carbonylation:
Molecular mechanisms, biological implications, and analytical
approaches. Free Radic Res. 55:307–320. 2021. View Article : Google Scholar : PubMed/NCBI
|
|
75
|
Özcan MM and Ölmez Ç: Some qualitative
properties of different monofloral honeys. Food Chem. 163:212–218.
2014. View Article : Google Scholar : PubMed/NCBI
|
|
76
|
Starowicz M, Ostaszyk A and Zieliński H:
The relationship between the browning index, total phenolics,
color, and antioxidant activity of Polish-originated honey samples.
Foods. 10:9672021. View Article : Google Scholar : PubMed/NCBI
|
|
77
|
Hilary S, Habib H, Souka U, Ibrahim W and
Platat C: Bioactivity of arid region honey: An in vitro study. BMC
Complement Altern Med. 17:1772017. View Article : Google Scholar : PubMed/NCBI
|
|
78
|
Calabrese V, Cornelius C, Dinkova-Kostova
AT, Calabrese EJ and Mattson MP: Cellular stress responses, the
hormesis paradigm, and vitagenes: Novel targets for therapeutic
intervention in neurodegenerative disorders. Antioxid Redox Signal.
13:1763–1811. 2010. View Article : Google Scholar : PubMed/NCBI
|
|
79
|
Jalal A, Oliveira Junior JC, Ribeiro JS,
Fernandes GC, Mariano GG, Trindade VDR and Reis ARD: Hormesis in
plants: Physiological and biochemical responses. Ecotoxicol Environ
Saf. 207:1112252021. View Article : Google Scholar : PubMed/NCBI
|
|
80
|
Calabrese EJ: Hormesis: Path and
progression to significance. Int J Mol Sci. 19:28712018. View Article : Google Scholar : PubMed/NCBI
|
|
81
|
Calabrese V, Cornelius C, Dinkova-Kostova
AT, Iavicoli I, Di Paola R, Koverech A, Cuzzocrea S, Rizzarelli E
and Calabrese EJ: Cellular stress responses, hormetic
phytochemicals and vitagenes in aging and longevity. Biochim
Biophys Acta. 1822:753–783. 2012. View Article : Google Scholar : PubMed/NCBI
|
|
82
|
Skaperda Z, Tekos F, Vardakas P, Nepka C
and Kouretas D: Reconceptualization of hormetic responses in the
frame of redox toxicology. Int J Mol Sci. 23:492021. View Article : Google Scholar : PubMed/NCBI
|
|
83
|
Dey A, Guha P, Chattopadhyay S and
Bandyopadhyay SK: Biphasic activity of resveratrol on
indomethacin-induced gastric ulcers. Biochem Biophys Res Commun.
381:90–95. 2009. View Article : Google Scholar : PubMed/NCBI
|
|
84
|
Ciucure CT and Geană EI: Phenolic
compounds profile and biochemical properties of honeys in
relationship to the honey floral sources. Phytochem Anal.
30:481–492. 2019. View Article : Google Scholar : PubMed/NCBI
|
|
85
|
Gismondi A, De Rossi S, Canuti L, Novelli
S, Di Marco G, Fattorini L and Canini A: From Robinia pseudoacacia
L. nectar to Acacia monofloral honey: Biochemical changes and
variation of biological properties. J Sci Food Agric. 98:4312–4322.
2018. View Article : Google Scholar : PubMed/NCBI
|
|
86
|
Kaškonienė V and Venskutonis PR: Floral
markers in honey of various botanical and geographic origins: A
review. Compr Rev Food Sci Food Saf. 9:620–634. 2010. View Article : Google Scholar : PubMed/NCBI
|
|
87
|
Soares S, Pinto D, Rodrigues F, Alves RC
and Oliveira MBPP: Portuguese honeys from different geographical
and botanical origins: A 4-year stability study regarding quality
parameters and antioxidant activity. Molecules. 22:13382017.
View Article : Google Scholar : PubMed/NCBI
|
|
88
|
Priftis A, Panagiotou EM, Lakis K, Plika
C, Halabalaki M, Ntasi G, Veskoukis AS, Stagos D, Skaltsounis LA
and Kouretas D: Roasted and green coffee extracts show antioxidant
and cytotoxic activity in myoblast and endothelial cell lines in a
cell specific manner. Food Chem Toxicol. 114:119–127. 2018.
View Article : Google Scholar : PubMed/NCBI
|
|
89
|
Mesnage R, Teixeira M, Mandrioli D,
Falcioni L, Ibragim M, Ducarmon QR, Zwittink RD, Amiel C, Panoff
JM, Bourne E, et al: Multi-omics phenotyping of the gut-liver axis
reveals metabolic perturbations from a low-dose pesticide mixture
in rats. Commun Biol. 4:4712021. View Article : Google Scholar : PubMed/NCBI
|
|
90
|
Vardakas P, Veskoukis AS, Rossiou D,
Gournikis C, Kapetanopoulou T, Karzi V, Docea AO, Tsatsakis A and
Kouretas D: A mixture of endocrine disruptors and the pesticide
roundup® induce oxidative stress in rabbit liver when
administered under the long-term low-dose regimen: Reinforcing the
notion of real-life risk simulation. Toxics. 10:1902022. View Article : Google Scholar : PubMed/NCBI
|
|
91
|
Fountoucidou P, Veskoukis AS, Kerasioti E,
Docea AO, Taitzoglou IA, Liesivuori J, Tsatsakis A and Kouretas D:
A mixture of routinely encountered xenobiotics induces both redox
adaptations and perturbations in blood and tissues of rats after a
long-term low-dose exposure regimen: The time and dose issue.
Toxicol Lett. 317:24–44. 2019. View Article : Google Scholar : PubMed/NCBI
|
|
92
|
Panseri S, Bonerba E, Nobile M, Di Cesare
F, Mosconi G, Cecati F, Arioli F, Tantillo G and Chiesa L:
Pesticides and environmental contaminants in organic honeys
according to their different productive areas toward food safety
protection. Foods. 9:18632020. View Article : Google Scholar : PubMed/NCBI
|