Introduction
MicroRNA (miRNA/miR) isoforms (isomiRs) with 5′ or
3′ end lengths differ from those of the canonical sequences
registered in the microRNA database and can be detected using
next-generation sequencing of small RNAs (1,2).
Systematic analyses have revealed that these isoforms are not
solely degradation intermediates but also enable recruitment to the
RNA-induced silencing complex to suppress target mRNAs (3–5).
IsomiRs are generated from a unique miRNA precursor (pre-miRNA)
during RNA processing and have been detected in blood, urine and
milk (6–10). Accumulating data have revealed
that, in a substantial number of miRNAs, sequences corresponding to
specific isomiRs, not the canonical form, are the most abundant
(3,11–15).
In next-generation sequencing, sequences of 5′-isomiRs are observed
at a lower frequency (5–15%) than that of 3′ isomiRs (40–50%)
(16). A canonical type and
relevant isomiRs derived from a pre-miRNA can function
cooperatively on common target mRNAs based on different affinities
(17,18).
The ‘seed sequence’, used by miRNAs to bind to the
3′-untranslated regions of target mRNAs, is located 2–8 nucleotides
from the 5′ end of the miRNAs; consequently, shifts in the 5′ end
can cause seed shifts (19,20).
In fact, some naturally co-expressed 5′-isomiRs can act on
individual target mRNAs that are distinct from those of the
canonical type (5,18,21).
In such cases, it is necessary to discriminate and quantify the
specific 5′-isomiR. However, in deep sequencing, reads of relevant
isomiRs are generally included in the total number of reads for the
miRNA. In addition, the individuality of such 5′-isomiRs is
currently ignored in reverse transcription-quantitative (RT-q) PCR
as commercially available protocols for miRNA are unable to
discriminate among sequences based on the 5′ end, although these
can identify a single nucleotide difference in the center of the
miRNA (22–25).
miR-1246 is abundant in serum exosomes and could
serve as a candidate marker for various cancers (26–30).
Using RNA deep sequencing, the authors previously identified a
5′-isomiR of miR-1246, two bases shorter than the canonical
sequence, which was extremely abundant in the serum of a patient
with non-small cell lung cancer (NSCLC) and increased with
recurrence (31). The present
study analyzed the 5′ end-sequence of miR-1246 in the sera of 20
patients with NSCLC using fragment analysis and 5′ end-specific
RT-qPCR.
Materials and methods
Patients and clinical specimens
The protocol of the present study was approved by
the Ethics Committee of the Faculty of Medicine (approval no.
H26-010) and the Ethics Committee of the Faculty of Health Sciences
(approval no. 2019-45), Kyorin University. All Japanese
participants provided signed informed consent. Serum samples were
collected between October 2014 and May 2016 at the Kyorin
University Hospital, Japan, from 20 patients with non-small cell
lung cancer (NSCLC) and 20 cancer-free control participants
(Table I). Histological typing and
staging of the tumors were performed according to the World Health
Organization criteria (32) and
the seventh edition of TNM classification of malignant tumors
(33), respectively. Blood samples
were collected prior to all therapeutic procedures. Peripheral
blood was collected in VP-AS109K Vacutainer tubes (Terumo
Corporation), kept at room temperature (20–25°C) for 30 min and
then centrifuged at 1,500 × g for 10 min at 4°C to separate the
serum. Thereafter, the serum was centrifuged at 20,000 × g for 10
min at 4°C to remove cell debris, divided into 200 µl aliquots and
stored at −80°C until further use. Pooled serum was prepared by
mixing equal volumes of serum from 55 healthy individuals [male:
n=13, female: n=42; age (mean): 40.1 years].
 | Table I.Characteristics of patients with
NSCLC and control subjects. |
Table I.
Characteristics of patients with
NSCLC and control subjects.
|
Characteristics | No. of patients
with NSCLC (%) | No. of control
subjects (%) | P-value |
|---|
| Total | 20 | 20 |
|
| Age, years |
|
|
|
|
≤60 | 9 (45.0) | 7 (35.0) | 0.374 |
|
>60 | 11 (55.0) | 13 (65.0) |
|
| Sex |
|
| 0.257 |
|
Male | 14 (70.0) | 11 (55.0) |
|
|
Female | 6 (30.0) | 9 (45.0) |
|
| Smoking status |
|
| 0.048 |
|
Former/never | 10 (50.0) | 16 (80.0) |
|
|
Current | 10 (50.0) | 4 (20.0) |
|
| Lung cancer
stage |
|
|
|
|
III | 3 (15.0) |
|
|
| IV | 17 (85.0) |
|
|
| Type of
carcinoma |
|
|
|
| AC | 20 (100.0) |
|
|
Target prediction for isomiRs
Target prediction for miR-1246 isomiRs was performed
using miRDB-Custom Prediction (https://mirdb.org/custom.html).
Oligonucleotides
The oligonucleotides used in the present study are
listed in Table II. Primers were
synthesized by Life Technologies Japan Ltd. and RNA and chimera
adaptors were synthesized by Sigma-Aldrich (Merck KGaA). The
notation of isomiRs was performed according to the method reported
by Telonis et al (34). The
canonical type (miR-1246 |0|0|) and 5′-isomiRs (miR-1246 |-1|0| and
miR-1246 |-2|0|) of Homo sapiens miR-1246 and
Caenorhabditis elegans cel-miR-39-3p, were
5′-phosphorylated. The chimera 5′ adaptors, Adp1 (protocol I) and
Adp2 (protocol II), were 5′-biotinylated and two ribonucleotides
were added at the 3′ ends. The PCR reverse primers, used in the
allele-specific PCR (AS-PCR) for 5′ isomiR quantification,
contained one mismatch nucleotide at the 3′ region to prevent cross
reactions (35).
| Table II.Oligonucleotides used in the present
study. |
Table II.
Oligonucleotides used in the present
study.
| A, RNAs
(5′-Phospholilated, 3′-OH) |
|---|
|
|---|
| Name | Sequence
(5′-3′)a,b |
|---|
| miR1246 |0|0| |
AAUGGAUUUUUGGAGCAGG |
| miR1246 |-1|0| |
AUGGAUUUUUGGAGCAGG |
| miR1246 |-2|0| |
UGGAUUUUUGGAGCAGG |
| cel-miR-39-3p |
UCACCGGGUGUAAAUCAGCUUG |
|
| B, 5′ adaptors
(5′-Biotinylated, 3′-OH) |
|
| Name | Sequence
(5′-3′)a,b |
|
| Adp1 |
CTACGACTACATCCCAGGCTCCATAACTCCCACACACC- |
|
| AGAACGAACCrArC |
| Adp2 |
CTACGACTACAACGATAACTCGCACACACCAGAACGAArCrC |
|
| C, RT
primers |
|
| Name | Sequence
(5′-3′)a,b |
|
| 1246 FRG-RT |
CCTGCTCCAAAAATCC |
| cel-39 FRG-RT |
CAAGCTGATTTACACCC |
|
| D, PCR
primers |
|
| Name | Sequence
(5′-3′)a,b |
|
| Adp1-F |
cccacCTACGACTACATCCCAG |
| 1246 FRG-R |
FAM-cgcataCCTGCTCCAAAAATCCA |
| Cel-39 FRG-R |
FAM-gcataCAAGCTGATTTACACCCG |
| Adp2-F |
cacCTACGACTACAACGATAACTCG |
| U2 FRG-R |
FAM-gcataCCTGCTCCAAAAATCCA |
| c1-R |
ACCCTGCTCCAAAAATCCATTGG |
| c2-R |
CCTGCTCCAAAAATCCGTTGG |
| i1-R |
ACCCTGCTCCAAAAATCGATGG |
| i2-R |
ACCCTGCTCCAAAAATCGAGG |
| Cel-junc-R |
AAGCTGATTTACACCCGATGAGG |
| U2 miR-X F |
CCAATGGATTTTTGGAGCAGG |
| cel-39 miR-X F |
CACCGGGTGTAAATCAGCTTG |
|
| E, DNA |
|
| Name | Sequence
(5′-3′)a,b |
|
|
Adp1-miR1246|0|0|-cDNA |
CCTGCTCCAAAAATCCATTGTGGTTCGTTCTGGTGTGT- |
|
|
GGGAGTTATGGAGCCTGGGATGTAGTCGTAG |
Serum RNA extraction
The miRNeasy Serum/Plasma kit (Qiagen GmbH) was used
for small RNA extraction. Briefly, 3.5 µl of 0.16 fmol/µl
5′-phosphorylated cel-miR-39-3p was added to 200 µl serum sample in
RT-qPCR as a spike-in control. RNA was extracted according to the
manufacturer's instructions with minor modifications: The volume of
RNase-free H2O used to elute the RNA was changed to 28
µl.
Fragment analysis of relevant
5′-isomiRs
A total of 2 µl of 10 X T4 RNA ligation buffer, 10
µl of 50% PEG 6000 (Nacalai Tesque, Inc.), 1.2 µl of 0.1% BSA, 1 µl
of 5 µM 5′ adaptor Adp1 (protocol I) or Adp2 (protocol II), 0.4 µl
of 40 U/µl recombinant RNase inhibitor (Takara Bio, Inc.), 0.4 µl
of 40 U/µl T4 RNA ligase (Takara Bio, Inc.) and 5 µl of serum RNA
were mixed in a 1.5 ml tube and incubated at 15°C for 1 h. The
5′-adaptor-ligated RNAs were purified using Magnosphere
MS300/Streptavidin magnetic beads (JSR Life Sciences) and
resuspended in 20 µl of RNase-free H2O in protocol I.
Then 10 µl of adaptor-ligated RNA was mixed with 3 µl of RNase-free
H2O, 1 µl of 5 µM RT primer (1246 FRG-RT or cel-39
FRG-RT) and 1 µl of 10 µM dNTPs, incubated at 65°C for 5 min and
then placed on ice for 2 min. Thereafter, 4 µl of 5X PrimeScript II
buffer, 0.5 µl of 40 U/µl recombinant RNase inhibitor and 0.5 µl of
200 U/µl PrimeScript II reverse transcriptase (Takara Bio, Inc.)
were added to the mixture and incubated at 48°C for 45 min. In
protocol I, magnetic bead-bound DNA-RNA double-strands were
captured and single-stranded cDNA was obtained via denaturation at
95°C for 5 min. In protocol II, all of the purification steps using
magnetic beads were omitted to simplify the procedure. PCR was
performed using Takara Taq Hot Start Version (Takara Bio, Inc.),
with 30 reaction cycles as follows: 98°C for 10 sec, 55°C for 30
sec and 72°C for 1 min. The primer pairs Adp1-F/1246 FRG-R or
Adp1-F/Cel-39 FRG-R and Adp2-F/U2 FRG-R were used in protocols I
and II, respectively (Table II).
Following verification by 4% agarose gel electrophoresis and
ethidium bromide staining, DNA fragment analysis was performed
using the Capillary Sequencer ABI3730XL (Thermo Fisher Scientific,
Inc.) at Macrogen Japan Corporation. The Peak Scanner (Thermo
Fisher Scientific, Inc.) was used to analyze the size and relative
fluorescent units (RFUs) of the fragments.
RT-qPCR
The MiR-X miRNA First-Strand Synthesis and TB Green
qRT-PCR systems (Takara Bio, Inc.) were used to quantify the total
amount of miR-1246. cDNA was synthesized according to the
manufacturer's instructions. In brief, 5 µl of 2X mRQ buffer, 3.75
µl of RNA sample and 1.25 µl of the mRQ Enzyme Mix were added to a
0.2 ml tube, incubated at 37°C for 1 h and then inactivated at 85°C
for 5 min. Thereafter, 90 µl of DNase-RNase-free H2O was
added to the solution. The primers, U2 miR-XF or cel-39 miR-XF,
were used as forward primers (Table
II). A two-step qPCR (Takara Bio, Inc. protocol) was performed
in duplicate on a 7500 Fast Real-Time PCR System (Thermo Fisher
Scientific, Inc.) as follows: 95°C for 10 sec, followed by 40
cycles of 95°C for 4 sec and 60°C for 32 sec. The 2−ΔΔCq
method was used for the relative quantification of miRNAs (36) as follows: ΔCq=(Cq of miR-1246)-(Cq
of spike-in control cel-miR-39-3p).
For the 5′-end-specific quantification of miR-1246,
cDNAs synthesized using protocol II of fragment analysis were
diluted and used as follows: 7.8 µl of DNase-RNase-free
H2O, 10 µl of 2X TB Green Advantage Premix (Takara Bio,
Inc.), 0.4 µl of 50× Rox Reference Dye LMP, 0.4 µl of Adp2-F, 0.4
µl of 5′-isomiR-specific primers (c1-R, c2-R, i1-R, i2-R, or
Cel-junc-R; Table II) and 1 µl of
the cDNA were added to each well. Then two-step qPCR was performed,
as described in the previous section. The melting curves were
verified after completion of the reaction. The 2−ΔΔCq
method was used for the relative quantification of miRNAs (36).
Statistical analyses
The data were presented as the mean ± SEM or SD.
Fisher's exact probability test was performed to compare the
demographic features between patients with NSCLC and the control
group. Mann-Whitney U-test was performed to compare the miRNA
levels between the patient and control groups. Spearman's rank
correlation coefficient test was used for correlation analysis.
Statcel3 software (Ohmsha, Ltd.) was used for all statistical
analyses. All P-values were two-sided and P<0.05 was considered
to indicate a statistically significant difference.
Results
Simultaneous detection of relevant
5′-isomiRs in fragment analysis
A description of this procedure is presented in
Fig. 1. Chemically synthesized
miR-1246 was used to demonstrate this procedure. miR-1246|-1|0| and
miR-1246|-2|0| are one and two bases shorter than the canonical
sequence at the 5′-end, respectively (Table II). The cDNAs synthesized
according to the procedure, shown in the top panel of Fig. 1A, were amplified and subjected to
fragment analysis (Fig. 1B). The
expected lengths of the PCR fragments derived from miR-1246|-2|0|,
miR-1246|-1|0|, miR-1246|0|0| (canonical) and cel-miR-39-3p, using
protocol I were 78, 79, 80 and 82 bp, respectively. Specific peaks
of the three 5′-isomiRs were detected in lanes 1 to 3. In lanes 4
and 5, a mixture of miR-1246|-2|0|, miR-1246|-1|0|, miR-1246|0|0|
and cel-miR-39-3p, was observed. Peaks of miR-1246|-2|0|,
miR-1246|-1|0| and miR-1246|0|0| (lane 4) and cel-miR-39-3p peak
(lane 5) were detected using primers specific for miR-1246 (lane 4)
and cel-miR-39-3p (lane 5), respectively. In addition, the protocol
was confirmed using a chemically synthesized cDNA
(Adp1-miR1246|0|0|-cDNA), which has the same sequence as the cDNA
synthesized using the 5′-adaptor-ligated miR-1246|0|0| (Table II and Fig. S1). The relevant 5′-isomiRs were
detected as unique peaks specifically and simultaneously during
fragment analysis using this protocol.
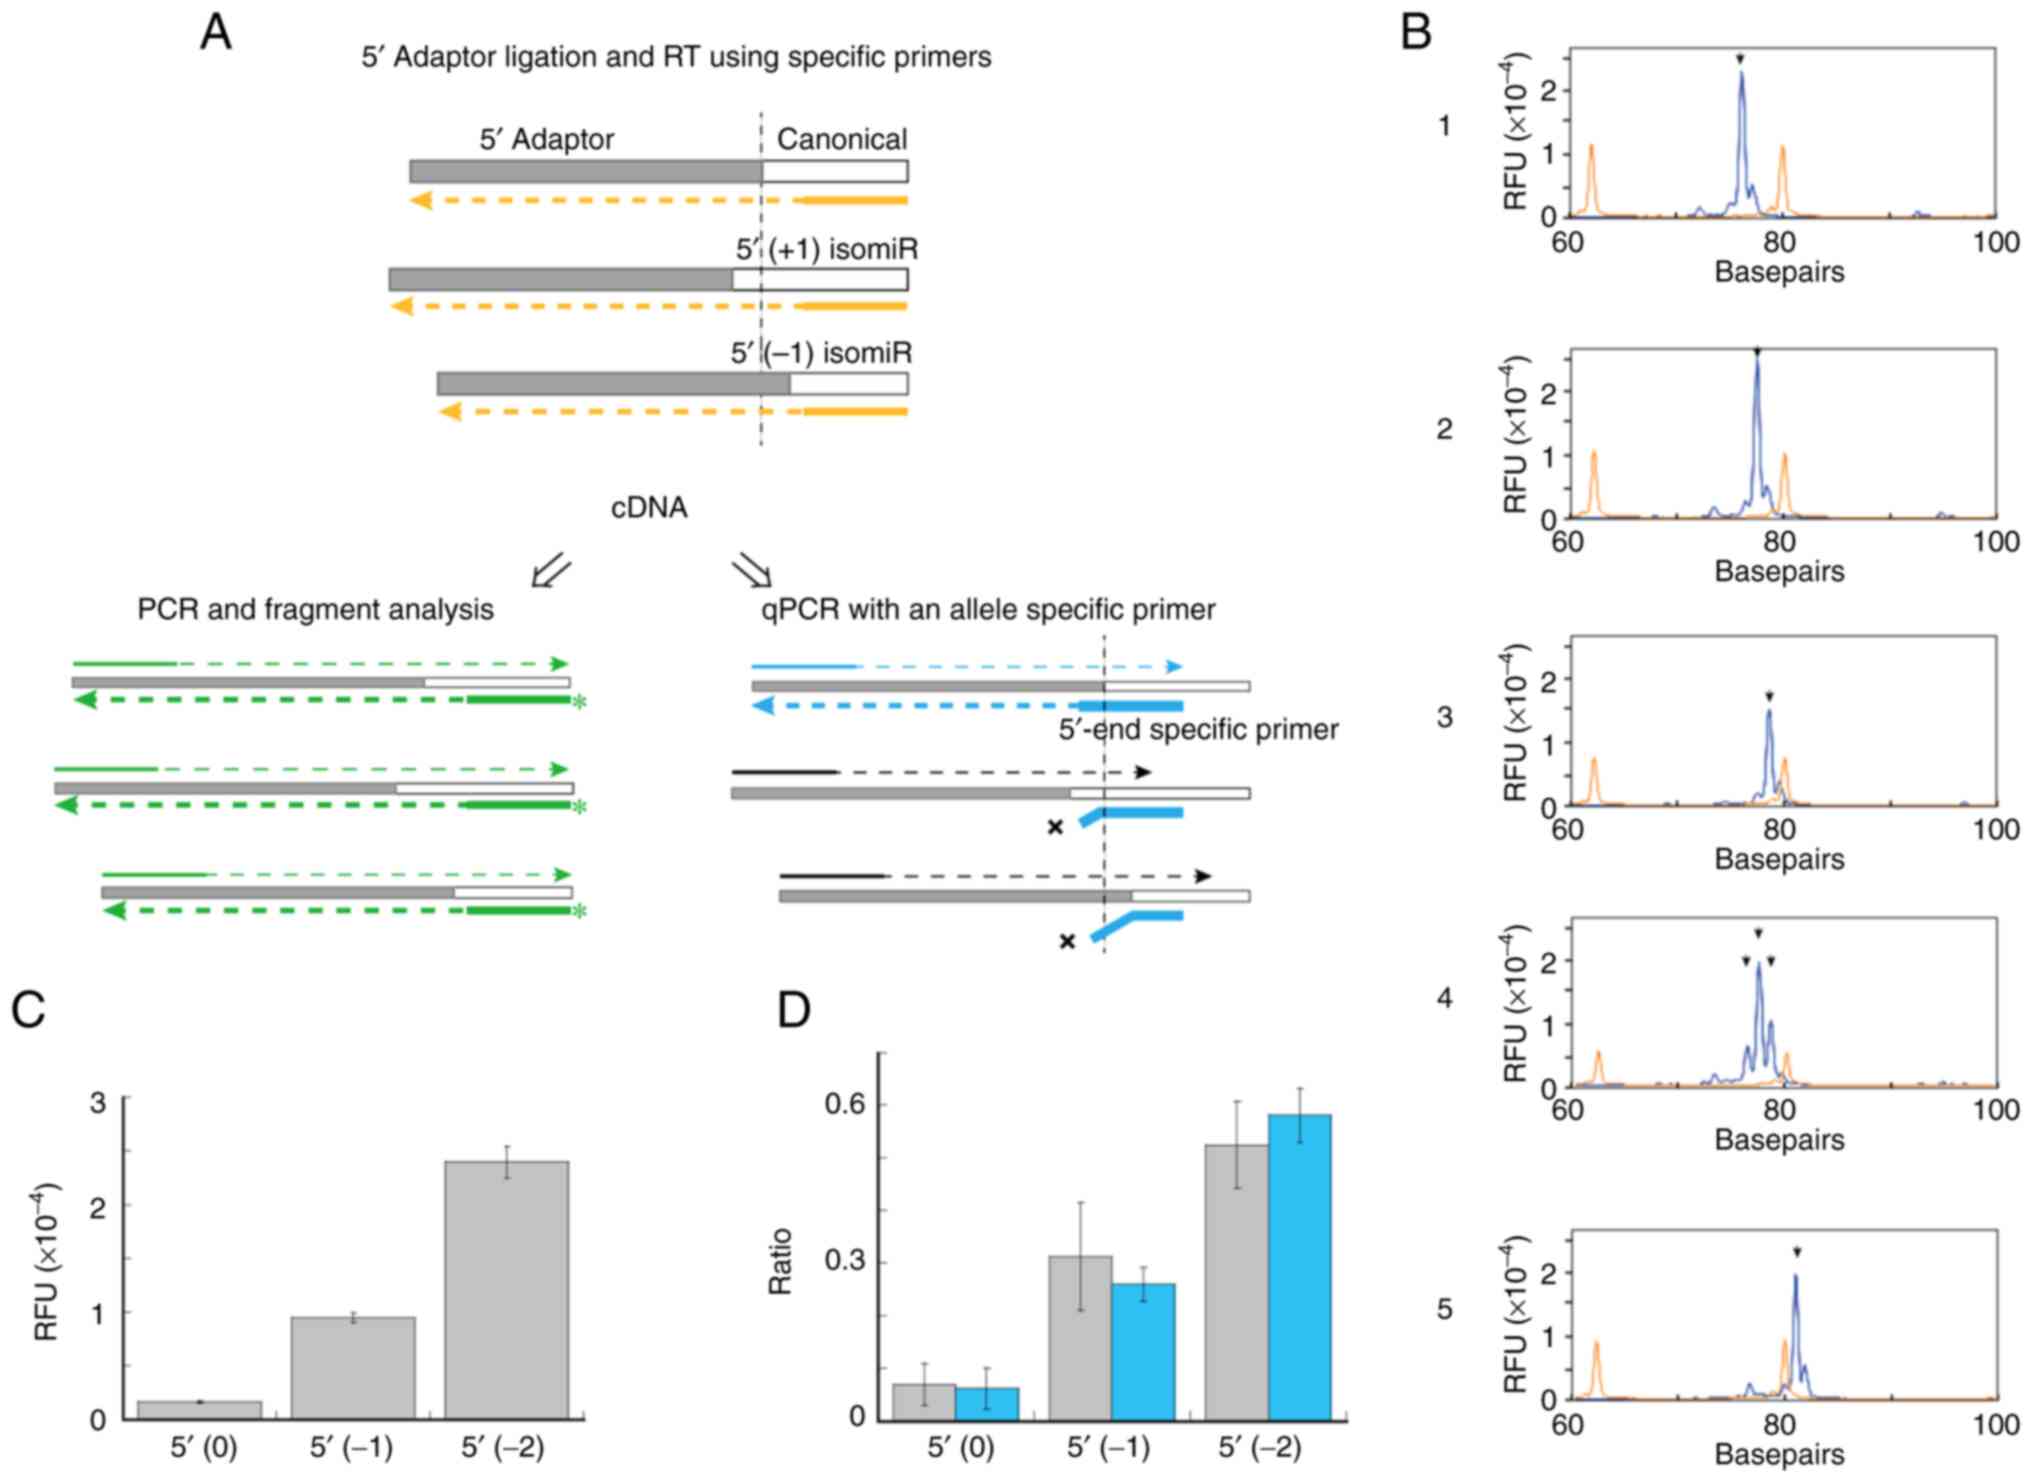 | Figure 1.Depiction of procedure used to
analyze 5′-isomiRs of miR-1246. (A) Schematic representation of
fragment analysis of relevant 5′-isomiRs and 5′-end-specific
quantification of miR-1246. miRNAs were ligated to a 5′-adaptor and
cDNAs were synthesized using miR-1246-specific RT primers (orange
broken lines). (Left) PCR fragments of specific lengths derived
from individual 5′-isomiRs (green broken lines) during fragment
analysis. (Right) The cDNAs used in 5′-isomiR-specific miRNA
quantification. The 3′ end of the PCR reverse primer (thick blue
line) was specific to the sequence of a junction of the 5′-adaptor
and a 5′-isomiR. (B) Peaks corresponding to chemically synthesized
miR-1246 5′-isomiRs observed during fragment analysis. Arrowheads
indicate expected peaks. Lane 1, miR-1246|-2|0|; lane 2,
miR-1246|-1|0|; lane 3, miR-1246|0|0|; lanes 4 and 5, a mixture of
miR-1246|-2|0|, miR-1246|-1|0|, miR-1246|0|0| and cel-miR-39-3p. RT
primers: lanes 1–4, 1246 FRG-RT; lane 5, cel-39 FRG-RT. PCR
primers: lanes 1–4, Adp1-F/1246 FRG-R; lane 5, Adp1-F/Cel-39 FRG-R.
Protocol I was used. (C) Fragment analysis of a pooled serum
sample. RFUs corresponding to specific peaks of miR-1246 isomiRs
are shown. For descriptions of 5′ isomiR (0), 5′ isomiR (−1) and 5′
isomiR (−2), please refer to the text. Three independent
experiments were performed. Data are presented as mean ± SE. (D)
Fragment analysis of serum samples from healthy controls and
patients with NSCLC. Ratio of (RFU of each 5′-isomiR) to [sum RFU
of 5′ isomiR (−3), 5′ isomiR (−2), 5′ isomiR (−1), 5′ isomiR (0)
and 5′ isomiR (+1)] is shown. Gray, healthy controls; Blue,
patients with NSCLC. Data are presented as mean ± SD and Protocol
II was used (Please see the Methods for details). isomiRs,
miRisoforms; miR/miRNA, microRNA; RFUs, relative fluorescent units;
NSCLC, non-small cell lung cancer. |
Fragment analysis of serum
miR-1246
The present study examined the 5′-isomiRs of
miR-1246 in pooled serum samples obtained from healthy volunteers
using fragment analysis (Figs. 1C
and S2). The peaks detected in
fragment analysis of the pooled sera were the same as those for the
chemically synthesized miR-1246|0|0|, miR-1246|-1|0| and
miR-1246|-2|0| (Fig. S2). It was
assumed that various isomiRs of miR-1246, each with a unique
pairing of the 5′ and 3′ ends, existed in the sera. During fragment
analysis of serum miRNAs, peaks were derived from various types of
isomiRs that had the same 5′ ends as the marker, but variable 3′
ends. Therefore, the 5′-isomiR groups were referred to as 5′ isomiR
(0), 5′ isomiR (−1), or 5′ isomiR (−2). Semi-quantification of the
5′-isomiR-groups in the pooled sera was attempted by fragment
analysis using chemically synthesized miR-1246|0|0| after verifying
an optimal detection range (Fig.
S3). RFUs of 5′ isomiR (−2), 5′ isomiR (−1) and 5′ (0) were
23963.3±1453.1, 9503.3±423.7 and 1648.7±114.7, respectively
(Fig. 1C). Substantial levels of
5′-isomiR (−1) and 5′-isomiR (−2) were detected in the pooled
sera.
Next, the ratio of each 5′-isomiR of miR-1246 in the
serum samples of patients with NSCLC as well as those of healthy
controls was analyzed (Fig. 1D).
The 5′ isomiR (−2) was the most abundant in the control and NSCLC
patient groups, with ratios of 0.525±0.083 and 0.581±0.052,
respectively, followed by that of 5′ isomiR (−1) (0.312±0.102 and
0.260±0.032, respectively). By contrast, 5′ (0) was low in both
groups, with ratios of 0.069±0.040 and 0.062±0.039 in the control
and patients with NSCLC groups, respectively.
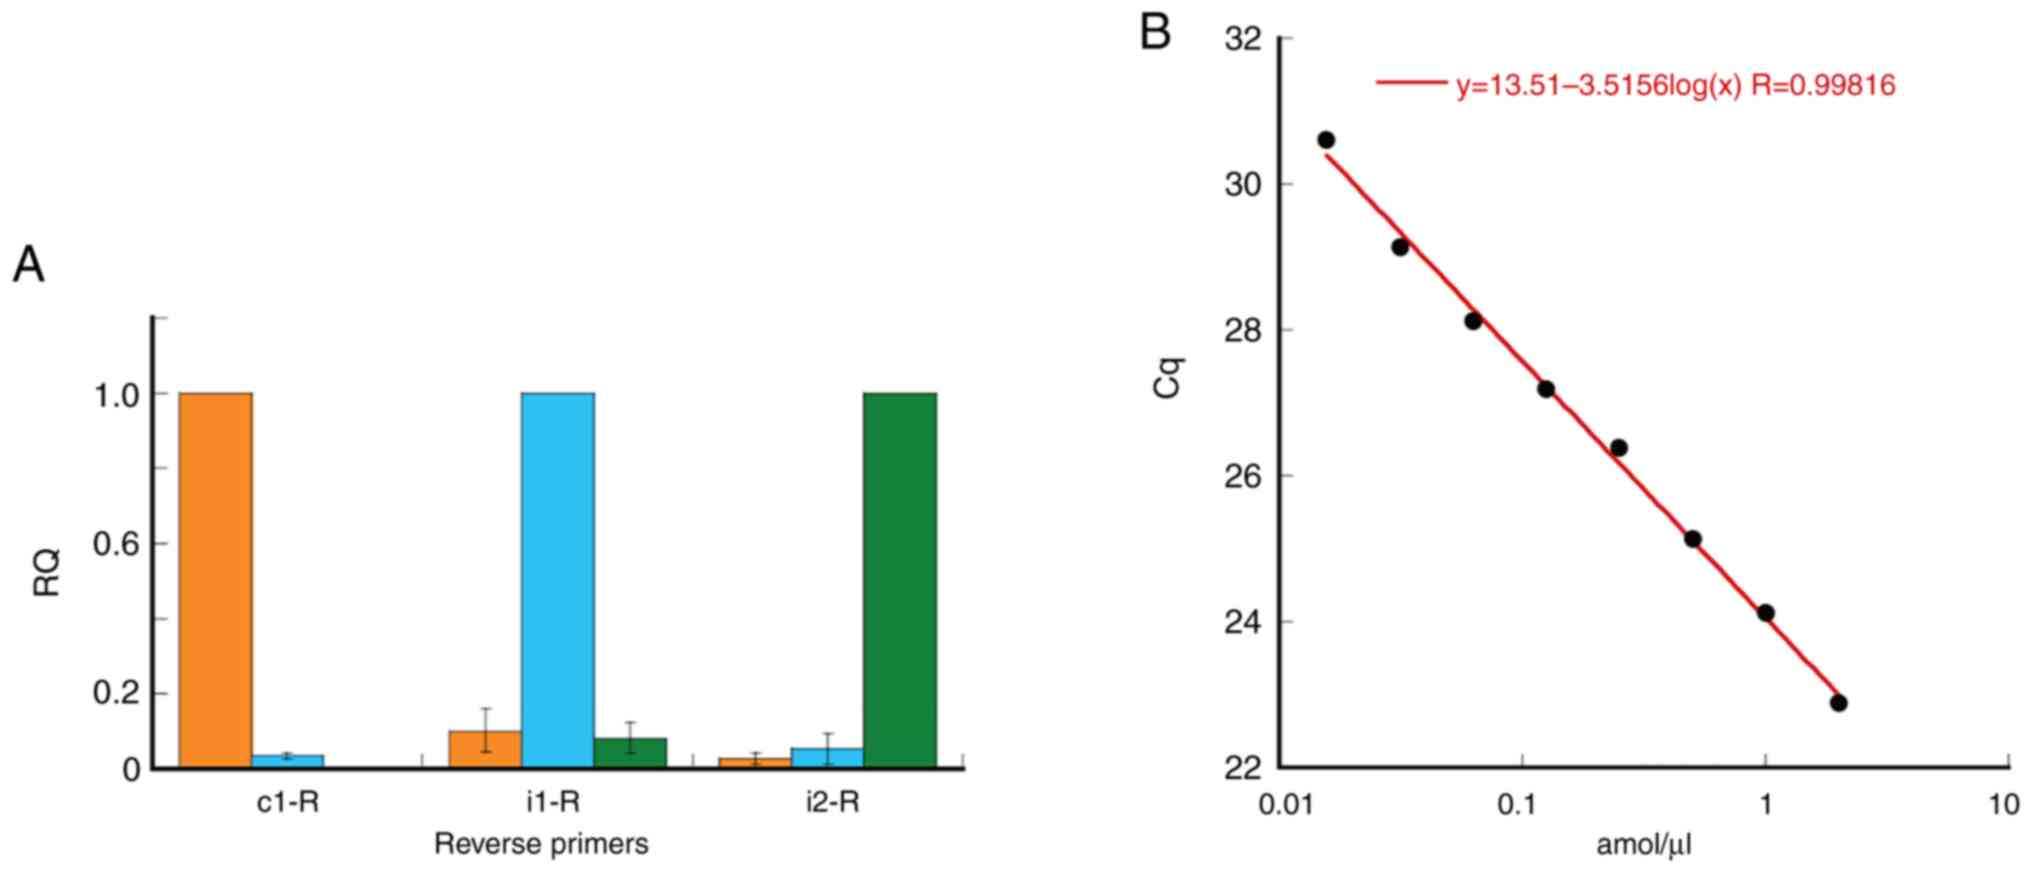
Evaluation of qPCR primers in specific
quantification of miR-1246 5′-isomiRs
The specificity of the qPCR primers to quantify each
5′-isomiR of miR-1246 was verified as shown in Table III and Fig. 2. These primers were designed based
on AS-PCR (Fig. 1A and Table II). A single mismatch nucleotide
was introduced at the 3′ region of these primers to reduce the
cross reaction. Reverse primers c1-R, i1-R and i2-R were designed
to specifically amplify the chemically synthesized miR-1246|0|0|,
miR-1246|-1|0| and miR-1246|-2|0|, respectively. Amplification of
these targets by the c1-R, i1-R and i2-R reverse primers generated
Cq values of 23.36, 23.65 and 24.18, respectively (Table III). By contrast, the Cq values
for non-specific targets ranged from 27.39 to 31.82. The values in
Table III are represented by a
graph in Fig. 2A. The reverse
primers c1-R, i1-R and i2-R were specific to their genuine targets
and their levels of cross-reactivity to other relevant 5′-isomiRs
were very low. In addition, a mixture of miR-1246|0|0|,
miR-1246|-1|0| and miR-1246|-2|0|, at 2 amol/µl each, was
quantified using c1-R, i1-R, or i2-R (Table IV). Similar Cq values were
obtained for each RT primer. A detection limit of 0.015625 amol/µl
was obtained (R=0.998; Fig.
2B).
| Table III.Evaluation of specificities of
5′-end-specific primers using chemically synthesized miR-1246
5′-isomiRs. |
Table III.
Evaluation of specificities of
5′-end-specific primers using chemically synthesized miR-1246
5′-isomiRs.
|
| Reverse primers
[specificity] |
|---|
|
|
|
|---|
| Synthesized
miRNA | c1-R
[canonical] | i1-R [5′ (−1)] | i2-R [5′ (−2)] | c2-R
[canonical] |
|---|
| miR-1246|0|0| | 23.36±0.18 | 27.39±0.81 | 29.75±0.70 | 23.52±0.21 |
| miR-1246|-1|0| | 28.25±0.11 | 23.65±0.05 | 29.32±1.12 | 28.04±0.58 |
| miR-1246|-2|0| | 31.82±0.10 | 28.38±1.73 | 24.18±0.03 | 27.31±0.95 |
| Table IV.Evaluation of specificities of
5′-end-specific primers using a mixture of chemically synthesized
miR-1246 5′-isomiRs. |
Table IV.
Evaluation of specificities of
5′-end-specific primers using a mixture of chemically synthesized
miR-1246 5′-isomiRs.
|
| Reverse
primers |
|---|
|
|
|
|---|
| Synthesized
miRNAs | c1-R | i1-R | i2-R |
|---|
| Mixture |
|
|
|
| (|0|0|, |-1|0|,
|-2|0|) | 23.47±0.21 | 24.02±0.18 | 24.14±0.11 |
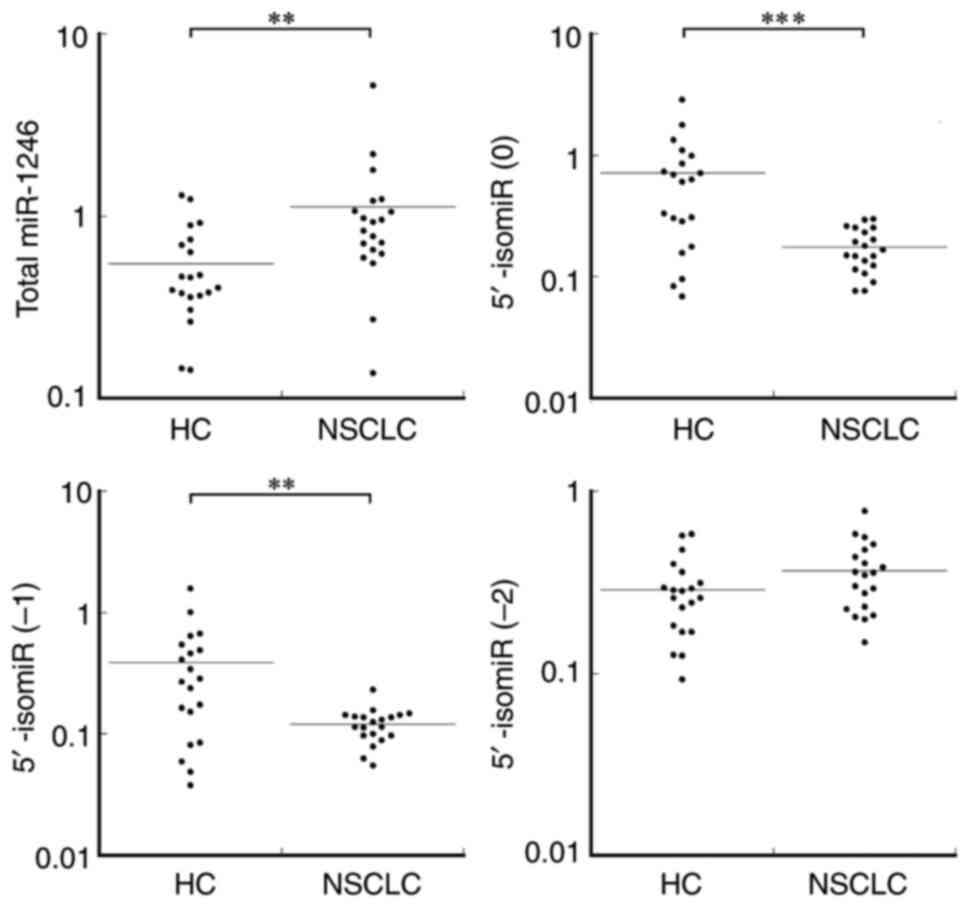
Quantification of miR-1246 5′-isomiRs
in serum samples by RT-qPCR
The 5′-end-specific primers were first evaluated by
qPCR of the pooled serum samples. In case of the 5′-isomiR-specific
primer, c1-R, a single peak was observed in the melting curve of
qPCR when chemically synthesized RNA was used, whereas two peaks
were observed when serum samples were used. Therefore, c2-R was
used as a specific primer for 5′ isomiR (0) in qPCR of serum miRNAs
(Table II). The specificity of
c2-R in qPCR is shown in Table
III. The sera of 20 patients with NSCLC and that of 20 control
subjects were analyzed using RT-qPCR (Fig. 3). Köhler et al (37) reported higher level of total
miR-1246 in the sera of patients with NSCLC. Therefore, the present
study first quantified the levels of miR-1246 in these sera using
the MiR-X miRNA First-Strand Synthesis and TB Green qRT-PCR system,
which is a poly A-tailing-mediated RT-qPCR method. Total miR-1246
levels were significantly higher in patients with NSCLC
(P=0.0047).
Next, levels of the 5′-isomiR (0), 5′-isomiR (−1)
and 5′-isomiR (−2) of miR-1246 were quantified and compared between
the patient and control groups (Fig.
3). The levels of 5′-isomiR (0) and 5′-isomiR (−1) were
significantly lower in the patient group with P-values of 0.00080
and 0.0053, respectively. By contrast, 5′-isomiR (−2) showed a
tendency to be increased in the patient group; however, the
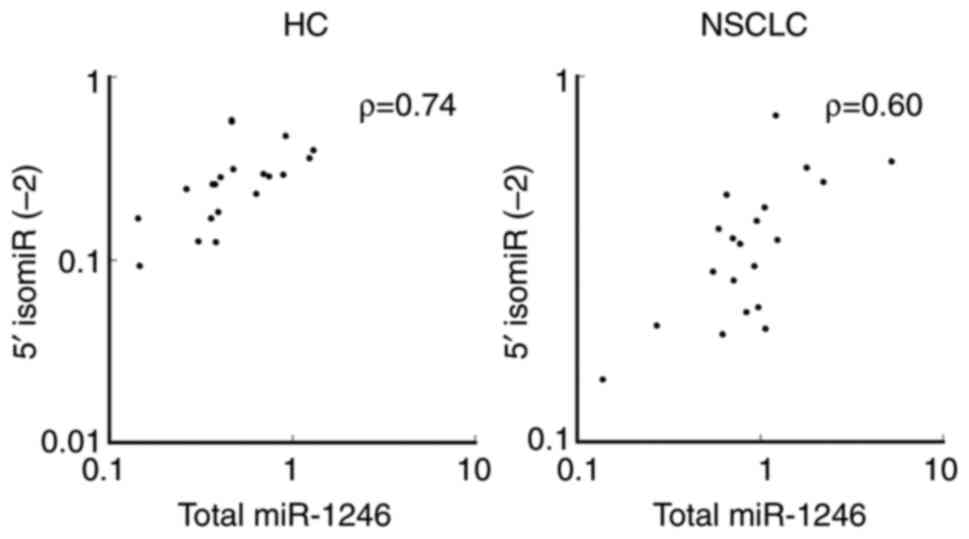
increase was not statistically significant (P=0.11). A correlation
analysis was performed between the total level of miR-1246 and the
level of 5′-isomiR (−2) as shown in Fig. 4. Significant positive correlations
were observed between the total level of miR-1246 and the level of
5′-isomiR (−2) in the control (ρ=0.74, P=0.0012) and patient group
(ρ=0.60, P=0.0087).
Discussion
Circulating miRNAs are attractive candidate
biomarkers for the diagnosis and prognosis of cancer and numerous
publications during the last decade have led to high expectations
for their use. However, this remains challenging due to the low
reproducibility of their quantification (24,25).
Difficulty in reproducible quantification is caused by the presence
of isomiRs. Further, the ability of quantification platforms to
discriminate sequences at the ends of miRNAs is variable. Neither
of the two commercially available miRNA quantification methods,
i.e., stem-loop RT qPCR or poly A-tailing-mediated RT-qPCR, can
accurately discriminate sequences at the ends of miRNAs (22,23).
Two-tailed RT-qPCR is an excellent method for quantifying the total
amounts of relevant isomiRs derived from a unique pre-miRNA
(38). This method is efficient
when the relevant isomiRs function cooperatively with common target
mRNAs (5,17). However, the expression profiles of
some isomiRs differ between cell and tissue types (3), races and sexes (39). These profiles can be used to
distinguish between different cancer cell types and subtypes
(34,40). Certain 5′-isomiRs can act on
individual target mRNAs; therefore, 5′-end-specific quantification
is required in such cases (5,18,21).
Dumbbell PCR is a unique method that discriminates among terminal
sequences of miRNAs using two dumbbell-shaped adapters (41); however, in the present study, it
was difficult to design specific primers for serum miR-1246.
The present study first used a semi-quantitative
method for fragment analysis to demonstrate the ratio of each
5′-isomiR in serum miR-1246 (Fig.
1A). The relevant 5′-isomiRs of miR-1246 were simultaneously
reverse-transcribed and amplified using common primers. It is
necessary that ligation efficiencies to a 5′ adaptor be the same
among the relevant 5′-isomiRs in semi-quantitative analysis. The Cq
values of chemically synthesized miR-1246|-0|0|, miR-1246|-1|0| and
miR-1246|-2|0| were almost similar when specific primers c1-R, i1-R
and i2-R were used, respectively (Table III). The 5′-isomiR (−2) was the
most abundant in the pooled serum from healthy volunteers and the
sera of 20 patients with NSCLC and healthy controls. The authors
previously performed deep sequencing of serum RNA obtained from a
patient with stage 1 NSCLC at three time points; prior to surgical
resection, post-7 weeks and post-12 months (31). Recurrence was observed five months
after the 12-month-sampling in this patient. In the present study,
miR-1246|-2|0| was the most abundant and its levels increased
markedly 12 months after surgical resection (Table SI). Using RNA sequencing, Umu
et al (15) showed that
miR-1290, another candidate marker of cancer possessing the same
seed sequence as that of miR-1246|-2|0|, is expressed at high
levels in human serum (42,43).
In the present study, according to the RNA sequencing data,
expression of miR-1290 in the serum of patients with NSCLC was very
low.
miR-1246 is abundant in serum exosomes (15,26–30)
and is a fragment of spliceosomal snRNA U2 (RNU2-1f) (44–46).
The RNU2-1 gene is located on chromosome 17 and exhibits
copy number polymorphism (47–49).
It is unclear how the transcription and processing of snRNA U2 are
regulated. Using poly-A-tailing-mediated RT-qPCR, Köhler et
al (37) showed increased
total amount of RNU2-1f in the sera of patients with NSCLC, which
is consistent with the results of the present study (Fig. 3). Levels of miR-1246 5′-isomiR (−2)
showed a tendency to be increased in patients with NSCLC than in
control subjects, although the associated P-value was insignificant
(Fig. 3). Significant positive
correlations were observed between the total levels of miR-1246 and
the levels of 5′-isomiR (−2) in control subjects and patients with
NSCLC (Fig. 4). These results
implied that an increase in total miR-1246 in patients with NSCLC
depended on an increase in 5′-isomiR (−2) rather than an increase
in canonical sequence. Additional samples will need to be analyzed
to clarify the profiles and functions of each miR-1246 5′-isomiR.
Differences in the expression profiles between race or sexes will
need to be assessed as only Japanese participants were included in
the present study. Future studies should also investigate the
correlation between expression of total miR-1246 and each 5′-isomiR
with the clinical features and survival. Additionally, the present
study performed target prediction for miR-1246 isomiRs (Table SII). The predicted target genes
differed significantly between miR-1246|0|0| and miR-1246|-2|0|,
suggesting that it is essential to confirm the actual 5′-end of a
focused miRNA to identify its real targets (22).
In conclusion, a 5′-isomiR of miR-1246, which is two
bases shorter than the canonical sequence registered in the
microRNA database, was the most abundant sequence in patients with
NSCLC as well as in healthy donors. Significant positive
correlations were observed between the total levels of miR-1246 and
the level of the 5′-isomiR, but not that of the canonical sequence.
These results suggested that the increase in levels of serum
miR-1246 in patients with NSCLC depends on that of the
5′-isomiR.
Supplementary Material
Supporting Data
Supporting Data
Acknowledgements
The authors would like to thank Professor Hiroaki
Ohnishi and Dr Kouki Ohtsuka (Department of Laboratory Medicine,
School of Medicine, Kyorin University) for their clinical
discussions.
Funding
The present study was supported in part by JSPS KAKENHI (grant
number JP20K07791).
Availability of data and materials
The datasets used and/or analyzed during the current
study are available from the corresponding author upon reasonable
request.
Authors' contributions
TA conducted experiments and wrote the manuscript.
TA and MU designed the study and interpreted experimental results.
TA and MU confirm the authenticity of all the raw data. Both
authors have read and approved the final manuscript.
Ethics approval and consent to
participate
The study protocol was approved by the Ethics
Committee of the Faculty of Medicine (approval no. H26-010) and the
Ethics Committee of the Faculty of Health Sciences (approval no.
2019-45), Kyorin University. Signed informed consent was obtained
from all the participants.
Patient consent for publication
Not applicable.
Competing interests
The authors declare that they have no competing
interests.
References
|
1
|
Landgraf P, Rusu M, Sheridan R, Sewer A,
Iovino N, Aravin A, Pfeffer S, Rice A, Kamphorst AO, Landthaler M,
et al: A mammalian microRNA expression atlas based on small RNA
library sequencing. Cell. 129:1401–1414. 2007. View Article : Google Scholar : PubMed/NCBI
|
|
2
|
Morin RD, O'Connor MD, Griffith M,
Kuchenbauer F, Delaney A, Prabhu AL, Zhao Y, McDonald H, Zeng T,
Hirst M, et al: Application of massively parallel sequencing to
microRNA profiling and discovery in human embryonic stem cells.
Genome Res. 18:610–621. 2008. View Article : Google Scholar : PubMed/NCBI
|
|
3
|
Lee LW, Zhang S, Etheridge A, Ma L, Martin
D, Galas D and Wang K: Complexity of the microRNA repertoire
revealed by next-generation sequencing. RNA. 16:2170–2180. 2010.
View Article : Google Scholar : PubMed/NCBI
|
|
4
|
Burroughs AM, Ando Y, De Hoon MJL, Tomaru
Y, Suzuki H, Hayashizaki Y and Daub CO: Deep-sequencing of human
argonaute-associated small RNAs provides insight into miRNA sorting
and reveals argonaute association with RNA fragments of diverse
origin. RNA Biol. 8:158–177. 2011. View Article : Google Scholar : PubMed/NCBI
|
|
5
|
Xia J and Zhang W: A meta-analysis
revealed insights into the sources, conservation and impact of
microRNA 5′-isoforms in four model species. Nucleic Acids Res.
42:1427–1441. 2014. View Article : Google Scholar : PubMed/NCBI
|
|
6
|
Juzenas S, Venkatesh G, Hübenthal M,
Hoeppner MP, Du ZG, Paulsen M, Rosenstiel P, Senger P,
Hofmann-Apitius M, Keller A, et al: A comprehensive, cell specific
microRNA catalogue of human peripheral blood. Nucleic Acids Res.
45:9290–9301. 2017. View Article : Google Scholar : PubMed/NCBI
|
|
7
|
Rubio M, Bustamante M, Hernandez-Ferrer C,
Fernandez-Orth D, Pantano L, Sarria Y, Piqué-Borras M, Vellve K,
Agramunt S, Carreras R, et al: Circulating miRNAs, isomiRs and
small RNA clusters in human plasma and breast milk. PLoS One.
13:e01935272018. View Article : Google Scholar : PubMed/NCBI
|
|
8
|
Karlsen TA, Aae TF and Brinchmann JE:
Robust profiling of microRNAs and isomiRs in human plasma exosomes
across 46 individuals. Sci Rep. 9:199992019. View Article : Google Scholar : PubMed/NCBI
|
|
9
|
Koppers-Lalic D, Hackenberg M, De Menezes
R, Misovic B, Wachalska M, Geldof A, Zini N, De Reijke T, Wurdinger
T, Vis A, et al: Non-invasive prostate cancer detection by
measuring miRNA variants (isomiRs) in urine extracellular vesicles.
Oncotarget. 7:22566–22578. 2016. View Article : Google Scholar : PubMed/NCBI
|
|
10
|
Mjelle R, Sellæg K, Sætrom P, Thommesen L,
Sjursen W and Hofsli E: Identification of metastasis-associated
microRNAs in serum from rectal cancer patients. Oncotarget.
8:90077–90089. 2017. View Article : Google Scholar : PubMed/NCBI
|
|
11
|
Guo L and Chen F: A challenge for miRNA:
Multiple isomiRs in miRNAomics. Gene. 544:1–7. 2014. View Article : Google Scholar : PubMed/NCBI
|
|
12
|
McCall MN, Kim MS, Adil M, Patil AH, Lu Y,
Mitchell CJ, Leal-Rojas P, Xu J, Kumar M, Dawson VL, et al: Toward
the human cellular microRNAome. Genome Res. 27:1769–1781. 2017.
View Article : Google Scholar : PubMed/NCBI
|
|
13
|
Neilsen CT, Goodall GJ and Bracken CP:
IsomiRs-the overlooked repertoire in the dynamic microRNAome.
Trends Genet. 28:544–549. 2012. View Article : Google Scholar : PubMed/NCBI
|
|
14
|
Liang T, Yu J, Liu C and Guo L: IsomiR
expression patterns in canonical and dicer-independent microRNAs.
Mol Med Rep. 15:1071–1078. 2017. View Article : Google Scholar : PubMed/NCBI
|
|
15
|
Umu SU, Langseth H, Bucher-Johannessen C,
Fromm B, Keller A, Meese E, Lauritzen M, Leithaug M, Lyle R and
Rounge TB: A comprehensive profile of circulating RNAs in human
serum. RNA Biol. 15:242–250. 2018. View Article : Google Scholar : PubMed/NCBI
|
|
16
|
Tan GC, Chan E, Molnar A, Sarkar R,
Alexieva D, Isa IM, Robinson S, Zhang S, Ellis P, Langford CF, et
al: 5′ isomiR variation is of functional and evolutionary
importance. Nucleic Acids Res. 42:9424–9435. 2014. View Article : Google Scholar : PubMed/NCBI
|
|
17
|
Cloonan N, Wani S, Xu Q, Gu J, Lea K,
Heater S, Barbacioru C, Steptoe AL, Martin HC, Nourbakhsh E, et al:
MicroRNAs and their isomiRs function cooperatively to target common
biological pathways. Genome Biol. 12:R1262011. View Article : Google Scholar : PubMed/NCBI
|
|
18
|
Manzano M, Forte E, Raja AN, Schipma MJ
and Gottwein E: Divergent target recognition by coexpressed
5′-isomiRs of miR-142-3p and selective viral mimicry. RNA.
21:1606–1620. 2015. View Article : Google Scholar : PubMed/NCBI
|
|
19
|
Lewis BP, Shih IH, Jones-Rhoades MW,
Bartel DP and Burge CB: Prediction of mammalian MicroRNA targets.
Cell. 115:787–798. 2003. View Article : Google Scholar : PubMed/NCBI
|
|
20
|
Lewis BP, Burge CB and Bartel DP:
Conserved seed pairing, often flanked by adenosines, indicates that
thousands of human genes are microRNA targets. Cell. 120:15–20.
2005. View Article : Google Scholar : PubMed/NCBI
|
|
21
|
Mercey O, Popa A, Cavard A, Paquet A,
Chevalier B, Pons N, Magnone V, Zangari J, Brest P, Zaragosi LE, et
al: Characterizing isomiR variants within the microRNA-34/449
family. FEBS Lett. 591:693–705. 2017. View Article : Google Scholar : PubMed/NCBI
|
|
22
|
Pillman KA, Goodall GJ, Bracken CP and
Gantier MP: miRNA length variation during macrophage stimulation
confounds the interpretation of results: implications for miRNA
quantification by RT-qPCR. RNA. 25:232–238. 2019. View Article : Google Scholar : PubMed/NCBI
|
|
23
|
Magee R, Telonis AG, Cherlin T, Rigoutsos
I and Londin E: Assessment of isomiR discrimination using
commercial qPCR methods. Noncoding RNA. 3:182017. View Article : Google Scholar : PubMed/NCBI
|
|
24
|
Avendaño-Vázquez SE and Flores-Jasso CF:
Stumbling on elusive cargo: How isomiRs challenge microRNA
detection and quantification, the case of extracellular vesicles. J
Extracell Vesicles. 9:17846172020. View Article : Google Scholar : PubMed/NCBI
|
|
25
|
Valihrach L, Androvic P and Kubista M:
Circulating miRNA analysis for cancer diagnostics and therapy. Mol
Aspects Med. 72:1008252020. View Article : Google Scholar : PubMed/NCBI
|
|
26
|
Pigati L, Yaddanapudi SCS, Iyengar R, Kim
DJ, Hearn SA, Danforth D, Hastings ML and Duelli DM: Selective
release of microRNA species from normal and malignant mammary
epithelial cells. PLoS One. 5:e135152010. View Article : Google Scholar : PubMed/NCBI
|
|
27
|
Takeshita N, Hoshino I, Mori M, Akutsu Y,
Hanari N, Yoneyama Y, Ikeda N, Isozaki Y, Maruyama T, Akanuma N, et
al: Serum microRNA expression profile: miR-1246 as a novel
diagnostic and prognostic biomarker for oesophageal squamous cell
carcinoma. Br J Cancer. 108:644–652. 2013. View Article : Google Scholar : PubMed/NCBI
|
|
28
|
Todeschini P, Salviato E, Paracchini L,
Ferracin M, Petrillo M, Zanotti L, Tognon G, Gambino A, Calura E,
Caratti G, et al: Circulating miRNA landscape identifies miR-1246
as promising diagnostic biomarker in high-grade serous ovarian
carcinoma: A validation across two independent cohorts. Cancer
Lett. 388:320–327. 2017. View Article : Google Scholar : PubMed/NCBI
|
|
29
|
Xu YF, Hannafon BN, Zhao YD, Postier RG
and Ding WQ: Plasma exosome miR-196a and miR-1246 are potential
indicators of localized pancreatic cancer. Oncotarget.
8:77028–77040. 2017. View Article : Google Scholar : PubMed/NCBI
|
|
30
|
Moshiri F, Salvi A, Gramantieri L,
Sangiovanni A, Guerriero P, De Petro G, Bassi C, Lupini L, Sattari
A, Cheung D, et al: Circulating miR-106b-3p, miR-101-3p and
miR-1246 as diagnostic biomarkers of hepatocellular carcinoma.
Oncotarget. 9:15350–15364. 2018. View Article : Google Scholar : PubMed/NCBI
|
|
31
|
Aiso T, Ueda M, Yamaki A, Karita S, Kondo
H, Ohtsuka K and Ohnishi H: Analysis of microRNA profile in serum
of a lung adenocarcinoma patient by deep sequencing. J Kyorin Med
Soc. 51:3–10. 2020.(In Japanese).
|
|
32
|
No authors listed. The World Health
Organization histological typing of lung tumours. (2nd Edition). Am
J Clin Pathol. 77:123–136. 1982. View Article : Google Scholar : PubMed/NCBI
|
|
33
|
Goldstraw P, Crowley J, Chansky K, Giroux
DJ, Groome PA, Rami-Porta R, Postmus PE, Rusch V and Sobin L;
International Association for the Study of Lung Cancer
International Staging Committee; Participating Institutions, : The
IASLC lung cancer staging project: Proposals for the revision of
the TNM stage groupings in the forthcoming (seventh) edition of the
TNM classification of malignant tumours. J Thorac Oncol. 2:706–714.
2007. View Article : Google Scholar : PubMed/NCBI
|
|
34
|
Telonis AG, Loher P, Jing Y, Londin E and
Rigoutsos I: Beyond the one-locus-one-miRNA paradigm: microRNA
isoforms enable deeper insights into breast cancer heterogeneity.
Nucleic Acids Res. 43:9158–9175. 2015. View Article : Google Scholar : PubMed/NCBI
|
|
35
|
Wu DY, Ugozzoli L, Pal BK and Wallace RB:
Allele-specific enzymatic amplification of beta-globin genomic DNA
for diagnosis of sickle cell anemia. Proc Natl Acad Sci USA.
86:2757–2760. 1989. View Article : Google Scholar : PubMed/NCBI
|
|
36
|
Livak KJ and Schmittgen TD: Analysis of
relative gene expression data using real-time quantitative PCR and
the 2(−Delta Delta C(T)) method. Methods. 25:402–408. 2001.
View Article : Google Scholar : PubMed/NCBI
|
|
37
|
Köhler J, Schuler M, Gauler TC,
Nöpel-Dünnebacke S, Ahrens M, Hoffmann1 AC, Kasper S, Nensa F,
Gomez B, Hahnemann M, et al: Circulating U2 small nuclear RNA
fragments as a diagnostic and prognostic biomarker in lung cancer
patients. J Cancer Res Clin Oncol. 142:795–805. 2016. View Article : Google Scholar : PubMed/NCBI
|
|
38
|
Androvic P, Valihrach L, Elling J, Sjoback
R and Kubista M: Two-tailed RT-qPCR: A novel method for highly
accurate miRNA quantification. Nucleic Acids Res. 45:e1442017.
View Article : Google Scholar : PubMed/NCBI
|
|
39
|
Loher P, Londin ER and Rigoutsos I: IsomiR
expression profiles in human lymphoblastoid cell lines exhibit
population and gender dependencies. Oncotarget. 5:8790–8802. 2014.
View Article : Google Scholar : PubMed/NCBI
|
|
40
|
Telonis AG, Magee R, Loher P, Chervoneva
I, Londin E and Rigoutsos I: Knowledge about the presence or
absence of miRNA isoforms (isomiRs) can successfully discriminate
amongst 32 TCGA cancer types. Nucleic Acids Res. 45:2973–2985.
2017. View Article : Google Scholar : PubMed/NCBI
|
|
41
|
Honda S and Kirino Y: Dumbbell-PCR: A
method to quantify specific small RNA variants with a single
nucleotide resolution at terminal sequences. Nucleic Acids Res.
43:e772015. View Article : Google Scholar : PubMed/NCBI
|
|
42
|
Zhang WC, Chin TM, Yang H, Nga ME, Lunny
DP, Lim EKH, Sun LL, Pang YH, Leow YN, Malusay SRY, et al:
Tumour-initiating cell-specific miR-1246 and miR-1290 expression
converge to promote non-small cell lung cancer progression. Nat
Commun. 7:117022016. View Article : Google Scholar : PubMed/NCBI
|
|
43
|
Wu Y, Wei J, Zhang W, Xie M, Wang X and Xu
J: Serum exosomal miR-1290 is a potential biomarker for lung
adenocarcinoma. OncoTargets Ther. 13:7809–7818. 2020. View Article : Google Scholar : PubMed/NCBI
|
|
44
|
Baraniskin A, Nöpel-Dünnebacke S, Ahrens
M, Jensen SG, Zöllner H, Maghnouj A, Wos A, Mayerle J, Munding J,
Kost D, et al: Circulating U2 small nuclear RNA fragments as a
novel diagnostic biomarker for pancreatic and colorectal
adenocarcinoma. Int J Cancer. 132:E48–E57. 2013. View Article : Google Scholar : PubMed/NCBI
|
|
45
|
Mazières J, Catherinne C, Delfour O, Gouin
S, Rouquette I, Delisle MB, Prévot G, Escamilla R, Didier A,
Persing DH, et al: Alternative processing of the U2 small nuclear
RNA produces a 19-22nt fragment with relevance for the detection of
non-small cell lung cancer in human serum. PLoS One. 8:e601342013.
View Article : Google Scholar : PubMed/NCBI
|
|
46
|
Xu YF, Hannafon BN, Khatri U, Gin A and
Ding WQ: The origin of exosomal miR-1246 in human cancer cells. RNA
Biol. 16:770–784. 2019. View Article : Google Scholar : PubMed/NCBI
|
|
47
|
Hammarström K, Santesson B, Westin G and
Pettersson U: The gene cluster for human U2 RNA is located on
chromosome 17q21. Exp Cell Res. 159:473–478. 1985. View Article : Google Scholar : PubMed/NCBI
|
|
48
|
Tessereau C, Buisson M, Monnet N, Imbert
M, Barjhoux L, Schluth-Bolard C, Sanlaville D, Conseiller E, Ceppi
M, Sinilnikova OM and Mazoyer S: Direct visualization of the highly
polymorphic RNU2 locus in proximity to the BRCA1 gene. PLoS One.
8:e760542013. View Article : Google Scholar : PubMed/NCBI
|
|
49
|
Schaap M, Lemmers RJLF, Maassen R, van der
Vliet PJ, Hoogerheide LF, van Dijk HK, Baştürk N, de Knijff P and
van der Maarel SM: Genome-wide analysis of macrosatellite repeat
copy number variation in worldwide populations: Evidence for
differences and commonalities in size distributions and size
restrictions. BMC Genomics. 14:1432013. View Article : Google Scholar : PubMed/NCBI
|