Introduction
Thyroid cancer (TC) is the most prevalent endocrine
malignant tumor globally, with an annual rise in the incidence of
3% (1–3). It has three main histological types:
Differentiated, medullary and undifferentiated, with papillary TC
being the most common (4,5). Although papillary TC (PTC) is
typically characterized by low malignancy and favorable outcomes
the treatment of advanced PTC is difficult, leading to an increase
in its mortality rate every year. The prognosis for poorly
differentiated TC is extremely poor and a cohort study spanning
nearly 20 years (6) indicated that
the overall survival (OS) was 4 months, and the disease-specific
mortality rate was close to 100%. Therefore, there is a need to
discover new biomarkers to diagnose and treat TC in time. These
biomarkers are crucial for effective risk stratification,
personalized management, minimizing unnecessary surgeries and
pinpointing potential therapeutic targets for TC (7,8).
Different types of cancer exhibit an unique tumor
microenvironment (TME) (9), where
tumor cells repurpose extracellular nutrients into intracellular
macromolecules, such as nucleotides and proteins (10) through metabolic reprogramming.
Glutamine, widely present in blood and muscles, is extensively
consumed by various tumors (11).
The proliferation of tumor cells particularly depends on glutamine
as the primary energy source for the tricarboxylic acid cycle
(12). This supports tumor cell
growth and enhances their invasive potential. In addition,
glutamine metabolism is crucial in immune reactions and immune
functions, making it a promising anti-tumor target (13). In recent years, glutamine and
proteins related to glutamine metabolism have shown clear
correlations with TC. Yu et al (14) found that PTC cells had aberrant
overexpression of glutaminase (GLS), which promotes PTC cell growth
by stimulating cell proliferation, migration and invasion, while
inhibition of GLS activity induced apoptosis and autophagy in PTC
cells via the mTORC1 signaling pathway. Zhang et al
(15) demonstrated that GLS and
glutamine dehydrogenase are overexpressed in TC tissues and there
is a positive correlation between GLS expression and TNM staging of
PTC. Targeting glutamine metabolism with the glutamine metabolism
inhibitor 6-diazido-5-oxo-l-norleucine inhibits the proliferation
of TC cells and enhances immune response to TC by interfering with
the synthesis of proteins and DNA and remodeling the TME.
Advances in single-cell RNA sequencing (scRNA-seq)
and data analysis techniques have provided new perspectives to
uncover molecular features of different cell groups in the TME
(16,17). Previous reports note that the
scRNA-seq dataset may be an effective method for analyzing gene
profiles of immune cells and forecasting the prognosis and
immunotherapy response in cancer patients (18,19).
The present study analyzed both single-cell and large-scale RNA-seq
data from TC patients to identify genes related to glutamine
functions in TC. Through these genes, a risk model was developed
for TC patients. The results affirmed that this risk model was
robust and offered accurate prognostic predictions.
Materials and methods
Acquisition and processing of bulk
transcriptome data
All data are available to the public and were
primarily sourced from The Cancer Genome Atlas (TCGA, http://portal,gdc.cancer.gov/). TC whole
genome-wide expression profiles in transcripts per kilobase per
million format, clinical annotations and simple nucleotide
variation estimated by VarScan2 Variant Aggregation and Masking
tool were retrospectively downloaded utilizing the TCGAbiolinks
(version 2.25.0) package (20)
from the TCGA database. Samples from TCGA-thyroid carcinoma (THCA;
n=572) were included, with 513 TC samples and 59 healthy control
samples. The current research respected the data access guidelines
of every database. The entire research workflow, including data
collection, processing, and analysis, is outlined in Figure 1.
Acquisition and processing of
scRNA-seq data
The Gene Expression Omnibus (GEO) database
(https://www.ncbi.nlm.nih.gov/geo)
contains abundant data from scRNA-seq. A GEO dataset (accession no.
GSE184362; http://www.ncbi.nlm.nih.gov/geo/query/acc.cgi?acc=GSE184362),
consisting of 7 TC tissue samples was downloaded using scRNA-seq.
Through the Seurat package from the R (version 4.2.0; http://www.R–project.org/) (21), the raw data from the dataset were
imported as single-cell data. Initially, cells and genes were
filtered out based on the following criteria: i) Genes expressed in
<1 cell type were removed; ii) cells were deleted where <200
genes were expressed; iii) cells with gene expression between
200–3,000, mitochondrial gene content <20% and unique molecular
identifiers of 500 and 12,000 were kept. Data were normalized using
the normalizedata function (R Seurat package; version 5.2.1;
http://satijalab.org/seurat).
Differentially expressed genes (DEGs) in single cells were
pinpointed through the connection between average expression and
dispersion. Next, principal components analysis was conducted for
graph-based clustering. The harmony method was used to eliminate
the batch effect of various samples. The FindClusters function (R
Seurat package; version 5.2.1) was adopted for shared nearest
neighbor modularity optimization according to the clustering
algorithm on 22 principal components with 0.2 resolutions, leading
to 13 clusters. The RunUMAP function was adopted for Uniform
Manifold Approximation and Projection (UMAP). UMAP-1 and UMAP-2
were used to showcase cell groupings. The FindAllMakers function (R
Seurat package; version 5.2.1) was used to detect DEGs within cell
clusters. Subsequently, cell clusters were distinguished using
specific biomarkers for each cell type and the ratio of each cell
type was assessed.
Glutamine metabolism-related
genes
The AUCell package (version 1.18.0; http://bioconductor.org/packages/release/bioc/html/AUCell.html)
(22) was adopted to score
pathways for all cells based on gene set enrichment analysis
(GSEA). According to the area under the curve (AUC) values of 134
genes related to glutamine metabolism from MSigDB (Table SI), gene expression was ranked for
each cell type to determine the proportion of upregulated DEGs in
all cells. Higher AUC values were observed in cells that expressed
several genes from the gene set. The AUCell_exploreThresholds
function (R AUCell package; version 1.18.0) was used to establish
the threshold for detecting active cells. Next, the UMAP embedding
was used to visualize the active clusters by mapping the AUC value
of all cells with the ggplot2 package (version 3.3.5 http://ggplot2.tidyverse.org).
A single-cell pathway in
pseudotime
Pseudotime assay was performed based on Monocle 2
(23). To conduct the pseudotime
assay on epithelial cells, the initial count data were adjusted by
computing size elements for trajectory inference. Genes that were
both widely spread out and highly active (empirical
dispersion/dispersion fit ≥1 and mean expression ≥0.1) were used to
construct the pseudotime trajectory (24). The DDRTree (version 0.1.5;
http://CRAN.R-project.org/package=DDRTree) algorithm
parameters were initialized with default values. To further examine
these diverging occurrences, branched expression analysis modeling
was employed within the framework of Monocle2 (version 2;
http://cole-trapnell-lab.github.io/monocle-release) to
discern all genes with branch-dependent expression (23). A heatmap was plotted using Monocle2
to visualize the branch-dependent expression patterns.
Analysis of cellular communication and
levels of ligands and receptors
A cellular communications assay was adopted to
evaluate the levels of ligand-receptor pairs in cells and exposed
definite pathways (25). CellChat
(version 1.1.3; http://github.com/sqjin/CellChat) assay was used to
uncover the incoming and outgoing communication patterns of various
cell types, measure different pathways of cellular communication
and determine the flow of information through signaling pathways or
the likelihood of cellular communication (26). CellChat was used to examine the
single-cell specimens. Cellular communication in all TC samples was
analyzed using CellChat; the processed scRNA-seq information from
the Seurat package was imported into CellChat for analysis. The
communication signals within TC cells were analyzed to determine
the strength of all pathways and identify definite pathways.
Default parameters were used in CellChat analyses. P<0.05 was
considered to indicate a statistically significant difference and
the P-value was adjusted using the Benjamini-Hochberg mean.
Gene Ontology (GO) and Kyoto
Encyclopedia of Genes and Genomes (KEGG) enrichment analyses
GO (27) analysis
was performed to reveal the enriched biological process, molecular
function and cellular component. KEGG (28) is a valuable bioinformatics tool
used to discern metabolic pathways that are markedly related to the
DEGs. The clusterProfiler (version 4.2.2) package (29) was used for GO and KEGG enrichment
analyses (P<0.05) on glutamine metabolism-related DEGs in
TC.
Construction and verification of the
risk-scoring system
Prognostic genes were screened among DEGs using
Kaplan-Meier (K-M) curves. The genes, meeting P<0.05, were
selected for additional examinations. Tumor tissues with clinical
information were assigned to a training set (n=348) and a
validation set (n=154). Boruta algorithm (R package Boruta; version
8.0.0; http://gitlab.com/mbq/Boruta/)
(30) and multivariate Cox
regression were then adopted to reduce candidates and develop a
risk model. According to the minimum criteria, the penalty
parameter (λ) was determined. The risk score was reckoned as
follows:
riskscore = Σni=1
Coef(genei) * Expression(genei)
(Coef (genei): coefficients, Expression (genei):
gene level).
The training cohort was classified into low- and
high-risk subgroups. The K-M technique was used to plot survival
curves and log-rank tests were conducted to check statistical
significance. Receiver operating characteristic (ROC) curves were
used to appraise the effectiveness of the prediction model. AUC
>0.6 indicated satisfactory prediction performance. During the
validation process, the validation cohorts were further categorized
into subgroups based on their risk levels and the model accuracy
was compared.
Construction and validation of a
nomogram
The clinical information (sex, age and tumor stage)
of individuals was acquired from the TCGA database. Univariate Cox
regression models were employed to analyze these features in
conjunction with the risk score. Additionally, a nomogram was
developed to forecast OS at 1, 3 and 5 years, with the risk score
as a key prognostic indicator. A nomogram was developed by
integrating predictive and clinical features utilizing the R
package RMS (version 7.0-0; http://hbiostat.org/R/rms/). ROC curves were used to
assess the nomogram.
GSEA
GSEA (31) was used
to assess whether a predefined geneset exhibited important,
consistent variations between two groups. The limma (version
3.50.0) package (32) was applied
for gene set variation analysis (GSVA). Gene expression difference
between risk cohorts was computed. The clusterProfiler (version
4.2.2) package was applied for GSEA on ranked genes according to
log2FC values. For each analysis, gene set permutations were
conducted 1,000 times. In the Molecular Signatures Database
(MSigDB) Collections, which is A Broad Institute resource for
genomics and bioinformatics that organizes annotated gene sets,
such as gene sharing functions, locations or regulatory patterns,
to support gene expression analysis, pathway studies and omics data
interpretation (31,33,34),
the gene set was found using c2.cp.kegg.v7.5.1.symbols. Genes with
an adjusted P<0.05 were reckoned as prominently enriched.
GSVA
The GSVA (35)
package was used to compare the biological function using
c2.cp.kegg.v7.5.1.symobols. The pheatmap package (version 1.0.12;
http://CRAN.R-project.org/package=pheatmap) was used
to show the results.
Immune infiltration analysis
The single-sample GSEA (ssGSEA) (36) is an expansion of GSEA that reckons
individual enrichment scores for every combination of a sample and
gene set. The ssGSEA result revealed how closely the overall
upregulated or downregulated genes were in a definite gene set. A
total of 28 immune cells were downloaded from the TISIDB
(http://cis.hku.hk/TISIDB/index.php)
(37) and their relative
enrichment was calculated from all gene expression in tumor
samples. Immune cell infiltration between risk cohorts was assessed
through the ggplot2 (version 3.3.6) (38) package.
Evaluation of drug sensitivity
The sensitivity of TC patients in two risk subgroups
to potential therapeutic drugs was predicted using the oncoPredict
(version 0.2) (39) package, based
on the IC50 from GDSC (https://www.cnacerrxgene.org/) (40) and clinical gene expression.
Somatic mutation analysis
The mutation data illustrated the genomic variations
landscape. Different clusters were analyzed using the maftools
software (version 2.12.0, http://github.com/PoisonAlien/maftools) for somatic
variations, such as tumor mutation burden (TMB) (41). The primary driver genes for tumors
were typically those frequently mutated genes with the highest
mutation frequency in the top 20 (42).
Cell culture and reverse
transcription-quantitative (RT-q) PCR
Normal thyroid cell lines (Nthy-ori3-1) and TC cell
lines (TPC-1 and BCPAP) were obtained from the medical research
building, Fenglin campus, Fudan University (Jiangsu, China). All
cells were verified through Short Tandem Repeat (STR) profiling and
all STR identification materials have been placed in the
supplementary materials. All cells were cultured in RPMI 1640
medium (cat. no. PM150110; Wuhan Pricella Biotechnology Co., Ltd.)
or DMEM (cat. no. ZQ-100; Shanghai Zhongqiao Xinzhou Biotechnology
Co., Ltd.) with 10% fetal bovine serum (cat. no. F103-01; Vazyme
Biotech Co., Ltd.) and 1% penicillin/streptomycin solution (cat.
no. CSP006; Shanghai Zhongqiao Xinzhou Biotechnology Co., Ltd.) at
37°C with 5% CO2. RNA was extracted from the cell line
using the FastPure Cell/Tissue Total RNA Isolation Kit V2 (cat. no.
R223-01; Vazyme Biotechnology). HiScript II qPT SuperMix II
reagents were added according to the manufacturer's manual to
reverse transcribe RNA into cDNA (cat. no. Q331-01; Vazyme
Biotechnology), then the ChamQ SYBR qPCR Master Mix reagent (cat.
no. Q331-02; Vazyme Biotechnology) was added. RT-qPCR was performed
using a quantitative fluorescence PCR machine (cat. no. ABI 7500;
Applied Biosystems; Thermo Fisher Scientific, Inc.). The
thermocycling protocol used was as follows: 95°C for 30 sec;
followed by 40 cycles of 95°C for 10 sec, 60°C for 30 sec, 95°C for
15 sec, 60°C for 60 sec and 95°C for 15 sec. After obtaining the CT
values, comparisons between multiple groups were made using the
2−ΔΔCq method (43).
All experiments were repeated three times. The primer sequences are
shown in Table SII.
RNA interference
SIPA1L2 small interfering RNA (siRNA) was designed
and synthesized by Generay Biotech Co., Ltd (Table SII). The logarithmic-phase TPC-1
and BCPAP cells were digested with trypsin for 2 min at 37°C, and
the resulting cell suspension was resuspended in antibiotic-free
medium and seeded into a 6-well plate at a density of
8×10⁵ cells per well. When the cell density reached
~70%, the Hieff Trans® liposomal transfection reagent
(cat. no. 40802ES03; Shanghai Yesen Biotechnology Co., Ltd.) and
RNAi complexes were added for transfection. The procedure involved
mixing 5 µl of transfection reagent with 250 µl of serum-free
medium or combining 100 pmol RNAi with 250 µl of serum-free medium,
then combining these solutions and incubating at room temperature
for 20 min. The mixture was then added to the cells, and the cells
were incubated at 37°C with 5% CO2 for 24 h to complete
the transfection.
5-Ethynyl-2′-deoxyuridine (EdU)
staining
The transfected cells were resuspended and seeded in
a 12-well plate with coverslips (3×10⁵ cells/well).
After incubating at 37°C with 5% CO2 for 24 h, the EdU
probe (cat. no. C0071S; Beyotime Institute of Biotechnology) was
added and cells were incubated at 37°C for 2 h. The cells were then
fixed at room temperature with 4% paraformaldehyde for 15 min,
permeabilized with 0.5% Triton-X-100 at room temperature for 15
min, stained with Azide 488 at room temperature in the dark for 1 h
and subsequently stained with Hoechst 33342 at room temperature in
the dark for 30 min. Cell proliferation was observed using a
fluorescence microscope (Olympus BX43; Olympus Corportation) using
a ×10 objective. The coverslip was divided into four areas: Upper
left, lower left, upper right and lower right, and images were
captured from these fields.
Healing assay
Transfected cells were resuspended and cultured in a
12-well plate. After 24 h, when cells reached 95% confluence, a
cross-shaped scratch was created using a sterile 200 µl pipette
tip. After PBS washing, the cells were cultured in a serum-free
medium and photographed at 0 and 24 h.
Transwell assay
Transfected cells were resuspended in a serum-free
medium at 2×10⁵ cells per well. The upper chamber was
pre-coated with Matrigel solution (Beyotime Institute of
Biotechnology) at 37°C for 3 h. Subsequently, 200 µl of the cell
suspension was added in the upper chamber and 600 µl of complete
medium was added in the lower chamber. The cells were incubated at
37°C for 24 h. After 24 h, the cells were fixed with 4%
paraformaldehyde at room temperature for 30 min and stained with
0.1% crystal violet (Beyotime Institute of Biotechnology) at room
temperature for 30 min. Samples were removed from the chamber,
placed on a slide and observed using an inverted DMI3000B
fluorescence microscope (Leica Microsystems GmbH) with a ×10
objective to assess cell invasion. The chamber was divided into
four areas: Upper left, lower left, upper right, and lower right,
and images were taken from these fields.
Statistical analysis
R (version 4.1.2; http://www.R-project.org/) was applied for data
analysis and statistical calculations. K-M curves and log-rank
tests were adopted for survival analysis. Prognostic variables were
assessed using Cox regression analysis. Factors with a greater
impact on results were identified using the Boruta algorithm. R
program ggplot2 was used to visualize the data and the R survival
package was used to calculate OS and risk scores. Significant
quantitative differences in variables with normal distribution were
analyzed utilizing two-tailed t-tests or one-way ANOVA, with
Tukey's correction for multiple comparisons. Wilcoxon and
Kruskal-Wallis tests were adopted to assess notable variances in
data without normal distribution. P<0.05 was considered to
indicate a statistically significant difference.
Results
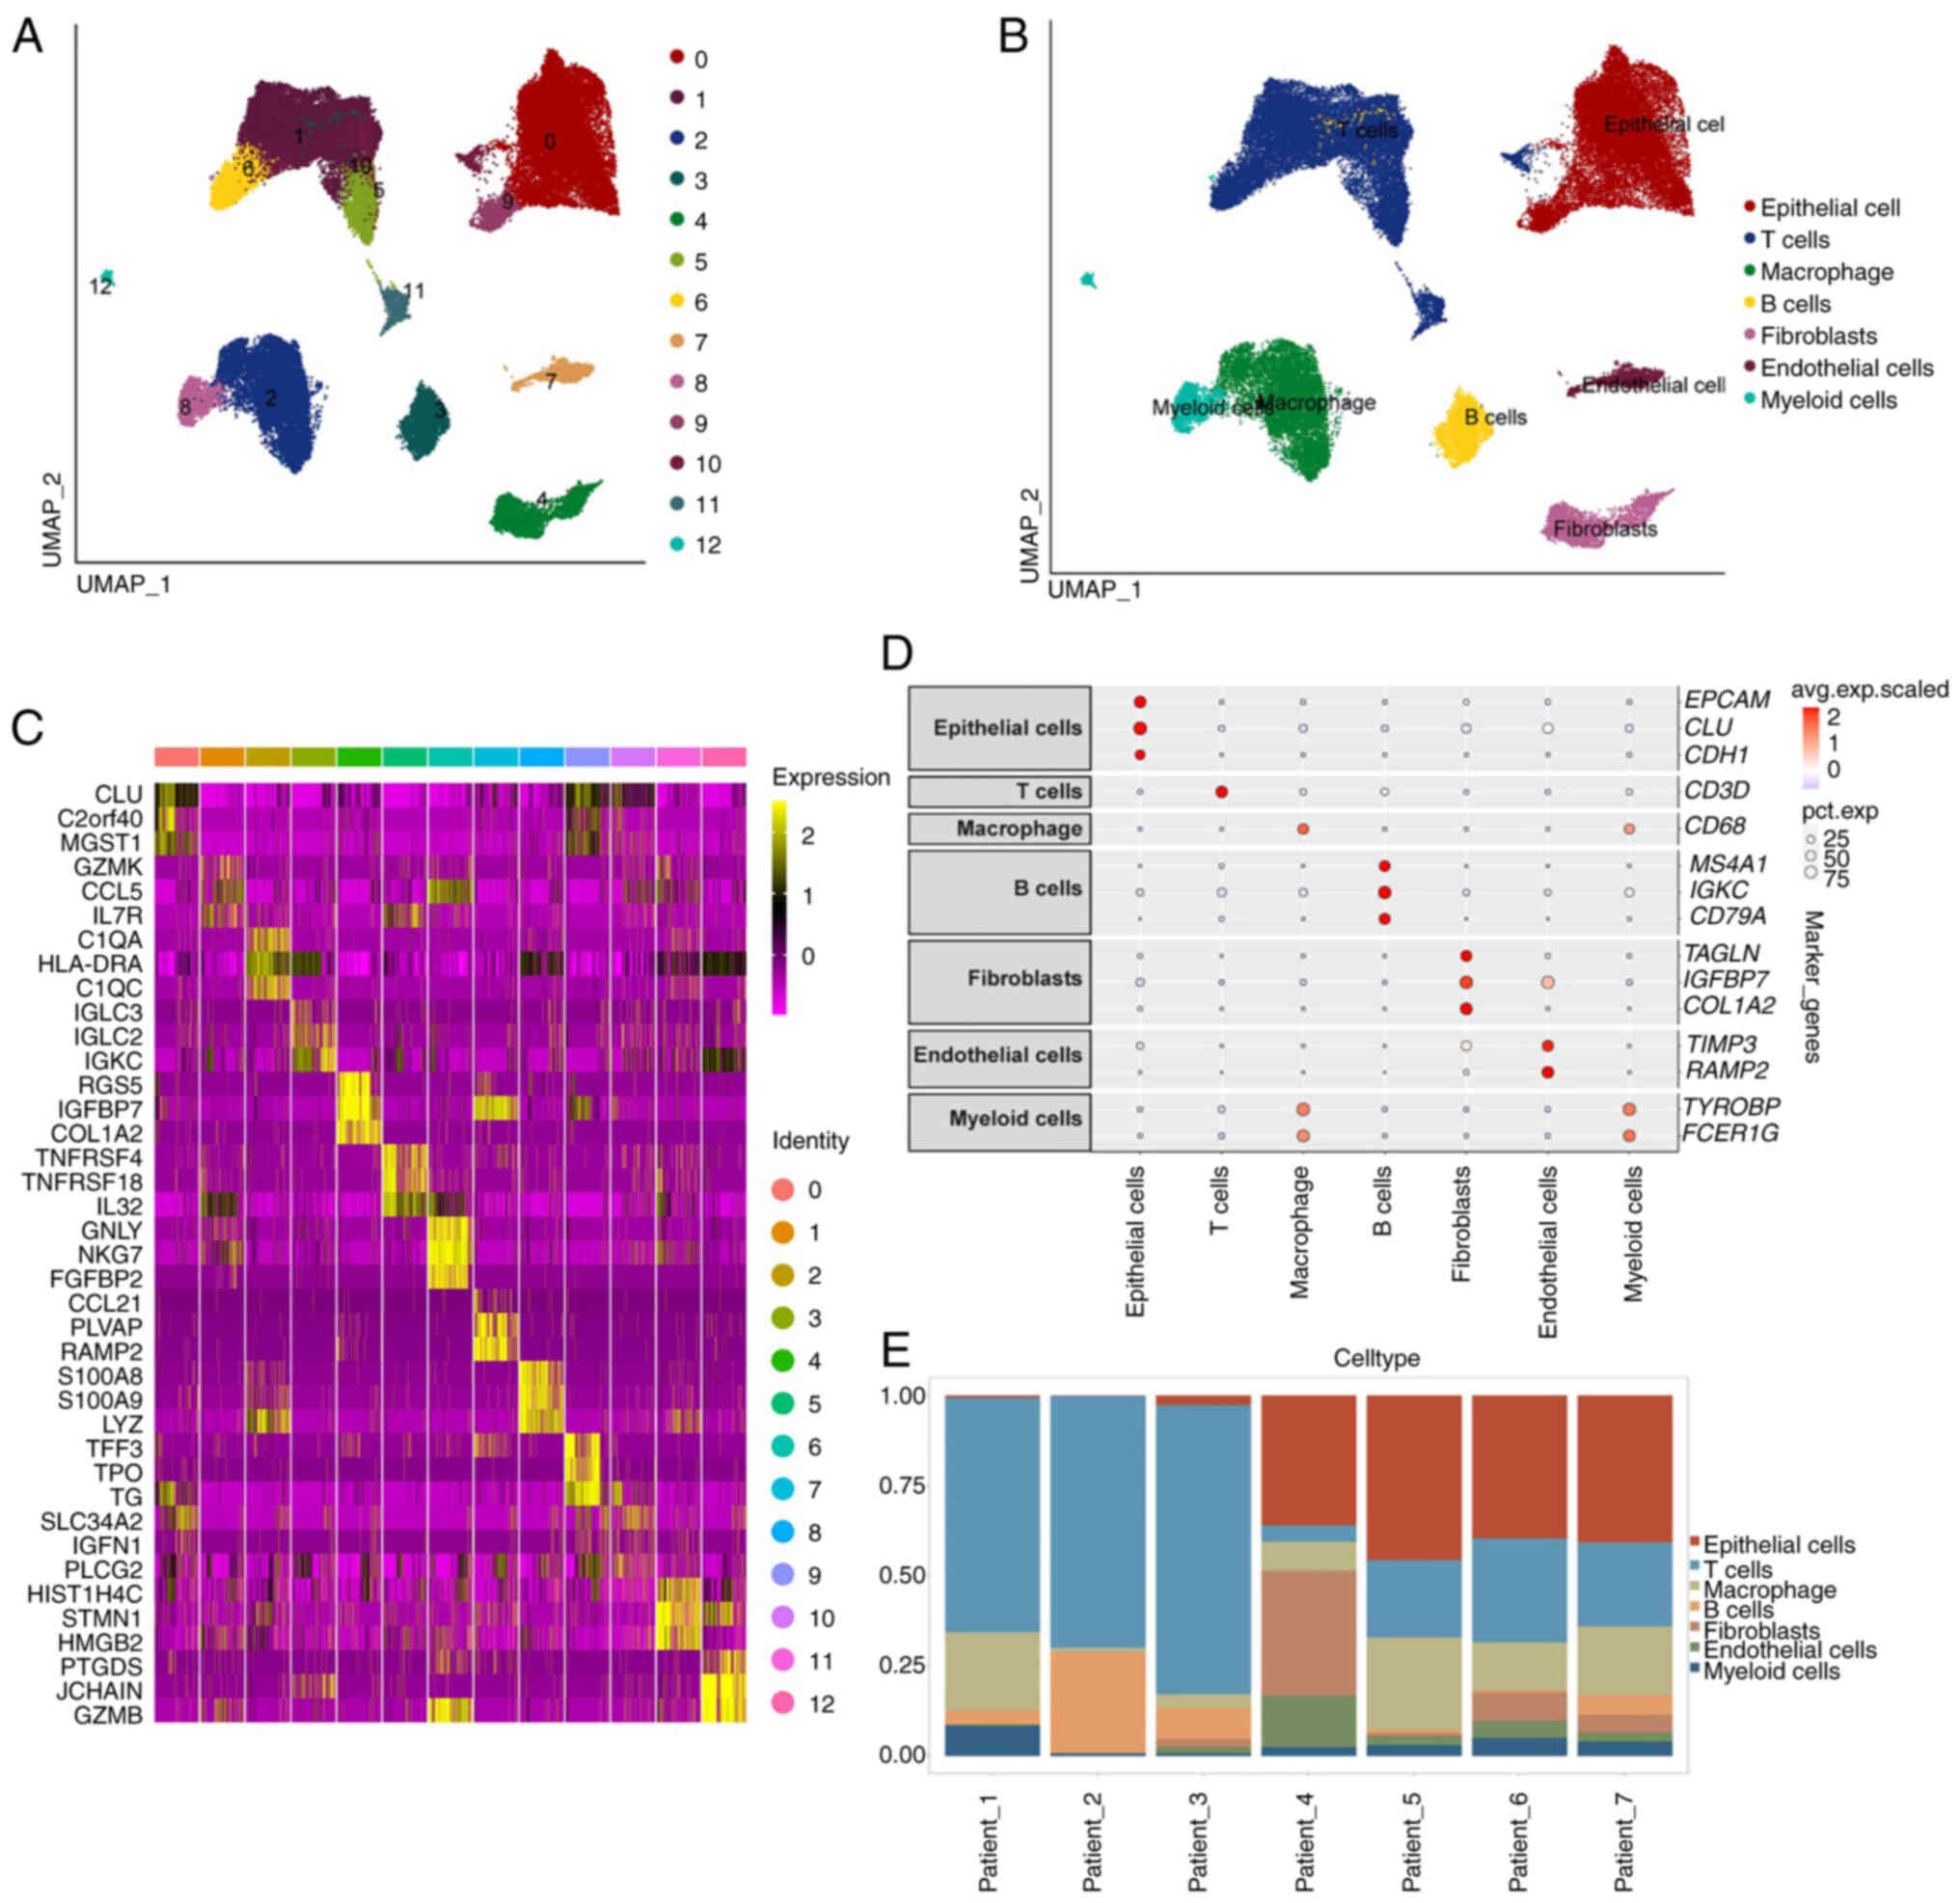
ScRNA-seq analysis
Cell populations of TC were examined to investigate
highly expressed genes using the GSE184362 dataset. After an
initial evaluation of quality control and removal of duplicates,
single-cell transcriptomes of 56,580 cells were obtained. All cells
were clustered into 13 distinct groups (Fig. 2A). Distinct cell types were
discovered based on the genetic features of each group using cell
type-specific biomarkers listed in Table SIII. A total of seven cell types,
containing epithelial cells, macrophages and T cells are displayed
in Fig. 2B. Marker gene levels of
all groups are shown in the heatmap (Fig. 2C). Distinct genes associated with
individual cell types are visualized in dot plots (Fig. 2D). The distribution of cell types
in all samples is shown in Fig.
2E.
Identification of glutamine
metabolism-related active cells
To explore the primary sites of glutamine metabolism
in TC, the present study identified active cell subpopulations at
the single-cell level using the expression patterns of glutamine
metabolism-related genes. Active cells were determined by the
optimal threshold, with cell populations having an AUC value
>0.12 considered as high glutamine metabolism activity groups
and those with an AUC value <0.12 as low glutamine metabolism
activity groups. The results showed that there were 1,751 glutamine
metabolism -active cells (Fig.
3A). The AUCell scores of glutamine metabolism for each cell
type was further calculated and their differences before and after
the occurrence of TC compared. Fig.
3B displays the t-SNE plot of active cells, where epithelial
cells showed the highest glutamine metabolism scores among all
cells, thus the present study regarded them as the main subjects
for subsequent analysis. A transcriptional trajectory was
constructed using definitive epithelial cells to identify crucial
gene expression patterns that govern TC progression. Differentiated
paths were revealed in the trajectory's transcriptional states.
Epithelial cells showed five states, in which epithelial cells from
the GSM5585102, GSM5585104 and GSM5585121 datasets were enriched in
state 5 and the remaining epithelial cells were enriched in states
1–4 (Fig. 3C-F). The genes
responsible for the first branching point of TC were investigated
to understand the molecular basis. Highly expressed genes in
pre-branch cells were mainly enriched in pathways related to
inhibiting endopeptidase activity, peptidase activity and
receptor-mediated endocytosis. In addition, genes enriched in
cytoplasmic translation, adjustment of leukocyte proliferation and
myeloid leukocyte migration showed high expression in cell fate 1
(Fig. 3G).
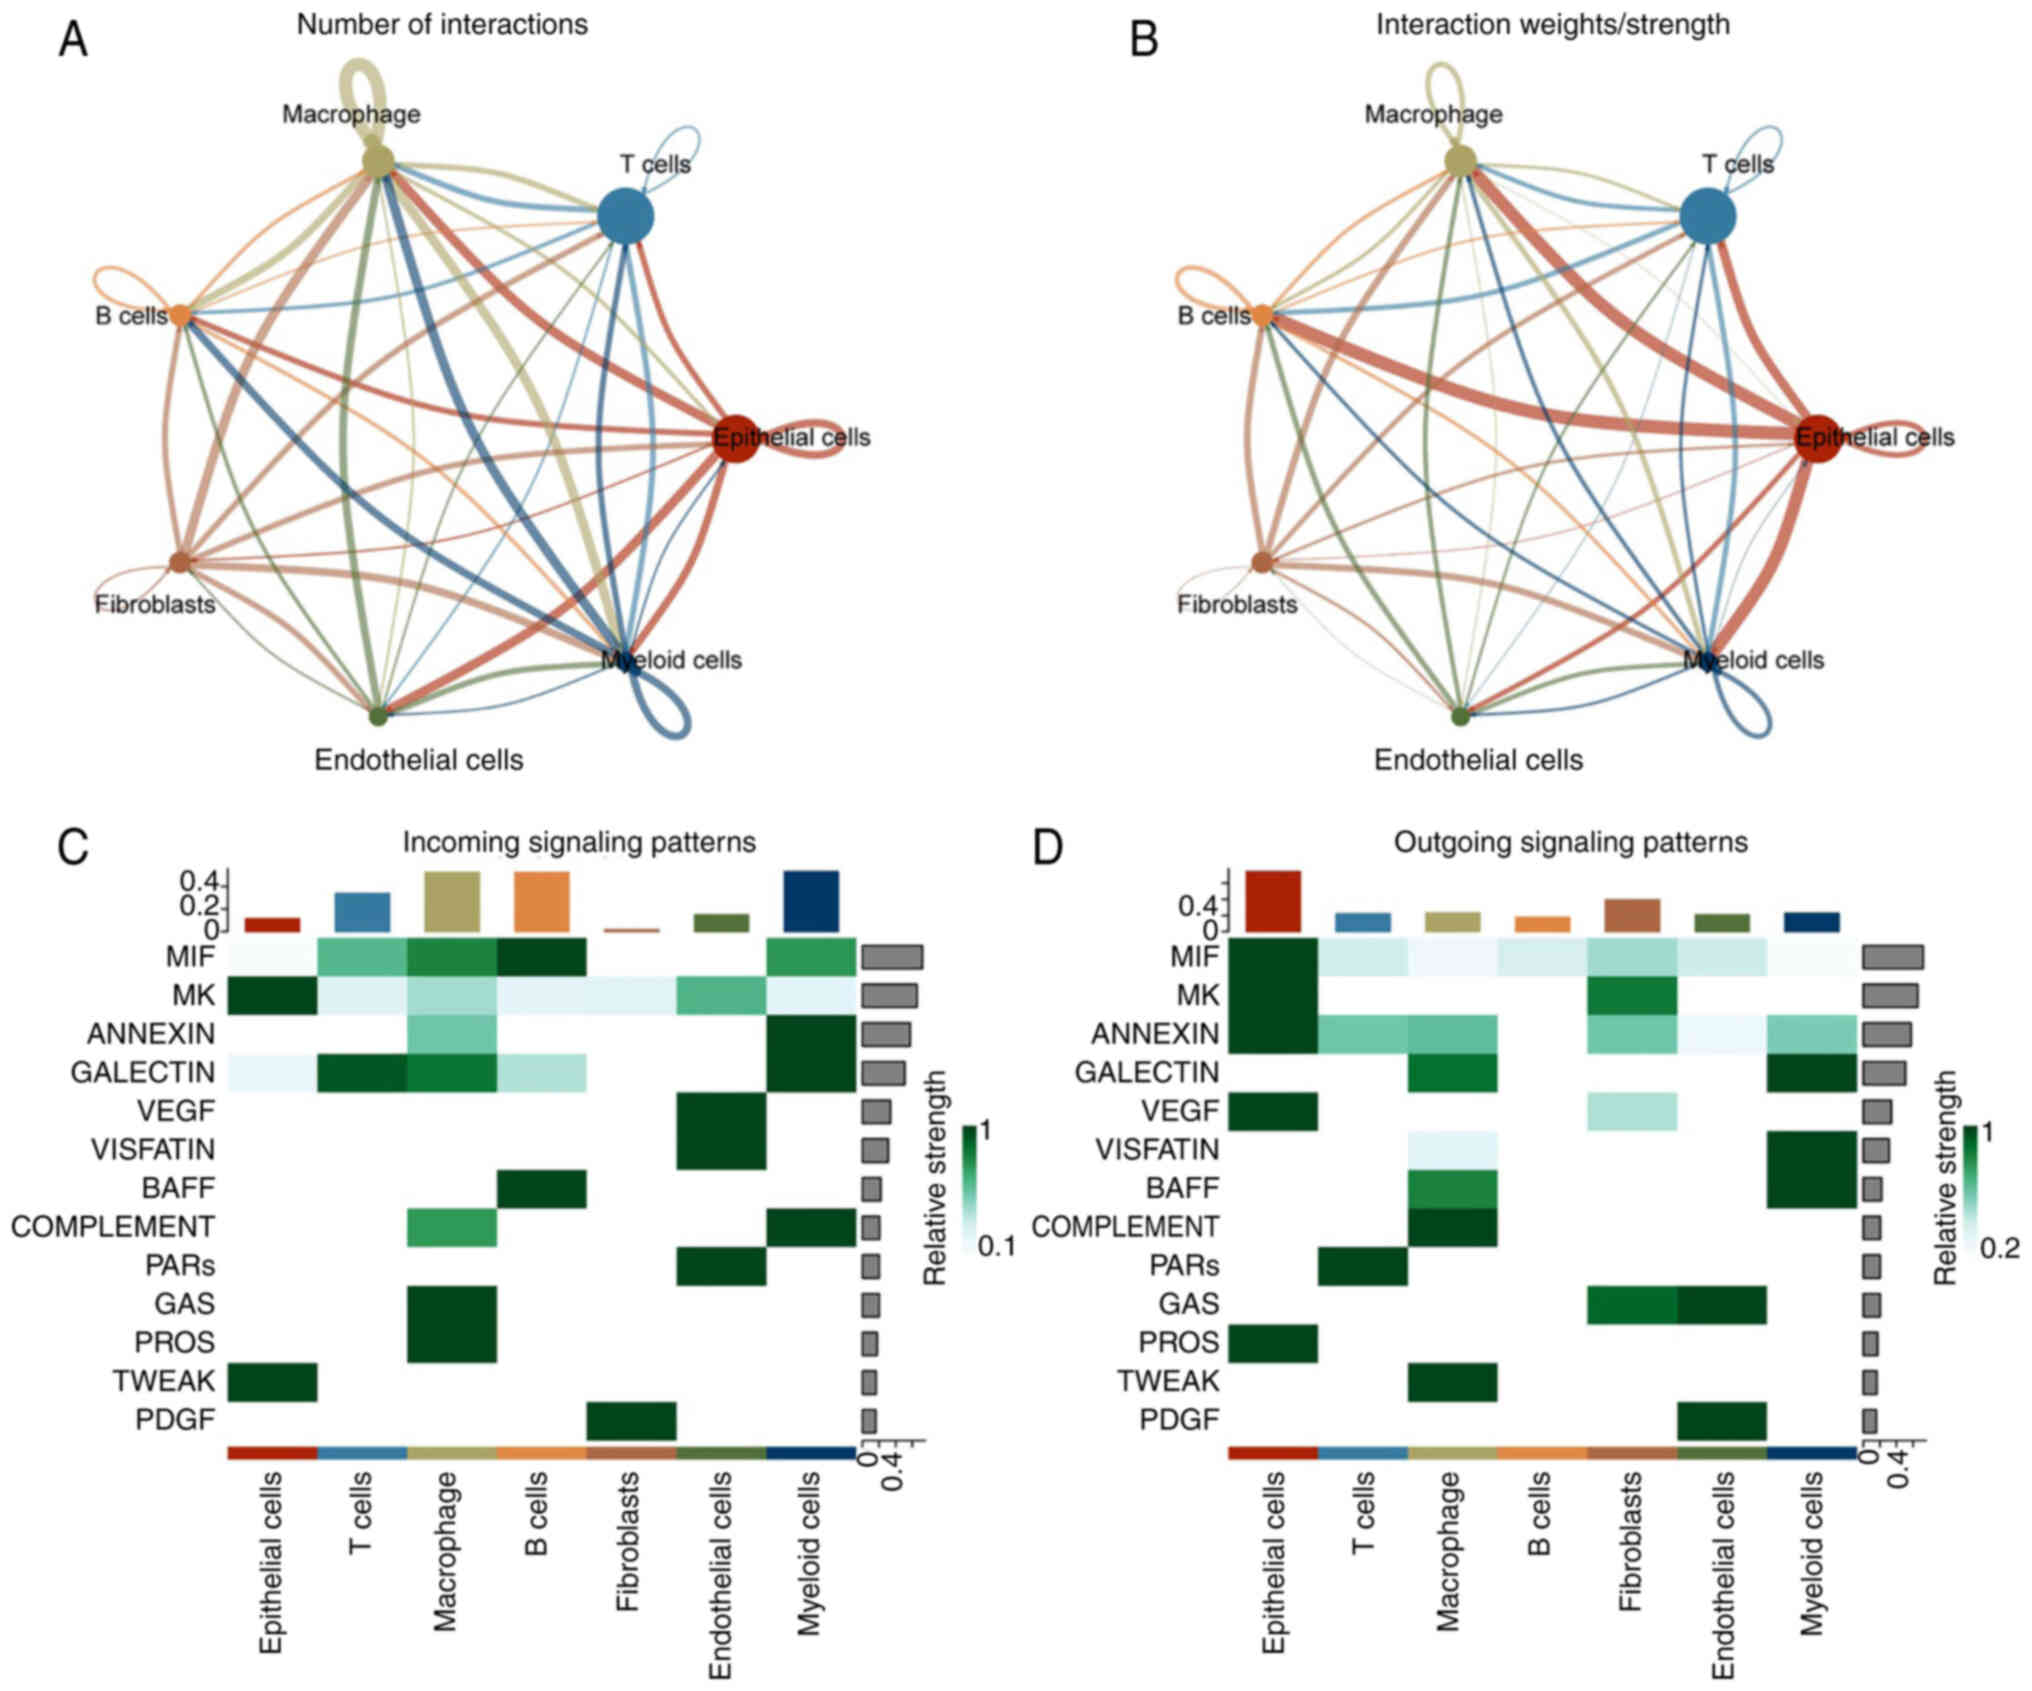
Cellular communication in the TC
TME
The interactions between these types of cells are
shown in Fig. 4A and B.
Subsequently, the potential signals and specific pairs of molecules
in these seven types of cells were analyzed. Macrophages were the
primary source of signals, while epithelial cells were the main
recipients (Fig. 4C and D).
Epithelial cells potentially communicated through the MK, TWEAK,
MIF, ANNEXIN and VEGF signaling pathways. Consequently, the
specific signal pairs in epithelial cells were examined. The
findings indicated that epithelial cells primarily communicated
with B cells through the MIF-(CD74+CXCR4) signaling pathway, while
fibroblasts communicated with themselves through the MDK-SDC4 and
MDK-NCL signaling pathways (Fig.
S1A-C). The ligand MIF was primarily expressed in epithelial
cells (Fig. S1D). CD74 and CXCR4
receptors were expressed in B cells. The ligand MDK was primarily
expressed in epithelial cells and fibroblasts (Fig. S1E). SDC2 and SDC4 receptors were
mostly expressed in epithelial cells. NCL receptor was expressed in
various cells.
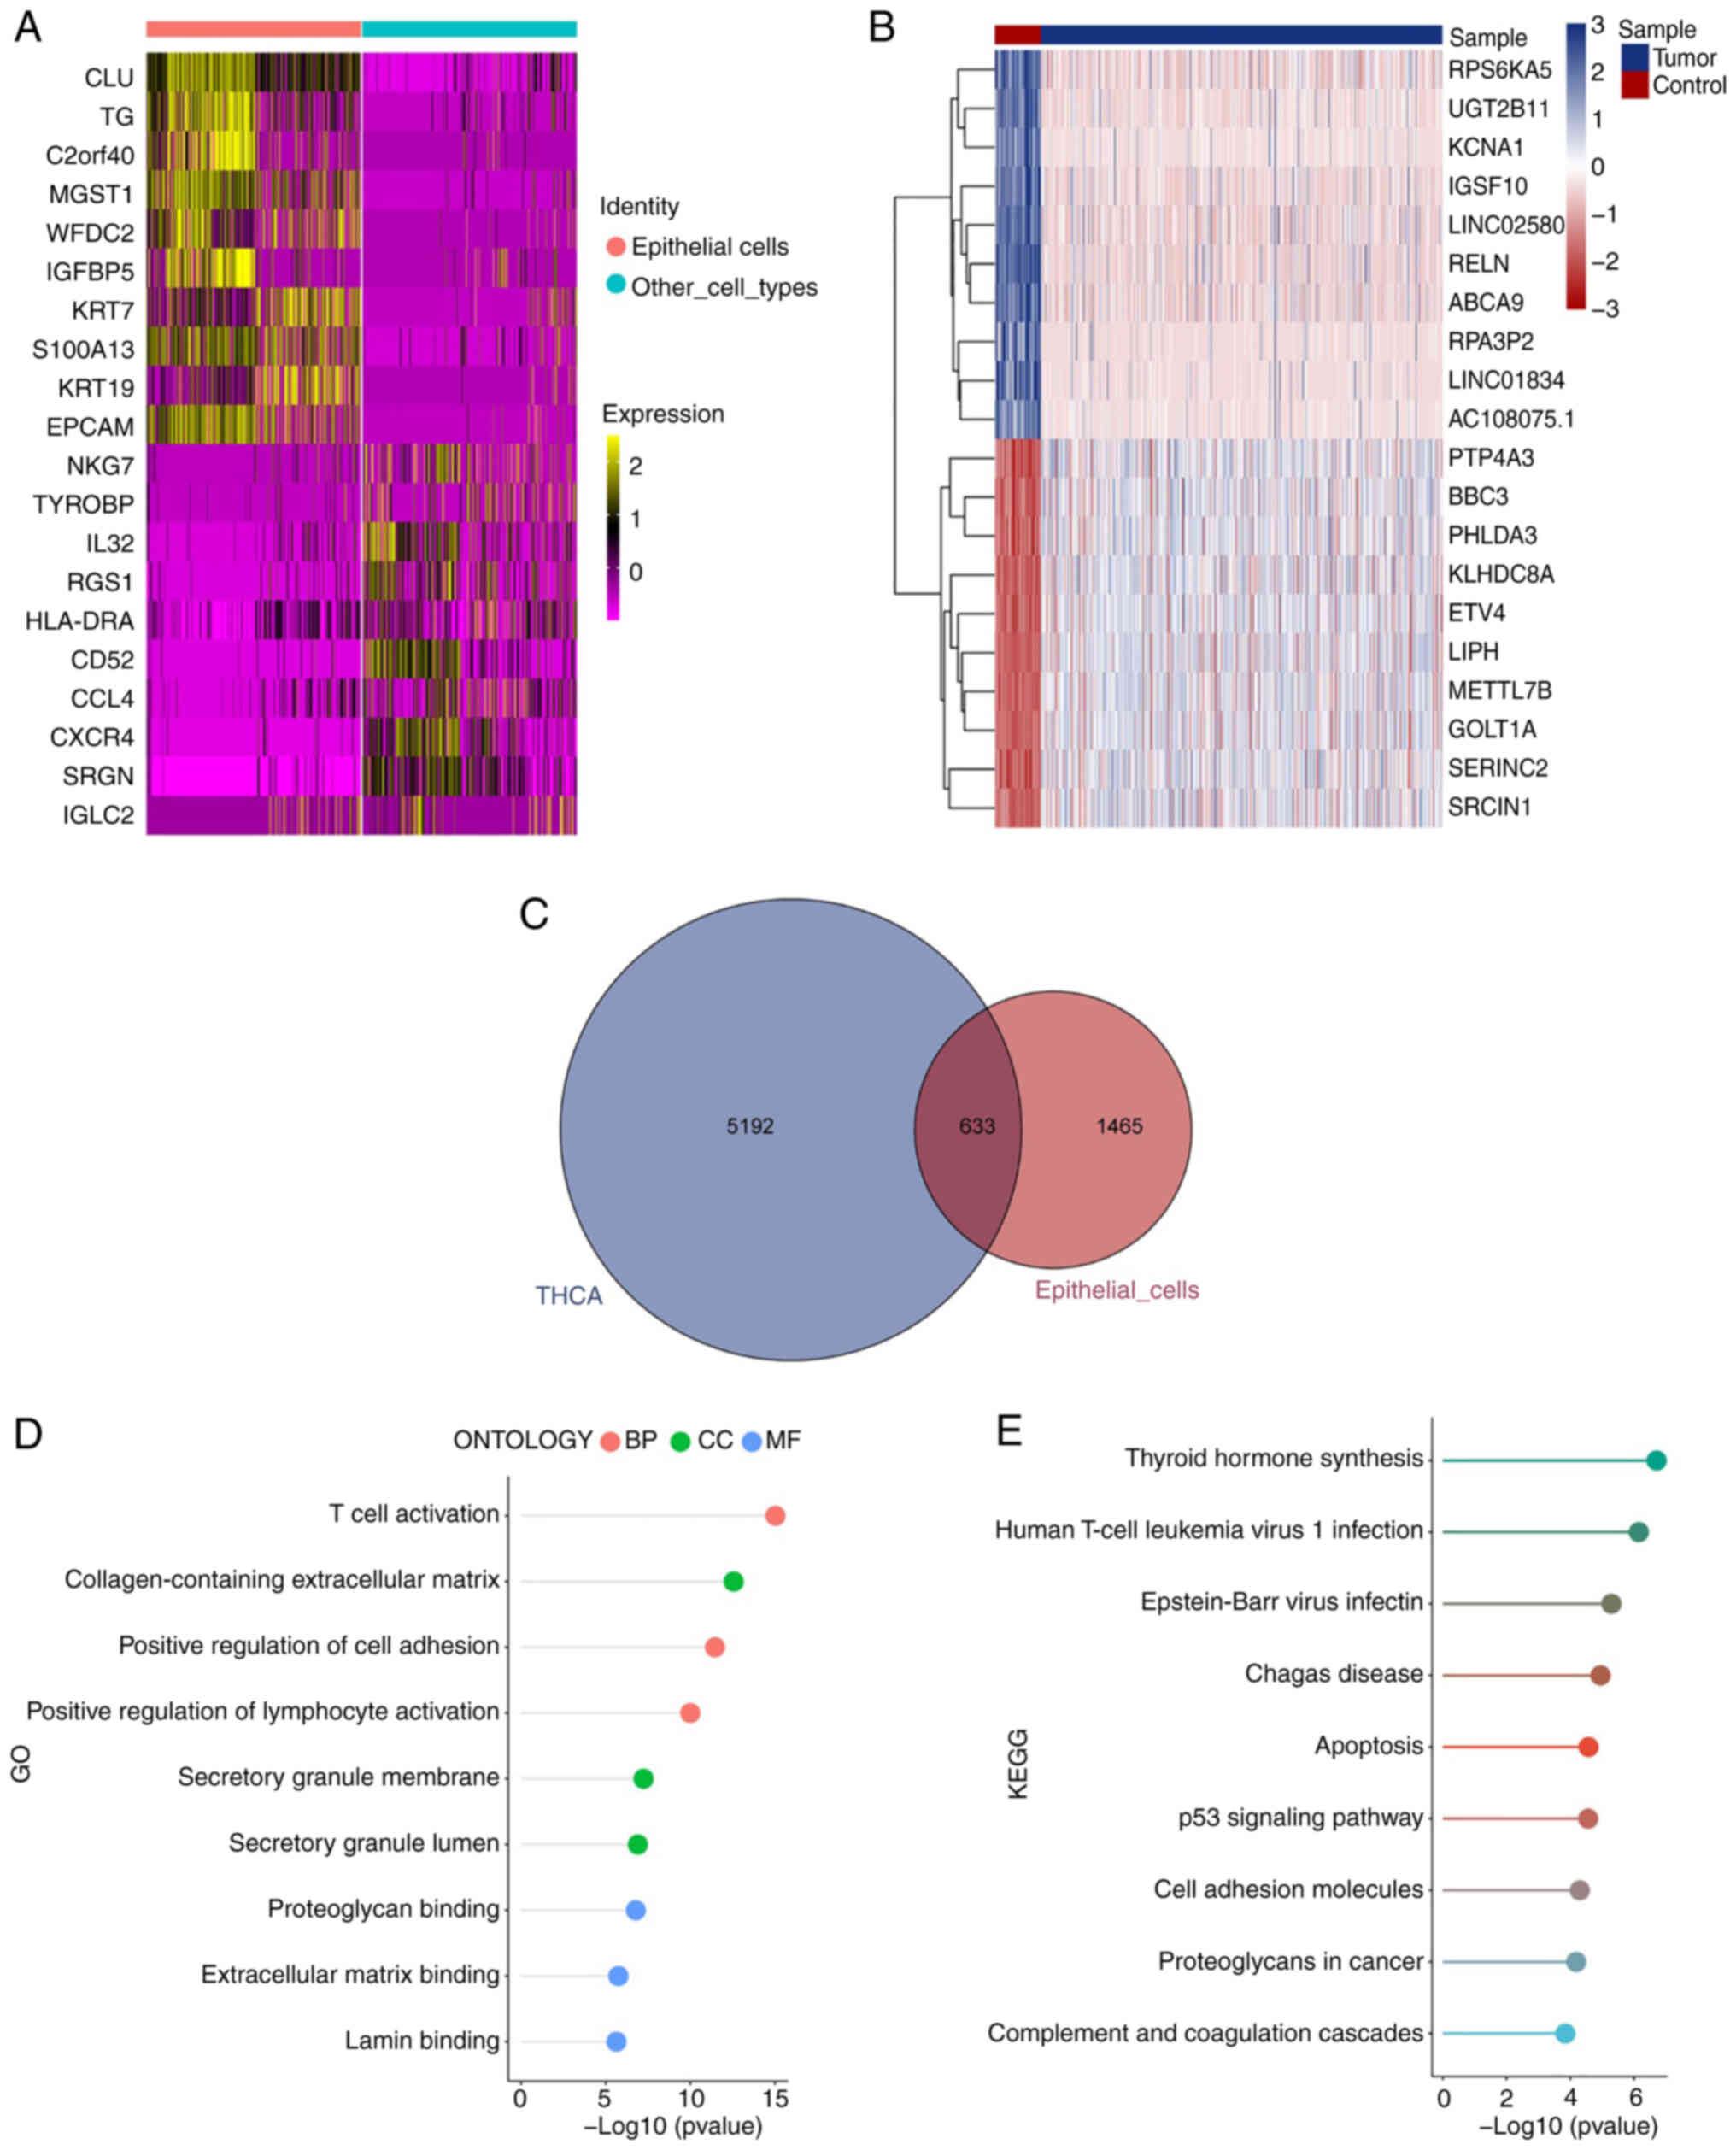
Analysis of gene enrichment in TC
focusing on DEGs associated with glutamine metabolism
A total of 2,098 DEGs were uncovered between
epithelial cells and other cell types, with P<0.05 and |Log2
fold change|>0.25 (Table SIV
and Fig. 5A). A total of 5,825
DEGs were found between TC issues and control thyroid issues
(P<0.05, |Log2 fold change|>0.5). The top 10 upregulated and
downregulated genes in TC samples are displayed in a heatmap
(Table SV, Fig. 5B). The intersection between the two
types of DEGs yielded 633 hub genes (Table SVI; Fig. 5C). To explore the biological roles
of the central genes, the GO (Table
SVII) and KEGG analyses (Table
SVIII) were conducted. These genes were enriched in pathways
linked to T cell (GO: 0042110), lymphocyte activation (GO: 0051251)
and cell adhesion (GO: 0045785; Fig.
5D). The enhanced KEGG pathways comprised the synthesis of
thyroid hormone (hsa04918), infection by human T-cell leukemia
(hsa05166) and Epstein-Barr virus (hsa05169; Fig. 5E).
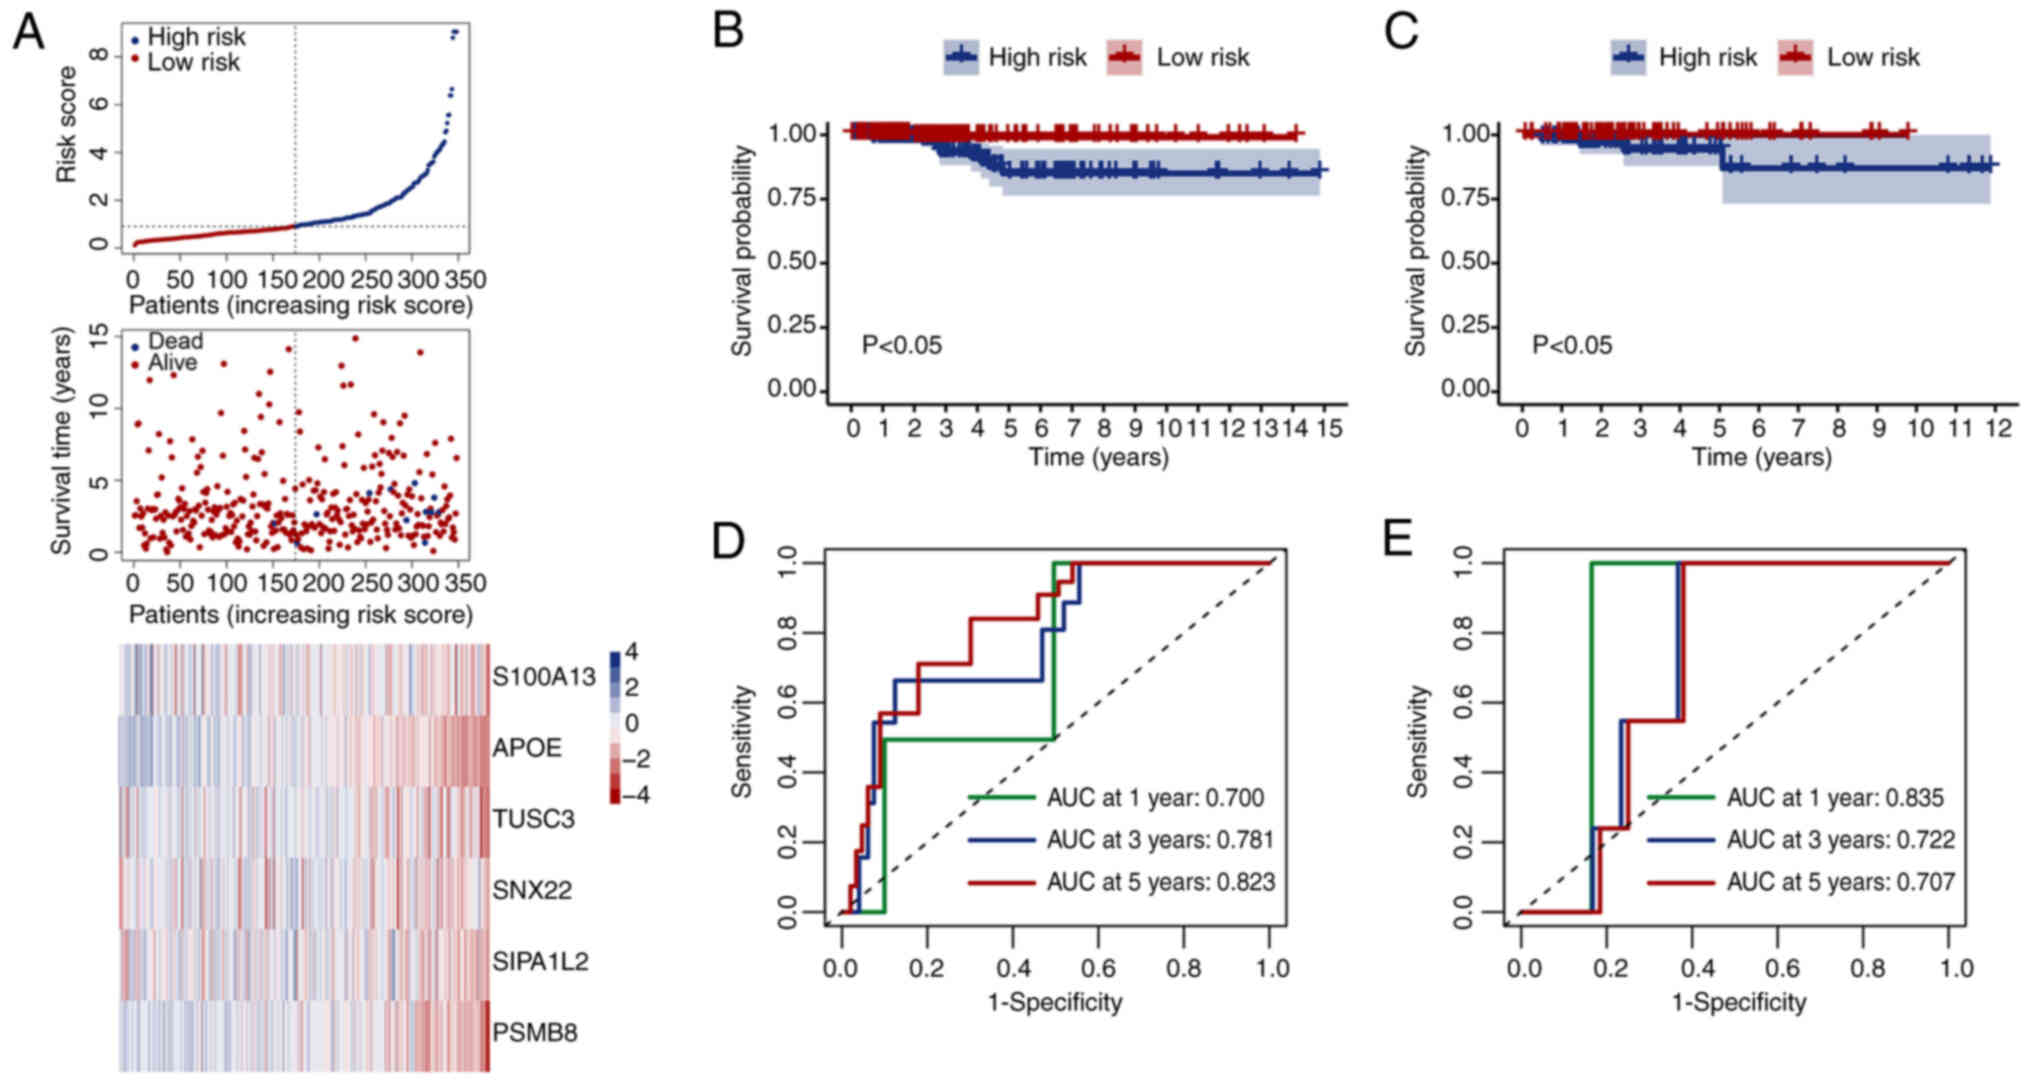
Establishment and verification of a
prognostic risk model
DEGs in epithelial cells were compared with those in
TC and control groups. Signature genes in epithelial cells were
distinguished utilizing the K-M curve with P<0.05. In Table SIX, 63 TC-associated genes were
ultimately pinpointed. Boruta was further screened among 63 targets
and 17 genes were obtained. The model was constructed by
multivariate COX and the genes with a linear relationship with each
other were removed by collinearity analysis and six genes were
obtained after optimizing the model, with the seed value set to 78.
A total of six genes (S100A13, APOE, TUSC3, SNX22, SIPA1L2 and
PSMB8) associated with TC prognosis were discovered. 70% of TC
samples (n=502) were chosen for the training set (n=348), while 30%
of samples were allocated to the validation set (n=154). The model
constructed based on these six genes was evaluated by dividing the
samples into high- and low-risk categories according to the median
score. Risk scores, survival time and levels of six genes in
various groups from the training set are displayed in Fig. 6A. The high-risk population
exhibited a greater density of death states and increased gene
levels. Survival curves were generated for patients in various
groups in the training (Fig. 6B)
and validation sets (Fig. 6C).
High-risk populations had notably worse prognoses than low-risk
populations across all cohorts. The effectiveness of the model in
forecasting patient outcomes was assessed using ROC curves. The
training set showed 0.7, 0.781 and 0.823 AUC values for 1-, 3- and
5-year survival rates, respectively (Fig. 6D). The validation cohort showed AUC
values of 0.835, 0.722 and 0.707, respectively (Fig. 6E). To explore the mechanisms
underlying these DEGs, GSEA using MSigDB Collection identified that
LYSINE_DEGRADATION, PROPANOATE_METABOLISM and
ASCORBATE_AND_ALDARATE_METABOLISM were enriched in the high-risk
cohorts, while TYPE_I_DIABETES_MELLITUS, ALLOGRAFT_REJECTION and
SYSTEMIC_LUPUS_ERYTHEMATOSUS were enriched in the low-risk cohorts
(Fig. S2A-F; Table SX). Additionally, GSVA
highlighted five pathways with the most notable differences between
the high-risk and low-risk populations (Fig. S2G; Table SXI).
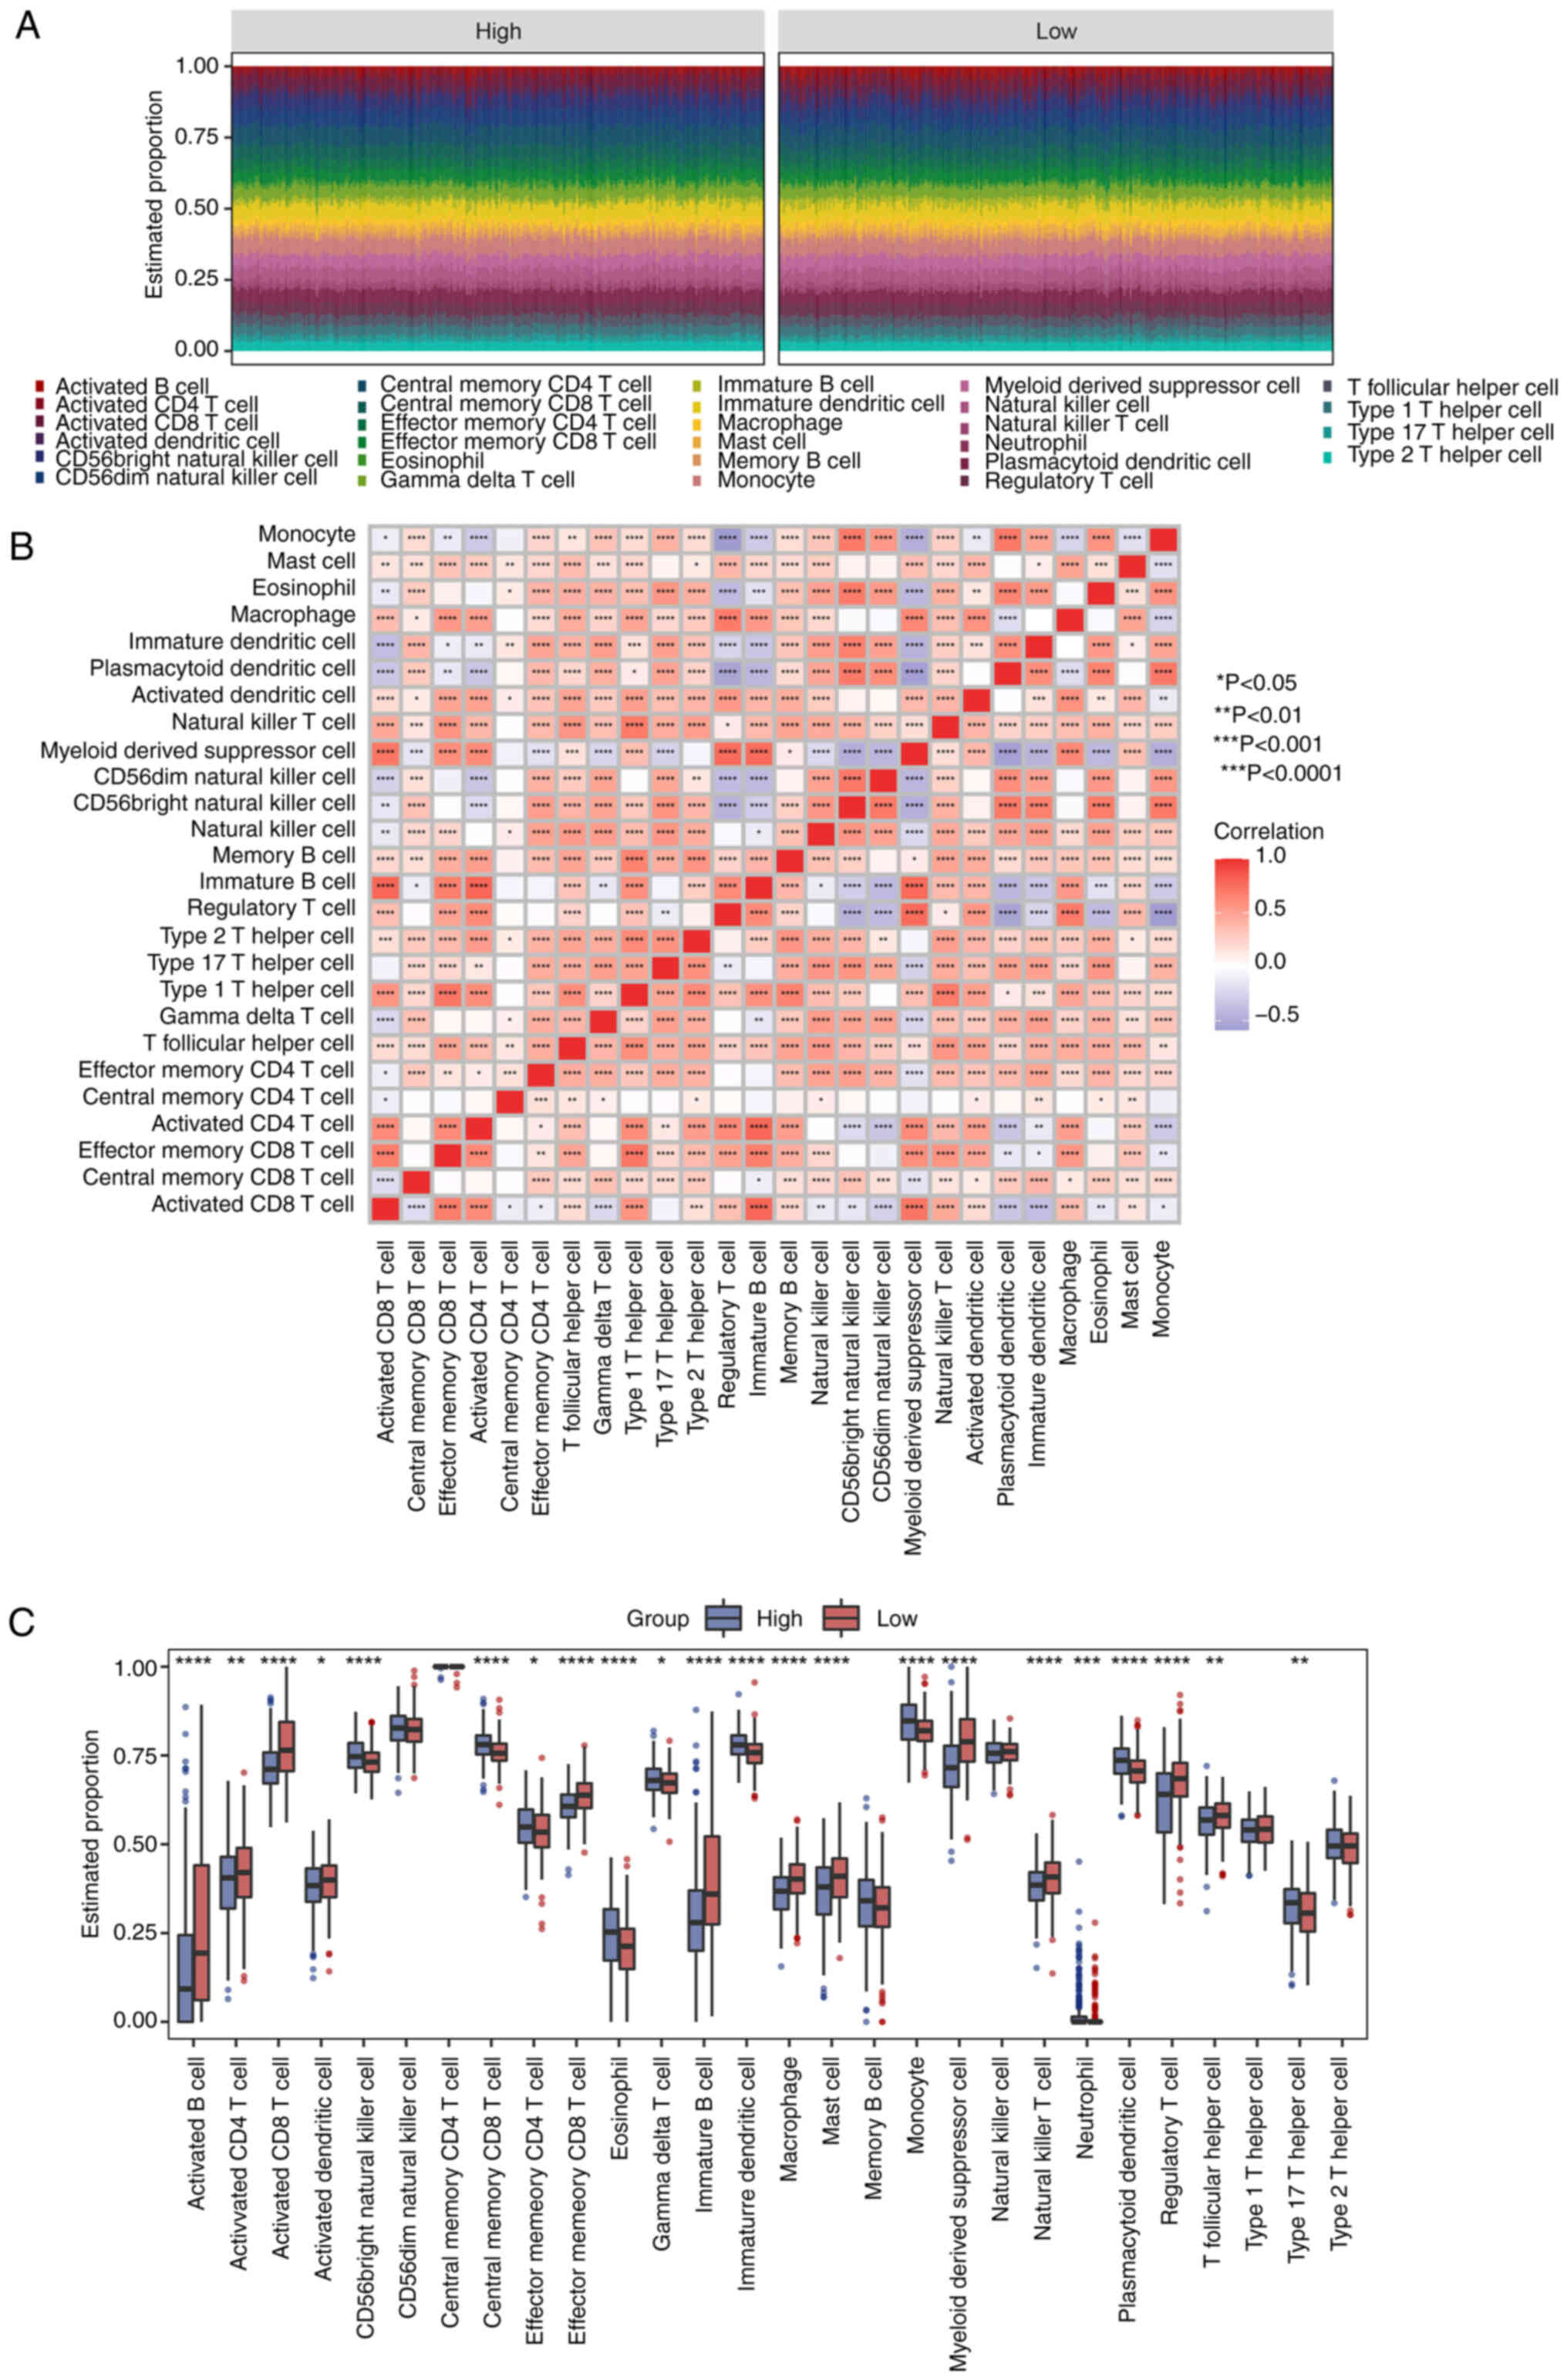
Immune infiltration analysis
The infiltration of 28 immune cells was evaluated by
the ssGSEA technique (Table
SXII). The proportions of 28 cells were manifested in a stacked
bar plot (Fig. 7A). In addition,
cell division differed among TC patients. Most immune cells showed
positive correlations with others (Fig. 7B). Monocytes were negatively linked
with myeloid-derived suppressor cells (Fig. 7B). Noticeable differences were
observed between the high-risk and low-risk populations in
Activated B cell, Activated CD4 T cell and Activated CD8 T cell
(P<0.05; Fig. 7C).
Construction and verification of
nomogram
To verify whether the risk score can serve as an
independent prognostic factor, univariate Cox regression analysis
was performed on the patients' clinical characteristics, such as
age, stage and sex. All clinical data were sourced from the TCGA
database. The results of the univariate Cox regression analysis
indicated that stage, age and risk score were all associated with
the patients' prognostic risk (Fig.
8A). Based on the prognostic risk factors obtained from the R
package RMS and one-way COX, the present study constructed a
nomogram of prognostic diagnosis (Fig.
8D) and detected its diagnostic value by ROC curve and
calibration curve. AUC values for survival rates at 1, 3 and 5
years were 0.979, 0.941 and 0.939, respectively (Fig. 8B). The results indicated that the
prognostic model had good diagnostic value for the prognosis of
patients. The calibration curve also shows minimal deviation from
the ideal model, suggesting good predictive performance of the
model (Fig. 8C).
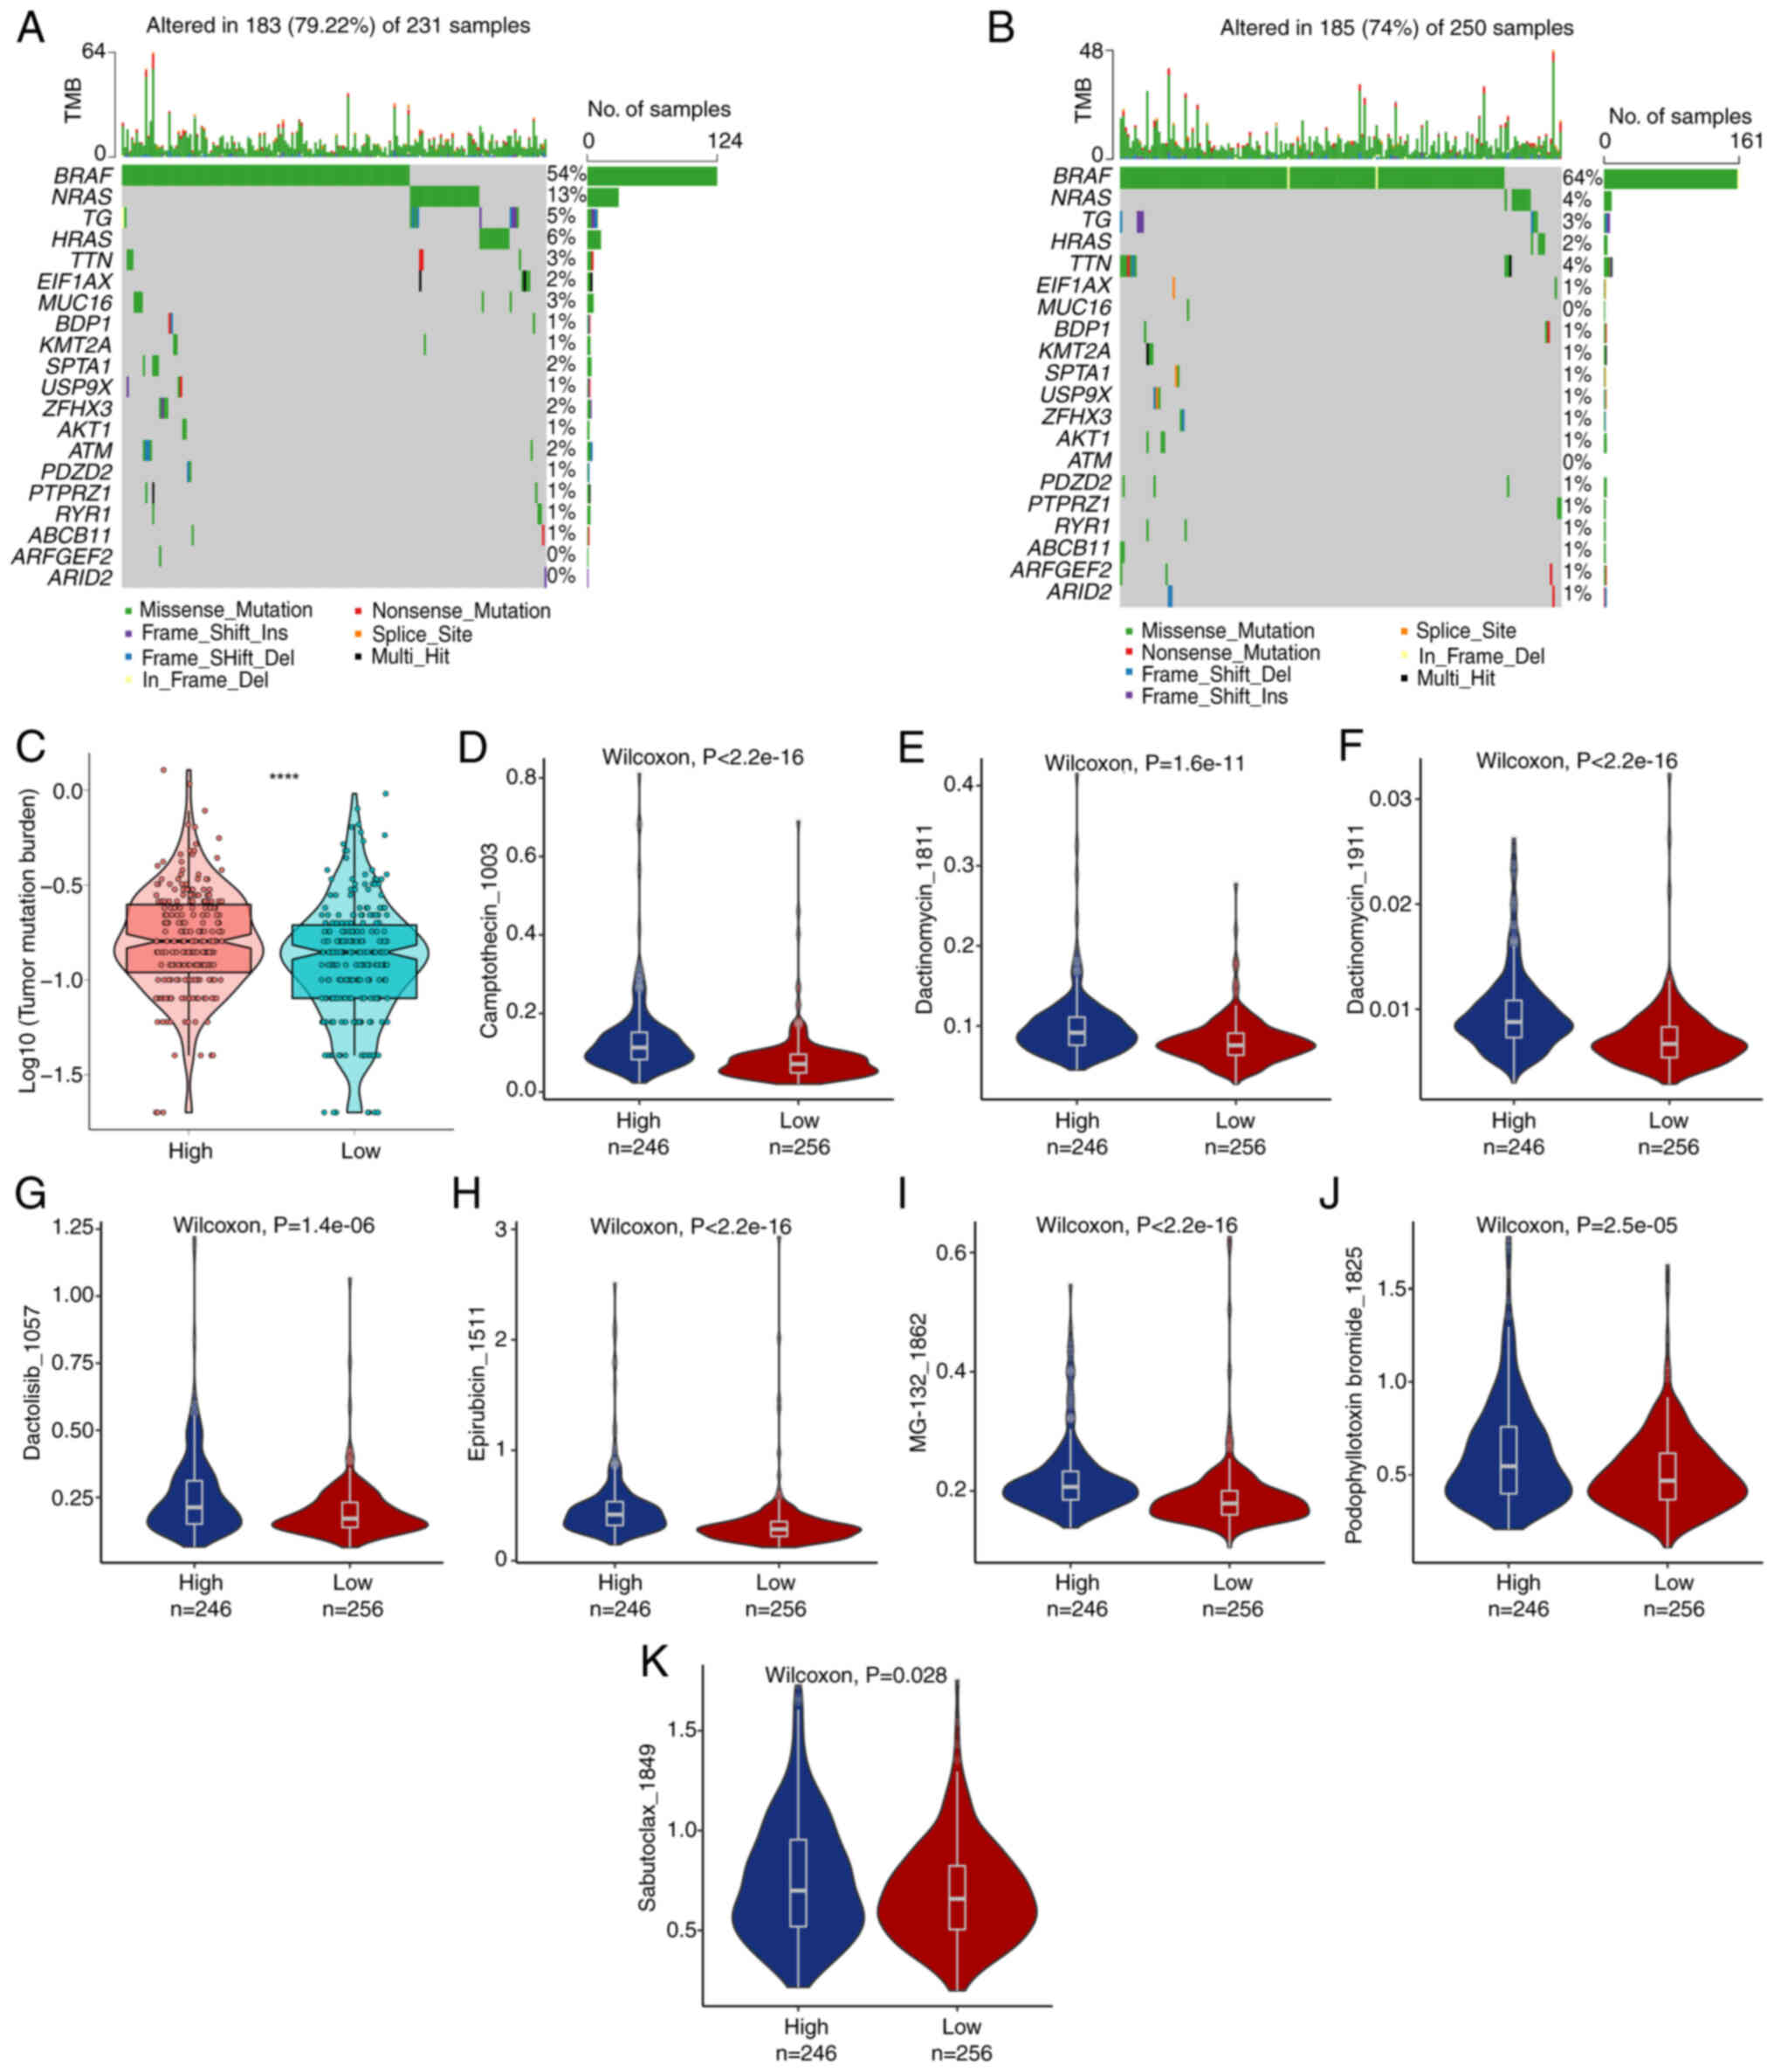
TMB and drug susceptibility
analysis
The specific genetic mutation in TC was evaluated
and the top 20 driver genes with frequent mutations were screened.
BRAF was the most frequent mutation, followed by NRAS (Fig. 9A and B). TMB is a vital element in
determining response to immunotherapy. Consequently, genetic
mutations related to TC were examined. The high-risk population
displayed markedly greater TMB than the low-risk population
(P<0.05; Fig. 9C). The present
study focused on determining the effectiveness of risk scores in
predicting chemotherapy response in TC patients. Camptothecin_1003,
Dactinomycin_1811, Dactinomycin_1911, Dactolisib_1057,
Epirubicin_1511, MG-132_1862, Podophyllotoxin bromide_1825 and
Sabutoclax_1849 were investigated for the clinical efficiency of TC
treatment (Table SXIII).
Low-risk patients may exhibit high sensitivity to Camptothecin_1003
(Fig. 9D), Dactinomycin_1811
(Fig. 9E), Dactinomycin_1911
(Fig. 9F), Dactolisib_1057
(Fig. 9G), Epirubicin_1511
(Fig. 9H), MG-132_1862 (Fig. 9I), Podophyllotoxin bromide_1825
(Fig. 9J) and Sabutoclax_1849
(Fig. 9K). These results suggest
that chemotherapy could be a favorable option for low-risk
individuals.
Validation of levels of six genes in
TC cell lines
The mRNA levels of S100A13, APOE, TUSC3, SNX22,
SIPA1L2 and PSMB8 differ between normal thyroid cells (Nthy-ori3-1)
and TC cell lines (TPC-1, BCPAP). S100A13, APOE, TUSC3, SNX22 and
SIPA1L2 have higher mRNA expression levels in the BCPAP cell line
compared to normal thyroid cells, while APOE, TUSC3, SNX22 and
SIPA1L2 have higher expression levels in the TPC-1 cell line
compared to normal thyroid cells. However, the expression level
changes of S100A13 and PSMB8 in the TPC-1 cell line were not
statistically significant (Fig.
10A).
Validation of SIPA1L2 in vitro
Existing literature reports that the TUSC3 and APOE
genes play a role in promoting disease progression in TC (44,45).
The present study found that the changes in mRNA expression levels
of PSMB8 and S100A13 genes in TPC-1 cells were not statistically
significant. SNX22 itself is expressed at low levels in TC and is
not easily knocked down. Therefore, the present study chose to
validate the role of the SIPA1L2 gene in TC cells. After knocking
down the SIPA1L2 gene, mRNA level detection revealed that it could
be knocked down by more than 50% (Fig. 10B), followed by functional
validation. After SIPA1L2 knockdown, EDU proliferation experiments
detected enhanced proliferation ability in BCPAP and TPC-1 cell
lines (Fig. 10C and D), scratch
experiments detected enhanced migration ability in BCPAP and TPC-1
cell lines (Fig. 10E and F) and
Transwell chamber experiments found enhanced invasion ability in
BCPAP and TPC-1 cell lines (Fig. 10G
and H). This indicated that SIPA1L2, as a protective gene, can
inhibit the proliferation, migration and invasion abilities of TC
cells.
Discussion
As immunotherapy continues to evolve, the importance
of predictive biomarkers for response to immunotherapy is
increasingly recognized (46,47).
The effect of TME on the efficacy of cancer immunotherapy has been
extensively studied and TME-related biomarkers are currently
receiving increasing attention (48). However, reliable biomarkers and
models that specifically target the impact of the TC TME on
immunotherapy responses and prognosis remain limited. The
continuous refinement of scRNA-seq technology has aided the
thorough understanding of infiltrating immune cells in the TME. The
present study analyzed seven TC samples using scRNA-seq and
identified seven distinct cell types. The activity of glutamine
metabolism-related genes was calculated using the AUCell algorithm,
which revealed that these genes had the highest activity levels in
epithelial cells. This result demonstrated that glutamine might
regulate epithelial cells to influence TC progression. Pseudotime
analysis indicated that the transition of epithelial cells from one
state to another state during TC progression was related to
metabolic and cell interactions. Further analysis uncovered the
central roles of epithelial cells, macrophages and T cells in
cellular communication, indicating the vital interaction between
epithelial and immune cells for immune regulation and disease
progression. Genes co-expressed in epithelial and TC cells were
identified via the TCGA and GEO databases. Subsequent GO and KEGG
analyses elucidated that epithelial cells might be instrumental in
TC development through specific biological processes and pathways.
Through Cox and Boruta feature selection techniques, six genes were
pinpointed and used to establish a prognostic model. To ensure
comprehensive validation and broad applicability of the prognostic
markers, the present study established two cohorts (TCGA: training
cohort and test cohort). A risk-scoring system was developed based
on these six prognostic genes and cohorts were allocated to low-
and high-risk subgroups. These markers consistently showed
satisfactory performance in both cohorts, with worse outcomes in
the high-risk subgroup, distinct variances in TME features between
two subgroups and reliable accuracy for predicting 1-, 3- and
5-year OS.
GSEA and GSVA analyses of DEGs revealed that
pathways such as lysine degradation, propionic acid metabolism and
ascorbate and aldarate metabolism positively regulated TC
progression, emphasizing the crucial role of metabolic programming
in the TME. Among the six genes (S100A13, APOE, TUSC3, SNX22,
SIPA1L2 and PSMB8) linked to these traits, APOE has been recognized
as a predictive marker for immune infiltration in TC; FTO hinders
glycolysis and TC progression by reducing APOE mRNA stability in an
N6-methyladenosine-dependent manner (45,49).
ZFPM1-AS1 transcription, mediated by STAT2, controls TC cell
proliferation, movement and infiltration via the miR-515-5p/TUSC3
axis, where TUSC3 functions as an oncogene to enhance TC cell
growth (44). miR-451a blocks
epithelial-mesenchymal transition and triggers apoptosis in TC
cells by targeting PSMB8 (50).
S100A13 can promote TC progression in xenografted mouse models and
HMGA1 enhances the proliferation and invasion of TC cells by
upregulating S100A13 (51). These
findings demonstrate the significant role of these four genes in TC
progression. However, the involvement of SIPA1L2 in TC has not been
studied. SIPA1, a member of the same family, is critical in the
growth and metastasis of breast cancer (52). Additionally, research indicates
that SNX22 could potentially be associated with radioresistance in
nasopharyngeal cancer (53).
Consistent with database analyses, these six genes showed mRNA
expression differences in cell lines. Analysis of immune
infiltration revealed varied immune cell populations, with a
notable negative association between CD8+ T cells and
certain shared genes. This highlights the significance of
epithelial and immune cell interactions in TC progression within
the TME. Furthermore, the nomogram combining clinical features and
risk scores could predict individualized survival for TC patients.
In addition, drug sensitivity analysis uncovered that low-risk
individuals might exhibit heightened responses to treatments
involving Dactinomycin_1911 and MG-132_1862. Additionally, mRNA
levels of these six genes were validated in two TC cell lines,
largely consistent with database analyses. Based on existing
literature and expression differences of the six genes, highly
expressed SIPA1L2 in two TC cell lines was selected for knockdown
experiments to study its role in TC cells. Following SIPA1L2
knockdown, the proliferation, migration and invasion abilities of
TPC-1 and BCPAP cells were enhanced, indicating that SIPA1L2 may
function as a tumor suppressor gene in these two TC cell lines.
Although the present study was not able to collect clinical samples
from hospitals to construct a prognostic model, the predictive
model the present study was built using existing public databases
can be used for subsequent prognostic predictions in patients with
clinical TC. It is hoped to have the opportunity to conduct
large-scale prospective clinical studies in the future to test the
predictive importance of these prognostic features and to carry out
further functional analysis and mechanism research.
Supplementary Material
Supporting Data
Supporting Data
Supporting Data
Supporting Data
Supporting Data
Supporting Data
Supporting Data
Supporting Data
Supporting Data
Supporting Data
Supporting Data
Supporting Data
Supporting Data
Supporting Data
Acknowledgements
Not applicable.
Funding
Funding: No funding was received.
Availability of data and materials
Data analyzed in the present study were sourced from
GEO under GSE184362 and TCGA. The datasets generated in the present
study may be requested from the corresponding author.
Authors' contributions
YiY, YHZ, ZLC and LCD participated in the study
design, performed the preliminary analysis and drafted the article.
YiY completed the experimental section. YPS, QW, WL and YX
participated in data collection and literature review. FXT, HLD,
YaY, JZ, YXG and YCL participated in data analysis. YH participated
in study design, article revisions and provided experimental
resources. YH, YiY and YHZ verified the authenticity of the raw
data. All authors read and approved the final version of the
manuscript.
Ethics approval and consent to
participate
Not applicable.
Patient consent for publication
Not applicable.
Competing interests
The authors declare that they have no competing
interests.
References
|
1
|
Carling T and Udelsman R: Thyroid cancer.
Annu Rev Med. 65:125–137. 2014. View Article : Google Scholar : PubMed/NCBI
|
|
2
|
Laha D, Nilubol N and Boufraqech M: New
therapies for advanced Thyroid cancer. Front Endocrinol (Lausanne).
11:822020. View Article : Google Scholar : PubMed/NCBI
|
|
3
|
Lim H, Devesa SS, Sosa JA, Check D and
Kitahara CM: Trends in thyroid cancer incidence and mortality in
the United States, 1974–2013. JAMA. 317:1338–1348. 2017. View Article : Google Scholar : PubMed/NCBI
|
|
4
|
Chen DW, Lang BHH, McLeod DSA, Newbold K
and Haymart MR: Thyroid cancer. Lancet. 401:1531–1544. 2023.
View Article : Google Scholar : PubMed/NCBI
|
|
5
|
Grimm D: Recent advances in thyroid cancer
research. Int J Mol Sci. 23:46312022. View Article : Google Scholar : PubMed/NCBI
|
|
6
|
Maniakas A, Dadu R, Busaidy NL, Wang JR,
Ferrarotto R, Lu C, Williams MD, Gunn GB, Hofmann MC, Cote G, et
al: Evaluation of overall survival in patients with anaplastic
thyroid carcinoma, 2000–2019. JAMA Oncol. 6:1397–1404. 2020.
View Article : Google Scholar : PubMed/NCBI
|
|
7
|
Araque KA, Gubbi S and Klubo-Gwiezdzinska
J: Updates on the management of thyroid cancer. Horm Metab Res.
52:562–577. 2020. View Article : Google Scholar : PubMed/NCBI
|
|
8
|
Salgado SA, Kaye ER, Sargi Z, Chung CH and
Papaleontiou M: Management of advanced thyroid cancer: Overview,
advances, and opportunities. Am Soc Clin Oncol Educ Book.
43:e3897082023. View Article : Google Scholar : PubMed/NCBI
|
|
9
|
Nakahara R, Maeda K, Aki S and Osawa T:
Metabolic adaptations of cancer in extreme tumor microenvironments.
Cancer Sci. 114:1200–1207. 2023. View Article : Google Scholar : PubMed/NCBI
|
|
10
|
Yang L, Venneti S and Nagrath D:
Glutaminolysis: A hallmark of cancer metabolism. Annu Rev Biomed
Eng. 19:163–194. 2017. View Article : Google Scholar : PubMed/NCBI
|
|
11
|
Li T and Le A: Glutamine metabolism in
cancer. Adv Exp Med Biol. 1063:13–32. 2018. View Article : Google Scholar : PubMed/NCBI
|
|
12
|
Liu PS, Chen YT, Li X, Hsueh PC, Tzeng SF,
Chen H, Shi PZ, Xie X, Parik S, Planque M, et al: CD40 signal
rewires fatty acid and glutamine metabolism for stimulating
macrophage anti-tumorigenic functions. Nat Immunol. 24:452–462.
2023. View Article : Google Scholar : PubMed/NCBI
|
|
13
|
Jin L, Alesi GN and Kang S: Glutaminolysis
as a target for cancer therapy. Oncogene. 35:3619–3625. 2016.
View Article : Google Scholar : PubMed/NCBI
|
|
14
|
Yu Y, Yu X, Fan C, Wang H, Wang R, Feng C
and Guan H: Targeting glutaminase-mediated glutamine dependence in
papillary thyroid cancer. J Mol Med (Berl). 96:777–790. 2018.
View Article : Google Scholar : PubMed/NCBI
|
|
15
|
Zhang GQ, Xi C, Ju NT, Shen CT, Qiu ZL,
Song HJ and Luo QY: Targeting glutamine metabolism exhibits
anti-tumor effects in thyroid cancer. J Endocrinol Invest.
47:1953–1969. 2024. View Article : Google Scholar : PubMed/NCBI
|
|
16
|
Chen S, Zhou Z, Li Y, Du Y and Chen G:
Application of single-cell sequencing to the research of tumor
microenvironment. Front Immunol. 14:12855402023. View Article : Google Scholar : PubMed/NCBI
|
|
17
|
Ren X, Zhang L, Zhang Y, Li Z, Siemers N
and Zhang Z: Insights gained from single-cell analysis of immune
cells in the tumor microenvironment. Annu Rev Immunol. 39:583–609.
2021. View Article : Google Scholar : PubMed/NCBI
|
|
18
|
Liu L, Hou Y, Deng C, Tao Z, Chen Z, Hu J
and Chen K: Single cell sequencing reveals that CD39 inhibition
mediates changes to the tumor microenvironment. Nat Commun.
13:67402022. View Article : Google Scholar : PubMed/NCBI
|
|
19
|
Hao X, Zheng Z, Liu H, Zhang Y, Kang J,
Kong X, Rong D, Sun G, Sun G, Liu L, et al: Inhibition of APOC1
promotes the transformation of M2 into M1 macrophages via the
ferroptosis pathway and enhances anti-PD1 immunotherapy in
hepatocellular carcinoma based on single-cell RNA sequencing. Redox
Biol. 56:1024632022. View Article : Google Scholar : PubMed/NCBI
|
|
20
|
Colaprico A, Silva TC, Olsen C, Garofano
L, Cava C, Garolini D, Sabedot TS, Malta TM, Pagnotta SM,
Castiglioni I, et al: TCGAbiolinks: An R/Bioconductor package for
integrative analysis of TCGA data. Nucleic Acids Res. 44:e712016.
View Article : Google Scholar : PubMed/NCBI
|
|
21
|
Butler A, Hoffman P, Smibert P, Papalexi E
and Satija R: Integrating single-cell transcriptomic data across
different conditions, technologies, and species. Nat Biotechnol.
36:411–420. 2018. View Article : Google Scholar : PubMed/NCBI
|
|
22
|
Van de Sande B, Flerin C, Davie K, De
Waegeneer M, Hulselmans G, Aibar S, Seurinck R, Saelens W, Cannoodt
R, Rouchon Q, et al: A scalable SCENIC workflow for single-cell
gene regulatory network analysis. Nat Protoc. 15:2247–2276. 2020.
View Article : Google Scholar : PubMed/NCBI
|
|
23
|
Qiu X, Mao Q, Tang Y, Wang L, Chawla R,
Pliner HA and Trapnell C: Reversed graph embedding resolves complex
single-cell trajectories. Nat Methods. 14:979–982. 2017. View Article : Google Scholar : PubMed/NCBI
|
|
24
|
Karmaus PWF, Chen X, Lim SA, Herrada AA,
Nguyen TM, Xu B, Dhungana Y, Rankin S, Chen W, Rosencrance C, et
al: Metabolic heterogeneity underlies reciprocal fates of T(H)17
cell stemness and plasticity. Nature. 565:101–105. 2019. View Article : Google Scholar : PubMed/NCBI
|
|
25
|
Armingol E, Officer A, Harismendy O and
Lewis NE: Deciphering cell-cell interactions and communication from
gene expression. Nat Rev Genet. 22:71–88. 2021. View Article : Google Scholar : PubMed/NCBI
|
|
26
|
Fang Z, Tian Y, Sui C, Guo Y, Hu X, Lai Y,
Liao Z, Li J, Feng G, Jin L and Qian K: Single-Cell transcriptomics
of proliferative phase endometrium: Systems analysis of cell-cell
communication network using CellChat. Front Cell Dev Biol.
10:9197312022. View Article : Google Scholar : PubMed/NCBI
|
|
27
|
Gene Ontology Consortium, . Gene ontology
consortium: Going forward. Nucleic Acids Res. 43:D1049–D1056. 2015.
View Article : Google Scholar : PubMed/NCBI
|
|
28
|
Kanehisa M and Goto S: KEGG: Kyoto
encyclopedia of genes and genomes. Nucleic Acids Res. 28:27–30.
2000. View Article : Google Scholar : PubMed/NCBI
|
|
29
|
Yu G, Wang LG, Han Y and He QY:
clusterProfiler: An R package for comparing biological themes among
gene clusters. OMICS. 16:284–287. 2012. View Article : Google Scholar : PubMed/NCBI
|
|
30
|
Ye Z, An S, Gao Y, Xie E, Zhao X, Guo Z,
Li Y, Shen N, Ren J and Zheng J: The prediction of in-hospital
mortality in chronic kidney disease patients with coronary artery
disease using machine learning models. Eur J Med Res. 28:332023.
View Article : Google Scholar : PubMed/NCBI
|
|
31
|
Subramanian A, Tamayo P, Mootha VK,
Mukherjee S, Ebert BL, Gillette MA, Paulovich A, Pomeroy SL, Golub
TR, Lander ES and Mesirov JP: Gene set enrichment analysis: A
knowledge-based approach for interpreting genome-wide expression
profiles. Proc Natl Acad Sci USA. 102:15545–15550. 2005. View Article : Google Scholar : PubMed/NCBI
|
|
32
|
Ritchie ME, Phipson B, Wu D, Hu Y, Law CW,
Shi W and Smyth GK: limma powers differential expression analyses
for RNA-sequencing and microarray studies. Nucleic Acids Res.
43:e472015. View Article : Google Scholar : PubMed/NCBI
|
|
33
|
Liberzon A, Subramanian A, Pinchback R,
Thorvaldsdóttir H, Tamayo P and Mesirov JP: Molecular signatures
database (MSigDB) 3.0. Bioinformatics. 27:1739–1740. 2011.
View Article : Google Scholar : PubMed/NCBI
|
|
34
|
Liberzon A, Birger C, Thorvaldsdóttir H,
Ghandi M, Mesirov JP and Tamayo P: The molecular signatures
database (MSigDB) hallmark gene set collection. Cell Syst.
1:417–425. 2015. View Article : Google Scholar : PubMed/NCBI
|
|
35
|
Fan X, Chen H, Jiang F, Xu C, Wang Y, Wang
H, Li M, Wei W, Song J, Zhong D and Li G: Comprehensive analysis of
cuproptosis-related genes in immune infiltration in ischemic
stroke. Front Neurol. 13:10771782022. View Article : Google Scholar : PubMed/NCBI
|
|
36
|
Wu S, Lv X and Li Y, Gao X, Ma Z, Fu X and
Li Y: Integrated Machine learning and single-sample gene set
enrichment analysis identifies a TGF-beta signaling pathway derived
score in headneck squamous cell carcinoma. J Oncol.
2022:31402632022. View Article : Google Scholar : PubMed/NCBI
|
|
37
|
Ru B, Wong CN, Tong Y, Zhong JY, Zhong
SSW, Wu WC, Chu KC, Wong CY, Lau CY, Chen I, et al: TISIDB: An
integrated repository portal for tumor-immune system interactions.
Bioinformatics. 35:4200–4202. 2019. View Article : Google Scholar : PubMed/NCBI
|
|
38
|
Ito K and Murphy D: Application of ggplot2
to pharmacometric graphics. CPT Pharmacometrics Syst Pharmacol.
2:e792013. View Article : Google Scholar : PubMed/NCBI
|
|
39
|
Maeser D, Gruener RF and Huang RS:
oncoPredict: An R package for predicting in vivo or cancer patient
drug response and biomarkers from cell line screening data. Brief
Bioinform. 22:bbab2602021. View Article : Google Scholar : PubMed/NCBI
|
|
40
|
Yang W, Soares J, Greninger P, Edelman EJ,
Lightfoot H, Forbes S, Bindal N, Beare D, Smith JA, Thompson IR, et
al: Genomics of drug sensitivity in cancer (GDSC): A resource for
therapeutic biomarker discovery in cancer cells. Nucleic Acids Res.
41:D955–D961. 2013. View Article : Google Scholar : PubMed/NCBI
|
|
41
|
Mayakonda A, Lin DC, Assenov Y, Plass C
and Koeffler HP: Maftools: Efficient and comprehensive analysis of
somatic variants in cancer. Genome Res. 28:1747–1756. 2018.
View Article : Google Scholar : PubMed/NCBI
|
|
42
|
Liu Z, Wang L, Guo C, Liu L, Jiao D, Sun
Z, Wu K, Zhao Y and Han X: TTN/OBSCN ‘Double-Hit’ predicts
favourable prognosis, ‘immune-hot’ subtype and potentially better
immunotherapeutic efficacy in colorectal cancer. J Cell Mol Med.
25:3239–3251. 2021. View Article : Google Scholar : PubMed/NCBI
|
|
43
|
Schmittgen TD and Livak KJ: Analyzing
real-time PCR data by the comparative C(T) method. Nat Protoc.
3:1101–1108. 2008. View Article : Google Scholar : PubMed/NCBI
|
|
44
|
Ren R, Du Y, Niu X and Zang R: ZFPM2-AS1
transcriptionally mediated by STAT1 regulates thyroid cancer cell
growth, migration and invasion via miR-515-5p/TUSC3. J Cancer.
12:3393–3406. 2021. View Article : Google Scholar : PubMed/NCBI
|
|
45
|
Lin X, Zhang J, Zhao RH, Zhang WJ, Wu JF
and Xue G: APOE is a prognostic biomarker and correlates with
immune infiltrates in papillary thyroid carcinoma. J Cancer.
13:1652–1663. 2022. View Article : Google Scholar : PubMed/NCBI
|
|
46
|
Zhu H, Tang K, Chen G and Liu Z:
Biomarkers in oral immunotherapy. J Zhejiang Univ Sci B.
23:705–731. 2022. View Article : Google Scholar : PubMed/NCBI
|
|
47
|
Mino-Kenudson M, Schalper K, Cooper W,
Dacic S, Hirsch FR, Jain D, Lopez-Rios F, Tsao MS, Yatabe Y,
Beasley MB, et al: Predictive biomarkers for immunotherapy in lung
cancer: Perspective from the international association for the
study of lung cancer pathology committee. J Thorac Oncol.
17:1335–1354. 2022. View Article : Google Scholar : PubMed/NCBI
|
|
48
|
Liu Y, Xun Z, Ma K, Liang S, Li X, Zhou S,
Sun L, Liu Y, Du Y, Guo X, et al: Identification of a tumour immune
barrier in the HCC microenvironment that determines the efficacy of
immunotherapy. J Hepatol. 78:770–782. 2023. View Article : Google Scholar : PubMed/NCBI
|
|
49
|
Huang J, Sun W, Wang Z, Lv C, Zhang T,
Zhang D, Dong W, Shao L, He L, Ji X, et al: FTO suppresses
glycolysis and growth of papillary thyroid cancer via decreasing
stability of APOE mRNA in an N6-methyladenosine-dependent manner. J
Exp Clin Cancer Res. 41:422022. View Article : Google Scholar : PubMed/NCBI
|
|
50
|
Fan X and Zhao Y: miR-451a inhibits cancer
growth, epithelial-mesenchymal transition and induces apoptosis in
papillary thyroid cancer by targeting PSMB8. J Cell Mol Med.
23:8067–8075. 2019. View Article : Google Scholar : PubMed/NCBI
|
|
51
|
Zhong J, Liu C, Chen YJ, Zhang QH, Yang J,
Kang X, Chen SR, Wen GB, Zu XY and Cao RX: The association between
S100A13 and HMGA1 in the modulation of thyroid cancer proliferation
and invasion. J Transl Med. 14:802016. View Article : Google Scholar : PubMed/NCBI
|
|
52
|
Liu C, Jiang WG, Hargest R and Martin TA:
The role of SIPA1 in the development of cancer and metastases
(Review). Mol Clin Oncol. 13:322020.PubMed/NCBI
|
|
53
|
Zhou Z, Chen G, Shen M, Li J, Liu K, Liu
M, Shi S, Yang D, Chen W, Chen S, et al: Genome-scale CRISPR-Cas9
knockout screening in nasopharyngeal carcinoma for radiosensitive
and radioresistant genes. Transl Oncol. 30:1016252023. View Article : Google Scholar : PubMed/NCBI
|