Introduction
Diabetes mellitus (DM) is a chronic metabolic
disease characterized by persistent hyperglycemia and is divided
into two predominant subtypes: type 2 diabetes mellitus (T2DM) and
type 1 diabetes mellitus (T1DM) (1). DM is a serious threat to human health
globally and it is estimated that there are currently 537 million
adults with DM worldwide (2). The
number of individuals with DM diabetes will increase to 643 million
by 2030, with T2DM accounting for more than 90% of these cases
(2). T2DM is a polygenic genetic
disease caused by genetic and environmental factors, with insulin
resistance and defective insulin secretion from β-cells as the two
main pathologic mechanisms (3,4). A
previous study demonstrated that patients with T2DM are in a state
of long-term high blood sugar, which can induce heart, brain,
kidney and other target organ damage, thus leading to a variety of
complications and seriously endangering the lives of patients
(4). Studies have observed that
weight loss through bariatric surgery, aggressive insulin therapy
and behavioral interventions can lead to sustained remission of
T2DM for several years; most T2DM patients require continuous
treatment to maintain glycemic compliance (5,6). In
addition, there are several drugs (alpha-glucosidase inhibitors,
metformin, sulfonylureas and meglitinides) that have adverse
effects in the current treatment of T2DM, for example,
sulfonylureas can lead to decreased efficacy and hypoglycemia and
metformin may trigger intestinal discomfort in patients (7). Early diagnosis and intervention in
T2DM, facilitated by a thorough understanding of its onset and
progression mechanisms, can substantially improve patient quality
of life and effectively reduce the risk of complications. This
approach constitutes an essential aspect of comprehensive diabetes
management. Nevertheless, existing screening and monitoring
methodologies, such as fasting blood glucose and glycosylated
hemoglobin (HbA1c) testing, are insufficient and necessitate
further refinement (8).
Emerging biomarkers, including glycated albumin,
fructosamine and 1,5-anhydroglucitol (1,5-AG), have shown enhanced
prognostic value over traditional markers, offering a more accurate
assessment of blood glucose levels (8). A previous study revealed that T2DM is
characterized by low adenosine triphosphate (ATP) levels, high
reactive oxygen species (ROS) production and mitochondrial
dysfunction (9). Mitochondria are
bioenergetic and metabolic centers extensively involved in various
biological processes with complex adaptive mechanisms (10). Alterations in the normal morphology
and dysfunction of mitochondria are relevant factor pairs affecting
the progression of multiple diseases (11). A number of researchers have
identified mitochondria as the intersection of key cellular
pathways such as ROS generation, energy substrate metabolism and
apoptosis in T2DM and mitochondria contribute to deficits in
important functions downstream of T2DM, including cardiac output,
hepatocyte metabolism, skeletal muscle contraction, neuronal health
and β-cell insulin production (12). Within mitochondria, the catabolism
of carbohydrates and fatty acids results in the generation of ATP
and ROS (13). Under physiological
conditions, mitochondria regulate ROS concentrations via intrinsic
antioxidant systems. However, in the context of T2DM, mitochondrial
functionality is compromised and energy metabolism is disrupted,
culminating in elevated ROS production (14). Mitophagy, a form of selective
autophagy, regulates the progression of T2DM by specifically
degrading dysfunctional or damaged mitochondria (15). Therefore, the present study
conducted a screening of endoplasmic reticulum aminopeptidase 2
(ERAP2), human leukocyte antigen (HLA)-DQB1, HLA-DRB5,
microtubule-associated protein 1B (MAP1B) and 2′-5′-oligoadenylate
synthetases 3 (OAS3) as potential biomarkers and therapeutic
targets for T2DM. This screening was based on the expression levels
of genes associated with mitochondrial dysfunction in T2DM.
In addition to metabolic disturbances, an imbalance
in immune homeostasis is a key feature of T2DM and can lead to
increased inflammatory infiltration (16). Using bioinformatics analysis, it
was identified that the aforementioned five biomarkers-ERAP2,
HLA-DQB1, HLA-DRB5, MAP1B and OAS3 are all highly expressed in
macrophages. Macrophages are the main cells that carry out the
body's intrinsic immunity and activated macrophages participate in
the inflammatory response by releasing a variety of cytokines and
inflammatory mediators (17).
Different phenotypes of macrophages have great differences in
inflammatory reactions. They can be divided into pro-inflammatory
M1 macrophages and anti-inflammatory M2 macrophages and the M1 and
M2 types of macrophages can be transformed into each other under
appropriate conditions (17). The
microenvironment of DM patients is in a state of inflammation. The
imbalance of macrophage M1/M2 polarization is associated with
insulin resistance and pancreatic islet β-cell damage and the
adjustment of macrophage polarization plays a therapeutic role in
T2DM (17).
The present study established a 5-gene (ERAP2,
HLA-DQB1, HLA-DRB5, MAP1B and OAS3) prediction model for T2DM
prediction and analyzed the association of marker genes with the
immune microenvironment. In addition, the association of MAP1B and
OAS3 with macrophages during T2DM pathology was explored by
cellular experiments. The present study aided in the early
diagnosis, prevention and treatment of T2DM.
Materials and methods
Data collection and processing
In the present study, the gene expression dataset
GSE184050, associated with T2DM and the single-cell transcriptomics
dataset GSE221156, associated with T2DM, were downloaded from the
Gene Expression Omnibus (GEO) database (https://www.ncbi.nlm.nih.gov/geo/). The GSE184050
dataset includes sequencing results of peripheral blood samples
from 50 patients with T2DM and 66 controls. The GSE221156 dataset
includes sequencing results of pancreatic single-cell suspensions
from 17 patients with T2DM, 17 control populations and 14 patients
with pre-diabetes (prediabetic state; PD). A total of 9,189
mitochondrial dysfunction-related genes were downloaded from the
GeneCard database (https://www.genecards.org/) using the keyword
‘mitochondrial dysfunction’.
The expression matrix of T2DM-related genes was
extracted from the GSE184050 dataset using the R package ‘limma’
(version 3.2.0; http://www.bioconductor.org/packages/release/bioc/html/limma.html)
and analyzed by differential expression and the cut-off criterion
for differentially expressed genes (DEGs) was set at FC=1.3,
P<0.05; volcano plots showed the final results. The R package
‘WGCNA’ (version 1.73; http://cran.r-project.org/web/packages/WGCNA/index.html)
was applied to construct and visualize the network of genes in the
GSE184050 dataset. First, the outliers were identified and removed
by the sample clustering method and feature matching was
performed.
Based on the 9,189 mitochondrial dysfunction-related
genes, DEGs screened in the GSE184050 dataset and important modular
genes obtained by WGCNA, the intersection analysis was further
carried out by using the ‘VennDiagram’ R package (version 1.7.3;
http://cran.r-project.org/web/packages/VennDiagram/index.html)
and key genes related to mitochondrial dysfunction in T2DM in the
present study were identified through the Venn diagram.
T2DM-related single-cell transcriptome data
(GSE221156 dataset) were analyzed using the ‘Seurat’ R package
(version 5.2.1; http://cran.r-project.org/web/packages/Seurat/index.html)
to identify and annotate cell types and their subpopulations.
T2DM-related differential gene
analysis and co-expression module construction
Weighted gene co-expression network analysis (WGCNA)
is an algorithm developed based on the R language, which is mainly
used to mine valuable information in high-throughput data. WGCNA
identifies core genes associated with diseases in scale-free
networks through clustering analysis and thus helps to reveal
complex biological mechanisms (18). The network construction was
performed on the genes in the GSE184050 dataset. The Pearson
correlation coefficient was used to obtain the gene co-expression
similarity. Then, the topological overlap matrix was used to filter
the weak connections in the network construction process. When the
soft threshold was set to five, the constructed network conformed
to the scale-free distribution and provided appropriate average
connections for the subsequent co-expression module building.
Finally, the branches of the dendrogram were efficiently identified
using the dynamic tree-cutting algorithm, thus defining different
co-expression modules and representing them differentially with
other colors. Correlation tests were performed on gene modules
using Pearson correlation analysis to explore the relationships
between gene modules further.
In addition, the present study screened modules
closely associated with T2DM by constructing module-trait
correlations. In this process, gene significance was defined by the
association values between specific traits and gene expression
within a module; Module eigengene and Module membership were used
to differentiate significant modules associated with T2DM. Finally,
modules with P<0.05 were selected for subsequent in-depth
analysis.
Key gene screening and functional
enrichment analysis
Next, the present study performed functional
enrichment analysis on the screened key genes. Gene Ontology (GO)
and the Kyoto Encyclopedia of Genes and Genomes (KEGG) can be used
to identify key biological pathways. The present study performed GO
annotation and KEGG pathway enrichment analysis of key genes using
the R packages ‘org.Hs.eg.db’ (version 3.20; http://bioconductor.org/packages/release/data/annotation/html/org.Hs.eg.db.html)
and ‘clusterProfiler’ (version 3.20; http://www.bioconductor.org/packages/release/bioc/html/clusterProfiler.html)
with the help of the ‘ggplot2’ package (version 3.5.1; http://cran.r-project.org/web/packages/ggplot2/index.html).
The results were visualized with the ‘ggplot2’ R package and the
results with P<0.05 were included in the present
study.
Biomarker screening and performance
evaluation
In the present study, three machine learning
algorithms were used to screen out the characteristic genes of
T2DM, including Least absolute shrinkage and selection operator
(Lasso) logistic regression, Random forest (RF) and Support vector
machine (SVM). The Lasso logistic regression analysis, RF algorithm
and SVM algorithm were performed using the R packages ‘glmnet,’
(version 4.1–8; https://cran.r-project.org/web/packages/glmnet/index.html)
‘randomForest’ (version 4.7-1.2; http://cran.r-project.org/web/packages/randomForest/)
and ‘e1071’ (version 1.7-16; http://cran.r-project.org/web/packages/e1071/index.html),
respectively. Then, a Venn diagram obtained the intersection of the
genes identified by the three algorithms and these genes are
potential biomarkers.
After screening potential biomarkers, the expression
differences of marker genes between normal and T2DM groups were
further explored based on the GSE184050 dataset. The effect of each
biomarker on the risk of T2DM was assessed by constructing line
plots with the ‘rms’ package (version 7.0-0; http://cran.r-project.org/web/packages/rms/index.html)
and the accuracy of the line plots was evaluated using calibration
curves. At the same time, the R package ‘pROC’ (version 1.18.5;
http://cran.r-project.org/web/packages/pROC/index.html)
was used to plot the Receiver operating characteristic (ROC) curve
and to calculate the area under the curve (AUC) to assess the
predictive efficacy of the biomarkers independently as well as the
overall predictive efficacy of the biomarkers. The overall
predictive efficacy of the biomarkers was evaluated.
Analysis of immune cell
infiltration
The present study explored the biological functions
and related pathways of each biomarker by gene set enrichment
analysis (GSEA; http://www.broadinstitute.org/gsea). To determine the
relationship between infiltrating immune cells and candidate
biomarkers in T2DM, the EPIC algorithm (http://epic.gfellerlab.org) was applied to assess the
abundance of immune cells in T2DM samples from the GSE184050
dataset. The EPIC algorithm can accurately quantify the proportions
of the different types of immune cells in the samples and analyze
their changes between the disease state and the normal state. Based
on the immune infiltration analysis results, the expression
differences of immune checkpoint genes were compared between the
normal and T2DM groups.
Subsequently, the relationships between biomarkers,
immune infiltrating cells and immune checkpoints were explored
using Pearson's correlation analysis in R and the ‘ggplot2’ R
package visualized the results. P<0.05 indicates that the
relationships were statistically significant.
Mendelian randomization (MR)
analysis
Immune cells were used as exposure factors and
significant instrumental variables for exposure factors (SNP) for
exposure factors were selected from the Genome-wide association
study (GWAS; http://gwas.mrcieu.ac.uk/) database as instrumental
variables. To avoid the influence of strong linkage disequilibrium
(LD) on the results, the thresholds of LD were set at r2 <0.3
and p1 <5e-8 (19). T2DM was
used as the observed outcome and the outcome GWAS data GCST010118
was obtained from the GWAS database, including 77,418 East Asian
cases and 356,122 East Asian controls. The ‘TwoSampleMR’ program
package (version 2.0.1; http://cran.r-project.org/web/packages/twosamples/index.html)
in R4.2.2 was used to perform the two-sample MR program method. SNP
and outcome GWAS data were first preprocessed using the
harmonise_data function in the TwoSampleMR program package to
maintain a uniform format. MR Egger, Weighted median, Inverse
variance weighted, Simple mode and Weighted mode methods were used
for analysis. A heterogeneity test was also performed using the MR
Egger method and inverse variance weighted (IVW) method to evaluate
the heterogeneity of instrumental variables according to Cochrane's
Q value. MR Egger regression equation was used to assess the
horizontal polytropy of instrumental variables. In addition, to
ensure that the results were not notably affected by a particular
SNP, each SNP was removed in turn using the leave-one-out method.
The present study compared the results of the IVW method with all
variants (20). Three core
assumptions ensured the accuracy of the causal estimation: i) The
genetic instrumental variables are strongly associated with immune
cells, ii) the genetic instrumental variables are independent of
potential confounders iii) the genetic instrumental variables must
influence the occurrence of T2DM only through immune cells.
Drug sensitivity analysis and
molecular docking
The present study searched each of the key genes on
the CTDbase database (https://ctdbase.org/) to obtain information about drug
interactions and diseases associated with these genes.
Subsequently, the small molecule ligands acting on the biomarker
genes in T2DM were analyzed. The intersecting drugs of all the
marker genes via Venn diagrams were selected for subsequent
molecular docking analysis.
Regarding molecular docking, first, the 2D structure
of each small molecule ligand drug was obtained from the PubChem
database (PDB, http://www.rcsb.org/). These
structures were imported into Chem3D software to calculate the
minimum free energy and convert them into three-dimensional
structures. The 3D structures of the target proteins (receptors)
were then obtained from the RCSB protein database (https://www.rcsb.org/). The structures were imported
into PyMOL (https://www.pymol.org/) to remove
water molecules and ligands. Receptors and ligands were prepared
using AutoDock 1.5.6 (The Scripps Research Institute; http://autodock.scripps.edu/download-autodock4/)
to obtain their PDBQT format and 3D mesh boxes were created for the
receptors for subsequent molecular docking simulations. Next,
molecular docking analysis was performed using AutoDock Vina 1.1.2
(The Scripps Research Institute; http://vina.scripps.edu/downloads/) to assess the
binding energy between the ligand and receptor. Finally, the best
predicted binding sites were visualized using PyMOL. Binding
energies less than-5 kcal/mol were defined as indicating effective
ligand-receptor binding and binding energies less than −7 kcal/mol
indicated strong binding activity (21).
Single-cell sequencing analysis
First, single-cell data were read using the
Read10X_h5 function in the ‘Seurat’ package for data preprocessing,
which helps to remove potentially low-quality cells and dead cells
to ensure the reliability of the analysis results. Subsequently,
the batch effect was removed using the Integration method provided
by the FindIntegrationAnchors function in the ‘Seurat’ package. The
effect of batch effect removal was checked by t-Distributed
Stochastic Neighbor Embedding (tSNE) dimensionality reduction
analysis to ensure the accuracy and consistency of the data. Next,
cell clustering analysis was performed using the ‘Seurat’ package.
The graph was then partitioned into highly interconnected
‘clusters’ using a graph partitioning algorithm. The FindClusters
function was used to perform the graph-based clustering analysis
and the resolution parameter set to 0.3 to obtain different cell
clusters. The cell clusters were also screened for differential
genes using the FindMarkers function, in which the logfc was
entered. Threshold parameter was set to 1 and the Wilcoxon test
(test. use=‘Wilcox’) used to identify the characteristic genes of
each cell cluster. In this way, it was possible to pinpoint genes
that were differentially expressed in different cell clusters. To
further annotate cell subclusters, the ‘SingleR’ package continued
to be used for cell subcluster annotation. By integrating known
cell type marker genes, each cell cluster was annotated to a
specific cell type or subpopulation. Next, the R package ‘Cellchat’
(version 2.1.0; http://github.com/jinworks/CellChat) was used to infer
the number and strength of interactions between different cell
clusters in the samples, revealing the interaction network between
cell clusters, which provides important information for
understanding cell function and tissue microenvironment.
Cell culture
RAW264.7 cells were cultured in Dulbecco's Modified
Eagle's Medium (DMEM) containing 10% fetal bovine serum and 1%
double antibiotic (penicillin 100 U/ml + streptomycin 100 µg/ml)
and placed in an incubator at 37°C containing 5% CO2.
The cell culture medium was changed every 2–3 days and when the
cell density was 80–90%, the cells were routinely passaged.
Macrophage treatment
RAW264.7 cells were divided into the control group
(Control), the high glucose (HG) group and the negative control
(NG) group. The cells in the control group were cultured normally
(containing 4.5 mmol/l glucose) without any treatment. The cells in
the HG group were cultured in a DMEM medium containing HG (25
mmol/l) for 72 h. The cells in the NG group were cultured in a DMEM
medium containing low glucose (5.5 mmol/l) for 72 h.
Macrophage polarization induction
To investigate the effect of T2DM on macrophage
polarization, RAW264.7 cells were treated with TNF-α to induce M1
macrophage polarization and with IL-4 to induce M2 macrophage
polarization. Control group cells were not treated in any way and
were cultured normally. TNF-α-treated group cells (TNF-α group)
were treated with TNF-α (20 ng/ml) for 24 h. IL-4-treated group
cells (IL-4 group) were treated with IL-4 (20 ng/ml) for 24 h.
Cell grouping and transfection
The sequences of the small interfering RNA
specifically targeting OAS3 (siRNA#1-OAS3), siRNA#2-OAS3,
siRNA#1-MAP1B, siRNA#2-MAP1B and their negative control (siNC) are
shown in Table I. RAW264.7 cells
were divided into siNC group, siRNA#1-OAS3 group, siRNA#2-OAS3
group, siRNA#1-MAP1B group, siRNA#2-MAP1B group, HG + siRNA-OAS3
group and TNF-α + siRNA-OAS3 group. The siNC group cells were
transfected with siNC. siRNA#1-OAS3 group, siRNA#2-OAS3 group,
siRNA#1-MAP1B group and siRNA#2-MAP1B group cells were transfected
with the corresponding siRNA, respectively. The cells in the HG +
siRNA-OAS3 group were treated with HG and transfected with
siRNA#1-OAS3. The cells in the TNF-α + siRNA-OAS3 group were
treated with TNF-α and transfected with siRNA#1-OAS3.
 | Table I.siRNA sequences. |
Table I.
siRNA sequences.
| Gene name | 5′-3′ | 5′-3′ |
|---|
| Negative
control |
UUCUCCGAACGUGUCACGUTT |
ACGUGACACGUUCGGAGAATT |
| mMap1b-5496 |
GCUAUUUGAUACAAUGCAATT |
UUGCAUUGUAUCAAAUAGCTT |
| mMap1b-2330 |
GGAAAGUCAAAGUCAUUAATT |
UUAAUGACUUUGACUUUCCTT |
| mOas3-1493 |
GGGAGAAGAGUGUAUACAATT |
UUGUAUACACUCUUCUCCCTT |
| mOas3-2418 |
GGACAAAUUCAUCAGUGAATT |
UUCACUGAUGAAUUUGUCCTT |
For cell transfection, the siRNA was first dissolved
into a master mix at a concentration of 20 µM and then RNATransMate
(Beyotime Institute of Biotechnology) and siRNA were mixed in a
serum-free medium and incubated at 25°C for 20 min to form a
siRNA/RNATransMate complex. Subsequently, 400 µl siRNA/RNATransMate
complex and 1,600 µl serum-free medium were mixed, added to the
culture plate, and incubated with the cells (2×10⁵
cells/well) at 37°C in a 5% CO2 atmosphere for 24 h. A
total of 48 h post-transfection, the medium was replaced with fresh
complete medium to ensure cell viability.
RNA extraction and reverse
transcription-quantitative (RT-q) PCR
Prior to RT-qPCR analysis, total RNA was extracted
from the treated cells (1×10⁶ cells/well) by RNeasy Plus
Mini kit (cat. no. 74134; Qiagen GmbH) according to the
instructions in the product manual. Then, the cDNA was synthesized
with a QuantiTect Reverse Transcription kit (cat. no. 205311;
Qiagen GmbH) according to the manufacturer's protocol. Finally, the
RT-qPCR reactions mix solution (including Hieff UNICON Universal
Blue Qpcr SYBR, Green Master Mix, PCR Forward Primer, PCR Reverse
Primer, template DNA, ddH2O) was prepared using the
Hieff UNICON Universal Blue qPCR SYBR Green Master Mix (cat. no.
11184ES08; Shanghai Yeasen Biotechnology Co., Ltd.) following the
manufacturer's instructions. Next, qPCR was performed using the
LightCycler 480 II system (Roche Diagnostics). The qPCR cycling
conditions were as follows: Initial denaturation at 95°C for 30
sec, followed by 40 cycles at 95°C for 5 sec and 60°C for 30 sec.
All experiments were independently replicated three times. The
results were analyzed and quantified using the 2−ΔΔCq
method (22), GAPDH was used as an
endogenous control and sequences of all primers were listed in
Table II.
| Table II.Primers for reverse
transcription-quantitative PCR. |
Table II.
Primers for reverse
transcription-quantitative PCR.
| Gene name | Sequence |
|---|
| MAP1B-Forward |
GTCTCCTTTACGCAGTCCTCC |
| MAP1B-Reverse |
TGCTTTCCATTCTTCCCTTCA |
| OAS3-Forward |
TGGGTGCCATGCGAATGTTGC |
| OAS3-Reverse |
CTCCAGAGCGGGGCTGTCCTA |
| CD68-Forward |
ACCGTGACCAGTCCCTCTT |
| CD68-Reverse |
TGTCGTCTGCGGGTGATGC |
| CD80-Forward |
CTTTGTGCTGCTGATTCGT |
| CD80-Reverse |
TTTGCCAGTAGATTCGGTC |
| CD86-Forward |
ATGGGCTCGTATGATTGT |
| CD86-Reverse |
TCTTAGGTTTCGGGTGAC |
| CD32-Forward |
GCAAAGGAAGTCTAGGAAGGA |
| CD32-Reverse |
ATAATAACAATGGCTGCGACA |
| CD206-Forward |
CATCACCAACGACCTCAG |
| CD206-Reverse |
AGTAAGCCCTCTGTCTCC |
| CD204-Forward |
ACTTGATACTGACAGGAAACC |
| CD204-Reverse |
ATGTATAAAATTGTGAGCCAC |
| CD163-Forward |
CCAGTCCAAACAACAAGC |
| CD163-Reverse |
CACATTGGCATCAGTCATA |
| TNF-α-Forward |
GCGGTGCCTATGTCTCAG |
| TNF-α-Reverse |
TCCTCCACTTGGTGGTTT |
| GAPDH-Forward |
GGGTCCCAGCTTAGGTTCAT |
| GAPDH-Reverse |
CCAATACGGCCAAATCCGTT |
Western blotting
First, PMSF (cat. no. HKW2017; Jiangsu Haoke
Bioengineering Co., Ltd.) and phosphorylated protease inhibitor
(cat. no. HKW2018; Jiangsu Haoke Bioengineering Co., Ltd.) were
mixed into IP lysis buffer (cat. no. HKW2012; Jiangsu Haoke
Bioengineering Co., Ltd.) to extract the total protein from the
cells. Then, the BCA working solution was prepared using the BCA
Protein Quantification Kit (cat. no. HKW2019; Jiangsu Haoke
Bioengineering Co., Ltd.). After the concentration of protein
samples was detected using the Enhanced BCA Protein Assay Kit (cat.
no. P0009; Beyotime Institute of Biotechnology), 30 µg protein/lane
was subjected to SDS-PAGE on 10% gels. Subsequently, the separated
proteins were transferred to a PVDF membrane (cat. no. 36125ES03;
Shanghai Yeasen Biotechnology Co., Ltd.), after which the PVDF
membrane was blocked with 5% skimmed milk (cat. no. SW3015, Nestle)
at 25°C for 1 h. Next, the PVDF membrane was incubated with diluted
primary antibodies at 4°C overnight and incubated with secondary
antibodies at room temperature (25°C) for 1 h. Then, the PVDF
membrane was washed and treated with an ECL Plus working solution
(cat. no. HKW2095; Jiangsu Haoke Bioengineering Co., Ltd.). The
results were analyzed with the help of a Chemiluminescence system
(Clinx Science Instruments Co., Ltd.) and were semi-quantified with
ImageJ software (version 1.53m; National Institutes of Health). All
information on antibodies is listed in Table III.
| Table III.All antibodies information in western
blotting in the present study. |
Table III.
All antibodies information in western
blotting in the present study.
| Name | Catalog number | Company | Molecular
weight | Dilution |
|---|
| OAS3 | 21915-1-AP | Proteintech Group,
Inc. | 100-121 kDa | 1:1,000 |
| CD86 | ET1606-50 | Huabio | 70 kDa | 1:500 |
| CD204 | ER1913-21 | Huabio | 50 kDa | 1:1,000 |
| Phospho-mTOR
(S2448) | HA600094 | Huabio | 289 kDa | 1:1,000 |
| GAPDH | 10494-1-AP | Proteintech Group,
Inc. | 36 kDa | 1:5,000 |
| HRP Anti-Rabbit IgG
(H+L) | SA00001-2 | Proteintech Group,
Inc. |
| 1:5,000 |
| HRP Anti-Mouse IgG
(H+L) | SA00001-1 | Proteintech Group,
Inc. |
| 1:5,000 |
Statistical analysis
All bioinformatics-related statistical analyses in
the present study were performed using R software 4.2.2 (https://www.r–project.org/) (23). The Pearson correlation test was
used to determine the significance of correlations between
variables and the Wilcoxon test was used to assess the importance
of differences between the two groups. All cellular experimental
data displays are the mean ± standard deviation of three biological
replicates. GraphPad Prism 10.1.3 (Dotmatics) was used for
statistical analysis, data processing and presentation of all
experiments in the present study. One-way ANOVA and Tukey's post
hoc test were used for multi-group comparisons. P<0.05 was
considered to indicate a statistically significant difference.
Results
Screening of DEGs in T2DM and
co-expression module construction
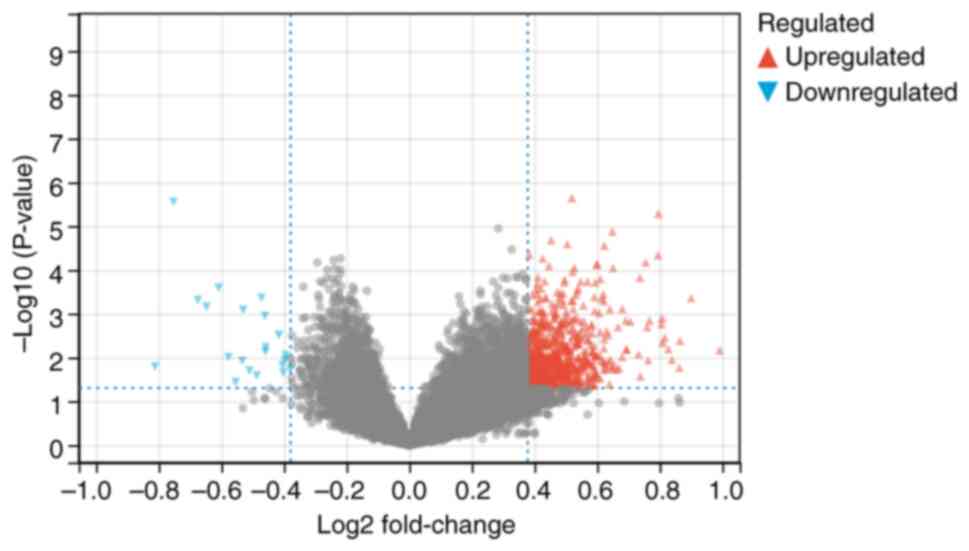
To screen for DEGs in T2DM, the present study first
analyzed the GSE184050 database and identified 791 DEGs in T2DM,
including 769 upregulated genes and 22 downregulated genes
(Fig. 1). To further explore the
key genes associated with T2DM, gene co-expression modules were
established using WGCNA and 23 co-expression modules were
identified, most of which showed positive correlations with each
other, suggesting that they had some consistency in expression
patterns (Fig. 2A-C). By setting a
significance threshold of P<0.05, the present study screened out
four gene co-expression modules that were highly correlated with
T2DM, including ‘darkermagenta’, ‘floralwhite’, ‘orangered4’ and
‘dark grey’. Subsequently, in order to further screen mitochondrial
dysfunction-related genes, 9,189 mitochondrial dysfunction-related
genes were obtained from the GeneCard database. The mitochondrial
dysfunction-related genes were intersected with the DEGs obtained
from the GSE184050 database and T2DM-related genes obtained from
the WGCNA and then a total of 65 genes were obtained (Fig. 2D). The specific names of the genes
are shown in Table IV.
| Table IV.Mitochondrial dysfunction-related
genes in type 2 diabetes mellitus. |
Table IV.
Mitochondrial dysfunction-related
genes in type 2 diabetes mellitus.
| Gene name | Full name | Gene name | Full name |
|---|
| MAP1B |
Microtubule-associated protein 1B | RIN3 | Ras and Rab
interactor 3 |
| RAB7A | Rab protein member
7A | SPI1 | Spi-1
proto-oncogene |
| RHOG | Ras homolog family
member G | IRGM | Immunity-related
GTPase family M |
| HBA1 | Hemoglobin subunit
alpha 1 | OAS3 |
2′-5′-Oligoadenylate synthetase 3 |
| HBA2 | Hemoglobin subunit
alpha 2 | CHERP | Calcium homeostasis
endoplasmic reticulum protein |
| SLC24A4 | Solute carrier
family 24, member 4 | HBG2 | Hemoglobin subunit
gamma 2 |
| HBB | Hemoglobin subunit
beta | INF2 | Inverted formin,
FH2 and WH2 domain containing |
| ERAP2 | Endoplasmic
reticulum aminopeptidase 2 | ALOX15 | Arachidonate
15-lipoxygenase |
| RNPEPL1 | Arginyl
aminopeptidase-like 1 | CXCR3 | C-X-C motif
chemokine receptor 3 |
| SLC26A1 | Solute carrier
family 26, member 1 | ZBTB7A | Zinc finger and BTB
domain containing 7A |
| MTHFS |
5,10-methenyltetrahydrofolate
synthetase | CXCL8 | C-X-C motif
chemokine ligand 8 |
| TECR | Trans-2,3-enoyl-CoA
reductase | HSPB1 | Heat shock protein
family B (small) member 1 |
| CASZ1 | Castor zinc finger
1 | HLA-DQB1 | Major
histocompatibility complex, class II, DQ beta 1 |
| GLUD2 | Glutamate
dehydrogenase 2 | HBG1 | Hemoglobin subunit
gamma 1 |
| SLC25A22 | Solute carrier
family 25, member 22 | UTS2 | Urotensin 2 |
| ABCD1 | ATP binding
cassette subfamily D member 1 | TUBB2A | Tubulin beta 2A
class IIa |
| OXT |
Oxytocin/neurophysin I prepropeptide | LTBP3 | Latent transforming
growth factor beta binding protein 3 |
| TAPBP | TAP binding protein
(tapasin) | UCP2 | Uncoupling protein
2 |
| SERPINA1 | Serpin family A
member 1 | CBFA2T3 | Core-binding
factor, runt domain, alpha subunit 2; translocated to, 3 (homolog
of mouse) |
| CSF1 | Colony stimulating
factor 1 | ADORA3 | Adenosine A3
receptor |
| PML | Promyelocytic
leukemia | TICAM1 | Toll-like receptor
adaptor molecule 1 |
| NPHP4 | Nephrocystin 4 | NRGN | Neurogranin |
| TEX22 | Testis expressed
22 | NLRP6 | NLR family pyrin
domain containing 6 |
| HBD | Hemoglobin subunit
delta | ZFPM1 | Zinc finger
protein, FOG family member 1 |
| CD7 |
| PANX2 | Pannexin 2 |
| SLC29A1 | Solute carrier
family 29, member 1 | FTH1 | Ferritin heavy
chain 1 |
| MIER2 | Mesoderm induction
early response 1, family member 2 | DLGAP4 | DLG associated
protein 4 |
| OLIG1 | Oligodendrocyte
transcription factor 1 | TMTC1 | Transmembrane and
tetratricopeptide repeat containing 1 |
| TGFB1 | Transforming growth
factor beta 1 | SCAMP4 | Secretory carrier
membrane protein 4 |
| ARID1A | AT-rich interaction
domain 1A | HLA-DRB5 | Major
histocompatibility complex, class II, DR beta 5 |
| ELANE | Elastase,
neutrophil expressed | AHDC1 | AT-hook DNA binding
motif containing 1 |
| JUND | JunD
proto-oncogene, AP-1 transcription factor subunit | CBS |
Cystathionine-beta-synthase |
| PABPN1 | Poly(A) binding
protein nuclear 1 |
|
|
Functional enrichment analysis of
mitochondrial dysfunction-related genes in T2DM
Then, to preliminary elucidate the underlying
regulatory mechanisms of mitochondrial dysfunction in T2DM, the
obtained 65 genes were subjected to functional enrichment analysis.
The results of GO enrichment analysis showed that the
aforementioned 65 genes were involved in biological processes (BP)
such as substance transport, response to stress and chemicals,
regulation of biological quality and immune system processes
(Fig. 3A); and these genes were
mainly enriched in the regions of the endomembrane system, cytosol,
vesicles, extracellular space and organelle membrane (Fig. 3B); furthermore, these genes were
mainly associated with enzyme binding, oxidoreductase activity,
active transmembrane transporter activity, receptor ligand activity
and antigen binding-related molecular processes (Fig. 3C). KEGG enrichment analysis showed
that the aforementioned 65 genes were mainly involved in biological
pathways such as necroptosis, NOD-like receptor signaling pathway,
Th17 cell differentiation, ferroptosis, D-glutamine and D-glutamate
metabolism (Fig. 3D). The
aforementioned findings suggest that mitochondrial
dysfunction-related genes in T2DM affect disease progression
through multiple pathways.
Screening of biomarkers and validation
of their predictive efficacy
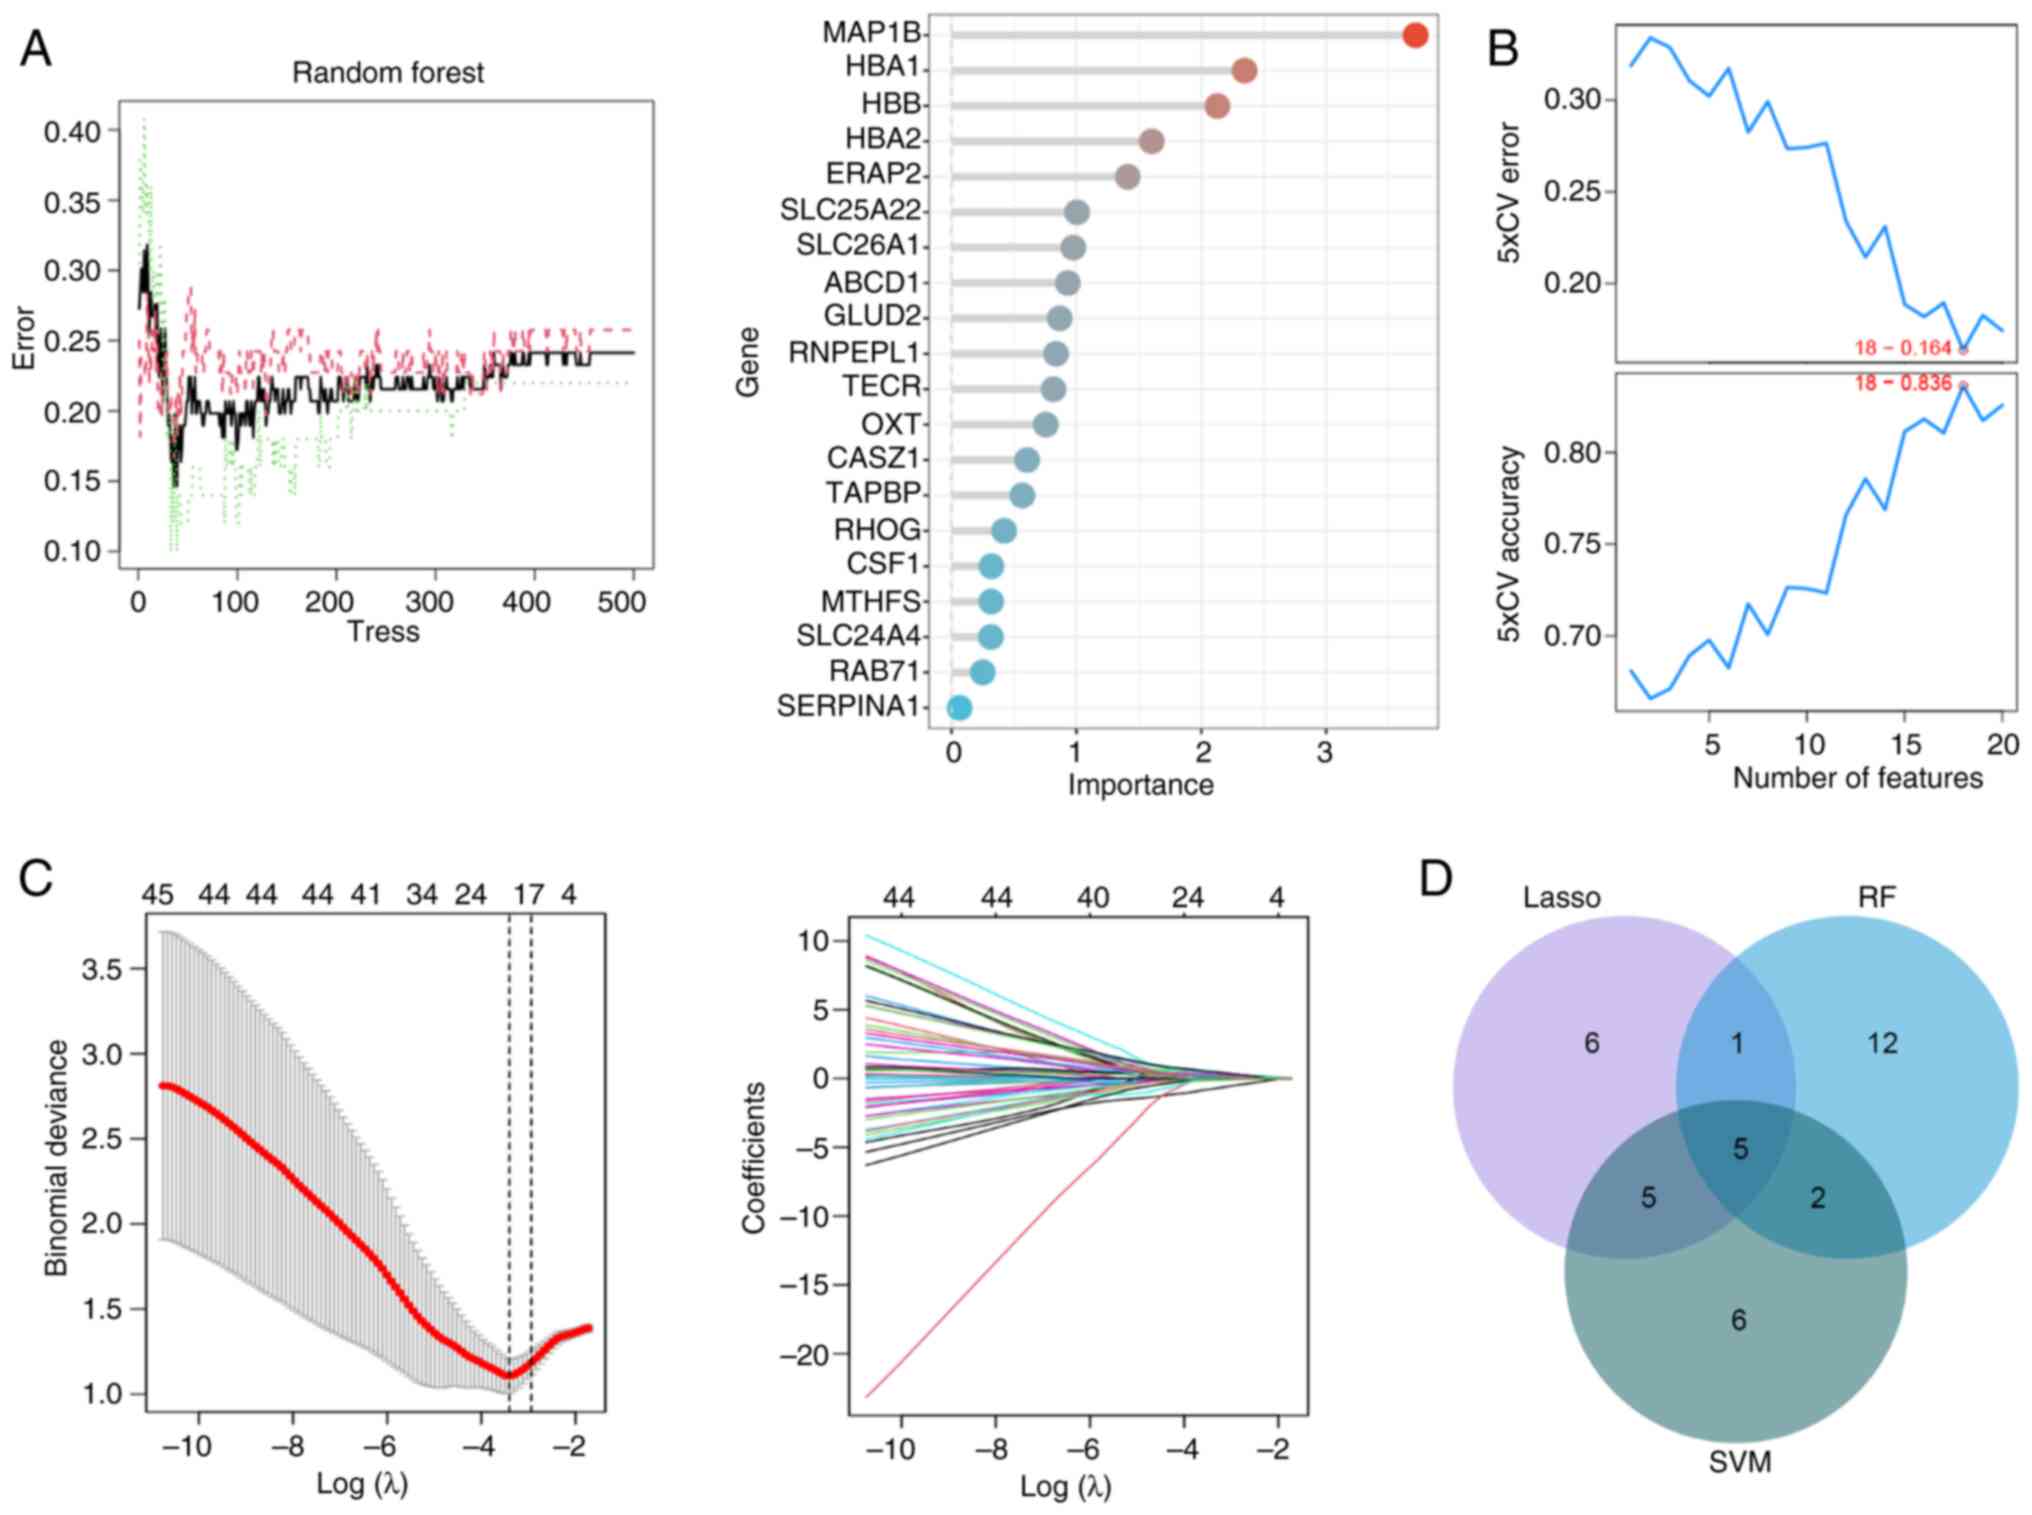
Next, to screen T2DM biomarkers, the present study
analyzed the key genes with a strong correlation with T2DM from the
65 genes mentioned aforementioned using three commonly used machine
learning algorithms, namely Random forest (RF), SVM and Lasso
logistic regression, respectively (Fig. 4A-C). Then, five key genes
associated with T2DM were identified by plotting Venn diagrams,
which were ERAP2, HLA-DQB1, HLA-DRB5, MAP1B and OAS3 (Fig. 4D). By analyzing the GSE184050
dataset, we found that ERAP2 was notably downregulated while
HLA-DQB1, HLA-DRB5, MAP1B and OAS3 were upregulated in T2DM
(Fig. 5A-E; P<0.05).
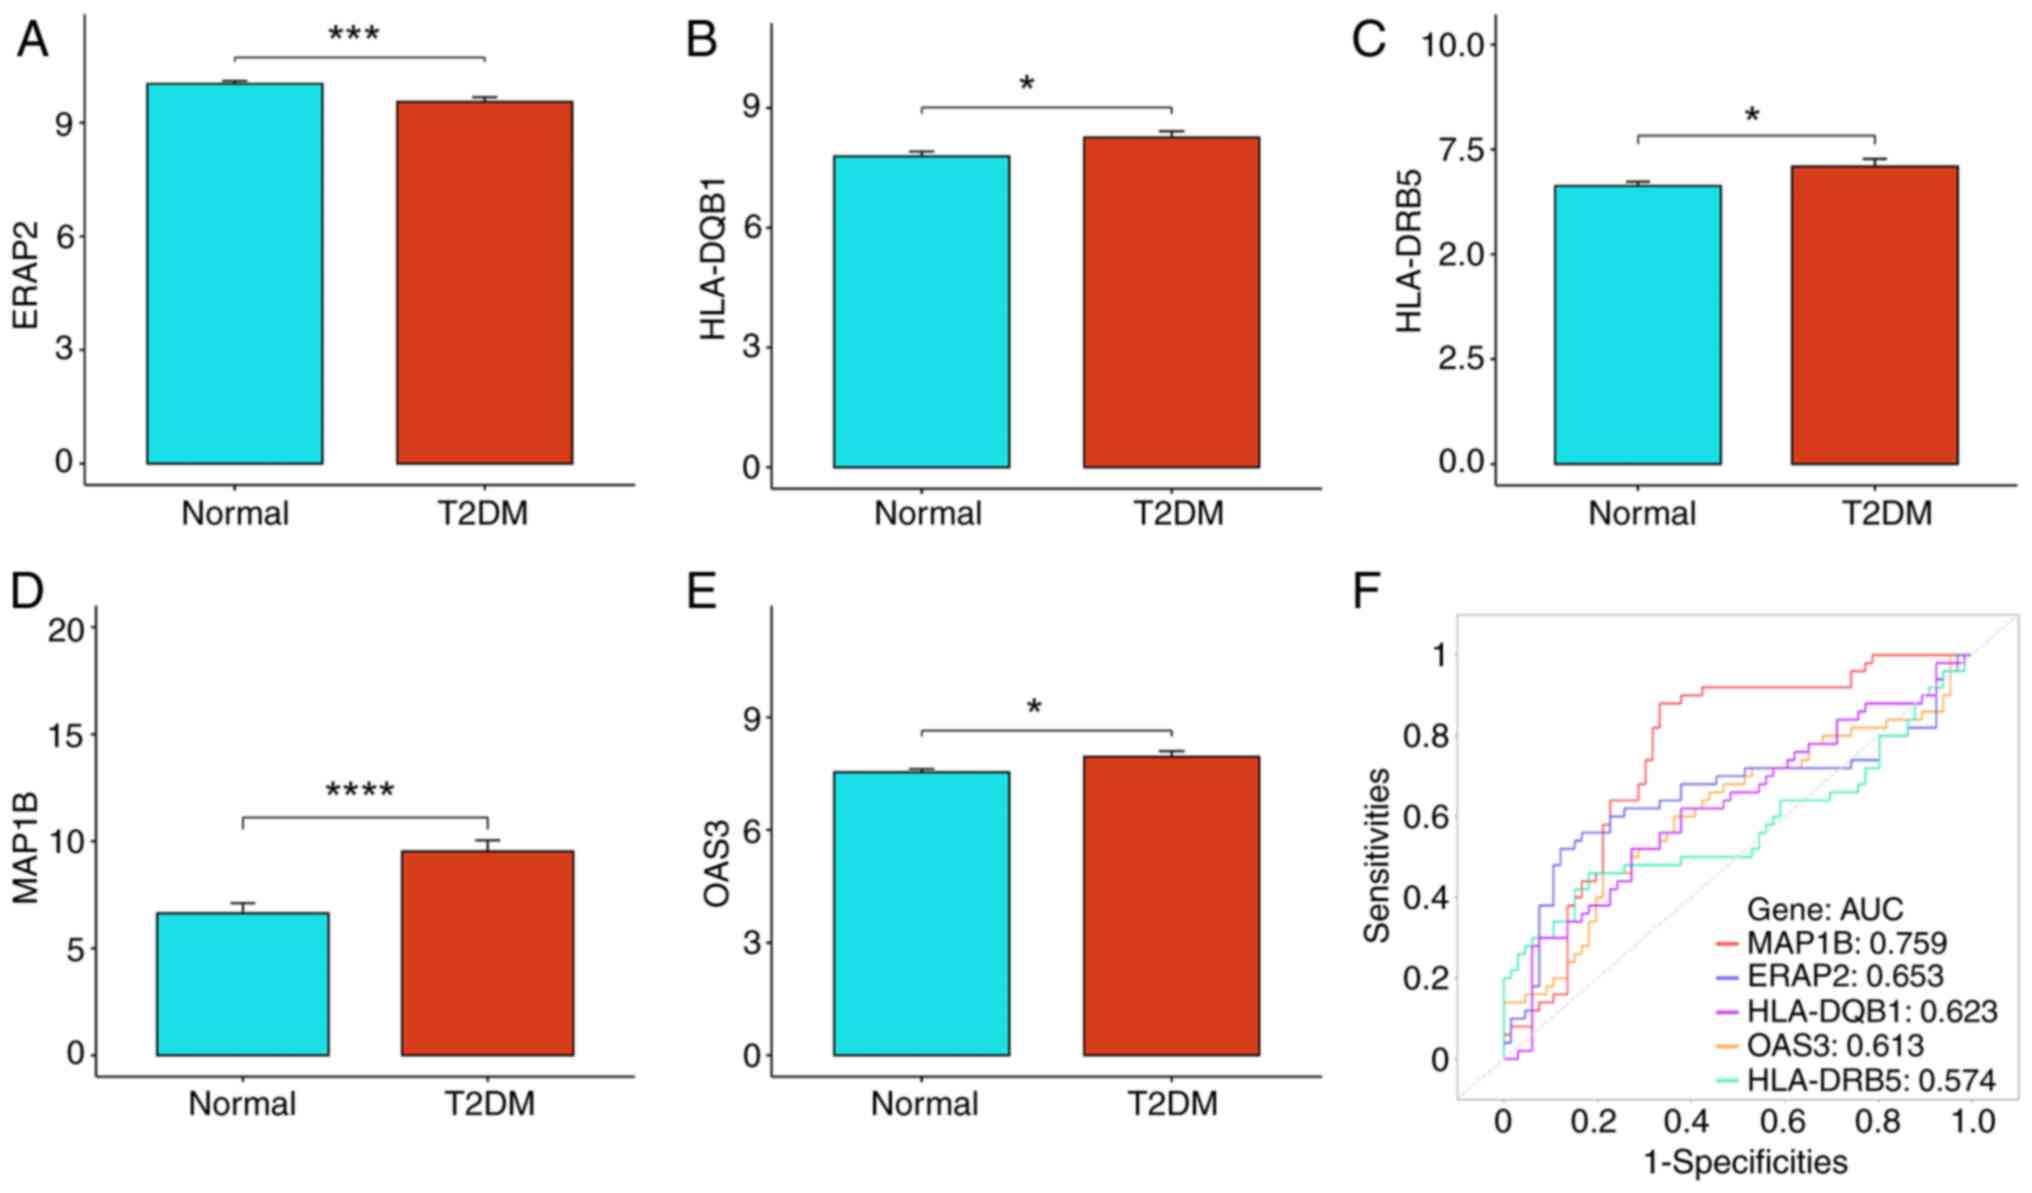 | Figure 5.Expression and predictive efficacy
analysis of biomarkers in T2DM. (A-E) Expression levels of five
biomarkers in the normal and T2DM groups. (A) ERAP2, (B) HLA-DQB1,
(C) HLA-DRB5, (D) MAP1B and (E) OAS3. (F) ROC curves of five
biomarkers independently predicting efficacy in T2DM. *P<0.05,
***P<0.001 and ****P<0.0001. T2DM, type 2 diabetes mellitus;
ERAP2, endoplasmic reticulum aminopeptidase 2; HLA, human leukocyte
antigen; MAPIB, microtubule-associated protein 1B; OAS3,
2′-5′-oligoadenylate synthetases 3; ROC, receiver operating
characteristic; AUC, area under the curve. |
In addition, the performance of ERAP2, HLA-DQB1,
HLA-DRB5, MAP1B and OAS3 in the prediction of T2DM were further
analyzed. MAP1B showed the best performance (AUC=0.759), while
HLA-DRB5 had the worst predictive efficacy (AUC=0.574) in the
prediction of T2DM (Fig. 5F). In
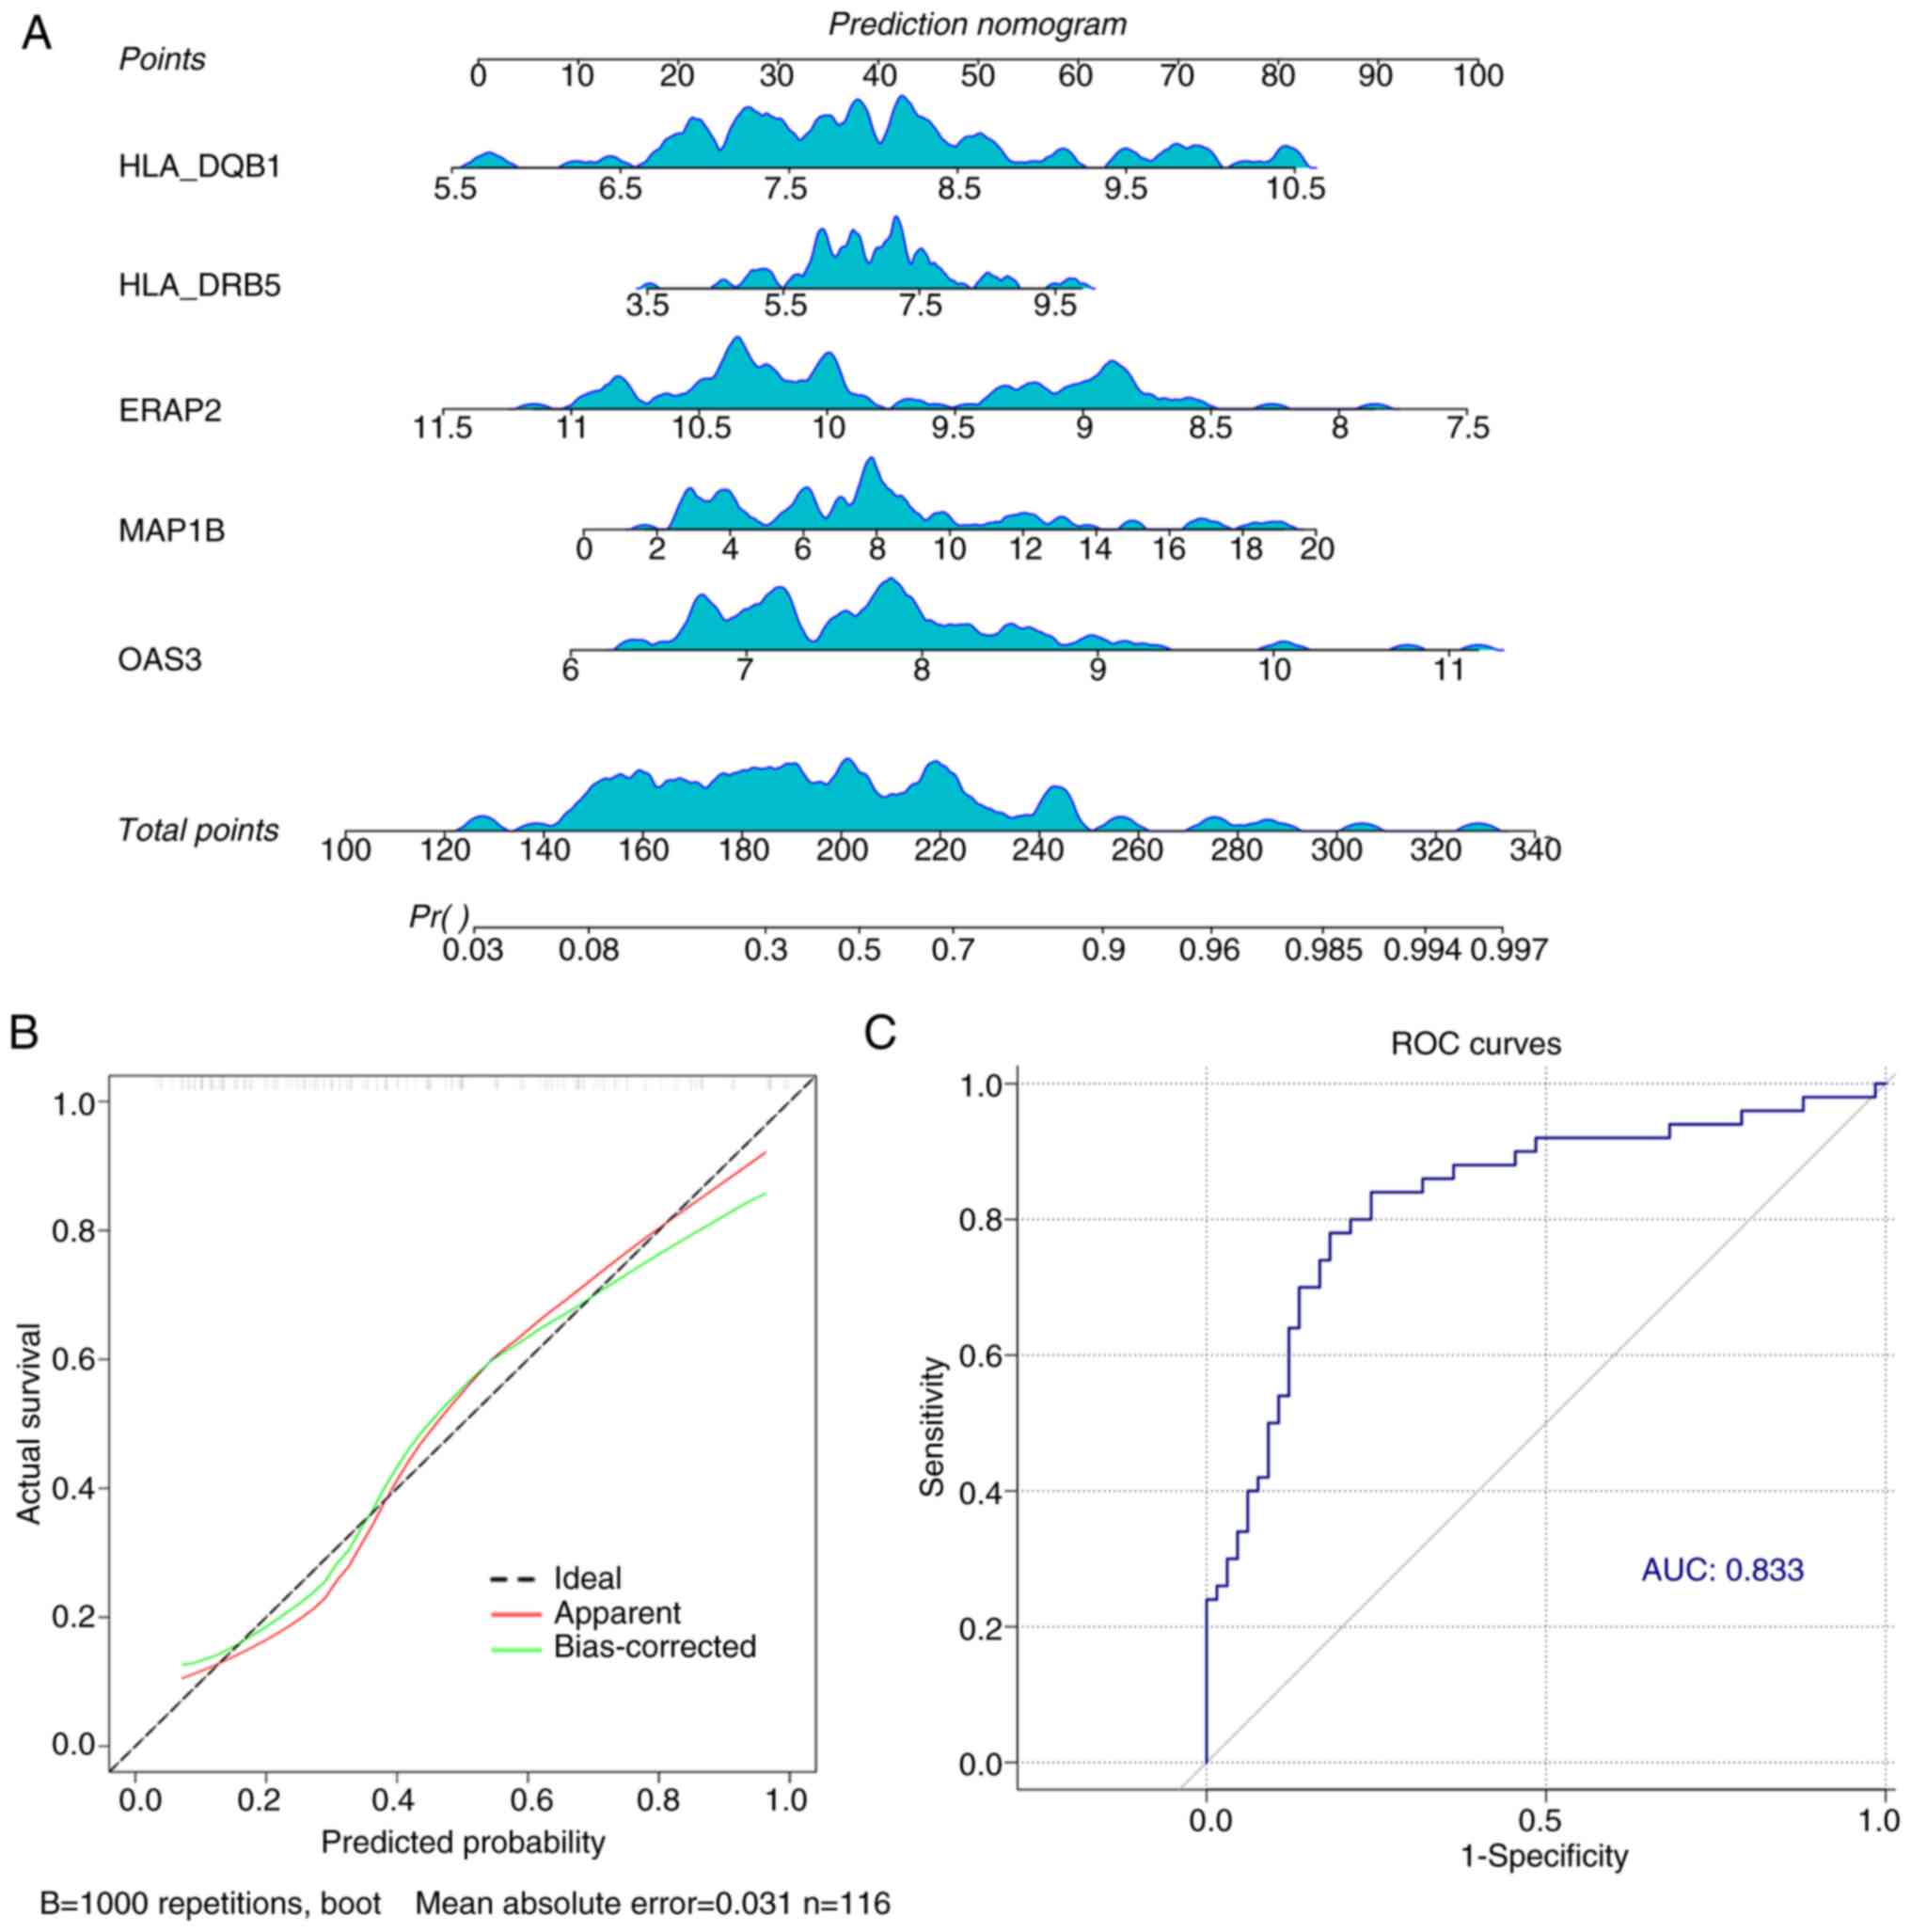
addition, the results of the nomogram showed that the higher the
expression levels of HLA-DQB1, HLA-DRB5, MAP1B and OAS3 and the
lower the expression level of ERAP2, the higher the probability of
T2DM occurrence (Fig. 6A). In
addition, the calibration curves were almost identical to the ideal
curves, indicating that our prediction model had high accuracy
(Fig. 6B). And the overall
predictive efficacy AUC value of the five marker genes reached
0.833, which was notably higher than the predictive efficacy of
individual genes (Fig. 6C).
Target compound prediction and
molecular docking
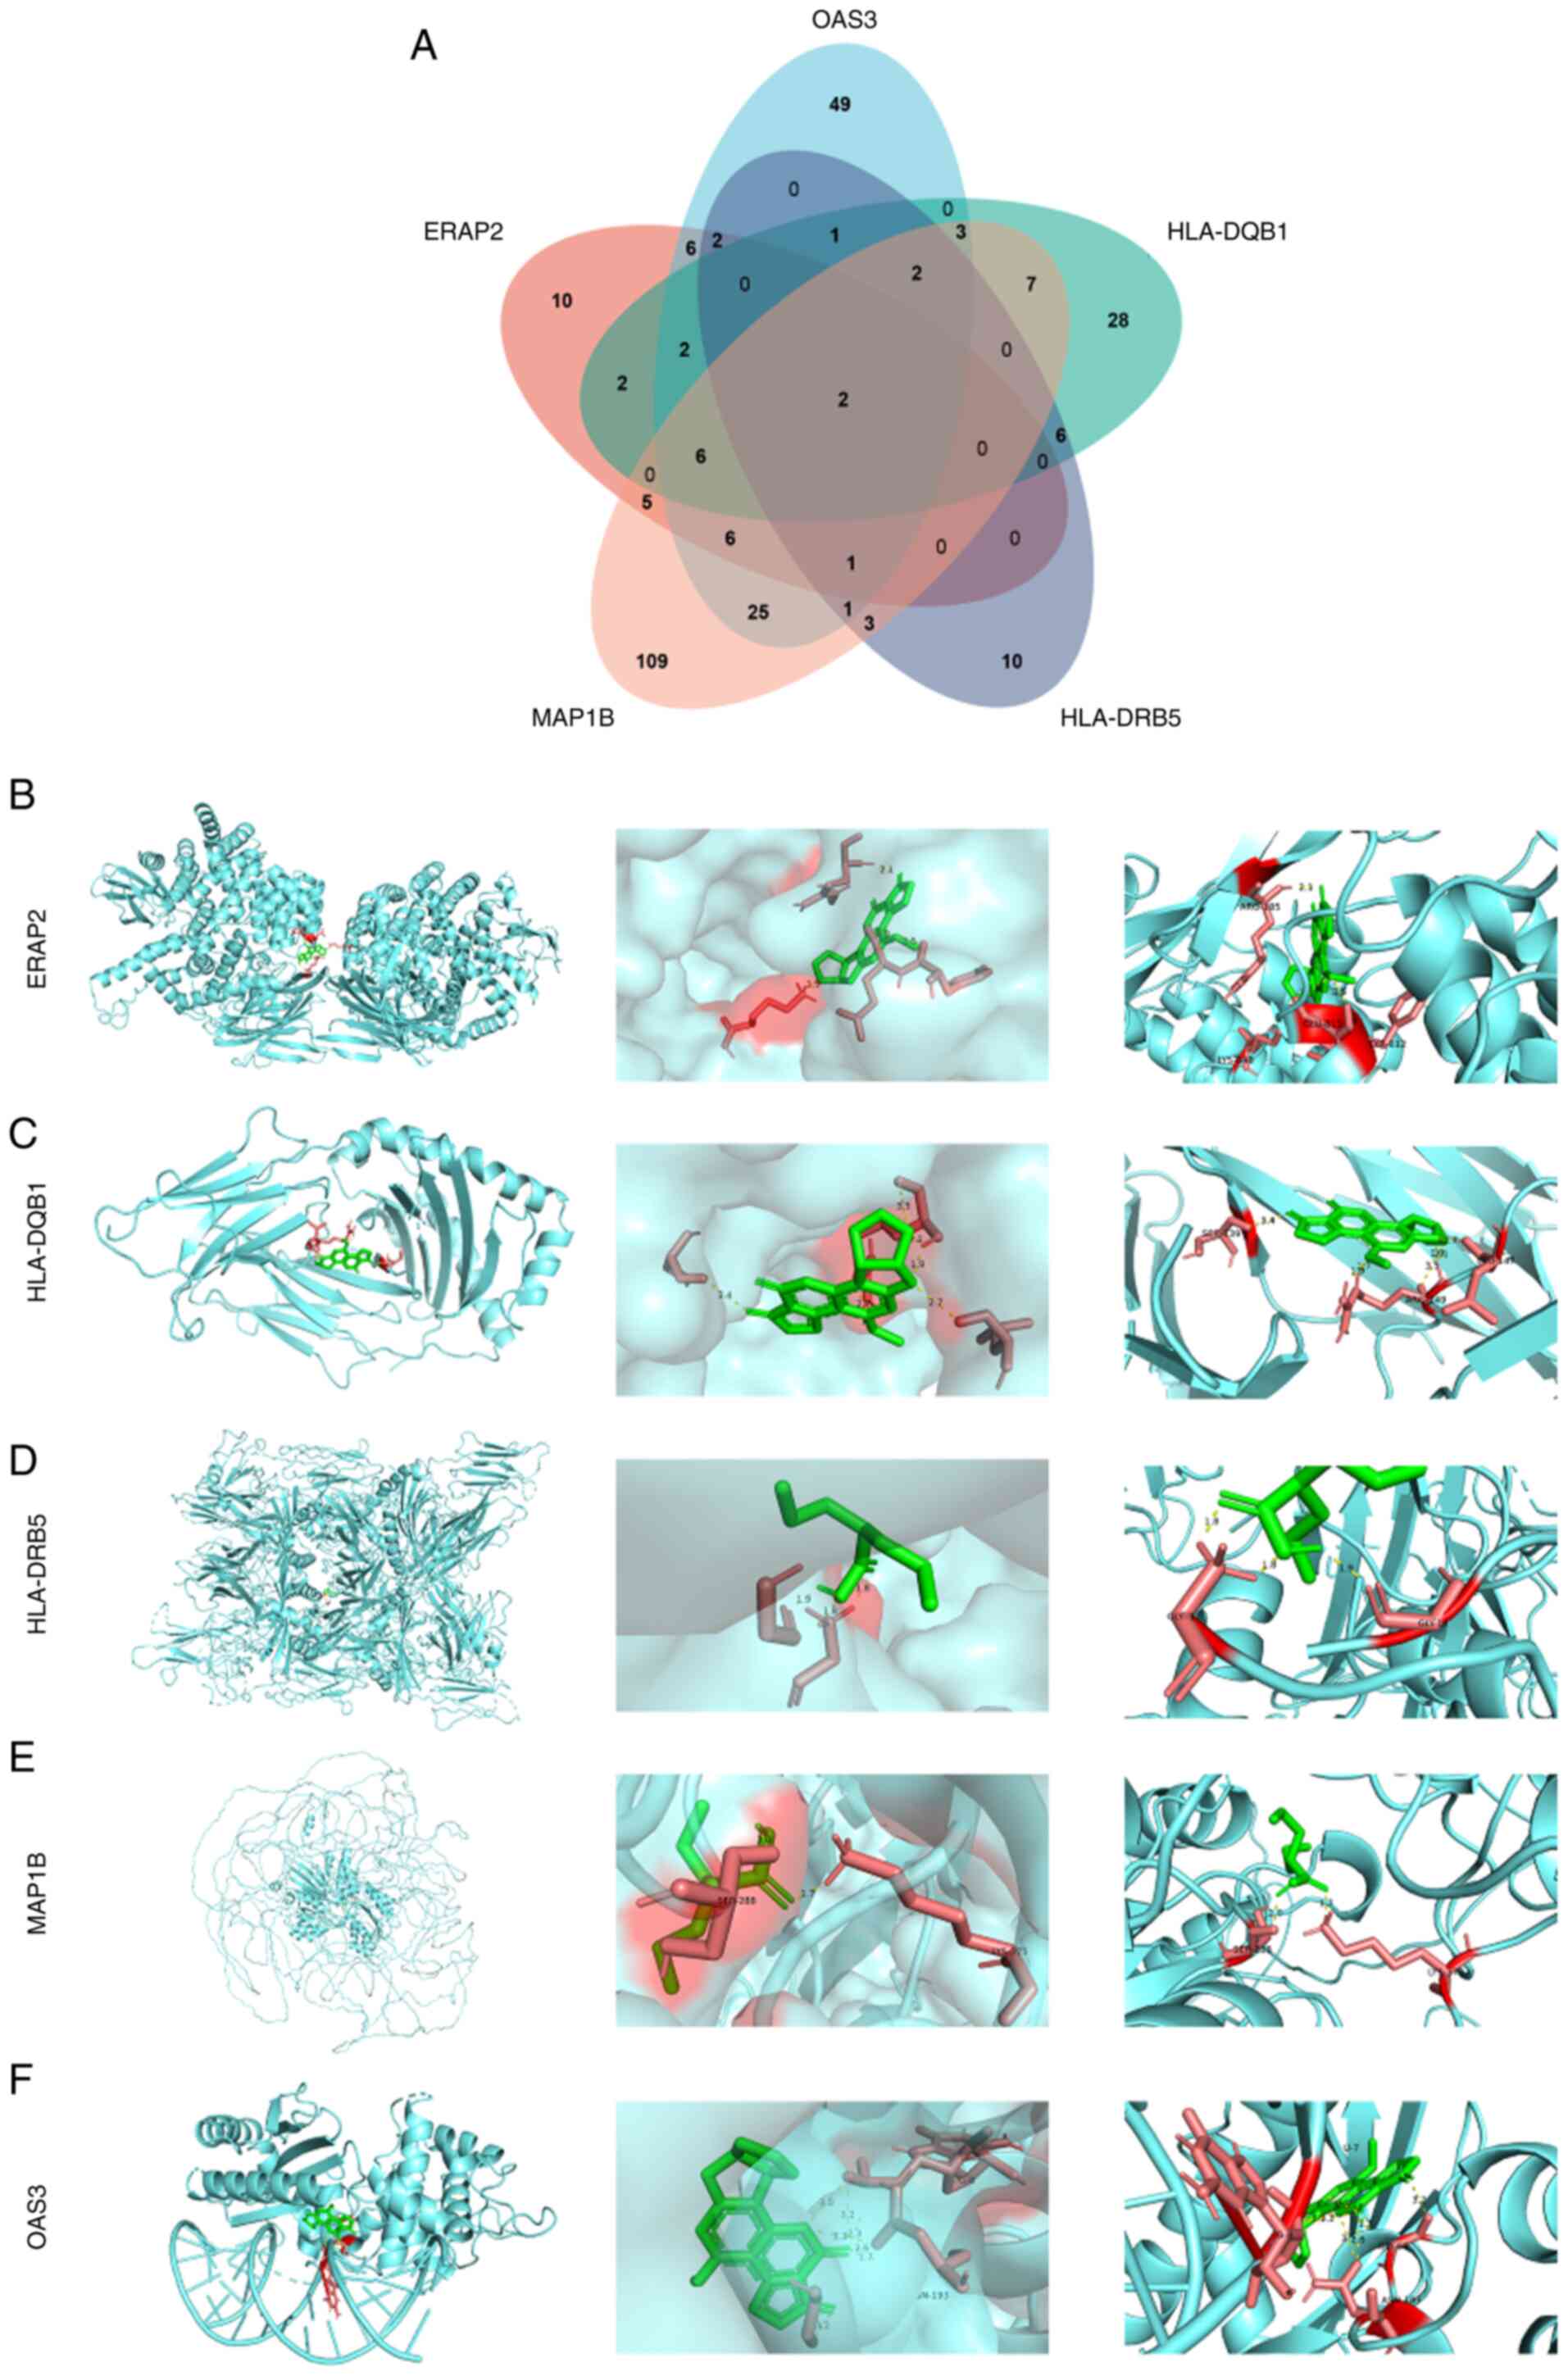
The present study identified target compounds for
each of the five markers: 42 for ERAP2, 106 for OAS3, 59 for
HLA-DQB1, 28 for HLA-DRB5 and 170 for MAP1B. The Venn diagram
revealed two common compounds, valproic acid (VPA) and aflatoxin B1
(AFB1; Fig. 7A). Since VPA is used
in cancer treatment and AFB1 is a carcinogen, only VPA was chosen
for molecular docking with the five markers in the next study.
Molecular docking results revealed that VPA formed stable hydrogen
bonds with several proteins: ERAP2 (ARG185, LYS848, GLU813,
TYR812), HLA-DQB1 (SER139, ARG149, LEU147), HLA-DRB5 (GLY1, GLY14),
MAP1B (GLY1, GLY14, SER288, LYS375) and OAS3 (GLY66, ASN193)
(Fig. 7B-F).
Correlation analysis of biomarkers and
immune microenvironment
T2DM is a metaflammatory disease. MR analysis
explored the link between CD4+ and CD8+ T
cells and T2DM. The IVW test revealed a negative correlation
between T2DM risk and GCST90001482 (Resting CD4 regulatory T cell),
GCST90001492 (Secreting CD4 regulatory T cell) and GCST90001499
(Activated and resting CD4 regulatory T cell), while GCST90001548
(Central Memory CD8+ T cell) showed a positive correlation. The MR
analysis (Table V) revealed
significant associations between mitochondrial dysfunction-related
genetic variants and T2DM risk mainly using the IVW method.
Specifically, exposure factors GCST90001482, GCST90001548,
GCST90001492 and GCST90001499 demonstrated causal effects on T2DM
susceptibility (P<0.05). Additionally, heterogeneity tests
(Table VI) indicated no
substantial variability across genetic instruments (IVW Q-test
P-values: 0.052–0.806), supporting homogeneity of effect estimates.
Horizontal pleiotropy tests (Table
VII) further confirmed the absence of significant bias (MR
Egger intercept P-values: 0.250–0.843), validating the robustness
of causal inferences. Collectively, these findings underscore
mitochondrial dysfunction-related genes as potential contributors
to T2DM progression, with minimal confounding from heterogeneity or
pleiotropy (P>0.05). The error line remained stable after
removing each SNP (Fig. S1),
confirming the reliability and robustness of the predictions.
| Table V.Mendelian analysis between exposure
factors and type 2 diabetes mellitus. |
Table V.
Mendelian analysis between exposure
factors and type 2 diabetes mellitus.
| Exposure
factor | Method | nSNP | b | SE | P-value | lo_ci | up_ci |
|---|
| GCST90001482 | MR Egger | 11 | −0.070 | 0.095 | 0.478 | −0.256 | 0.116 |
|
| Weighted
median | 11 | −0.026 | 0.023 | 0.250 | −0.071 | 0.019 |
|
| Inverse variance
weighted | 11 | −0.051 | 0.023 | 0.027 | −0.097 | −0.006 |
|
| Simple mode | 11 | −0.020 | 0.052 | 0.710 | −0.121 | 0.082 |
|
| Weighted mode | 11 | −0.025 | 0.025 | 0.335 | −0.073 | 0.023 |
| GCST90001492 | MR Egger | 8 | −0.010 | 0.005 | 0.101 | −0.020 | 0.000 |
|
| Weighted
median | 8 | −0.008 | 0.005 | 0.071 | −0.017 | 0.001 |
|
| Inverse variance
weighted | 8 | −0.007 | 0.004 | 0.049 | −0.015 | 0.000 |
|
| Simple mode | 8 | −0.007 | 0.012 | 0.574 | −0.031 | 0.016 |
|
| Weighted mode | 8 | −0.008 | 0.004 | 0.096 | −0.016 | 0.000 |
| GCST90001499 | MR Egger | 14 | −0.012 | 0.022 | 0.587 | −0.055 | 0.030 |
|
| Weighted
median | 14 | −0.011 | 0.014 | 0.429 | −0.037 | 0.016 |
|
| Inverse variance
weighted | 14 | −0.032 | 0.015 | 0.031 | −0.060 | −0.003 |
|
| Simple mode | 14 | −0.043 | 0.026 | 0.129 | −0.094 | 0.009 |
|
| Weighted mode | 14 | −0.013 | 0.013 | 0.356 | −0.038 | 0.013 |
| GCST90001548 | MR Egger | 15 | 0.039 | 0.020 | 0.068 | 0.001 | 0.078 |
|
| Weighted
median | 15 | 0.023 | 0.016 | 0.159 | −0.009 | 0.054 |
|
| Inverse variance
weighted | 15 | 0.025 | 0.012 | 0.032 | 0.002 | 0.048 |
|
| Simple mode | 15 | 0.025 | 0.023 | 0.297 | −0.020 | 0.070 |
|
| Weighted mode | 15 | 0.025 | 0.014 | 0.101 | −0.003 | 0.053 |
| Table VI.Risk heterogeneity test for exposure
factors and type 2 diabetes mellitus. |
Table VI.
Risk heterogeneity test for exposure
factors and type 2 diabetes mellitus.
| Exposure
factor | Method | Q |
Q-df |
Q-pval |
|---|
| GCST90001482 | MR Egger | 24.956 | 9 | 0.302 |
|
| Inverse variance
weighted | 25.072 | 10 | 0.052 |
| GCST90001492 | MR Egger | 3.233 | 6 | 0.779 |
|
| Inverse variance
weighted | 3.767 | 7 | 0.806 |
| GCST90001499 | MR Egger | 25.259 | 12 | 0.136 |
|
| Inverse variance
weighted | 28.329 | 13 | 0.081 |
| GCST90001548 | MR Egger | 13.850 | 13 | 0.384 |
|
| Inverse variance
weighted | 14.707 | 14 | 0.398 |
| Table VII.Risk level horizontal pleiotropy test
for exposure factors and type 2 diabetes mellitus. |
Table VII.
Risk level horizontal pleiotropy test
for exposure factors and type 2 diabetes mellitus.
| Exposure
factor |
egger_intercept | SE | P-value |
|---|
| GCST90001482 | 0.004 | 0.020 | 0.843 |
| GCST90001492 | 0.003 | 0.004 | 0.493 |
| GCST90001499 | −0.007 | 0.006 | 0.250 |
| GCST90001548 | −0.005 | 0.005 | 0.386 |
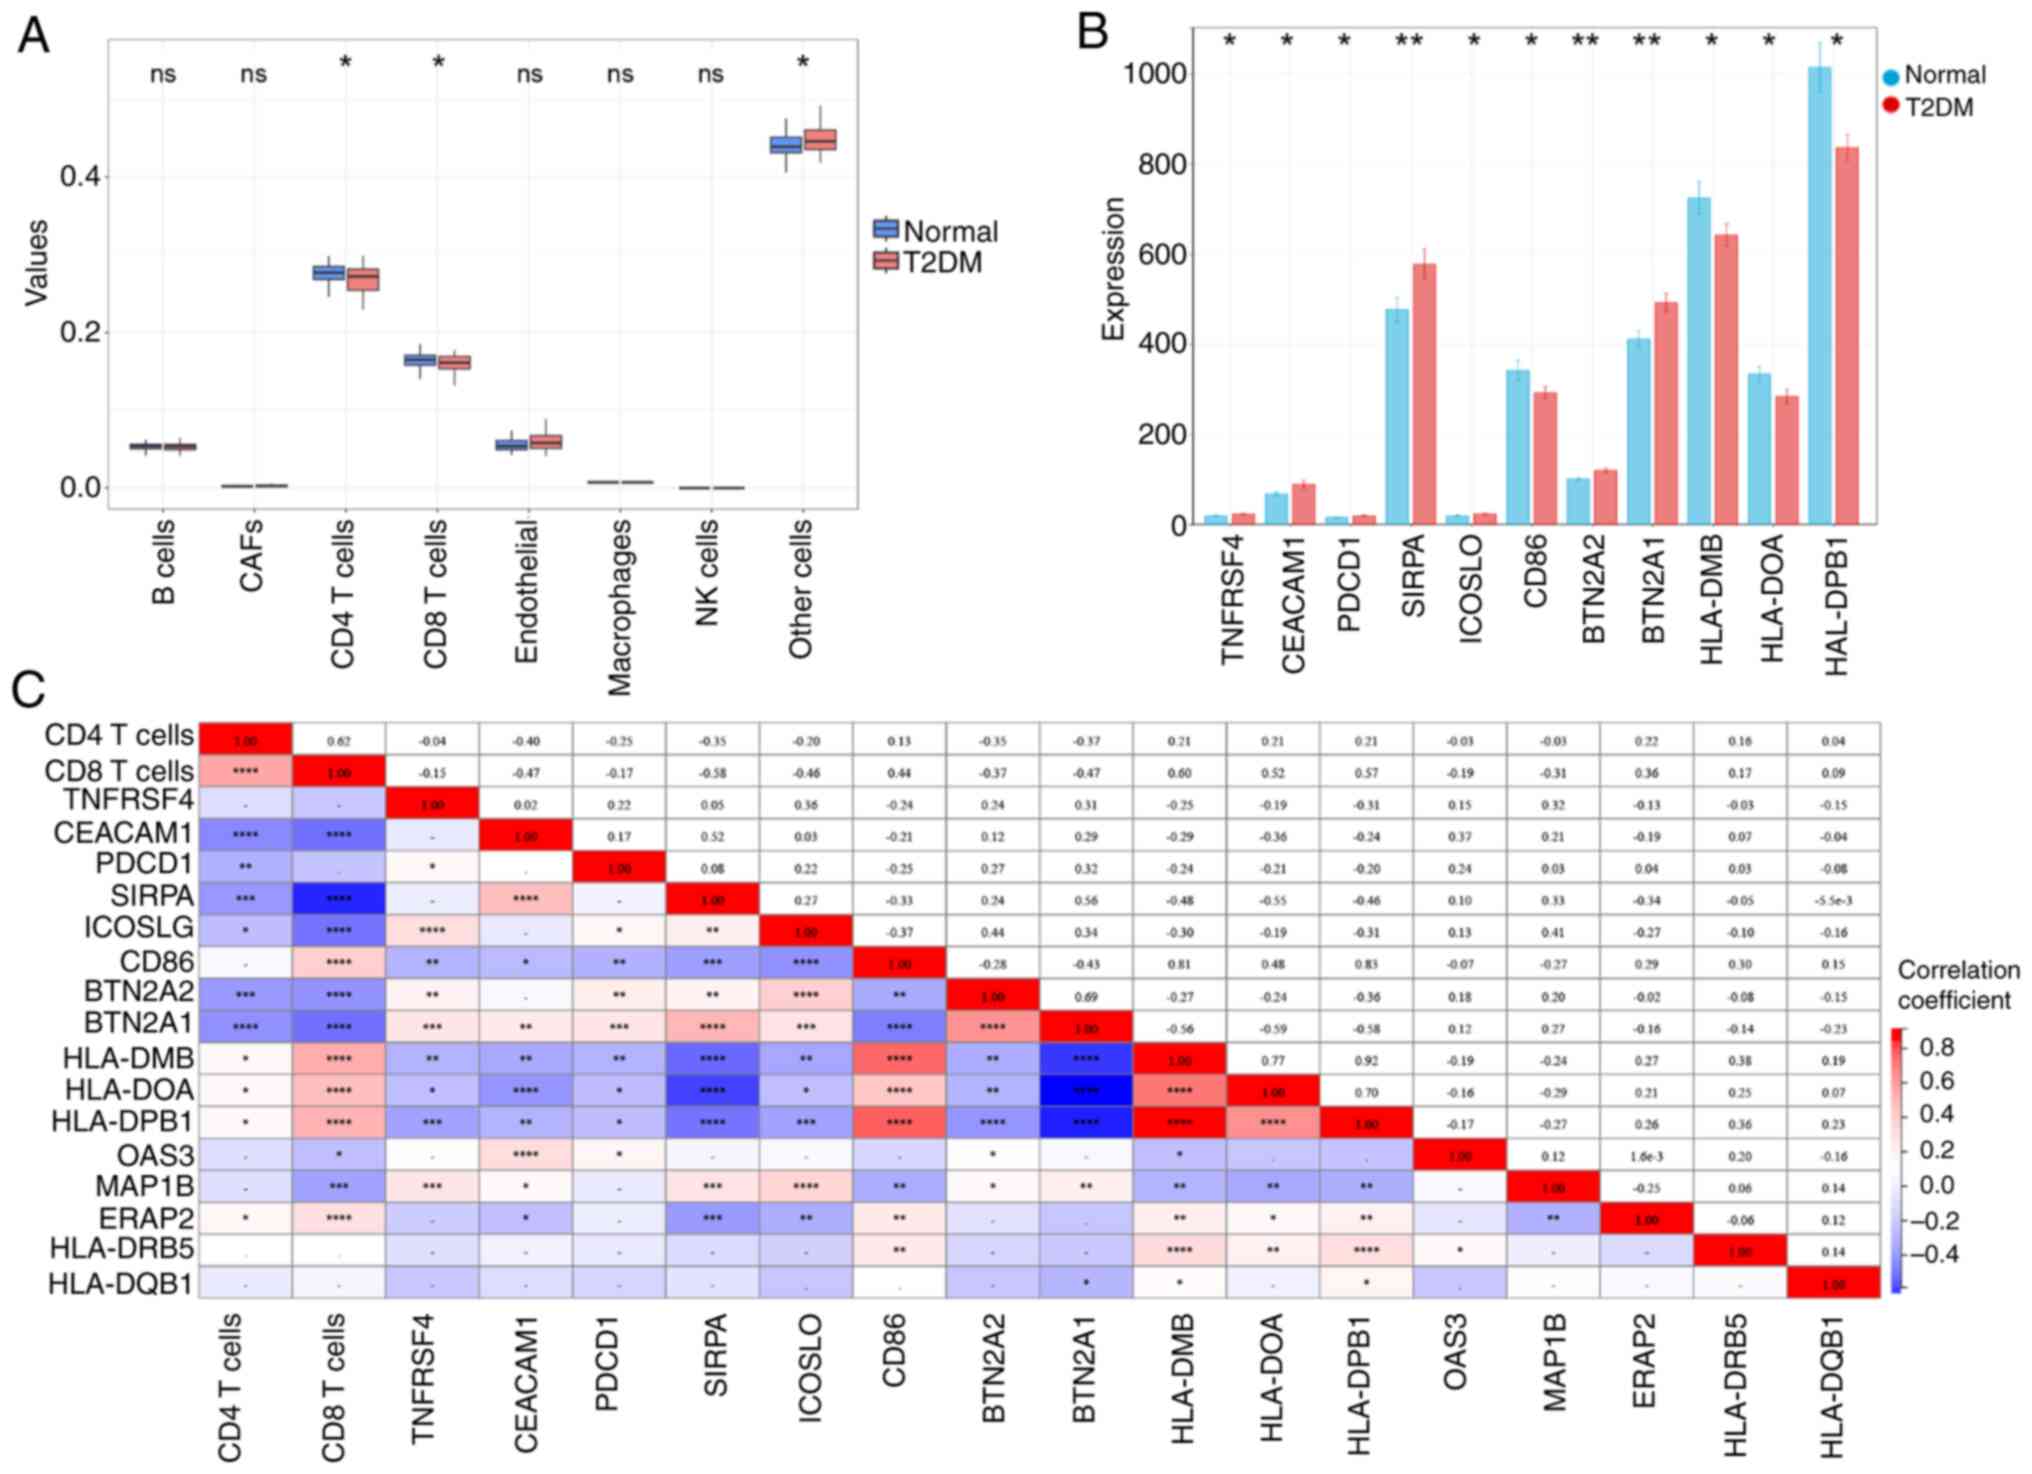
Subsequently, the present study analyzed the
expression levels of the aforementioned five biomarkers in immune
cells. The results of the GSEA analysis indicated that the five
biomarkers screened may be associated with IL-2 and IL-6 pathways,
suggesting that they are associated with immune infiltration in
T2DM (Fig. S2). Therefore, a
detailed analysis was performed of the immune infiltration of T2DM
using the EPIC algorithm. It was found that the number of
CD4+ T cells and CD8+ T cells in T2DM was
notably lower than that in the normal group; TNFRSF4, CEACAM1,
PDCD1, SIRPA, ICOSLO, BTN2A2 and BTN2A1 were notably upregulated,
while CD86, HLA-DMB, HLA-DOA and HLA-DPB1 was notably downregulated
in the T2DM (Fig. 8A and B;
P<0.05). Pearson correlation analysis showed that. OAS3
and MAP1B were negatively correlated with CD8+ T cells,
while ERAP2 was positively correlated with CD8+ T cells
(Fig. 8C; P<0.05). These
suggested that changes in CD8+ T cells may affect the
expression of these marker genes, which in turn affects the immune
microenvironment in diabetes. In addition, MAP1B was notably
correlated with all immune checkpoint genes except PDCD1 (Fig. 8C; P<0.05). The
aforementioned findings suggested that MAP1B may regulate the
development of diabetes by modulating the immune checkpoint
pathway.
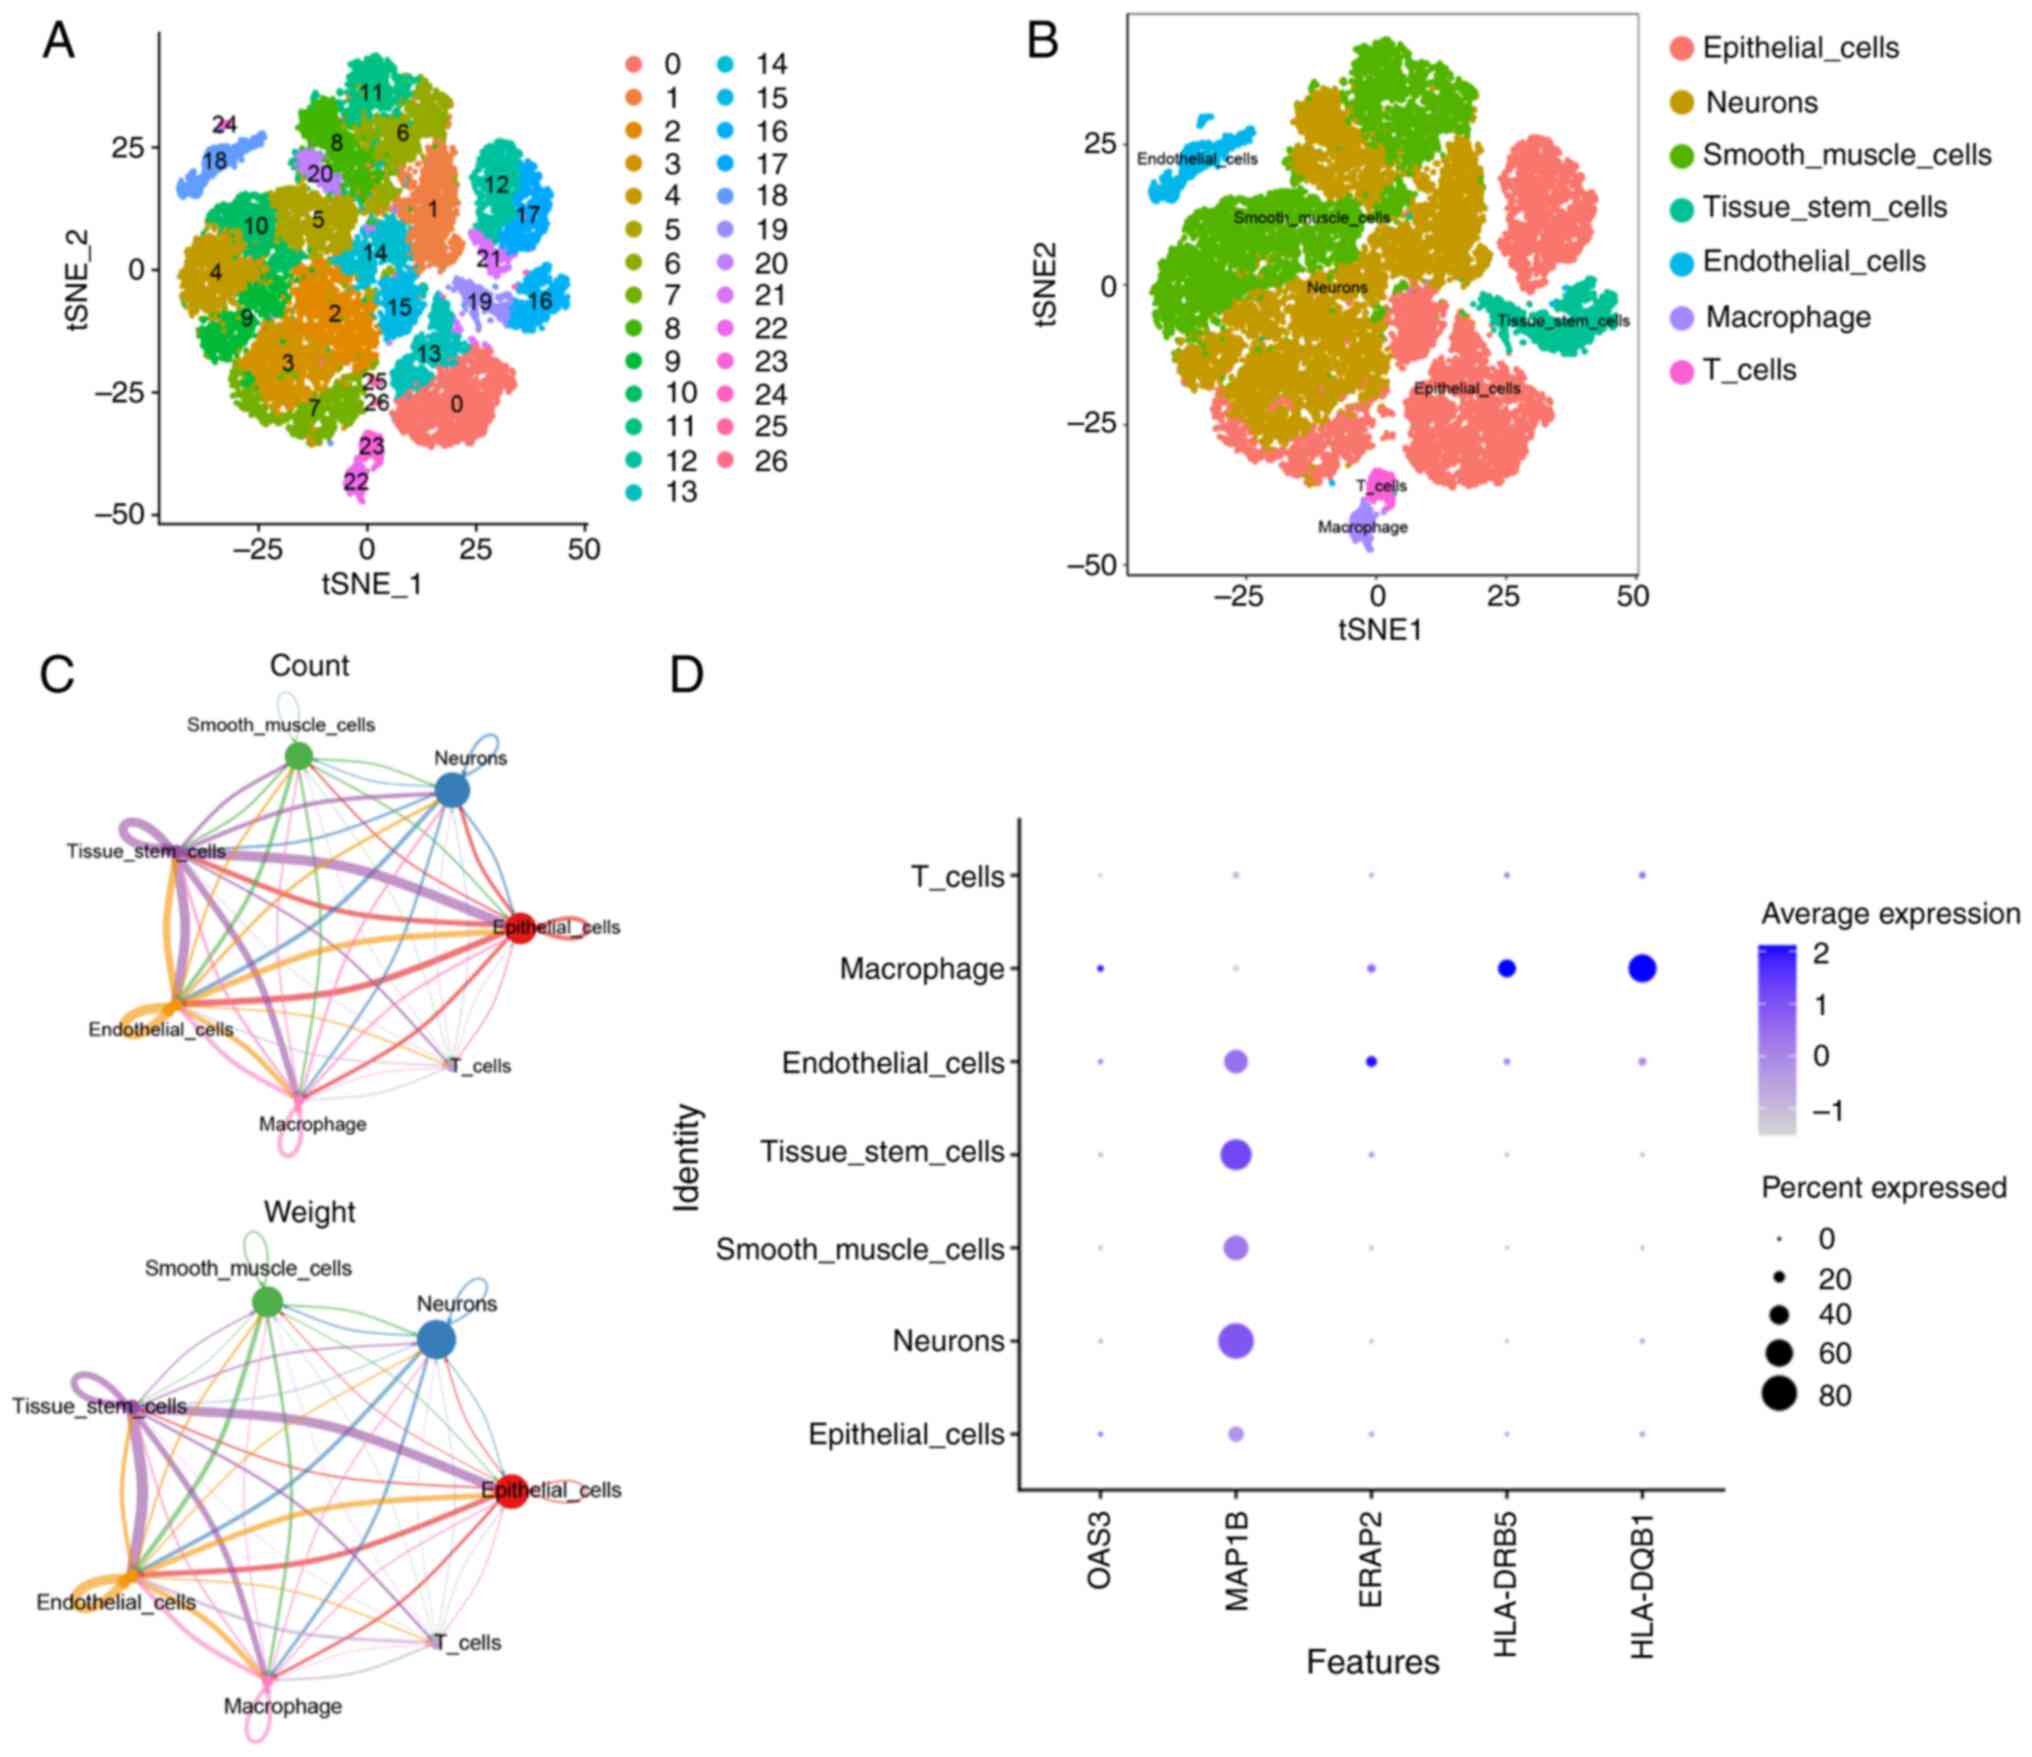
Results of single-cell sequencing
analysis
The formation of islet inflammatory microenvironment
and the interaction between immune cells have gradually attracted
attention. Therefore, T2DM single-cell transcriptional profiles
based on the GSE221156 dataset were analyzed. As shown in Fig. 9A and B, 27 cell populations were
obtained by tSNE clustering analysis and seven major cell
subpopulations, including epithelial cells, neuronal cells, smooth
muscle cells, tissue stem cells, endothelial cells, macrophages and
T cells, were identified by cell type annotation with the ‘SingleR’
package. Analysis of the results of cell interactions showed that
each cell type was associated with each other to varying degrees,
with tissue stem cells being the most strongly related to other
cells (Fig. S3) and macrophages
and T cells being important in the immune response (Fig. 9C). Subsequently, the expressions of
the five biomarkers in cells were further analyzed and it was found
that MAP1B was expressed in almost all cell types, but particularly
in neuronal cells and tissue stem cells; ERAP2 was more prominently
expressed in endothelial cells and HLA-DQB1, HLA-DRB5 and OAS3 were
more prominently expressed in macrophages (Fig. 9D). Notably, the expression of the
five marker genes was more prevalent in macrophages, suggesting
that the role of these marker genes in T2DM may be closely related
to macrophage function. Therefore, subsequent experiments
endeavored to investigate the roles of the aforementioned five
biomarkers in T2DM via cellular experiments.
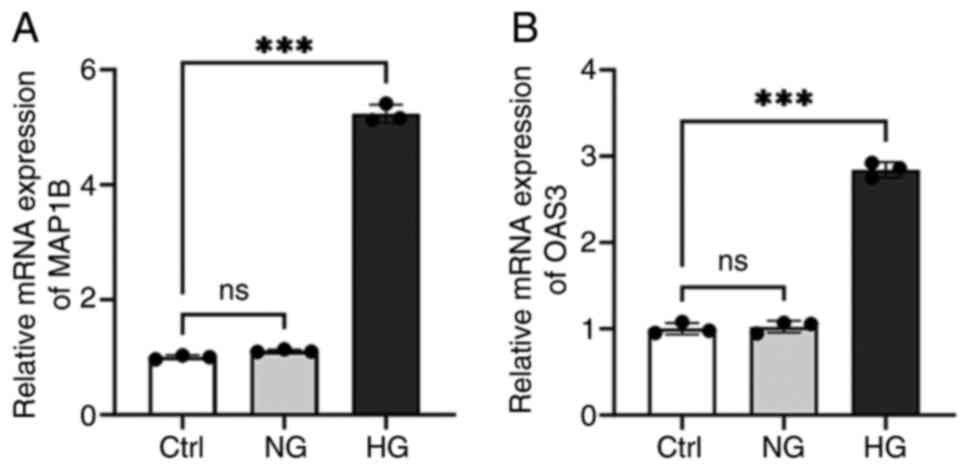
Detection of MAP1B and OAS3 expression
levels in macrophages
In the aforementioned single-cell sequencing
analysis results, five marker genes commonly expressed in
macrophages were identified. The expression of these markers in
T2DM-associated macrophages was then verified by cellular
experiments. Due to the absence of murine sequences for ERAP2,
HLA-DQB1 and HLA-DRB5 in the NCBI database, only MAP1B and OAS3
were validated experimentally. The RT-qPCR results showed that the
expressions of MAP1B and OAS3 were notably increased in the HG
group (Fig. 10;
P<0.001). The results indicated that HG concentration
notably induced the expression levels of MAP1B and OAS3 in
macrophages.
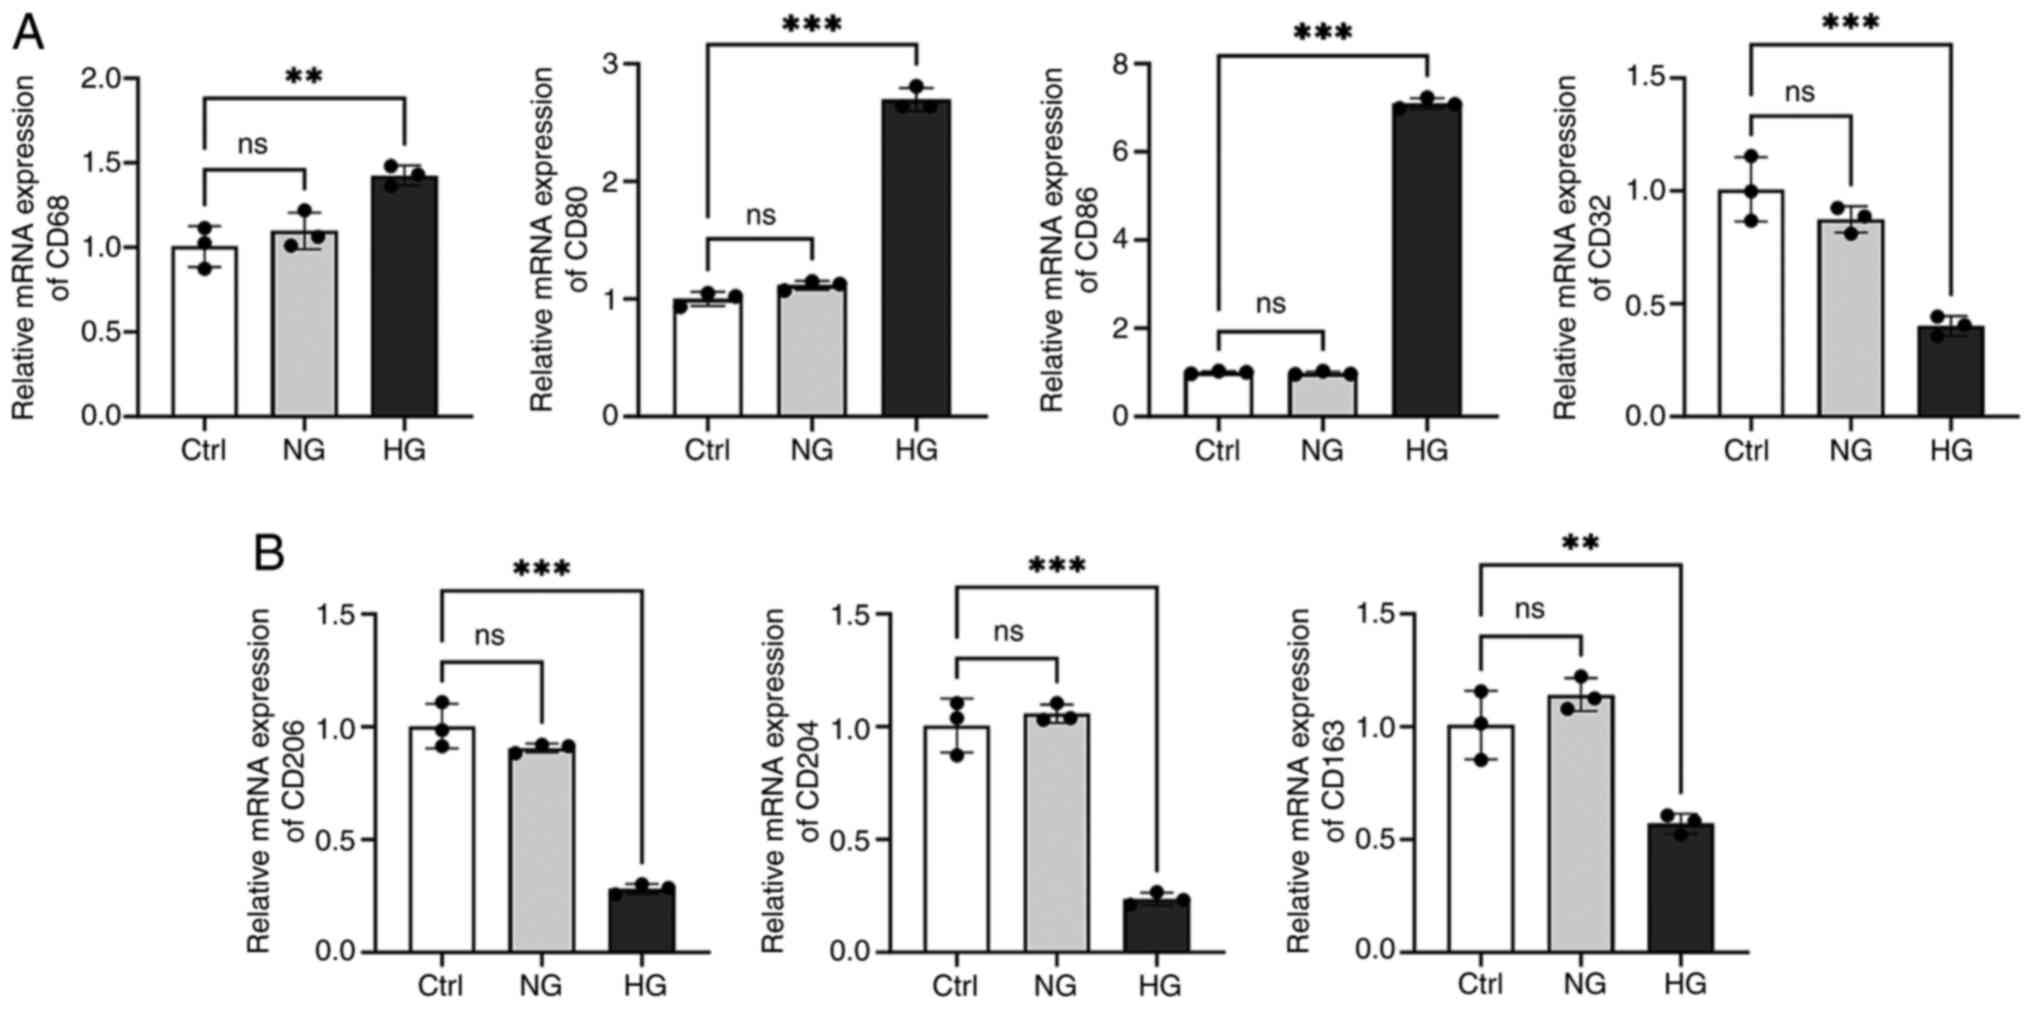
Analysis of M1/M2 macrophage
polarization in T2DM
To further explore the effect of T2DM on macrophage
polarization, the expression of M1 macrophage markers (CD68, CD80,
CD86 and CD32) and M2 macrophage markers (CD206, CD204 and CD163)
were examined (Fig. 11). The
results showed that the expression of M1 macrophage markers (except
for CD32) was notably increased and the expression of M2 macrophage
markers were decreased considerably under HG conditions (Fig. 11; P<0.01). The
aforementioned findings suggested that in an HG environment, M1
macrophages and pro-inflammatory responses increase, while M2
macrophages and anti-inflammatory responses decrease. Future
studies on M1/M2 polarization will focus on CD86 and CD204, as they
showed the most significant expression differences.
Effects of MAP1B and OAS3 on
macrophage M1/M2 polarization
To further investigate the effects of MAP1B and OAS3
in macrophage polarization, the present study initially assessed
their expression levels in M1 and M2 macrophages. RAW264.7 cells
were stimulated with TNF-α to induce M1 polarization and with IL-4
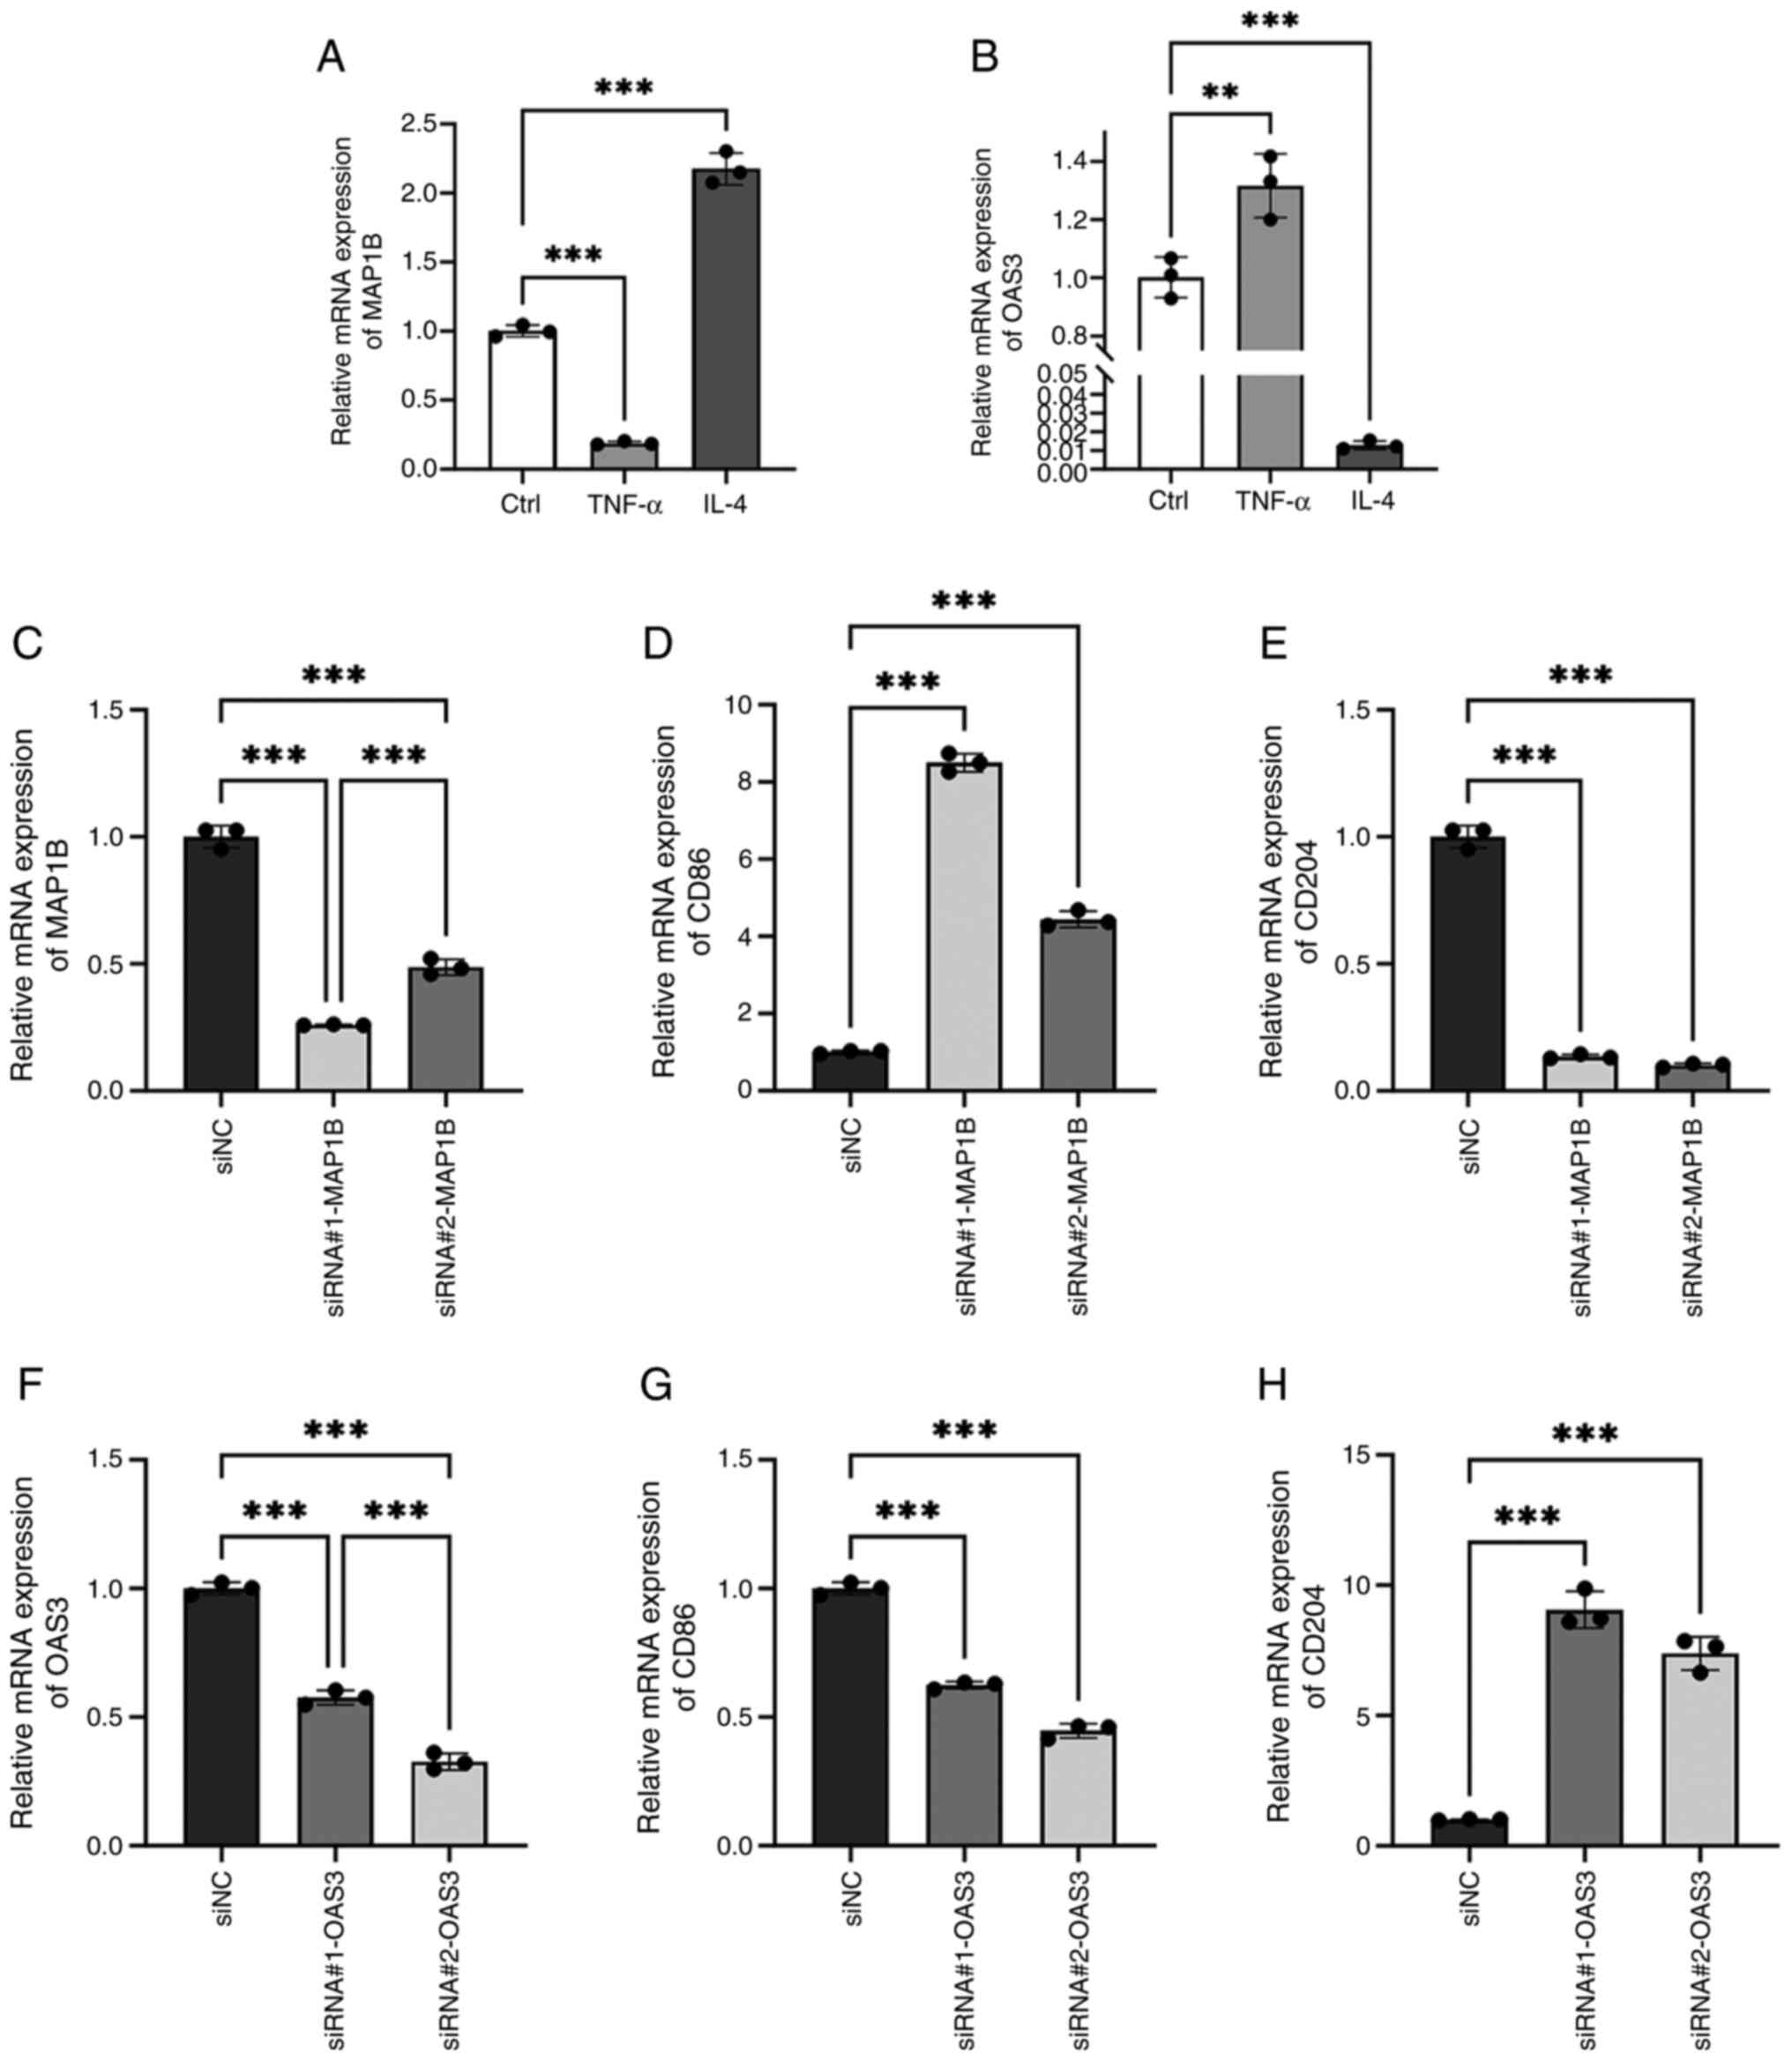
to induce M2 polarization. RT-qPCR analysis revealed a significant
downregulation of MAP1B expression in the TNF-α group and a marked
upregulation in the IL-4 group (Fig.
12A; P<0.001). Conversely, OAS3 expression was
increased in the TNF-α group and decreased in the IL-4 group
(Fig. 12B; P<0.01).
These findings suggested that MAP1B is potentially associated with
M2 macrophage polarization, whereas OAS3 appears to be linked to M1
macrophage polarization.
To assess the effects of MAP1B and OAS3 on
macrophage polarization, siRNA was used to inhibit their
expression. RT-qPCR showed siRNA#1-MAP1B was more effective than
siRNA#2-MAP1B (Fig. 12C;
P<0.001), while siRNA#2-OAS3 outperformed siRNA#1-OAS3
(Fig. 12F; P<0.001).
Inhibiting MAP1B increased M1 macrophage marker CD86 level and
decreased M2 macrophage marker CD204 (Fig. 12D and E; P<0.001),
whereas reducing OAS3 lowered CD86 and raised CD204 levels.
(Fig. 12G and H;
P<0.001). These results indicated that MAP1B promotes M2
macrophage polarization, whereas OAS3 promotes M1 macrophage
polarization. Since significant M1 macrophage polarization in
HG-induced RAW264.7 cells was observed in the aforementioned
experiments, which is consistent with the role of OAS3, we aim to
investigate the mechanism of OAS3 in macrophage polarization in
depth in a follow-up study.
Downregulation of OAS3 expression
attenuates M1 macrophage polarization by upregulating
phosphorylated (p-)mTORC level
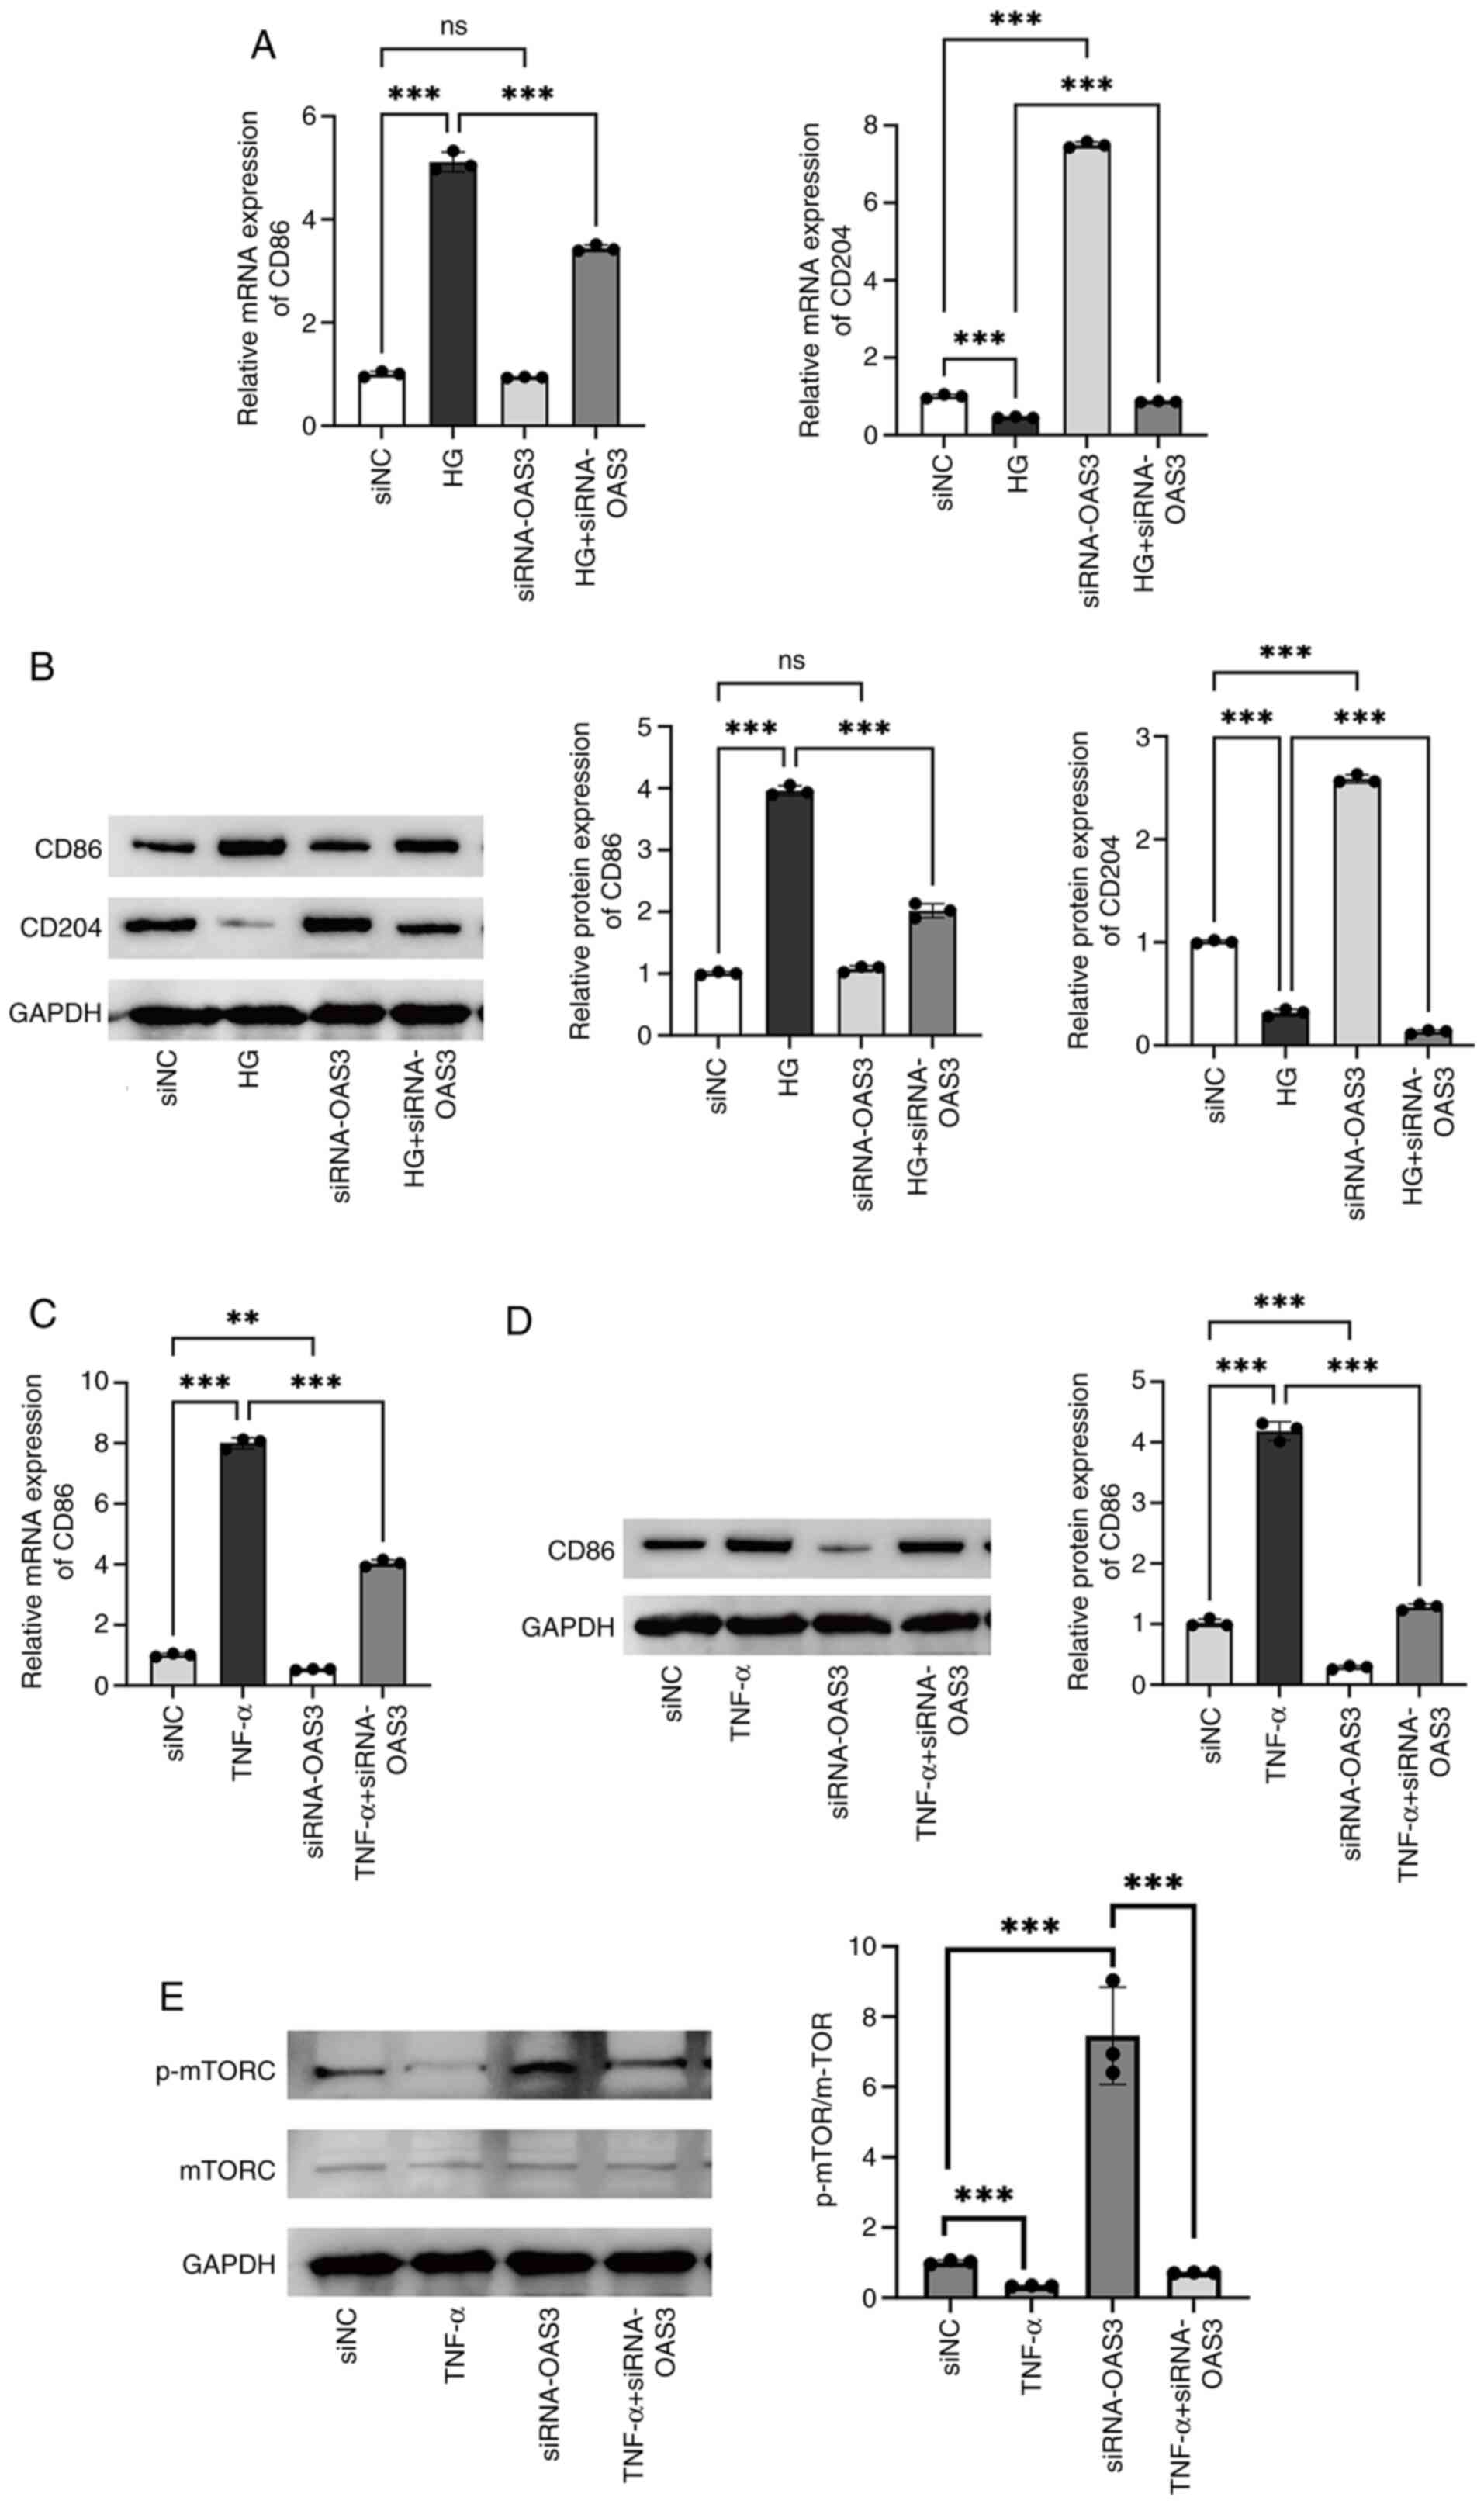
To explore the role of OAS3 expression on macrophage
polarization in T2DM, the expression of OAS3 in HG-induced
macrophages was knocked down by transfection with siRNA#2-OAS3. HG
treatment notably increased the expression level of the M1
macrophage marker CD86 and notably decreased the expression level
of the M2 macrophage marker CD204. By contrast, inhibition of OAS3
expression notably reversed the effect of HG treatment (Fig. 13A and B; P<0.001). The
aforementioned data suggested that downregulation of OAS3
expression inhibited macrophage M1 polarization and promoted
macrophage M2 polarization in a high-glucose environment, which
attenuated the inflammatory response.
To further validate the role of OAS3 in M1
macrophage polarization, the OAS3 expression was downregulated in
TNF-α-induced macrophages. The results of RT-qPCR and western
blotting experiments showed that TNF-α treatment upregulated the
expression of CD86 in macrophages and downregulation of OAS3
expression inhibited CD86 expression; moreover, downregulation of
OAS3 reversed the TNF-α action (Fig.
13C and D; P<0.01). The results further indicated
that OAS3 played a promoting role in M1 macrophage polarization and
that downregulation of OAS3 notably inhibited M1-type polarization
and attenuated inflammatory responses.
To explore the potential mechanism of OAS3-induced
M1 macrophage polarization, GSEA was used and it was found that
OAS3 showed activation in the mTORC1 signaling pathway (Fig. S2). Therefore, the effect of
downregulation of OAS3 on proteins related to the mTORC1 signaling
pathway in macrophages was examined. Western blotting results
showed that there was no significant change in the levels of mTORC
protein in each group (Fig. 13E).
TNF-α induced a significant decrease in p-mTORC/mTORC protein
levels in macrophages, whereas downregulation of OAS3 expression
increased the value of p-mTORC/mTORC (Fig. 13E; P<0.001). In
addition, downregulation of OAS3 expression reversed the effect of
TNF-α, suggesting that downregulation of OAS3 expression attenuated
macrophage M1 polarization by upregulating p-mTORC levels.
Discussion
Research has shown that there are a number of
factors contributing to the global epidemic of diabetes, including
an aging population, a sedentary lifestyle, obesity and an
unhealthy daily diet (24).
Prolonged hyperglycemia can cause damage to organs and tissues such
as eyes, nerves, kidneys and cardiovascular organs, leading to a
series of complications that pose a serious threat to human health
and a huge burden on healthcare costs (12,25).
The current classical drugs for the treatment of T2DM, such as
metformin, sulfonylureas and thiazolidinediones, cause adverse
reactions in patients to varying degrees (6). Therefore, through an in-depth study
of the pathogenesis of T2DM and corresponding early analysis, the
prediction, diagnosis and development of therapeutic drugs are of
great significance to the clinical treatment of patients.
Currently, HbA1c is extensively utilized in the
diagnosis of T2DM (8). Despite its
high stability and convenience, it may result in misdiagnosis in
certain cases, such as those involving anemia or ethnic differences
(26). Fasting blood glucose (FPG)
and the oral glucose tolerance test (OGTT) continue to be regarded
as the gold standards for T2DM diagnosis, with OGTT being
particularly sensitive in detecting early diabetes and prediabetes
(27). Nevertheless, the
complexity and cost associated with OGTT constrain its use in some
regions. Consequently, novel biomarkers and assays for T2DM are
being developed, which have the potential to transform future
screening and diagnostic strategies for diabetes. Fructosamine and
glycated albumin have been identified as valuable indicators for
evaluating short-term glycemic control, particularly in patients
necessitating frequent monitoring (28). A previous study proposed that
fructosamine and glycated albumin may offer greater predictive
value than HbA1c in certain populations (28). Furthermore, 1,5-AG serves as an
additional marker for assessing short-term blood glucose
fluctuations (29). 1,5-AG is
particularly effective in monitoring postprandial hyperglycemia and
its integration with HbA1c and FPG enhances the early detection
rate of T2DM (29). These advances
not only facilitate the early detection of diabetes but also
enhance patient management and prognosis, thereby mitigating the
risk of complications.
The pathogenesis of T2DM is characterized by a
gradual loss of insulin secretion from β-cells due to inflammatory
factors and the development of insulin resistance (6). Recently, researchers have
demonstrated the relationship between mitochondrial dysfunction and
insulin resistance, suggesting that mitochondrial dysfunction is
significant in the pathogenesis and progression of T2DM (12). Previous studies have suggested that
therapeutic modalities targeting mitochondria may effectively treat
T2DM and its secondary defects (30,31).
The present study aimed to investigate the role and mechanisms of
genes associated with mitochondrial dysfunction in the risk
prediction and progression of T2DM. Therefore, it combined
bioinformatics analysis and experimental validation to investigate
the role and mechanism of mitochondrial dysfunction-related genes
in the prediction and development of T2DM risk.
First, the present study obtained five key genes
associated with mitochondrial dysfunction in T2DM by bioinformatics
analysis, including ERAP2, HLA-DQB1, HLA-DRB5, MAP1B and OAS3. It
was demonstrated that ERAP2 played an important role in antigenic
peptide processing, which is involved in the maturation of proteins
in the endoplasmic reticulum and influences cytotoxic immune
responses (32). ERAP2 was
upregulated as a mitochondrial dysfunction-related gene in
obstructive sleep apnea (33).
HLA-DQB1 and HLA-DRB5 play an important role in the immune system
by presenting peptides to T-cells and are differentially expressed
in type 1 diabetes (34,35). The HLA-DQB1 allele is associated
with T2DM and diabetic nephropathy in the Chinese Han population
(36). MAP1B expression is
associated with neurodevelopment and calcineurin-10 affects the
progression of T2DM by regulating the cleavage of MAP1B (37,38).
OAS3 expression is upregulated as a co-immunization biomarker in
T2DM patients (39,40). The present study identified a
significant downregulation of ERAP2 in T2DM, whereas the
expressions of HLA-DQB1, HLA-DRB5, MAP1B and OAS3 were upregulated.
In addition, MAP1B had an improved predictive performance for T2DM
(AUC value of 0.759), whereas the AUC value was increased to 0.833
for the combined detection of the aforementioned five markers.
Addressing mitochondrial dysfunction could represent
a novel therapeutic strategy for the management of T2DM (12). Pharmacological agents that enhance
mitochondrial function, including specific antioxidants and
mitochondrial protective compounds, may contribute to the
restoration of normal metabolic processes, thereby improving
insulin sensitivity and glycemic regulation (12,41).
The present study explored the potential role of these five markers
(ERAP2, HLA-DQB1, HLA-DRB5, MAP1B and OAS3) in the treatment of
T2DM and the results showed that these genes collectively target
VPA. Turnbull et al (42)
demonstrated a modest decrease in blood glucose levels in Wistar
rats treated with VPA following administration of VPA, a result
that was confirmed in subsequent preclinical studies (43–45).
Several clinical studies also found lower blood glucose levels in
VPA-treated patients (46,47). In the present study, molecular
docking results showed that VPA was able to bind to the five
markers (ERAP2, HLA-DQB1, HLA-DRB5, MAP1B and OAS3) through the
formation of a stable hydrogen bond toward binding. The findings
indicate that investigating mitochondrial dysfunction offers a
potential target for the development of innovative therapeutic
strategies. Furthermore, early identification and intervention in
mitochondrial dysfunction may mitigate the risk of diabetic
complications, thereby enhancing quality of life and prognosis in
patients.
Metabolic disorders associated with T2DM are
intricately linked to immune system function (48). The metabolic condition of
mitochondria influences not only energy production but also
modulates the activity and functionality of immune cells (48). Studies have shown that immune
system disorders are closely related to the progression of T2DM
(49). Accumulation of immune
cells and inflammatory mediators in pancreatic islets, as well as
immune cell infiltration, is one of the key features of islet
dysfunction (50). Previous
studies have demonstrated the effect of T cells on T2DM (51–53).
CD4+ T cells, as the main cells that make up the body's
immune system, play a crucial role in the development of the
disease. The helper T cells differentiated from CD4+ T
cells contain three subpopulations, Th1, Th2 and Th17 and serum
TNF-α secreted by Th1 cells and IL-4, IL-10 secreted by Th2 cells,
as well as IL-17 secreted by Th17 cells, have been shown to play an
important role in the development of diabetes (54–56).
CD8+ T cells contribute to the development of chronic
low-grade inflammation by secreting pro-inflammatory cytokines and
expressing cytotoxic molecules (57,58).
In addition, a number of studies have shown that macrophage
infiltration is increased in pancreatic islets of T2DM patients
(59–61). The present study found a
significant decrease in the abundance of CD4+ T cells
and CD8+ T cells and a substantial enrichment of
macrophages in T2DM based on bioinformatics analysis. In addition,
it found that CD4+ T cells were notably associated with
ERAP2, whereas CD8+ T cells were notably associated with
OAS3, MAP1B and ERAP2. Mitochondrial dysfunction is a critical
factor in the pathogenesis of T2DM, notably influencing the immune
microenvironment and thereby exacerbating insulin resistance and
metabolic disorders. A comprehensive understanding of this
intricate interaction is essential not only for elucidating the
pathological mechanisms underlying T2DM but also for identifying
potential targets for novel therapeutic strategies. Future research
should further investigate the relationship between mitochondrial
function and immune response to facilitate the development of more
effective interventions for the management of T2DM.
Patients with T2DM develop an imbalance in
macrophage M1/M2 polarization, which is manifested by an increase
in pro-inflammatory M1 macrophages and a decrease in
anti-inflammatory M2 macrophages (62). Chronic inflammation mediated by an
imbalance in macrophage M1/M2 polarization may be a key factor in
insulin resistance and pancreatic β-cell dysfunction (62). The present study revealed a
significant increase in the expression of the M1 macrophage markers
CD86, CD80 and CD68 and a decrease in the expression of the M2
macrophage markers CD204, CD206 and CD163 in a high-glucose
environment. ERAP2, HLA-DQB1, HLA-DRB5, MAP1B and OAS3 are closely
associated with immune responses and previous studies have reported
their expression in macrophages (63–67).
Since the murine sequences of ERAP2, HLA-DQB1 and HLA-DRB5 were not
retrieved from the NCBI database, MAP1B and OAS3 were chosen for
cellular experimental validation. One study notes that MAP1B could
be used as a prognostic marker for bladder cancer patients and was
notably positively correlated with the M2 macrophage-associated
gene CD163 (66). Another study
indicates that OAS3 was positively correlated with M1 macrophages
in systemic lupus erythematosus (68). The present study showed that the
expression of MAP1B and OAS3 was notably upregulated in HG-induced
RAW264.7 cells and that the expression of MAP1B was higher in M2
macrophages. By contrast, the expression of OAS3 was higher in M1
macrophages. In addition, it was found that OAS3 showed activation
in the mTORC1 signaling pathway by GSEA. A previous study confirmed
that mTORC1 reduces insulin sensitivity by inhibiting insulin
signaling (69). The present study
found that downregulation of OAS3 expression attenuated M1
macrophage polarization by upregulating p-mTORC levels.
There are still some limitations to the present
study. First, it obtained five biomarkers based on bioinformatics
analysis, but since there were no mouse sequences for ERAP2,
HLA-DQB1 and HLA-DRB5, Only MAP1B and OAS3 were experimentally
validated. In addition, it was not experimentally demonstrated that
VPA could target the expression of five biomarkers to alleviate the
progression of T2DM. Future studies will conduct a more
comprehensive analysis of the clinical application value and
mechanism of action of the five biomarkers.
In conclusion, the present study screened five
mitochondrial dysfunction biomarkers (ERAP2, HLA-DQB1, HLA-DRB5,
MAP1B and OAS3) associated with T2DM and the combined detection of
the aforementioned five markers has good efficacy in T2DM
prediction. In addition, the aforementioned five marker genes may
be target-regulated genes of VPA. Moreover, downregulation of OAS3
expression could attenuate the degree of M1 macrophage polarization
by regulating the level of p-mTORC and thus regulate the
progression of T2DM.
Supplementary Material
Supporting Data
Acknowledgements
Not applicable.
Funding
Funding: No funding was received.
Availability of data and materials
The data generated in the present study may be
requested from the corresponding author.
Authors' contributions
ML contributed to the conception and design. ML and
HQ contributed to the collection and assembly of data. ML and HQ
analyzed and interpreted the data. ML and HQ confirm the
authenticity of all the raw data. Both authors read and approved
the final version of the manuscript.
Ethics approval and consent to
participate
Not applicable.
Patient consent for publication
Not applicable.
Competing interests
The authors declare that they have no competing
interests.
References
|
1
|
Diane A, Allouch A, Mu UMRBA and
Al-Siddiqi HH: Endoplasmic reticulum stress in pancreatic β-cell
dysfunctionality and diabetes mellitus: A promising target for
generation of functional hPSC-derived β-cells in vitro. Front
Endocrinol (Lausanne). 15:13864712024. View Article : Google Scholar : PubMed/NCBI
|
|
2
|
Ding Y, Shi Y, Guan R, Yan S, Liu H, Wang
Z, Li J, Wang T, Cai W and Ma G: Evaluation and comparison of
efficacy and safety of tirzepatide and semaglutide in patients with
type 2 diabetes mellitus: A Bayesian network meta-analysis.
Pharmacol Res. 199:1070312024. View Article : Google Scholar : PubMed/NCBI
|
|
3
|
Ye H, Wang R, Wei J, Wang Y, Zhang X and
Wang L: Bioinformatics analysis identifies potential ferroptosis
key gene in type 2 diabetic islet dysfunction. Front Endocrinol
(Lausanne). 13:9043122022. View Article : Google Scholar : PubMed/NCBI
|
|
4
|
Zheng Y, Ley SH and Hu FB: Global
aetiology and epidemiology of type 2 diabetes mellitus and its
complications. Nat Rev Endocrinol. 14:88–98. 2018. View Article : Google Scholar : PubMed/NCBI
|
|
5
|
Sandoval DA and Patti ME: Glucose
metabolism after bariatric surgery: Implications for T2DM remission
and hypoglycaemia. Nat Rev Endocrinol. 19:164–176. 2023. View Article : Google Scholar : PubMed/NCBI
|
|
6
|
Ruze R, Liu T, Zou X, Song J, Chen Y, Xu
R, Yin X and Xu Q: Obesity and type 2 diabetes mellitus:
Connections in epidemiology, pathogenesis and treatments. Front
Endocrinol (Lausanne). 14:11615212023. View Article : Google Scholar : PubMed/NCBI
|
|
7
|
Marin-Penalver JJ, Martin-Timon I,
Sevillano-Collantes C and Del Canizo-Gomez FJ: Update on the
treatment of type 2 diabetes mellitus. World J Diabetes. 7:354–395.
2016. View Article : Google Scholar : PubMed/NCBI
|
|
8
|
Ortiz-Martinez M, Gonzalez-Gonzalez M,
Martagon AJ, Hlavinka V, Willson RC and Rito-Palomares M: Recent
developments in biomarkers for diagnosis and screening of type 2
diabetes Mellitus. Curr Diab Rep. 22:95–115. 2022. View Article : Google Scholar : PubMed/NCBI
|
|
9
|
Rovira-Llopis S, Banuls C, Diaz-Morales N,
Hernandez-Mijares A, Rocha M and Victor VM: Mitochondrial dynamics
in type 2 diabetes: Pathophysiological implications. Redox Biol.
11:637–645. 2017. View Article : Google Scholar : PubMed/NCBI
|
|
10
|
Baker ZN, Forny P and Pagliarini DJ:
Mitochondrial proteome research: The road ahead. Nat Rev Mol Cell
Biol. 25:65–82. 2024. View Article : Google Scholar : PubMed/NCBI
|
|
11
|
Miwa S, Kashyap S, Chini E and von
Zglinicki T: Mitochondrial dysfunction in cell senescence and
aging. J Clin Invest. 132:2022. View Article : Google Scholar : PubMed/NCBI
|
|
12
|
Pinti MV, Fink GK, Hathaway QA, Durr AJ,
Kunovac A and Hollander JM: Mitochondrial dysfunction in type 2
diabetes mellitus: An Organ-based analysis. Am J Physiol Endocrinol
Metab. 316:E268–E285. 2019. View Article : Google Scholar : PubMed/NCBI
|
|
13
|
Palma FR, Gantner BN, Sakiyama MJ, Kayzuka
C, Shukla S, Lacchini R, Cunniff B and Bonini MG: ROS production by
mitochondria: Function or dysfunction? Oncogene. 43:295–303. 2024.
View Article : Google Scholar : PubMed/NCBI
|
|
14
|
Apostolova N, Vezza T, Muntane J, Rocha M
and Victor VM: Mitochondrial dysfunction and mitophagy in type 2
diabetes: Pathophysiology and therapeutic targets. Antioxid Redox
Signal. 39:278–320. 2023. View Article : Google Scholar : PubMed/NCBI
|
|
15
|
Shan Z, Fa WH, Tian CR, Yuan CS and Jie N:
Mitophagy and mitochondrial dynamics in type 2 diabetes mellitus
treatment. Aging (Albany NY). 14:2902–2919. 2022. View Article : Google Scholar : PubMed/NCBI
|
|
16
|
Shen S, Liao Q, Wong YK, Chen X, Yang C,
Xu C, Sun J and Wang J: The role of melatonin in the treatment of
type 2 diabetes mellitus and Alzheimer's disease. Int J Biol Sci.
18:983–994. 2022. View Article : Google Scholar : PubMed/NCBI
|
|
17
|
Luo M, Zhao F, Cheng H, Su M and Wang Y:
Macrophage polarization: An important role in inflammatory
diseases. Front Immunol. 15:13529462024. View Article : Google Scholar : PubMed/NCBI
|
|
18
|
Langfelder P and Horvath S: WGCNA: An R
package for weighted correlation network analysis. BMC
Bioinformatics. 9:5592008. View Article : Google Scholar : PubMed/NCBI
|
|
19
|
Xie W, Li J, Du H and Xia J: Causal
relationship between PCSK9 inhibitor and autoimmune diseases: A
drug target Mendelian randomization study. Arthritis Res Ther.
25:1482023. View Article : Google Scholar : PubMed/NCBI
|
|
20
|
Hemani G, Zheng J, Elsworth B, Wade KH,
Haberland V, Baird D, Laurin C, Burgess S, Bowden J, Langdon R, et
al: The MR-Base platform supports systematic causal inference
across the human phenome. Elife. 7:e344082018. View Article : Google Scholar : PubMed/NCBI
|
|
21
|
Yang S, Guo J, Kong Z, Deng M, Da J, Lin
X, Peng S, Fu J, Luo T, Ma J, et al: Causal effects of gut
microbiota on sepsis and sepsis-related death: Insights from
genome-wide Mendelian randomization, single-cell RNA, bulk RNA
sequencing and network pharmacology. J Transl Med. 22:102024.
View Article : Google Scholar : PubMed/NCBI
|
|
22
|
Livak KJ and Schmittgen TD: Analysis of
relative gene expression data using real-time quantitative PCR and
the 2(−Delta Delta C(T)) method. Methods. 25:402–408. 2001.
View Article : Google Scholar : PubMed/NCBI
|
|
23
|
Shen B, Liu J, Wu D and Guo J: Evaluation
of the safety and efficacy of high-dose rate brachytherapy for
radiorecurrent prostate cancer: Asystematic review and
meta-analysis. Strahlenther Onkol. 200:655–670. 2024. View Article : Google Scholar : PubMed/NCBI
|
|
24
|
Namazi N, Moghaddam SS, Esmaeili S,
Peimani M, Tehrani YS, Bandarian F, Shobeiri P, Nasli-Esfahani E,
Malekpour MR, Rezaei N, et al: Burden of type 2 diabetes mellitus
and its risk factors in North Africa and the Middle East,
1990–2019: findings from the Global Burden of Disease study 2019.
BMC Public Health. 24:982024. View Article : Google Scholar : PubMed/NCBI
|
|
25
|
Huang X, He Y, Xu H, Shen Y, Pan X, Wu J
and Chen K: Association between sociodemographic status and the
T2DM-related risks in China: Implication for reducing T2DM disease
burden. Front Public Health. 11:12972032023. View Article : Google Scholar : PubMed/NCBI
|
|
26
|
Herman WH: Are There Clinical implications
of racial differences in HbA1c? Yes, to not consider can do great
harm! Diabetes Care. 39:1458–1461. 2016.PubMed/NCBI
|
|
27
|
Alidrisi HA, Al-Ibadi AA, Al-Saidi JS,
Alsawad MA, Jameel AA and Al-Shati AW: Comparative analysis of
glycemic and lipid profiles in newly diagnosed males and females
with type 2 diabetes mellitus. Cureus. 15:e501012023.PubMed/NCBI
|
|
28
|
Parrinello CM and Selvin E: Beyond HbA1c
and glucose: The role of nontraditional glycemic markers in
diabetes diagnosis, prognosis and management. Curr Diab Rep.
14:5482014. View Article : Google Scholar : PubMed/NCBI
|
|
29
|
Xu H, Chen R, Hou X, Li N, Han Y and Ji S:
The clinical potential of 1,5-anhydroglucitol as biomarker in
diabetes mellitus. Front Endocrinol (Lausanne). 15:14715772024.
View Article : Google Scholar : PubMed/NCBI
|
|
30
|
Blagov A, Nedosugova L, Kirichenko T,
Sukhorukov V, Melnichenko A and Orekhov A: Mitochondrial
dysfunction as a factor of energy metabolism disorders in type 2
diabetes mellitus. Front Biosci (Schol Ed). 16:52024. View Article : Google Scholar : PubMed/NCBI
|
|
31
|
Gao X, Yu X, Zhang C, Wang Y, Sun Y, Sun
H, Zhang H, Shi Y and He X: Telomeres and mitochondrial metabolism:
Implications for cellular senescence and Age-related diseases. Stem
Cell Rev Rep. 18:2315–2327. 2022. View Article : Google Scholar : PubMed/NCBI
|
|
32
|
Mattorre B, Caristi S, Donato S, Volpe E,
Faiella M, Paiardini A, Sorrentino R and Paladini F: A Short ERAP2
that binds IRAP is expressed in macrophages independently of gene
variation. Int J Mol Sci. 23:49612022. View Article : Google Scholar : PubMed/NCBI
|
|
33
|
Liu Q, Hao T, Li L, Huang D, Lin Z, Fang
Y, Wang D and Zhang X: Construction of a mitochondrial dysfunction
related signature of diagnosed model to obstructive sleep apnea.
Front Genet. 13:10566912022. View Article : Google Scholar : PubMed/NCBI
|
|
34
|
Anderson K, Carey B, Martin A, Roark C,
Chalk C, Nowell-Bostic M, Freed B, Aubrey M, Trapnell B and
Fontenot A: Pulmonary alveolar proteinosis: An autoimmune disease
lacking an HLA association. PLoS One. 14:e02131792019. View Article : Google Scholar : PubMed/NCBI
|
|
35
|
Qiu YH, Deng FY, Tang ZX, Jiang ZH and Lei
SF: Functional relevance for type 1 diabetes Mellitus-associated
genetic variants by using integrative analyses. Hum Immunol.
76:753–758. 2015. View Article : Google Scholar : PubMed/NCBI
|
|
36
|
Ma ZJ, Sun P, Guo G, Zhang R and Chen LM:
Association of the HLA-DQA1 and HLA-DQB1 alleles in type 2 diabetes
mellitus and diabetic nephropathy in the han ethnicity of China. J
Diabetes Res. 2013:4525372013. View Article : Google Scholar : PubMed/NCBI
|
|
37
|
Inoue H, Kanda T, Hayashi G, Munenaga R,
Yoshida M, Hasegawa K, Miyagawa T, Kurumada Y, Hasegawa J, Wada T,
et al: A MAP1B-cortactin-Tks5 axis regulates TNBC invasion and
tumorigenesis. J Cell Biol. 223:e2023031022024. View Article : Google Scholar : PubMed/NCBI
|
|
38
|
Hatta T, Iemura SI, Ohishi T, Nakayama H,
Seimiya H, Yasuda T, Iizuka K, Fukuda M, Takeda J, Natsume T and
Horikawa Y: Calpain-10 regulates actin dynamics by proteolysis of
microtubule-associated protein 1B. Sci Rep. 8:167562018. View Article : Google Scholar : PubMed/NCBI
|
|
39
|
Li XY, Hou L, Zhang LY, Zhang L, Wang D,
Wang Z, Wen MZ and Yang XT: OAS3 is a Co-immune biomarker
associated with tumour microenvironment, disease staging, prognosis
and treatment response in multiple cancer types. Front Cell Dev
Biol. 10:8154802022. View Article : Google Scholar : PubMed/NCBI
|
|
40
|
Wu C, Chen X, Shu J and Lee CT:
Whole-genome expression analyses of type 2 diabetes in human skin
reveal altered immune function and burden of infection. Oncotarget.
8:34601–34609. 2017. View Article : Google Scholar : PubMed/NCBI
|
|
41
|
Potenza MA, Sgarra L, Desantis V, Nacci C
and Montagnani M: Diabetes and Alzheimer's Disease: Might
mitochondrial dysfunction help deciphering the common path?
Antioxidants (Basel). 10:12572021. View Article : Google Scholar : PubMed/NCBI
|
|
42
|
Turnbull DM, Bone AJ, Tames FJ, Wilson L,
Baird JD and Sherratt HS: The effect of valproate on blood
metabolite concentrations in spontaneously diabetic, ketoacidotic,
BB/E Wistar rats. Diabetes Res. 2:45–48. 1985.PubMed/NCBI
|
|
43
|
Kuretu A, Arineitwe C, Mothibe M, Ngubane
P, Khathi A and Sibiya N: Drug-induced mitochondrial toxicity:
Risks of developing glucose handling impairments. Front Endocrinol
(Lausanne). 14:11239282023. View Article : Google Scholar : PubMed/NCBI
|
|
44
|
Stakisaitis D, Kapocius L, Kilimaite E,
Gečys D, Šlekienė L, Balnytė I, Palubinskienė J and Lesauskaitė V:
Preclinical study in mouse thymus and thymocytes: Effects of
treatment with a combination of sodium dichloroacetate and sodium
valproate on infectious inflammation pathways. Pharmaceutics.
15:27152023. View Article : Google Scholar : PubMed/NCBI
|
|
45
|
Khan S and Jena G: Valproic acid improves
glucose homeostasis by increasing beta-cell proliferation, function
and reducing its apoptosis through HDAC inhibition in juvenile
diabetic rat. J Biochem Mol Toxicol. 30:438–446. 2016. View Article : Google Scholar : PubMed/NCBI
|
|
46
|
Cicek NP, Kamasak T, Serin M, Okten A,
Alver A and Cansu A: The effects of valproate and topiramate use on
serum insulin, leptin, neuropeptide Y and ghrelin levels in
epileptic children. Seizure. 58:90–95. 2018. View Article : Google Scholar : PubMed/NCBI
|
|
47
|
Tien N, Wu TY, Lin CL, Chu FY, Wang CCN,
Hsu CY, Tsai FJ, Fang YJ and Lim YP: Association of epilepsy,
anti-epileptic drugs (AEDs) and type 2 diabetes mellitus (T2DM): A
population-based cohort retrospective study, impact of AEDs on
T2DM-related molecular pathway and via peroxisome
proliferator-activated receptor gamma transactivation. Front
Endocrinol (Lausanne). 14:11569522023. View Article : Google Scholar : PubMed/NCBI
|
|
48
|
Daryabor G, Atashzar MR, Kabelitz D, Meri
S and Kalantar K: The effects of type 2 diabetes mellitus on organ
metabolism and the immune system. Front Immunol. 11:15822020.
View Article : Google Scholar : PubMed/NCBI
|
|
49
|
Painter JD and Akbari O: Type 2 innate
lymphoid cells: Protectors in type 2 Diabetes. Front Immunol.
12:7270082021. View Article : Google Scholar : PubMed/NCBI
|
|
50
|
Song Y, He C, Jiang Y, Yang M, Xu Z, Yuan
L, Zhang W and Xu Y: Bulk and single-cell transcriptome analyses of
islet tissue unravel gene signatures associated with pyroptosis and
immune infiltration in type 2 diabetes. Front Endocrinol
(Lausanne). 14:11321942023. View Article : Google Scholar : PubMed/NCBI
|
|
51
|
Zhang S, Gang X, Yang S, Cui M, Sun L, Li
Z and Wang G: The alterations in and the role of the Th17/Treg
balance in metabolic diseases. Front Immunol. 12:6783552021.
View Article : Google Scholar : PubMed/NCBI
|
|
52
|
Xia C, Rao X and Zhong J: Role of T
lymphocytes in type 2 diabetes and diabetes-associated
inflammation. J Diabetes Res. 2017:64947952017. View Article : Google Scholar : PubMed/NCBI
|
|
53
|
Sun Q, Yang P, Gu QW, Gu WS, Wang W, Wang
J and Mao XM: Increased glycemic variability results in abnormal
differentiation of T cell subpopulation in type 2 diabetes
patients. J Diabetes Complications. 38:1087382024. View Article : Google Scholar : PubMed/NCBI
|
|
54
|
Abdel-Moneim A, Bakery HH and Allam G: The
potential pathogenic role of IL-17/Th17 cells in both type 1 and
type 2 diabetes mellitus. Biomed Pharmacother. 101:287–292. 2018.
View Article : Google Scholar : PubMed/NCBI
|
|
55
|
Wang C and Zhou B: Associations of blood
glucose, helper T cells and cytokine levels with degree of
periodontal lesion in type 2 diabetes mellitus patients accompanied
by chronic periodontitis. Afr Health Sci. 23:239–245. 2023.
View Article : Google Scholar : PubMed/NCBI
|
|
56
|
Ju SH, Lim JY, Song M, Kim JM, Kang YE, Yi
HS, Joung KH, Lee JH, Kim HJ and Ku BJ: Distinct effects of
rosuvastatin and rosuvastatin/ezetimibe on senescence markers of
CD8+ T cells in patients with type 2 diabetes mellitus: A
randomized controlled trial. Front Endocrinol (Lausanne).
15:13363572024. View Article : Google Scholar : PubMed/NCBI
|
|
57
|
Ju SH and Ku BJ: Effects of
rosuvastatin/ezetimibe on senescence of CD8+ T-cell in type 2
diabetic patients with hypercholesterolemia: A study protocol.
Medicine (Baltimore). 101:e316912022. View Article : Google Scholar : PubMed/NCBI
|
|
58
|
Osawa Y, Studenski SA and Ferrucci L: Knee
extension rate of velocity development affects walking performance
differently in men and women. Exp Gerontol. 112:63–67. 2018.
View Article : Google Scholar : PubMed/NCBI
|
|
59
|
Gao D, Jiao J, Wang Z, Huang X, Ni X, Fang
S, Zhou Q, Zhu X, Sun L, Yang Z and Yuan H: The roles of cell-cell
and organ-organ crosstalk in the type 2 diabetes mellitus
associated inflammatory microenvironment. Cytokine Growth Factor
Rev. 66:15–25. 2022. View Article : Google Scholar : PubMed/NCBI
|
|
60
|
Lee MK, Ryu H, Van JY, Kim MJ, Jeong HH,
Jung WK, Jun JY and Lee B: The role of macrophage populations in
skeletal muscle insulin sensitivity: Current understanding and
implications. Int J Mol Sci. 24:114672023. View Article : Google Scholar : PubMed/NCBI
|
|
61
|
Pivari F, Mingione A, Brasacchio C and
Soldati L: Curcumin and Type 2 Diabetes Mellitus: Prevention and
Treatment. Nutrients. 11:18372019. View Article : Google Scholar : PubMed/NCBI
|
|
62
|
Banu S and Sur D: Role of macrophage in
type 2 diabetes mellitus: macrophage polarization a new paradigm
for treatment of type 2 diabetes mellitus. Endocr Metab Immune
Disord Drug Targets. 23:2–11. 2023. View Article : Google Scholar : PubMed/NCBI
|
|
63
|
Schachinger E, Chanda G, Lobo RP, Naito M
and Pronin AV: Eliashberg analysis of the optical conductivity in
superconducting Pr2CuOx with × ≃ 4. J Phys Condens Matter.
27:0457022015. View Article : Google Scholar : PubMed/NCBI
|
|
64
|
Zhang JA, Zhou XY, Huang D, Luan C, Gu H,
Ju M and Chen K: Development of an Immune-related gene signature
for prognosis in melanoma. Front Oncol. 10:6025552020. View Article : Google Scholar : PubMed/NCBI
|
|
65
|
O'Brien CL, Summers KM, Martin NM,
Carter-Cusack D, Yang Y, Barua R, Dixit OVA, Hume DA and Pavli P:
The relationship between extreme inter-individual variation in
macrophage gene expression and genetic susceptibility to
inflammatory bowel disease. Hum Genet. 143:233–261. 2024.
View Article : Google Scholar : PubMed/NCBI
|
|
66
|
Lyu X, Qiang Y, Zhang B, Xu W, Cui Y and
Ma L: Identification of immuno-infiltrating MAP1A as a
prognosis-related biomarker for bladder cancer and its ceRNA
network construction. Front Oncol. 12:10165422022. View Article : Google Scholar : PubMed/NCBI
|
|
67
|
Monti A, Lopez-Serrano J, Prieto A and
Nicasio MC: Broad-scope amination of aryl sulfamates catalyzed by a
palladium phosphine complex. ACS Catal. 13:10945–10952. 2023.
View Article : Google Scholar : PubMed/NCBI
|
|
68
|
Han Y, Liu S, Shi S, Shu Y, Lu C and Gu X:
Screening of genes associated with immune infiltration of discoid
lupus erythematosus based on weighted gene Co-expression network
analysis. Biochem Genet. 63:465–482. 2025. View Article : Google Scholar : PubMed/NCBI
|
|
69
|
Khalid M, Alkaabi J, Khan MAB and Adem A:
Insulin signal transduction perturbations in insulin resistance.
Int J Mol Sci. 22:85902021. View Article : Google Scholar : PubMed/NCBI
|