Introduction
Liver cancer ranks as the third most prevalent cause
of tumor-related mortality in the Asia-Pacific regions, with over
half of the cases originating in China (1). Individuals with advanced liver cancer
typically undergo various systemic treatment modalities (2). Over recent decades, remarkable
strides have been made in managing intermediate and advanced-stage
liver cancer, primarily due to advancements in targeted
chemotherapy and immunotherapy (3). These breakthroughs have markedly
improved overall survival rates and the quality of life for
affected individuals. The majority of FDA-approved drugs for liver
cancer are tyrosine kinase inhibitors (TKIs), such as sorafenib,
lenvatinib, regorafenib, cabozantinib and ramucirumab (4). This preference is due to the pivotal
role of tyrosine kinases in governing diverse biological processes
such as growth, differentiation, adhesion, motility, metabolism and
apoptosis in both normal and cancer cells (5,6).
However, a significant drawback of TKIs is their propensity for
acquired resistance (7,8), underscoring the critical need for
novel-generation TKIs to provide second and third-line therapeutic
options for patients with liver cancer.
In the present study, the TKI lead compound
PD161570, a fibroblast growth factor receptor inhibitor,
demonstrated a dose- and time-dependent inhibition of liver cancer
cell viability. Subsequent investigations showed that PD161570
induced autophagy-related gene (ATG5)-dependent autophagic flux in
hepatoma cells. RNA sequencing (RNA-seq) analyses and subsequent
validation experiments confirmed PD161570′s ability to initiate
apoptotic cell death through pathway under conditions of autophagy
inhibition. These findings underscore the importance of further
investigations to assess the potential of this novel TKI as a
therapeutic agent for liver cancer treatment.
Materials and methods
Antibodies and reagents
PD161570 and chloroquine (CQ; cat. no. C6628) were
acquired from MilliporeSigma. The antibody against p62 (cat. no.
PA5-20839) was supplied by Invitrogen (Thermo Fisher Scientific,
Inc.). Antibodies for the detection of LC3 (cat. no. 12741),
Beclin-1 (cat. no. 3495), phosphorylated (p-)70S6K (Thr389; cat.
no. 9234) and 70S6 (cat. no. 9202), cleaved poly (ADP-ribose)
polymerase (PARP; cat. no. 5625) and PARP (cat. no. 9542) were
procured from Cell Signaling Technology Inc. and the antibody for
β-actin (cat. no. sc-69879) was sourced from Santa Cruz
Biotechnology, Inc. Additional items included mouse Anti-β-Actin
(cat. no. HC201; TransGen Biotech Co., Ltd.), rabbit Anti ATG5
(cat. no. ab108327, Abcam), BCA Protein Quantification Kit,
TRIzol® reagent (Invitrogen; Thermo Fisher Scientific,
Inc.), Ultrapure RNA/miRNA Extraction Kit (Thermo Fisher
Scientific, Inc.), CCK-8 Assay Cell Proliferation Detection Kit
(cat. no. KGA317;Nanjing KGI Biological Technology Development Co.,
Ltd.), ECL Ultra-sensitive Luminescent Solution (Thermo Fisher
Scientific, Inc.) and Annexin V-FITC/PI Apoptosis Detection Kit
(cat. no. C1062S; Beyotime Institute of Biotechnology).
Cell culture
HepG2 or Huh7 cells, free of mycoplasma, were
purchased from Guangzhou Kinlogix Biotech Co., Ltd., which were
genotypically verified using short tandem repeat analysis profiling
by the vendor. The cells were cultured in 25 cm2 flasks
using Dulbecco's modified Eagle's medium (Invitrogen; Thermo Fisher
Scientific, Inc.) supplemented with 10% (v/v) fetal bovine serum
(FBS; Invitrogen; Thermo Fisher Scientific, Inc.), 100 IU/ml
penicillin (Invitrogen; Thermo Fisher Scientific, Inc.) and 100
µg/ml streptomycin (Invitrogen; Thermo Fisher Scientific, Inc.).
The cells were maintained at 37°C in a humidified incubator with 5%
CO2, undergoing a 1:2 splitting every 2 to 3 days.
Small molecule compound libraries
A total of 3,271 small molecule compounds were
sourced from the Prestwick Chemical Library containing 1,200
compounds, Tocriscreen plus (cat. no. 5840; Tocris Bioscience) with
1,119 compounds and SelleckChem Bioactive Compound Library-I (cat.
no. L1700; Selleck Chemicals) comprising 952 compounds. These
compounds have been extensively used for screening due to their
established biological and pharmacological properties, validated
safety profiles and proven efficacy in (pre-)clinical trials.
High-throughput screening (HTS)
The HepG2 and Huh7 cells were seeded into 384-well
flat bottom microtiter plates (cat. no. 353962; Becton, Dickinson
and Company), with 800 cells in 50 µl medium per well using
Multidrop Combi Reagent Dispenser (Thermo Fisher Scientific, Inc.).
In total 3,271 small molecules at the final concentration of 10 µM
were separately transferred to the corresponding wells using an
Echo555 dispenser (Labcyte; Beckman Coulter, Inc.). After 48 h
incubation, cells were fixed by 4% paraformaldehyde solution at
room temperature for 10 min, stained with Hoechst with a final
concentration of 1 µg/ml for 15 min at room temperature and finally
subjected to automated image acquisition and nuclei counting by
Acumen Cellista Laser Scanning Imaging Cytometer (TTP Labtech,
Ltd.). Hit compounds were selected based on the nuclei counting
assay in both liver cancer lines. The number of liver cancer cells
in each plate was visualized through heatmaps produced by built-in
Cellista software version 1.0 (TTP Labtech, Ltd.). Darker shades
denoted lower cell counts, while greener shades indicated higher
cell counts.
Hit selection
In the screening, where each compound underwent a
single measurement, the Z score was used for hit identification.
This approach is suitable for screens lacking replicates, assuming
a normal distribution of measured values for all compounds under
test on each plate. To calculate the Z score, the standard
deviation of each plate was estimated from the median absolute
deviation of the nuclei number across all tested 384-well plates.
The Z score was calculated using the population mean and population
standard deviation as Z=(x-µ)/σ, where × represents the measurement
of each compound under test, µ denotes the mean of the population
and σ signifies the standard deviation of the population. A Z score
threshold of −1.5 was chosen to robustly pinpoint liver
cancer-killing compounds, mitigating false positives. This
threshold corresponds to a 99.93% probability for a compound
identified as a true hit.
Drug treatment
PD161570 was dissolved in DMSO to prepare a stock
concentration of 10 mM and CQ was dissolved in DMSO to prepare a
stock concentration of 20 mM; stock solutions were aliquoted and
stored at −20°C. The liver cancer cells were seeded in 6-well
plates at a density of 2×10⁵ cells/well and were allowed
to adhere overnight. Subsequently, the culture medium was replaced
with fresh medium containing 10 µM PD161570 and 20 µM CQ, and the
cells were incubated for 24 h at 37°C in a humidified atmosphere
containing 5% CO2.
Cell Counting Kit (CCK-8) assay
Cells were cultured in 96-well plates and incubated
for 24 h following their respective treatments. The medium was then
replaced with fresh medium and 10 µl of CCK-8 reagent (cat. no.
KGA317; Nanjing KeyGen Biotech Co., Ltd.) was added to each well.
The plates were incubated at 37°C for 2–4 h. Finally, absorbance at
450 nm was measured using a microplate reader (SuPerMax3100;
Shanghai Flash Spectrum Biological Technology Co., Ltd.) for each
well to assess cell viability.
Flow cytometry
Cells from each treatment group, totaling
1×10⁶, were harvested and centrifuged at 300 × g and
room temperature for 3 min. The cells were washed twice with PBS
and resuspended in 300 µl of pre-cooled 1XAnnexin V-FITC conjugate
using the Annexin V-FITC/PI Apoptosis Detection Kit (cat. no.
C1065S; Beyotime Institute of Biotechnology). Next, 5 µl of Annexin
V-FITC and 10 µl of propidium iodide (PI) were added per well and
after gentle mixing, the cells were incubated with the reagents at
room temperature in darkness for 10 min and immediately analyzed by
flow cytometry (FACSAria; BD Biosciences). The data were analyzed
using BD FACSDiva™ Software v8.0 (BD Biosciences). The total
apoptotic rate was calculated as the sum of the percentages of
early (Annexin V-positive/PI-negative cells) and late (Annexin
V-positive/PI-positive cells) apoptotic cells.
Cell transfection
When HepG2 cell density reached ~70%, indicating
readiness for transfection, cells were cultured in serum-free
medium. For transfection preparation, two sterilized Eppendorf
tubes were used, with 125 µl of Opti-MEM (Invitrogen; Thermo Fisher
Scientific, Inc.) added to each. Then, 5 µl of
Lipofectamine® 3000 (Invitrogen; Thermo Fisher
Scientific, Inc.) was added to one tube and 10 µl Atg5 siRNA or
negative control siRNA at a concentration of 50 nM (previously
dissolved in DEPC water at 100 µl/OD) to the other. The contents of
both tubes were mixed thoroughly and incubated at 4°C for 5 min.
The contents of the two tubes were then combined, mixed again and
incubated at room temperature for 15 min. The resulting mixture was
added dropwise to the corresponding wells of a six-well plate and
the cells were returned to the incubator. After 4 h, 1 ml of
complete medium containing 20% serum was added to each well.
Subsequent experiments were continued after an additional 48 h of
incubation. The following sequences were synthesized by General
Biology (Anhui) Co Ltd.: ATG5 siRNA,
5′-GGAAUAUCCUGCAGAAGAAdTdT-3′ (sense) and
5′-UUCUUCUGCAGGAUAUUCCdTdT-3′ (antisense); negative control siRNA,
sense: 5′-UUCUCCGAACGUGUCACGUdTdT-3′ (sense) and
5′-ACGUGACACGUUCGGAGAAdTdT-3′ (antisense).
Reverse transcription-quantitative PCR
(RT-qPCR)
When the cell density reached 75–85%, total cellular
RNA was extracted using TRIzol™ Plus RNA Purification Kit (cat. no.
12183555; Invitrogen; Thermo Fisher Scientific, Inc.) according to
the manufacturer's protocols. The concentration and purity of mRNA
were assessed (OD260/OD280 ratio) using a UV-visible
spectrophotometer (NP80 NanoPhotometer; Implen GmbH). For RT of RNA
into cDNA, the High Capacity cDNA RT Kit (cat. no. 4368814; Applied
Biosystems; Thermo Fisher Scientific, Inc.) was used according to
the manufacturer's protocol. Briefly, after the removal of genomic
DNA and determination of total RNA concentration, 1 pg-1 µg total
RNA and 4 µl 4X gDNA wiper Mix were gently mixed in an RNase-free
PCR tube with RNase-free ddH2O to 16-µl total volume. RT
was achieved via incubation at 42°C for 30 min. Subsequently, the
mRNA levels were quantified using SYBR Green PCR master mix
(Shanghai Yeasen Biotechnology Co., Ltd.) on a fluorescence PCR
instrument (CFX Connect; Bio-Rad Laboratories, Inc.). The data were
analyzed with the 2−ΔΔCq method according to the
manufacturer's instructions (9).
The data were normalized to the housekeeping gene ACTB.
Changes in gene expression were illustrated as a fold
increase/decrease. The experiments were repeated three times. Human
primers used in the present study were as follows:
5′-CACAAGCAACTCTGGATGGGA-3′ (Forward) and 5′-CAGCCACAGGACGAAACAG-3′
(reverse) for ATG5; 5′-TCGCCAATTTTCAGGAGTTAGC-3′ (forward)
and 5′-CGCAAGAAACGGCAGAGATG-3′ (reverse) for DRAM1;
5′-TGGCACCCAGCACAATGAA-3′ (forward) and
5′-CTAAGTCATAGTCCGCCTAGAAGCA-3′ (reverse) for ACTB.
Western blotting
Cells were pelleted by centrifugation at 300 × g for
10 min at room temperature and lysed in buffer (cat. no. P0013B;
Beyotime Institute of Biotechnology) containing 50 mM Tris-HCl (pH
7.4), 0.15 M NaCl and 1% Triton X-100 for 30 min on ice. The
lysates were then centrifuged at 15,000 g and 4°C for 15 min. The
BCA Protein Assay Kit (Thermo Fisher Scientific, Inc.) was used for
the colorimetric detection and quantification of total proteins.
Proteins obtained from cell lysates (20–40 µg protein/lane) were
then separated by SDS-PAGE on 10 or 15% gels and transferred onto
PVDF membranes. After blocking with 5% non-fat milk at room
temperature for 2 h, the membranes were incubated with primary
antibodies overnight at 4°C and with secondary antibodies for 2 h
at room temperature. The dilution for primary antibodies against
p62, LC3, Beclin-1, ATG5, anti-p-70S6K (Thr389) and cleaved-PARP
was 1:1,000, while 1:2,000 for β-actin. The dilution for HRP-linked
secondary antibodies (cat. no. 7074; CST) was 1:5,000. Development
was performed using Super Signal West Duration Substrate or Femto
Stable Peroxide Solution (Thermo Scientific, Inc.) and images were
captured with a Bio-Rad CCD camera. Results were analyzed using
Image Lab Software version 5.2.1 (Bio-Rad Laboratories, Inc.).
RNA sequencing
Cellular RNA was extracted after different
treatments using TRIzol Plus RNA Purification Kit. mRNA
quantification for library preparation was conducted using Hieff
NGS™ MaxUp Dual-mode mRNA Library Prep Kit for Illumina®
(cat. no. 12301ES96; Shanghai Yeasen Biotechnology Co., Ltd.) and
Hieff NGS® DNASelection Beads (cat. no. 12601ES56;
Shanghai Yeasen Biotechnology Co., Ltd.). The procedures included
mRNA purification, fragmentation, synthesis and purification of
double-stranded cDNA, followed by the addition of dA tails and
adapter ligation. The quality and concentration of the processed
samples were verified using 2100 Bioanalyzer (Agilent Technologies,
Inc.) and Qubit dsDNA HS Assay (cat. no. Q32851; Invitrogen; Thermo
Fisher Scientific, Inc.) with the Qubit 2.0 Fluorometer (cat. no.
Q32866; Invitrogen; Thermo Fisher Scientific, Inc.), respectively.
Following purification, the double-stranded cDNAs were tagmented,
amplified, quantified and pooled at an equal concentration of 2 nM.
The quality and concentration of libraries were validated using
2100 Bioanalyzer (Agilent Technologies, Inc.) and qPCR (Kapa
Library Quantification Kit; cat. no. KK4854; Roche Diagnostics),
respectively. Subsequently, the libraries were sequenced on a
NovaSeq 6000 sequencer (Illumina, Inc.) using the NovaSeq 6000 S1
Reagent Kit (cat. no. 20012860; Illumina, Inc.) with paired-end
sequencing (150 bp read length). Raw sequencing data were processed
using FastQC v0.12.0 (https://www.bioinformatics.babraham.ac.uk/projects/fastqc/)
for quality control. Gene Ontology (GO) enrichment analysis was
conducted using TopGO v2.58.0 (https://bioconductor.org/packages/release/bioc/html/topGO.html)
to generate significant GO-directed graphs. Additionally, Kyoto
Encyclopedia of Genes and Genomes (KEGG) pathway enrichment
analysis was performed using clusterProfiler v4.15.1 (https://bioconductor.org/packages/devel/bioc/html/clusterProfiler.html).
RNA sequencing and subsequent analyses were carried out by Sangon
Biotech Co., Ltd. following standardized protocols.
Statistical analysis
All cellular experiments were conducted with a
minimum of three biological replicates to ensure reliability. Data
are expressed as mean ± SD and the specific number of experiments
is detailed in the figure legends. Statistical analysis was
performed using SPSS 23 statistics software (IBM Corp.). The t-test
(two-tailed and unpaired) was used to evaluate association with
parametric variables between two independent samples, and one-way
ANOVA with Tukey's post hoc test was employed to account for
multiple comparisons. P<0.05 was considered to indicate a
statistically significant difference.
Results
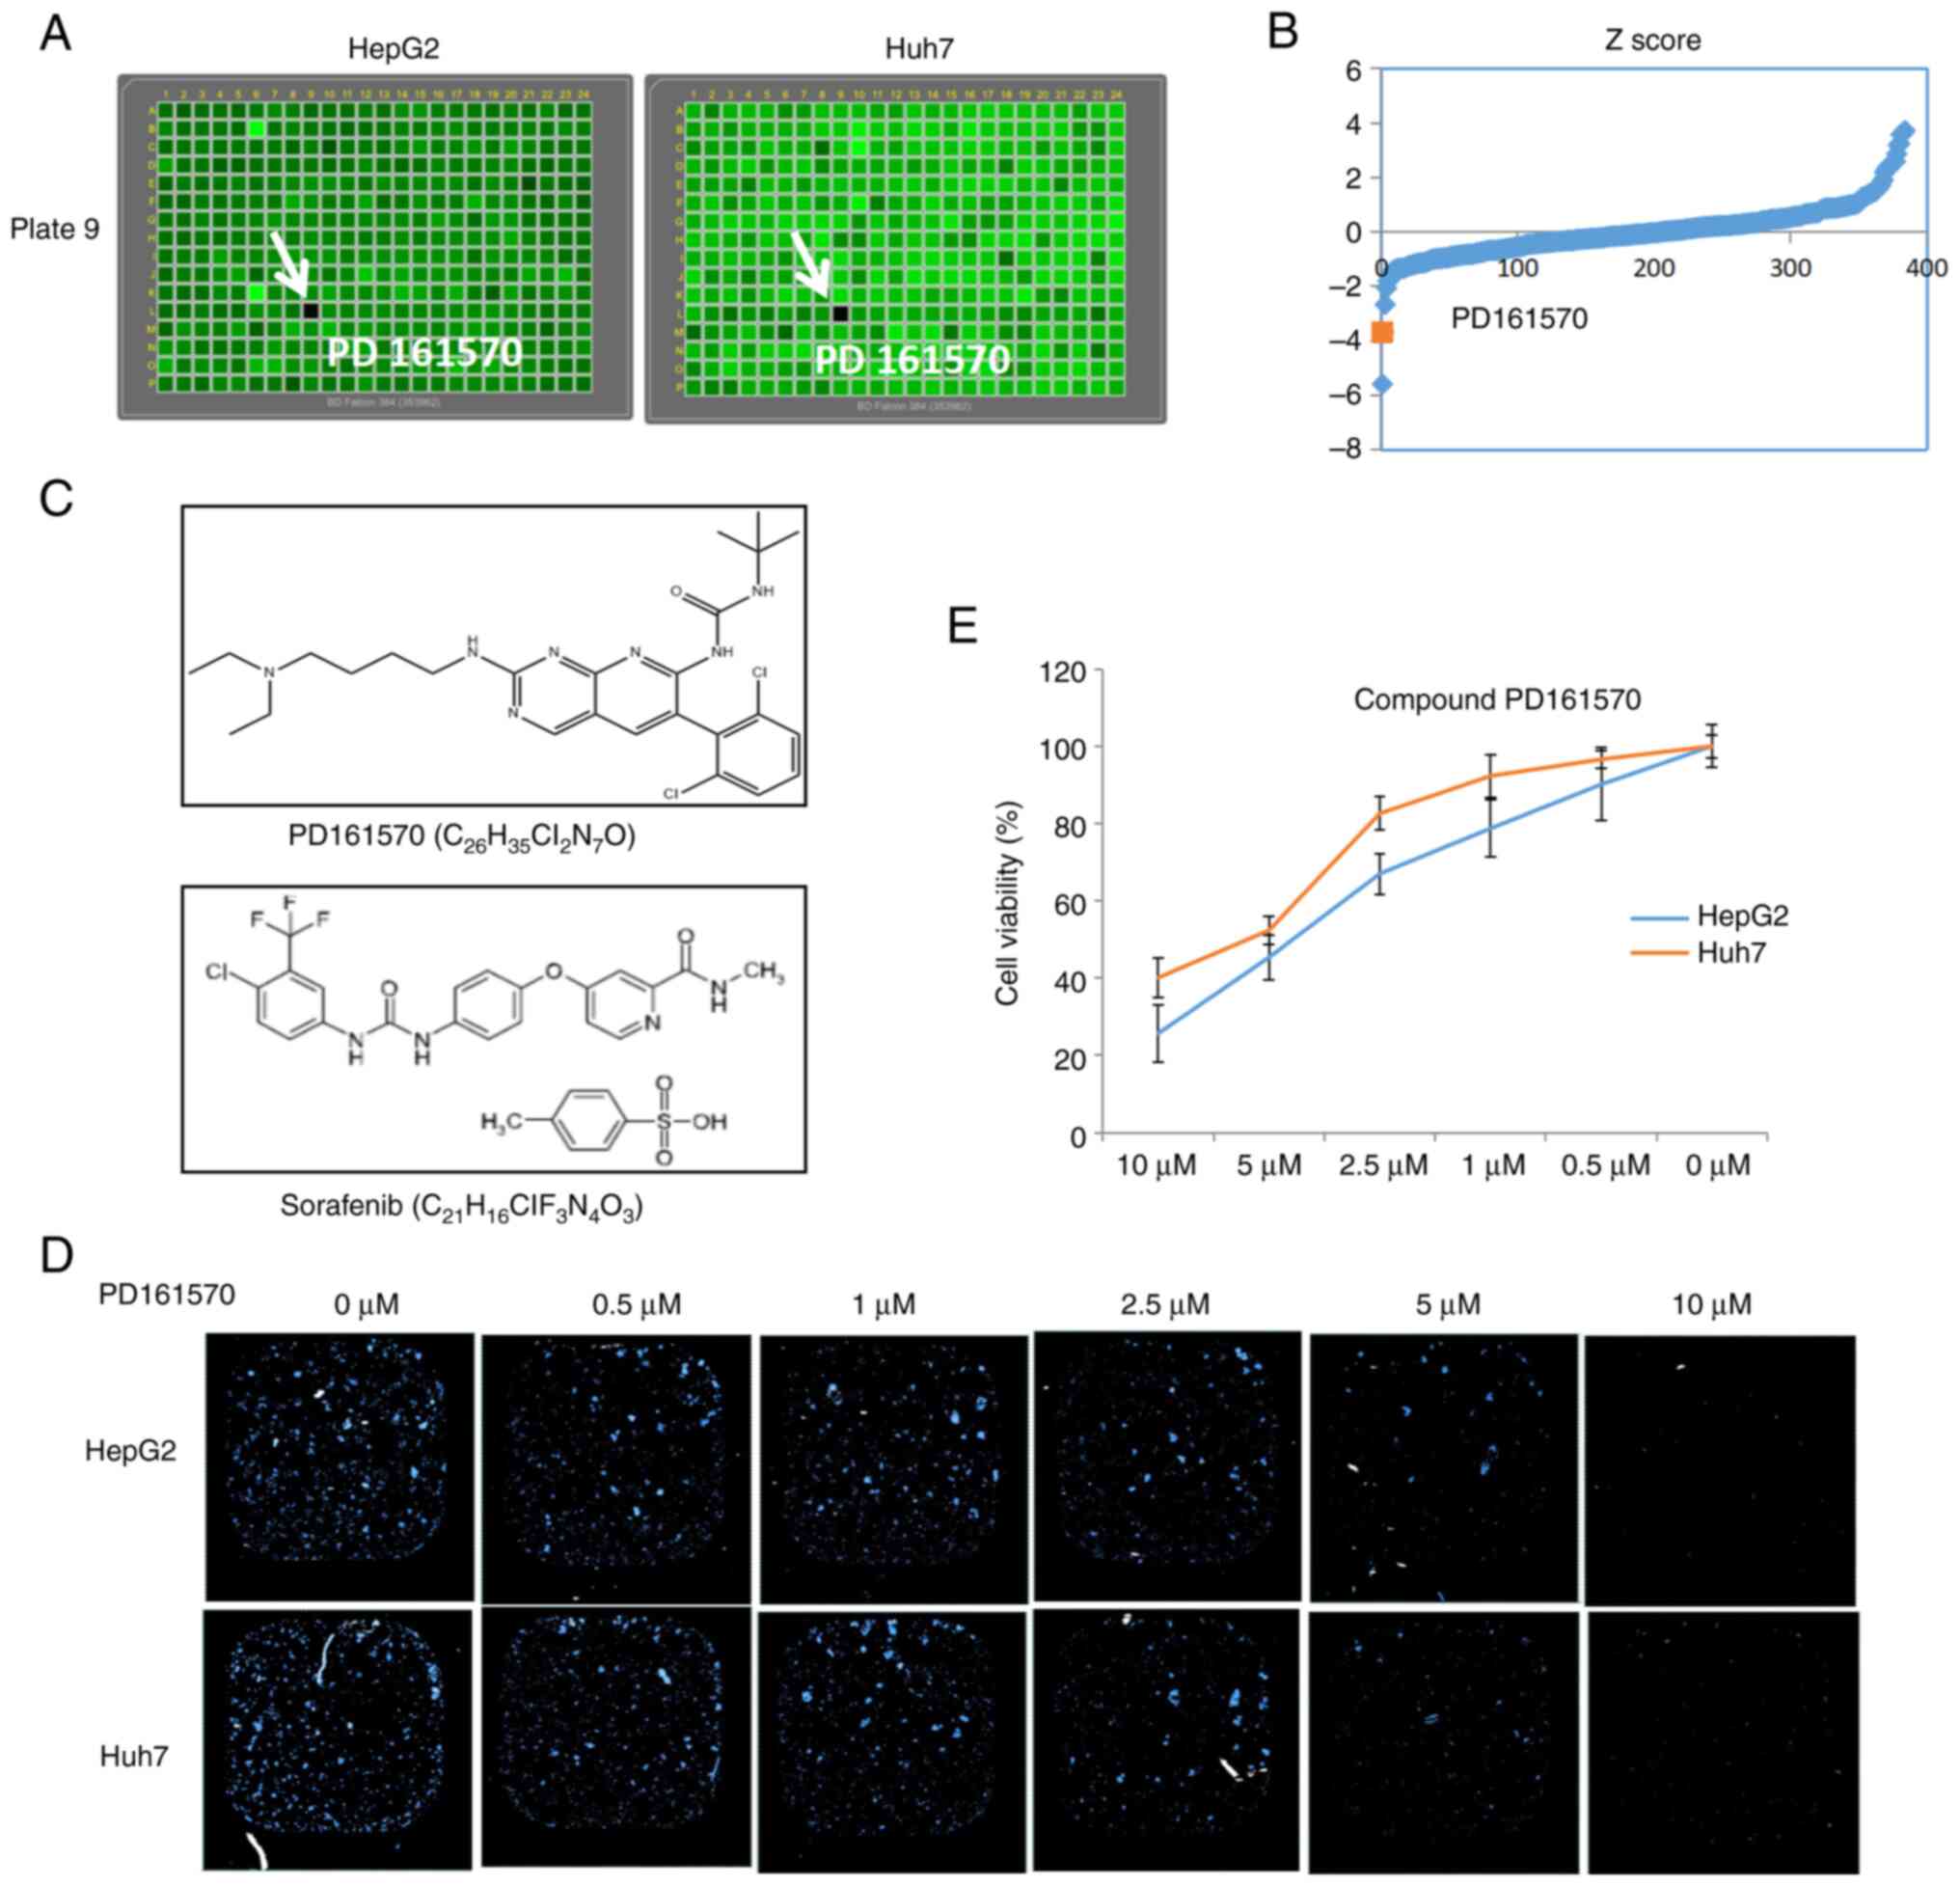
Identification of PD161570 as an
inhibitor of liver cancer cell proliferation
The poorly differentiated liver cancer cell lines,
HepG2 and Huh7, were used to screen three small molecule libraries
(Prestwick, Tocriscreen and SelleckChem Bioactive Compound
Library-I), comprising 3,271 chemical compounds. Initial screening
identified PD161570 as capable of killing both liver cancer cell
lines (Fig. 1A). Screening was
evaluated by calculating Z-scores for each plate to identify
potential hits. As indicated in Fig.
1B, the Z-score of PD161570 fell below −1.5, suggesting its
potential as a potent compound to attenuate liver cancer
proliferation. The molecular structure and formula of PD161570 was
shown in Fig. 1C as comparison
with sorafenib, a TKI as first-line treatment for liver cancer.
Following its identification, PD161570 was subjected to a
dose-response analysis at various concentrations (0–10 µM). Results
from nuclei counting (Fig. 1D) and
the CCK-8 assay (Fig. 1E)
demonstrated a dose-dependent inhibition of liver cancer cell
viability over 48 h. Notably, the inhibitory effect was more
pronounced in HepG2 cells than in Huh7 cells.
PD161570 induces ATG5-dependent and
mTOR-independent autophagy in hepatoma cells
Numerous studies have underscored the vital role of
autophagy in liver cancer pathogenesis (10–13).
Microtubule-associated protein LC3, a mammalian homolog of ATG8, is
frequently used as a specific marker for autophagy activity
(14). LC3 is characterized by two
bands (LC3-I and LC3-II) on immunoblots, with LC3-II being
preferred for its increased sensitivity in detecting autophagy in
mammalian cells (14). Conversely,
p62, which directly interacts with LC3, is essential in
autophagosome formation and autophagic degradation (15,16).
To assess autophagy induction by PD161570 in HepG2 and Huh7 cells,
LC3 and p62 levels were analyzed. An increase in LC3-II levels was
noted in a concentration-dependent manner in cells treated with
PD161570 (Fig. 2A), while p62
expression significantly decreased at concentrations of 5 and 10
µM.
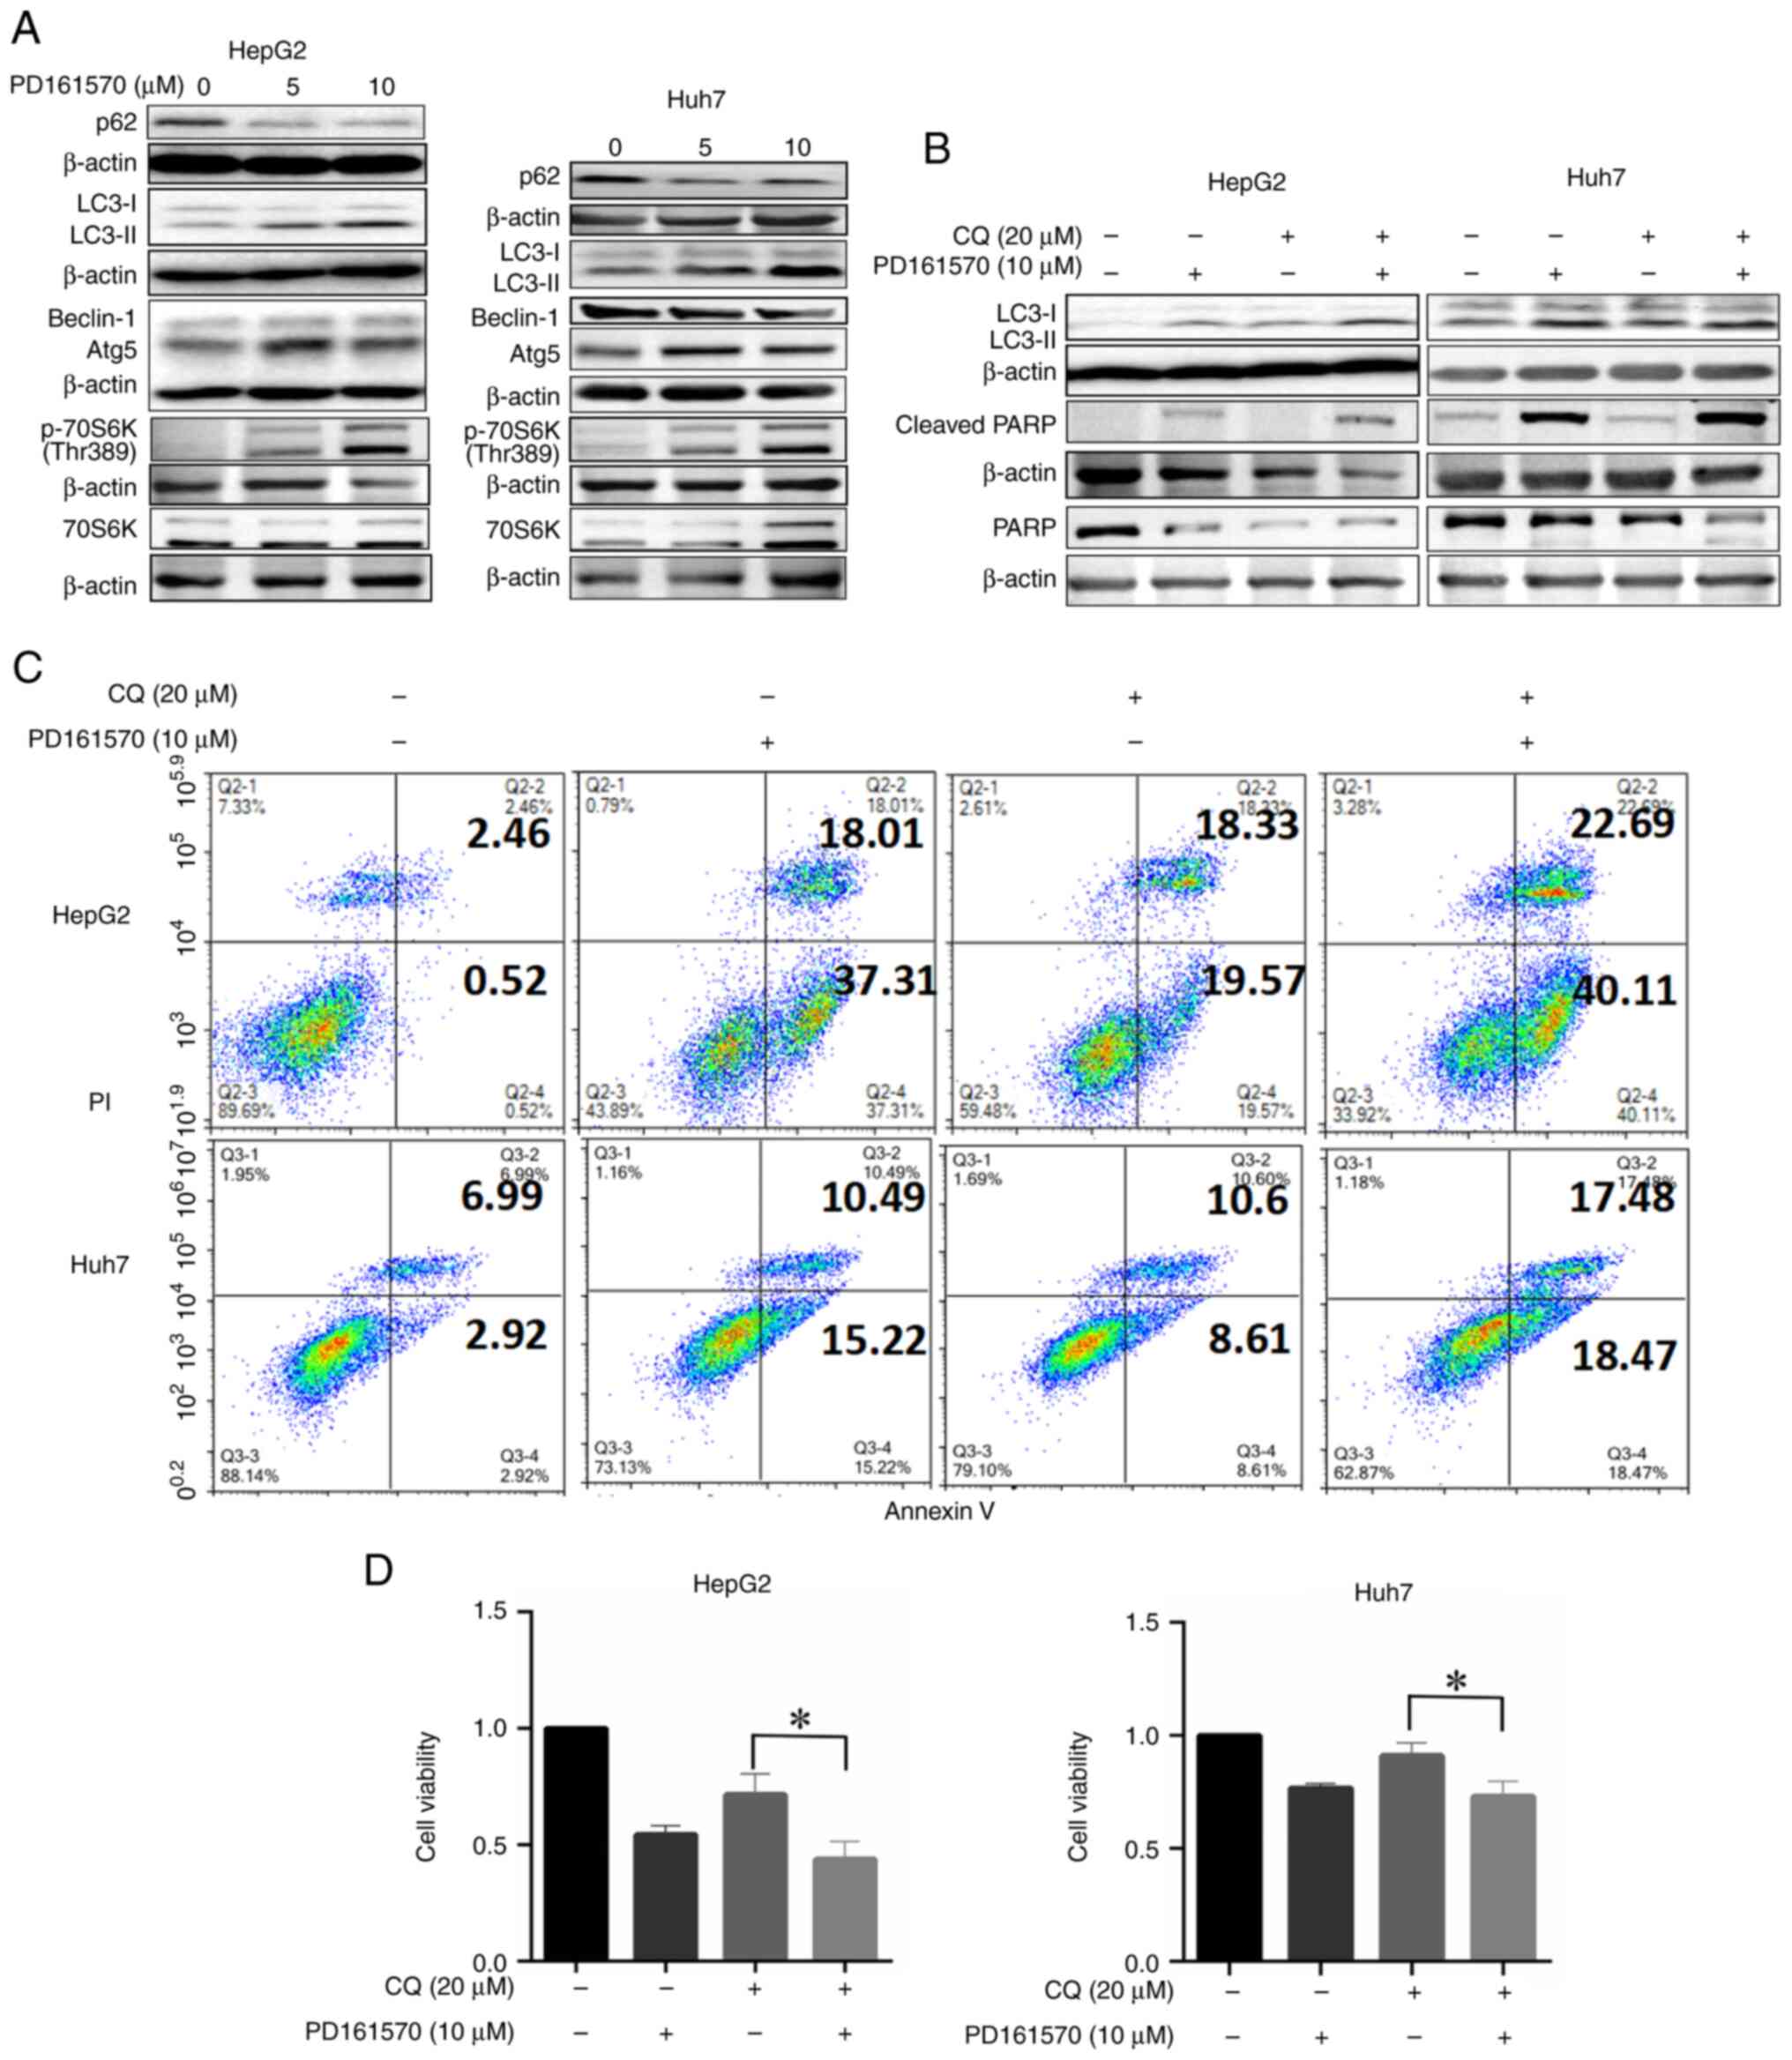 | Figure 2.Treatment with PD161570 in HepG2 and
Huh7 cells induces autophagy, while its combination with CQ
enhances apoptosis. (A) Cell lysates, untreated and treated with
various concentrations of PD161570 for 24 h, were analyzed by
immunoblotting using antibodies against LC3, p62, ATG5, Beclin-1,
70S6k and 70S6K (Thr389). (B) Cell lysates, untreated and treated
with PD161570 plus CQ for 24 h, were subjected to immunoblotting
with antibodies against LC3, PARP and cleaved PARP. β-actin served
as a loading control. Representative blots from three independent
experiments are shown. (C) Apoptosis was assessed through Annexin
V/PI analysis of HepG2 (top panel) and Huh7 (bottom panel) cells
treated with PD161570 and/or CQ. (D) Cell viability, presented as
relative to the control, was measured using a CCK-8 assay in HepG2
(top panel) and Huh7 (bottom panel) cells following treatment with
PD161570 and/or CQ. Cell viability was presented as the mean ± SEM
from three independent experiments, indicating significant
differences between CQ treatment and combined treatment with
PD161570 and CQ (*P<0.05). CQ, chloroquine; ATG5,
autophagy-related gene 5; PARP, poly (ADP-ribose) polymerase. |
ATGs constitute a conserved gene set vital for
autophagy mechanisms (17). In
hepatoma cells treated with PD161570, ATG5 expression was
significantly elevated at both 5 and 10 µM doses compared with
untreated cells, whereas Beclin-1 levels remained stable (Fig. 2A). To explore the association
between PD161570′s effects and autophagic flux, cells were
co-treated with PD161570 and CQ, an inhibitor of autophagosome
degradation commonly used to assess autophagic flux. Co-treatment
with PD161570 (10 µM) and CQ (20 µM) led to a pronounced increase
in LC3-II levels (Figs. 2B and
S1), indicating enhanced
autophagic flux by PD161570 in HepG2 and Huh7 cells. Further
investigation revealed that PD161570-induced autophagy was
modulated independently of mTOR kinase, a critical autophagy
regulator. Significant upregulation of p70S6K phosphorylation at
Thr389, indicative of mTOR activity (18), was observed in PD161570-treated
HepG2 and Huh7 cells compared with untreated cells (Fig. 2B), suggesting that PD161570 induces
autophagy independently of mTOR signaling. These findings suggested
that PD161570 triggers ATG5-dependent and mTOR-independent
autophagy in both liver cancer cell lines.
Autophagy inhibition enhances
PD161570-induced cell death and suppresses cell proliferation
The complex relationship between autophagy and
apoptosis has been established as a key factor in hepatic cell
death and the progression of liver diseases, supported by both
pre-clinical models and clinical trials. The Annexin V-FITC/PI
assay was used to detect changes in cell death, categorizing cells
as viable (Annexin V-/PI-), early apoptotic (Annexin V+/PI-) and
late apoptotic or necrotic (Annexin V+/PI+). To explore the effects
of PD161570 on apoptosis under autophagy inhibition, co-treatment
of PD161570 (10 µM) with CQ (20 µM) was found to enhance apoptosis
and necrosis in both HepG2 and Huh7 cell lines, as indicated by the
Annexin V/PI assay (Fig. 2C).
Furthermore, the expression of cleaved PARP, a marker of apoptosis,
was increased in the combination group compared with the groups
treated singly with PD161570 or CQ (Figs. 2B and S1). Additionally, cell viability was
significantly reduced by the combined treatment of PD161570 and CQ
for 48 h, as shown by the CCK-8 assay results in Fig. 2D.
RNA-seq analysis of cells treated with
PD161570 under autophagy inhibition
To explore the effect of PD161570 under conditions
of autophagy inhibition via ATG5 silencing in HepG2 cells, gene
expression profiling was conducted using RNA-seq. A comparison was
made between cells treated with ATG5 siRNA and PD161570 and those
treated only with ATG5 siRNA. Fig.
3A shows a substantial decrease in mRNA expression following
ATG siRNA treatment, confirming the efficacy of the interference.
Replications were performed three times for each experimental
group. Differential gene expression analysis utilized thresholds of
a q-value <0.05 and a fold change >2, identifying 1,121
differentially expressed genes. Among these, 613 genes were
upregulated and 508 were downregulated, as shown in the
differential expression scatter plot (Fig. 3B). Table I displays RNA-seq results,
highlighting 15 genes with significant expression disparities (fold
change >10). Among these genes, SAPCD1 was the most
significantly downregulated, while VPREB3 was the most
significantly upregulated. The genes listed in Table II, with fold changes >2,
include those associated with apoptosis. Notable genes are HRK,
CTSS, BIRC3, BBC3, DDIT3 and GADD45B indicating a significant role
of apoptosis under autophagy deprivation.
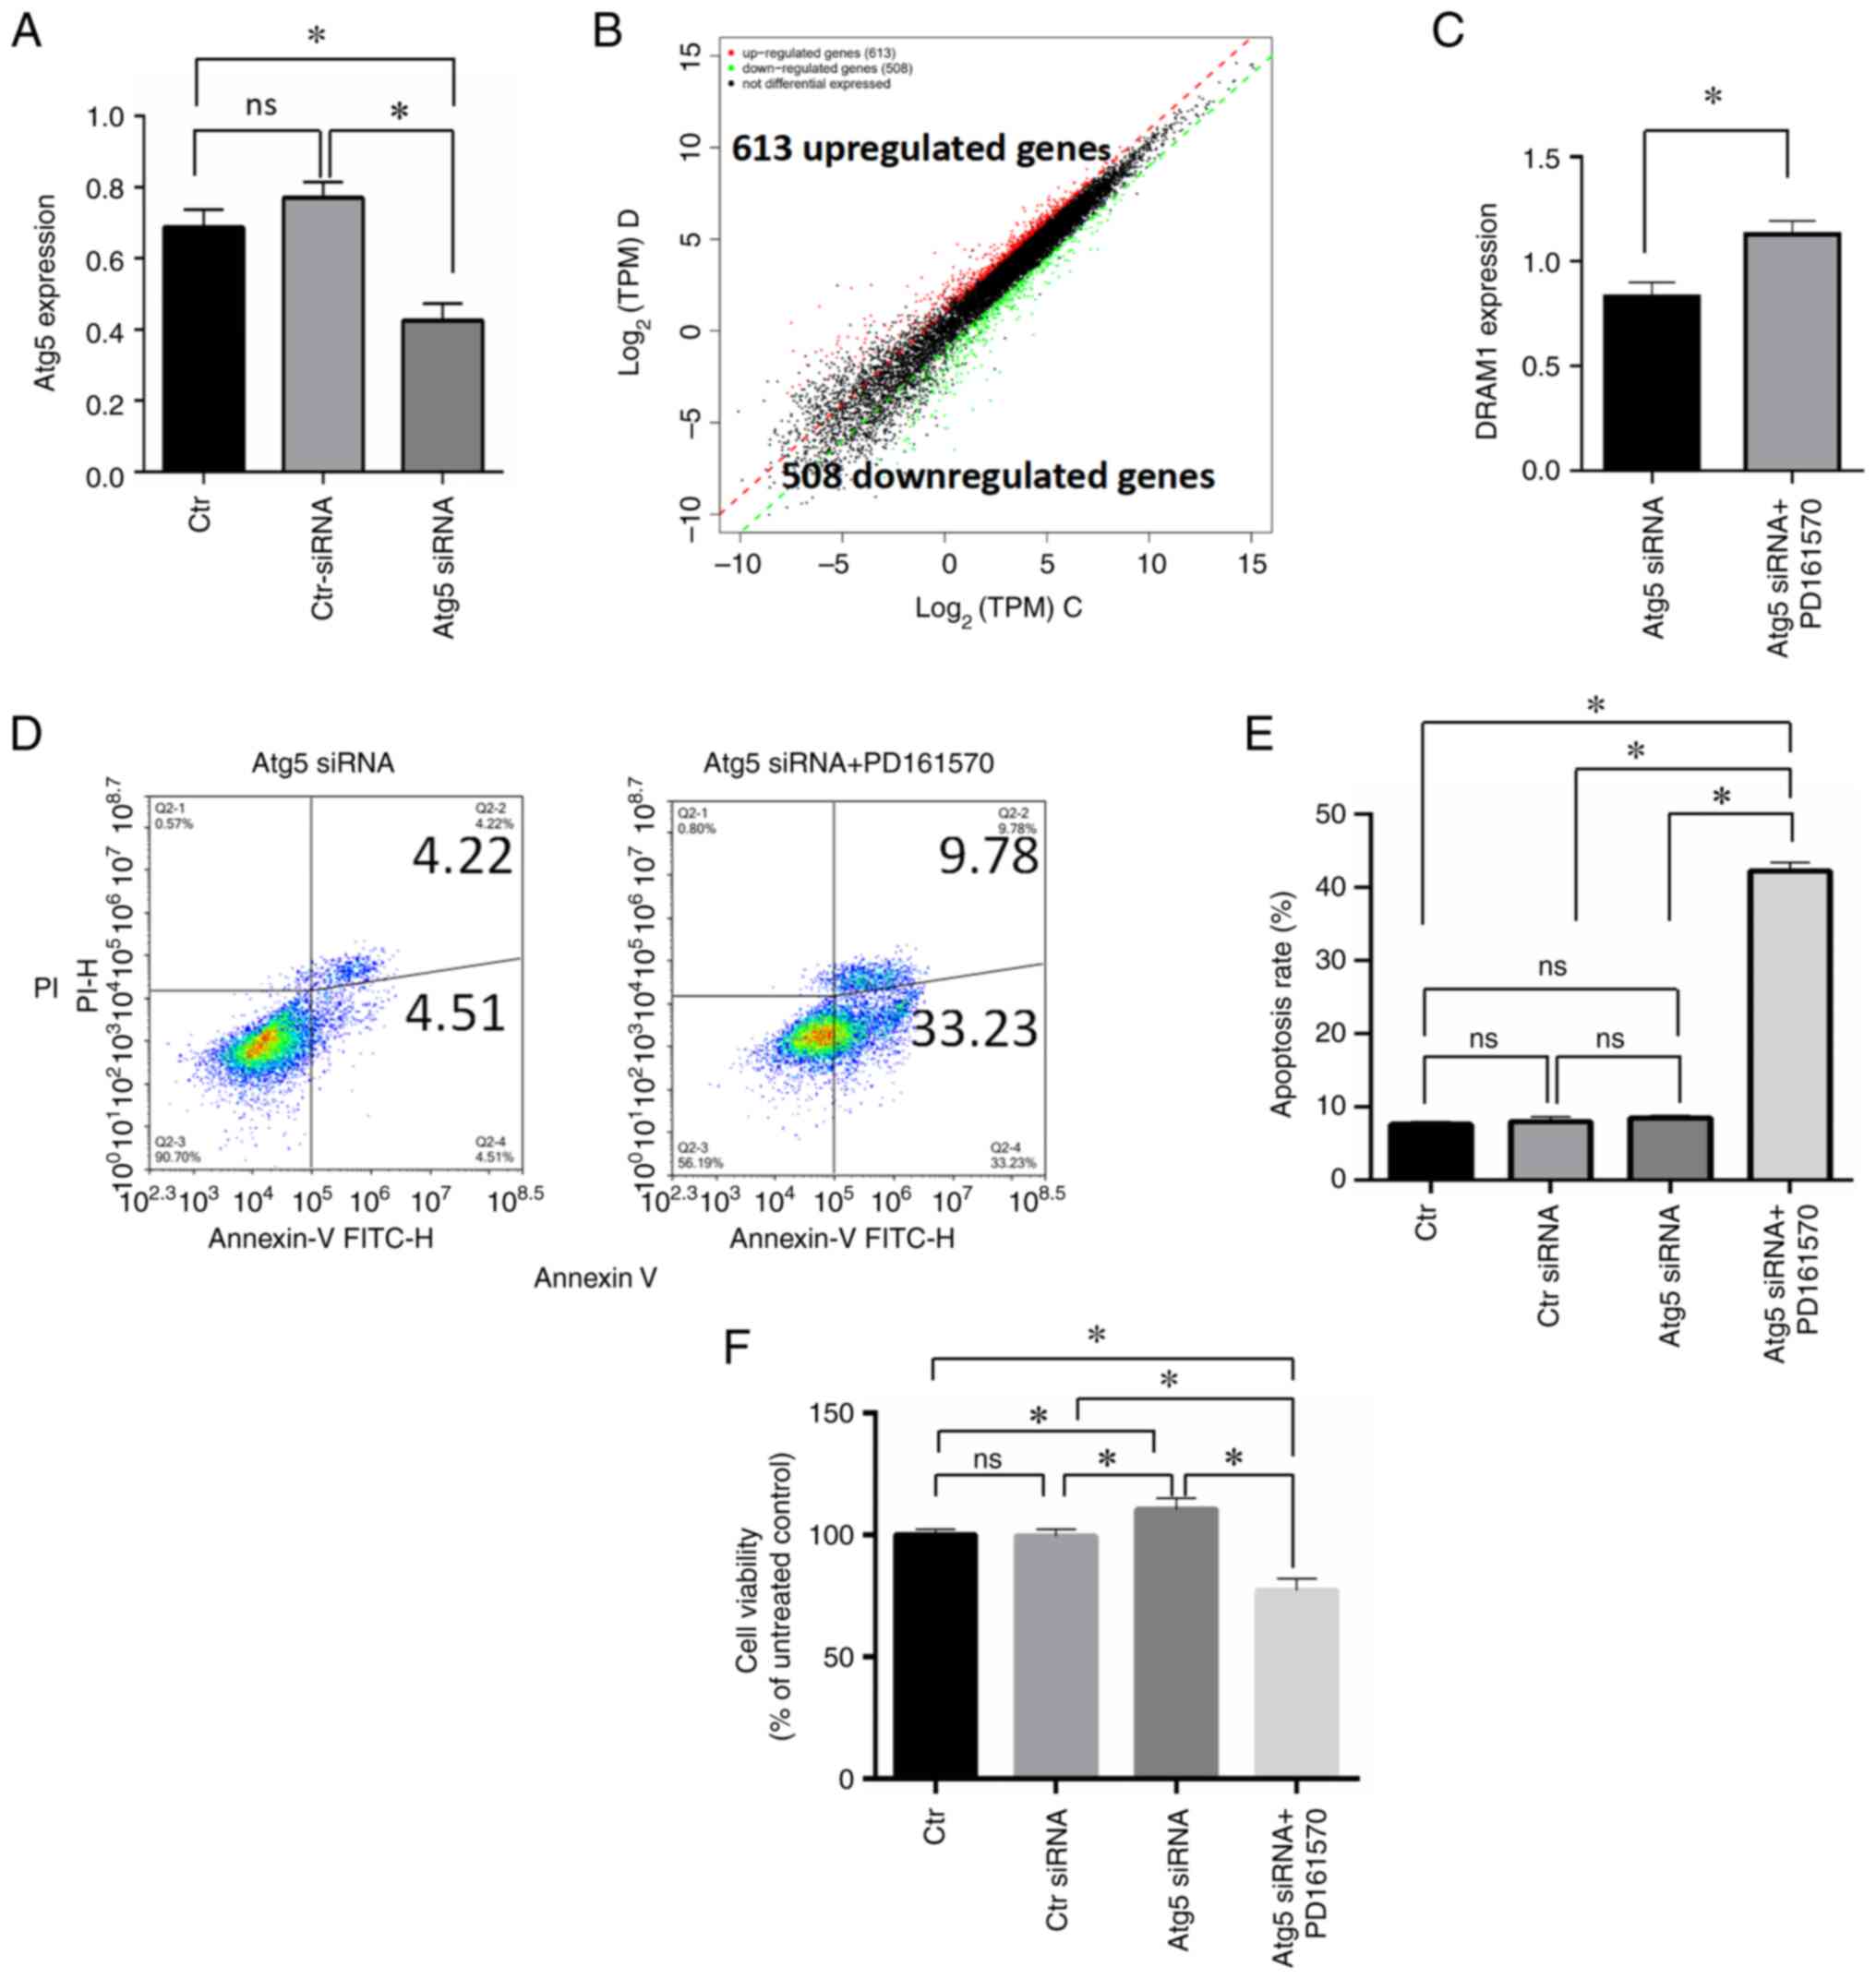 | Figure 3.RNA-seq analysis to elucidate the
underlying mechanism of PD161570. (A) RNA analysis validated ATG5
inhibition by ATG5 siRNA in HepG2 cells. (B) A differential
expression scatter plot displayed log2 of TPM values of two sample
sets, with red denoting upregulated genes, green indicating
downregulated genes and black representing non-differentially
expressed genes. (C) Immunoblotting analysis compared DRAM1
expression levels between ATG5 siRNA-transfected cells alone and
those combined with 10 µM PD161570. (D) Annexin V/PI analysis
assessed apoptosis levels between ATG5 siRNA-transfected cells
alone and in combination with 10 µM PD161570. (E) Triplicate
Annexin V/PI analysis of apoptotic cells between ATG5
siRNA-transfected cells alone and in combination with 10 µM
PD161570 were represented as mean ± SD. Untreated cells and control
siRNA-transfected cells served as loading controls. (F) Data from
CCk-8 analysis of viable cells between ATG5 siRNA-transfected cells
alone and in combination with 10 µM PD161570, performed in
triplicates, is depicted as mean ± SD. *P<0.05. Untreated cells
and control siRNA-transfected cells were included as loading
controls. RNA-seq, RNA sequencing; ATG5, autophagy-related gene 5;
si, small interfering; TPM, transcript per million; DRAM1, Damage
Regulated Autophagy Modulator 1; Ctr, control. |
 | Table I.Changes in gene expression (Fold
change >12) induced by 10 µM PD161570 in HepG2 cells. |
Table I.
Changes in gene expression (Fold
change >12) induced by 10 µM PD161570 in HepG2 cells.
| Log2FC | Gene name | Gene
description |
|---|
| 12.81 | VPREB3 | V-set pre-B cell
surrogate light chain 3 |
| 12.78 | SLC24A5 | Solute carrier
family 24 member 5 |
| 12.09 | GZMM | Granzyme M |
| 12.02 | WNT9B | Wnt family member
9B |
| 11.89 | DNAAF1 | Dynein axonemal
assembly factor 1 |
| 11.75 | SLC35G5 | Solute carrier
family 35 member g5 |
| 11.46 | ENO4 | Enolase family
member 4 |
| 11.17 | TGFB2 | Transforming growth
factor beta 2 |
| −12.41 | MCCD1 | Mitochondrial
coiled-coil domain 1 |
| −12.44 | C11orf97 | Chromosome 11 open
reading frame 97 |
| −12.50 | HAO2 | Hydroxyacid oxidase
2 |
| −12.89 | HLA-G | Major
histocompatibility complex, class I, G |
| −12.99 | DNASE1L3 | Deoxyribonuclease 1
like 3 |
| −13.15 | TAGLN3 | Transgelin 3 |
| −15.91 | SAPCD1 | Suppressor APC
domain containing 1 |
| Table II.List of selected top differentially
expressed genes involved in autophagy or apoptosis in HepG2
cells. |
Table II.
List of selected top differentially
expressed genes involved in autophagy or apoptosis in HepG2
cells.
| Log2FC | Gene name | Gene
description | Function |
|---|
| 4.13 | HRK | Harakiri | Apoptosis |
| 2.46 | CTSS | Cathepsin S | Apoptosis |
| 2.44 | BIRC3 | Baculoviral IAP
repeat containing 3 | Apoptosis |
| 2.21 | BBC3 | BCL2 binding
component 3 | Apoptosis |
| 2.05 | DDIT3 | DNA damage
inducible transcript 3 | Apoptosis |
| 2.03 | GADD45B | Growth arrest and
DNA damage inducible beta | Apoptosis |
| 1.40 | DRAM1 | DNA damage
regulated autophagy modulator 1 | Autophagy |
DNA Damage Regulated Autophagy Modulator 1 (DRAM1)
is a lysosomal membrane protein crucial for autophagy induction.
Notably, DRAM1 is also a TP53 target gene known to modulate both
autophagy and apoptosis, suggesting its dual role in influencing
these processes. As the only upregulated autophagy-relevant gene,
DRAM1 was identified from the RNA-seq analysis with a fold change
of 1.4 in the present study, which was confirmed by the subsequent
qPCR validation. Comparative analysis showed a significant increase
in DRAM1 mRNA expression following transfection with ATG5 siRNA
plus PD161570 treatment compared with ATG5 siRNA alone (P<0.005;
Fig. 3C). Additionally, Annexin
V/PI analysis was used to assess apoptotic responses in cells
treated with PD161570 in combination with ATG5 siRNA. Results
indicated a notable increase in apoptosis levels when 10 µM
PD161570 was added to ATG5 siRNA-transfected cells compared with
the ATG5 siRNA group (Fig. 3D and
E), along with a significant decrease in cell proliferation
(Fig. 3F). In summary, DRAM1
exhibited an increase rather than a decrease under conditions of
autophagy inhibition, implying its potential role as a
pro-apoptotic factor in response to PD161570 treatment and
positioning it as a pivotal target for regulating both autophagy
and apoptosis.
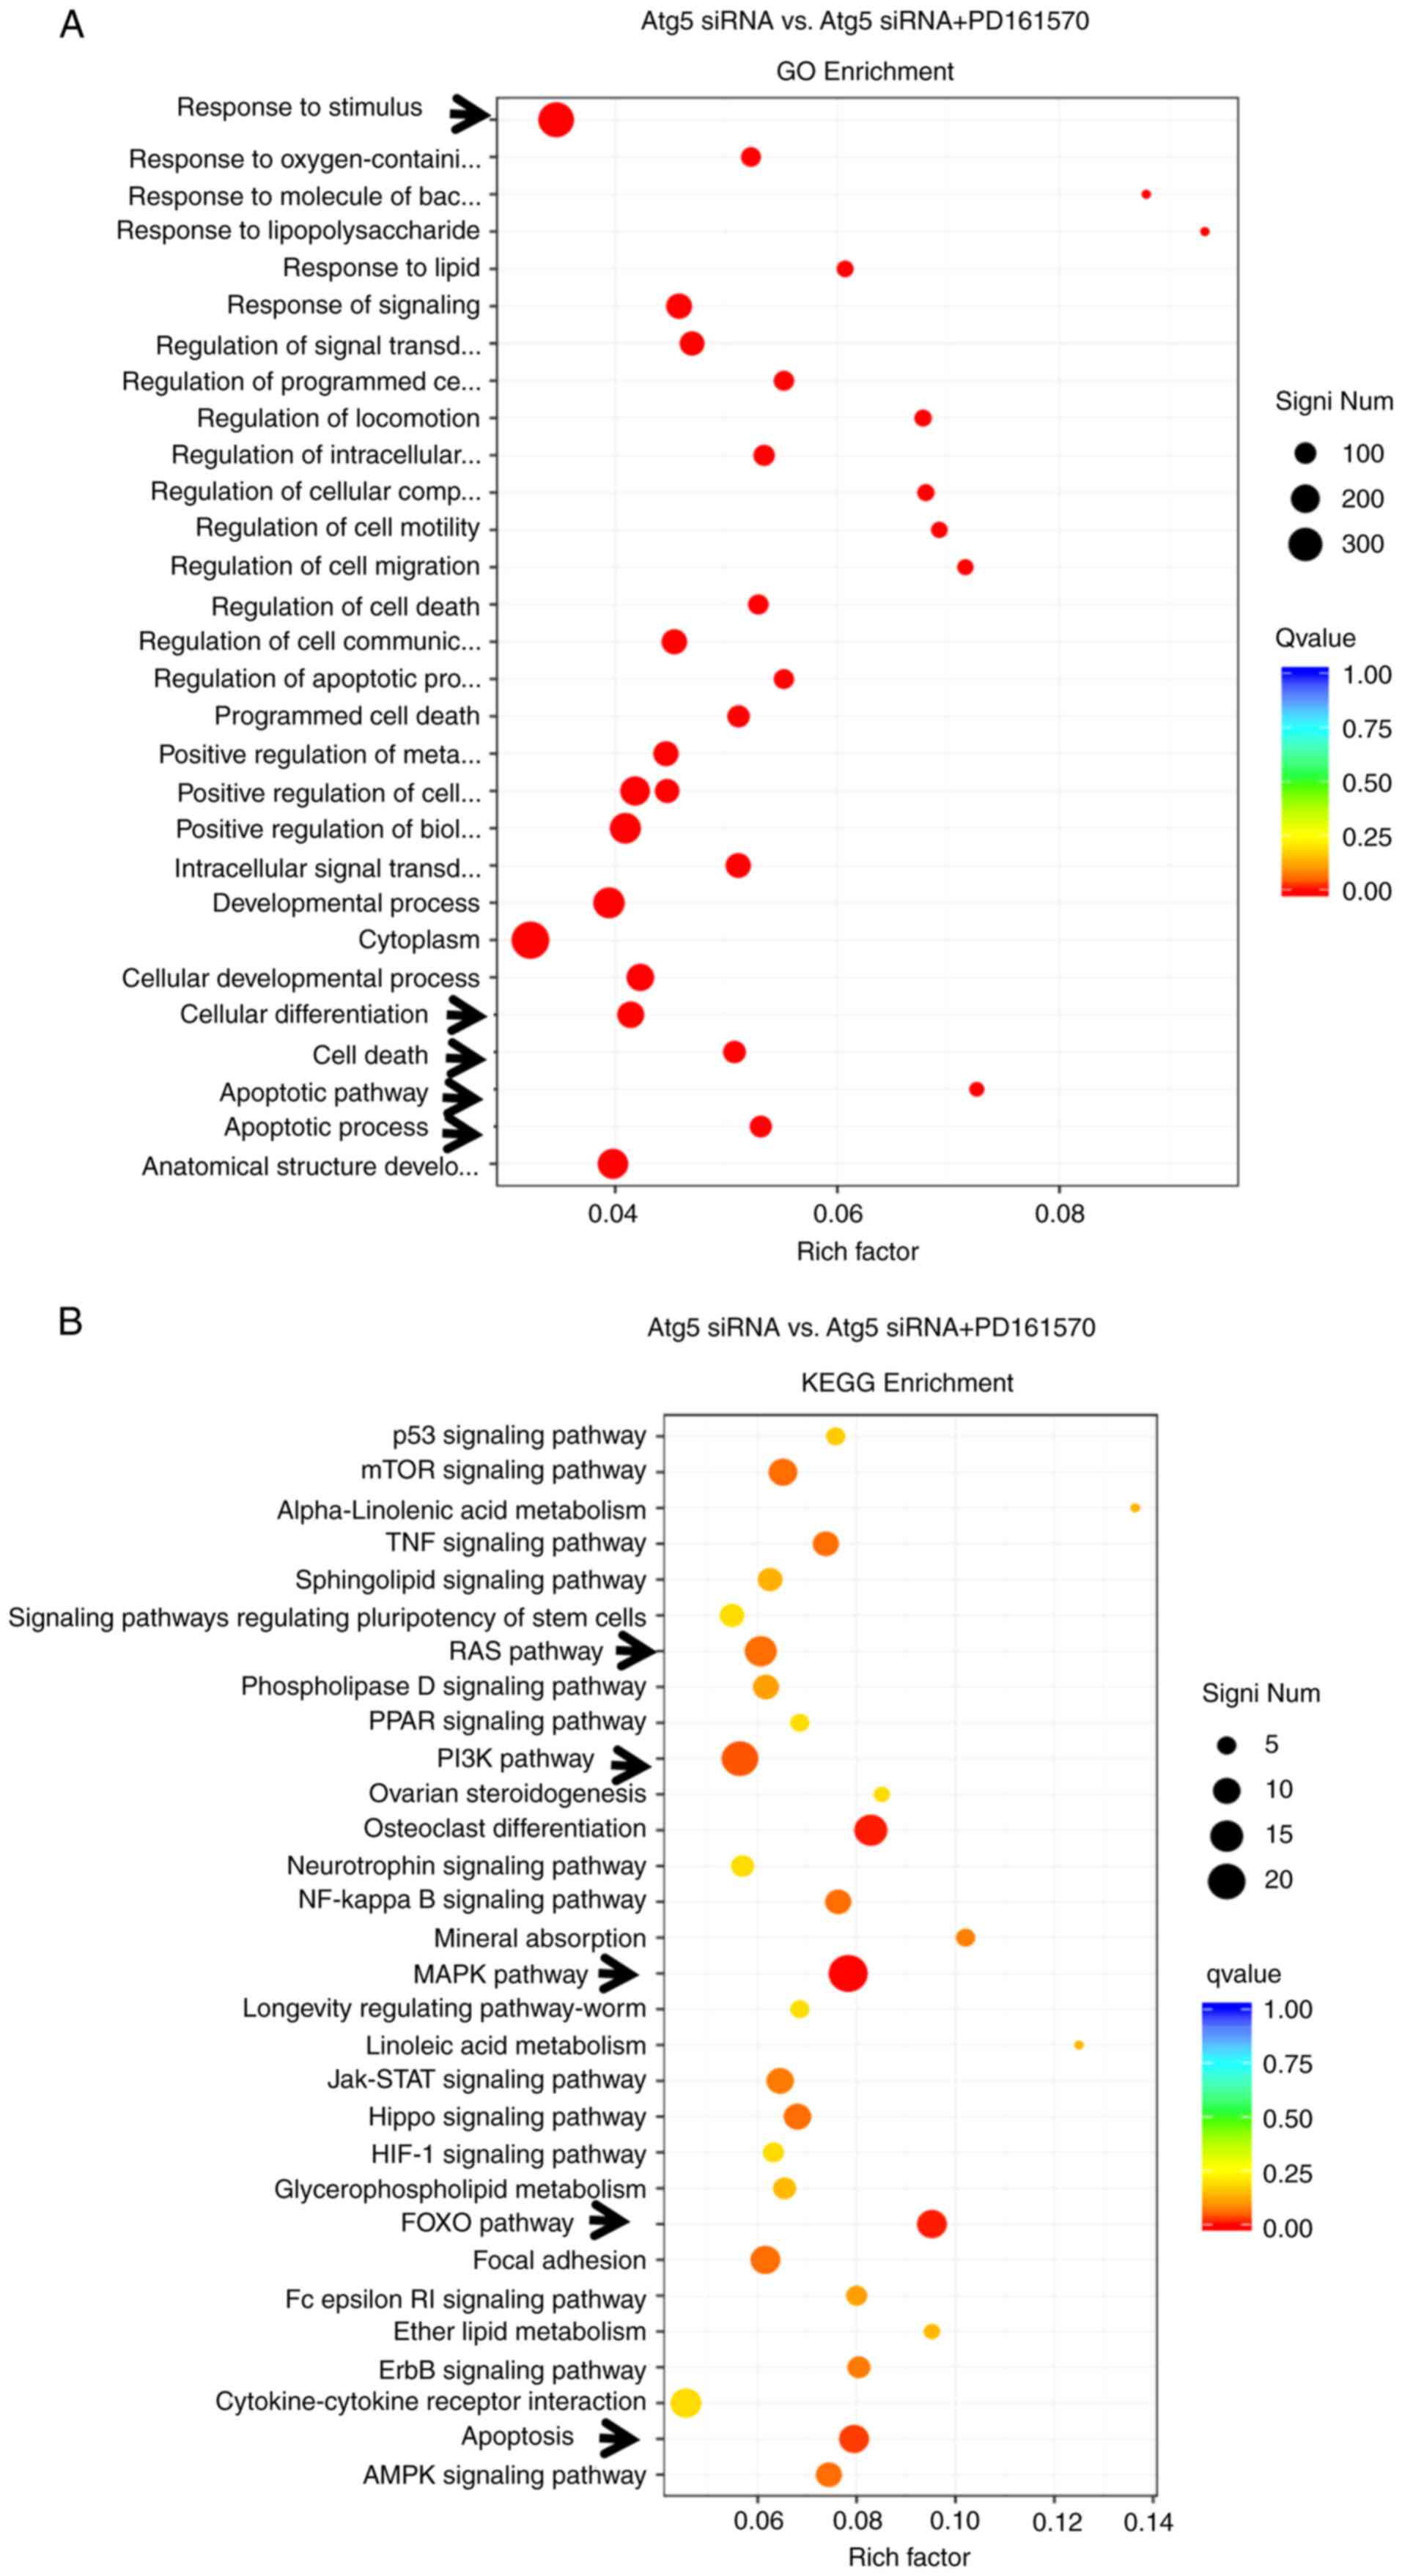
GO enrichment and KEGG pathway
analyses of differentially expressed genes
GO provides a standardized framework for
categorizing gene functions, offering an updated vocabulary to
describe the properties of genes and their products
comprehensively. Analysis presented in Fig. 4A showed significant changes in
genes associated with the cellular response to stimulus, including
those linked to apoptotic processes, apoptotic signaling pathways,
cell death and cell differentiation, highlighting the critical
roles of apoptosis-related genes under conditions of autophagy
deprivation following PD161570 treatment. The KEGG integrates
genomic, chemical and systemic functional information to provide
insights into biological systems. KEGG analysis identified
significant differences in pathways such as rat sarcoma (RAS),
PI3K-Akt, MAPK, Forkhead box O (FOXO), Hippo and apoptosis.
Notably, the MAPK signaling pathway was the most significantly
altered (P=4.13×10⁻⁶), followed by the apoptosis pathway
(P=0.0006), as depicted in Fig.
4B.
Discussion
The present study focused on the mechanisms
associated with TKIs, the primary targeted drugs for liver cancer.
An automated and simple HTS assay was developed to rapidly screen
small molecules, including PD161570 and mitoxantrone (19), which induce specific cell death in
liver cancer cells. PD161570, identified as a novel TKI and
fibroblast growth factor 1 receptor inhibitor (20,21),
has limited information available about its mechanism of action.
Although global research on this topic is minimal, previous
literature has suggested that PD161570 inhibits FGF-1 receptor
phosphorylation in human ovarian cancer cells and in insect cells
overexpressing human FGF-1 receptors (22). Additionally, PD161570 has shown
efficacy in inhibiting basic FGF-mediated angiogenesis and inducing
cell death in acute myeloid leukemia cells (23), highlighting its potential
anti-tumor properties. Despite these findings, there is scant
information on the effects of PD161570 on liver cancer,
necessitating further research into its effects in this area.
In the present study, a rapid and straightforward
assay was employed to screen a small molecule library, identifying
compounds that induce significant cell death in liver cancer cells.
Results from nuclei counting and viability assays indicated that
PD161570 inhibited the growth and proliferation of hepatic cancer
cells. Observations also showed an upregulation of LC3-II levels
and a downregulation of p62 in PD161570-treated hepatic cancer
cells, suggesting that PD161570 induced autophagy. When PD161570
was combined with CQ, an increase in LC3-II expression was
observed, indicating enhanced autophagic activity. These results
highlighted the robust autophagic flux prompted by PD161570,
covering processes from induction to degradation. In the present
study, elevated levels of the autophagy core protein ATG5 were
detected in PD161570-treated liver cancer cells, suggesting the
potential induction of ATG5-mediated autophagy by PD161570. A
previous study identified mTOR as a critical sensor of cellular
nutrient status, with its inhibition triggering autophagy under
energy deprivation conditions (24). Notably, the present study indicated
that PD161570 stimulated autophagy through an mTOR-independent
pathway. This is consistent with existing research showing that
certain small molecules, such as intracellular inositol or inositol
1,4,5-trisphosphate, can activate mTOR-independent autophagy in
vitro (25,26). In conclusion, PD161570 induces
autophagy by modulating autophagy-related genes, including ATG5,
LC3-II and p62.
Cell death includes various mechanisms, such as
apoptosis, necrosis and autophagic death (27,28).
Among these, autophagy, necrosis and apoptosis are critical in
anti-tumor therapy (29).
Antitumor drugs often induce cell death, leading to the inhibition
of cell growth and proliferation (30,31).
There is growing evidence that autophagy and apoptosis interact in
diverse ways; either antagonizing, assisting, or influencing each
other to determine cellular fate (32). Studies have elucidated the complex
pathways through which autophagy and apoptosis interact (32,33).
In the present study, inhibition of autophagy by CQ demonstrated
that PD161570 facilitated necrotic and apoptotic cell death,
thereby inhibiting the proliferation and growth of hepatic cancer
cells. These findings suggested that suppressing autophagy
sensitized hepatic cancer cells to PD161570 treatment.
Consequently, it was concluded that PD161570-induced autophagy,
apoptosis and necrosis collectively contributed to the death of
hepatic cancer cells. In recent years, lysosomal cell death has
emerged as a form of programmed cell death, alongside other
processes such as pyroptosis, necroptosis and NETosis, which have
been described in the literature (34). Currently, the authors have not
explored other forms of cell death. However, in upcoming
experiments for a new project, it is intended to investigate
ferroptosis, a recently identified type of cell death that is
associated with autophagy.
RNA sequencing technology was further utilized to
investigate the mechanism underlying PD161570-mediated cell death
in the context of autophagy inhibition via ATG5 knockdown. A total
of 1,121 differentially expressed genes were identified from the
combined treatment of PD161570 and ATG5 knockdown compared with the
group with only ATG5 knockdown; 613 genes were upregulated, and 508
genes downregulated. Notably, among these genes, DRAM1 emerged as a
key player in autophagy modulation. DRAM1, characterized by six
membrane-spanning regions and predominantly located on the
lysosomal membrane, functions as a TP53 target gene regulating both
autophagy and apoptosis (35–37).
It is hypothesized that DRAM1 may play a pivotal role in mediating
PD161570-induced apoptosis and autophagy in hepatic cancer cells.
The precise contribution of DRAM1 to liver cancer cell autophagy
and apoptosis and the underlying mechanisms remain to be
elucidated. It has been previously reported that DRAM1 knockdown by
specific siRNA abrogated cell autophagy in HepG2 cells, which may
be reversed by rapamycin treatment (38). The present study demonstrated that
PD161570 induced ATG5-dependent autophagy and promoted autophagic
flux in HepG2 cells. Notably, DRAM1 expression was found to
increase rather than decrease following ATG5 knockdown using
specific siRNAs. This increase in DRAM1 expression was associated
with autophagy inhibition and enhanced apoptosis. The findings
suggested that while DRAM1 may not directly participate in
PD161570-induced autophagy, it could potentially be involved in the
apoptosis triggered by PD161570. Under conditions of autophagy
inhibition through ATG5 silencing, DRAM1 could potentially induce
apoptosis, similar to findings in an experimental rat model where
DRAM1 interacted with Atg7, rather than ATG5 (39). ATG5 may be a key crosstalk of
autophagy and apoptosis in PD161570-treated liver cancer cells,
though further experimental validation is required to confirm this
hypothesis.
GO enrichment and KEGG pathway analyses revealed
significant enrichment of genes associated with the apoptotic cell
death response, suggesting that PD161570 may facilitate cell death
via the apoptotic signaling pathway in the absence of autophagy.
HRK, an apoptosis activator known as Harakiri, modulates apoptosis
by interfering with anti-apoptotic Bcl-2 and Bcl-xL proteins
(40,41). The role of HRK in tumors remains
unclear, with limited evidence showing its downregulation in tumors
contexts (42). Additionally,
TGF-β2, a highly differentially expressed gene in the MAPK
signaling pathway, was identified as participating in
PD161570-induced apoptosis under autophagy inhibition. Beyond its
role in inducing apoptosis, TGF-β2 may also function in breast
cancer development, acting as a tumor suppressor in primary tumor
initiation and a promoter in later stages (43). However, the roles of HRK and TGF-β2
in PD161570-induced apoptosis alongside autophagy inhibition
requires further investigation.
In conclusion, the present study provided the first
documentation of the potential of PD161570 as a liver cancer
therapeutic agent, highlighting its interactions with autophagy and
apoptosis pathways. PD161570 triggers ATG5-dependent and
mTOR-independent autophagy in hepatic cancer cells and promotes
apoptosis when autophagy is inhibited. These findings underscore
the need for further research into drug development for
hepatocellular carcinoma treatment. However, the detailed molecular
mechanisms linking PD161570 to these pathways remain to be fully
elucidated.
Supplementary Material
Supporting Data
Acknowledgements
The authors would like to thank Professor Jinping Li
(Department of Medical Biochemistry and Microbiology, University of
Uppsala, Sweden) for language refining and modification.
Funding
The present study was supported by the Jiangxi Provincial Youth
Science Foundation (grant no. 20202ACBL216014), the Jiangxi
Provincial Natural Science Foundation (grant no. 20232BAB206164),
the Key Laboratory Project of Digestive Diseases in Jiangxi
Province (grant no. 2024SSY06101) and Jiangxi Clinical Research
Center for Gastroenterology (grant no. 20223BCG74011).
Availability of data and materials
The data generated in the present study may be
requested from the corresponding author. The raw RNA sequencing
data generated in the present study may be found in the Sequence
Read Archive database under accession number PRJNA1187334 or at the
following URL: https://www.ncbi.nlm.nih.gov/sra/PRJNA1187334.
Authors' contributions
BX designed the study, drafted and revised the
manuscript, XH performed the experiments and collected data, JL
performed the experiments and revised the manuscript and YZ
performed the statistical analysis. XH and BX confirm the
authenticity of all the raw data All authors read and approved the
final version of the manuscript.
Ethics approval and consent to
participate
Not applicable.
Patient consent for publication
Not applicable.
Competing interests
The authors declare that they have no competing
interests.
References
|
1
|
Song P, Tang W, Tamura S, Hasegawa K,
Sugawara Y, Dong J and Kokudo N: The management of hepatocellular
carcinoma in Asia: a guideline combining quantitative and
qualitative evaluation. Biosci Trends. 4:283–287. 2010.PubMed/NCBI
|
|
2
|
Frenette C and Gish R: Targeted systemic
therapies for hepatocellular carcinoma: Clinical perspectives,
challenges and implications. World J Gastroenterol. 18:498–506.
2012. View Article : Google Scholar : PubMed/NCBI
|
|
3
|
Mandlik DS, Mandlik SK and Choudhary HB:
Immunotherapy for hepatocellular carcinoma: Current status and
future perspectives. World J Gastroenterol. 29:1054–1075. 2023.
View Article : Google Scholar : PubMed/NCBI
|
|
4
|
Luo X, He X, Zhang X, Zhao X, Zhang Y, Shi
Y and Hua S: Hepatocellular carcinoma: Signaling pathways, targeted
therapy and immunotherapy. MedComm (2020). 5:e4742024. View Article : Google Scholar : PubMed/NCBI
|
|
5
|
Feng MY, Chan LL and Chan SL: Drug
treatment for advanced hepatocellular carcinoma: First-line and
beyond. Curr Oncol. 29:5489–5507. 2022. View Article : Google Scholar : PubMed/NCBI
|
|
6
|
Richards KN, Zweidler-McKay PA, Van Roy N,
Speleman F, Trevino J, Zage PE and Hughes DP: Signaling of ERBB
receptor tyrosine kinases promotes neuroblastoma growth in vitro
and in vivo. Cancer. 116:3233–3243. 2010. View Article : Google Scholar : PubMed/NCBI
|
|
7
|
Hussain S, Mursal M, Verma G, Hasan SM and
Khan MF: Targeting oncogenic kinases: Insights on FDA approved
tyrosine kinase inhibitors. Eur J Pharmacol. 970:1764842024.
View Article : Google Scholar : PubMed/NCBI
|
|
8
|
Rosenzweig SA: Acquired resistance to
drugs targeting tyrosine kinases. Adv Cancer Res. 138:71–98. 2018.
View Article : Google Scholar : PubMed/NCBI
|
|
9
|
Livak KJ and Schmittgen TD: Analysis of
relative gene expression data using real-time quantitative PCR and
the 2(−Delta Delta C(T)) Method. Methods. 25:402–408. 2001.
View Article : Google Scholar : PubMed/NCBI
|
|
10
|
Hashemi M, Nadafzadeh N, Imani MH, Rajabi
R, Ziaolhagh S, Bayanzadeh SD, Norouzi R, Rafiei R, Koohpar ZK,
Raei B, et al: Targeting and regulation of autophagy in
hepatocellular carcinoma: revisiting the molecular interactions and
mechanisms for new therapy approaches. Cell Commun Signal.
21:322023. View Article : Google Scholar : PubMed/NCBI
|
|
11
|
Chao X, Qian H, Wang S, Fulte S and Ding
WX: Autophagy and liver cancer. Clin Mol Hepatol. 26:606–617. 2020.
View Article : Google Scholar : PubMed/NCBI
|
|
12
|
Akkoc Y and Gozuacik D: Autophagy and
liver cancer. Turk J Gastroenterol. 29:270–282. 2018. View Article : Google Scholar : PubMed/NCBI
|
|
13
|
Di Fazio P and Matrood S: Targeting
autophagy in liver cancer. Transl Gastroenterol Hepatol. 3:392018.
View Article : Google Scholar : PubMed/NCBI
|
|
14
|
Tanida I, Minematsu-Ikeguchi N, Ueno T and
Kominami E: Lysosomal turnover, but not a cellular level, of
endogenous LC3 is a marker for autophagy. Autophagy. 1:84–91. 2005.
View Article : Google Scholar : PubMed/NCBI
|
|
15
|
Pankiv S, Clausen TH, Lamark T, Brech A,
Bruun JA, Outzen H, Øvervatn A, Bjørkøy G and Johansen T:
p62/SQSTM1 binds directly to Atg8/LC3 to facilitate degradation of
ubiquitinated protein aggregates by autophagy. J Biol Chem.
282:24131–24145. 2007. View Article : Google Scholar : PubMed/NCBI
|
|
16
|
Kabeya Y, Mizushima N, Ueno T, Yamamoto A,
Kirisako T, Noda T, Kominami E, Ohsumi Y and Yoshimori T: LC3, a
mammalian homologue of yeast Apg8p, is localized in autophagosome
membranes after processing. EMBO J. 19:5720–5728. 2000. View Article : Google Scholar : PubMed/NCBI
|
|
17
|
Kabeya Y, Mizushima N, Yamamoto A,
Oshitani-Okamoto S, Ohsumi Y and Yoshimori T: LC3, GABARAP and
GATE16 localize to autophagosomal membrane depending on form-II
formation. J Cell Sci. 117:2805–2812. 2004. View Article : Google Scholar : PubMed/NCBI
|
|
18
|
Pullen N and Thomas G: The modular
phosphorylation and activation of p70s6k. FEBS Lett. 410:78–82.
1997. View Article : Google Scholar : PubMed/NCBI
|
|
19
|
Xie B, He X, Guo G, Zhang X, Li J, Liu J
and Lin Y: High-throughput screening identified mitoxantrone to
induce death of hepatocellular carcinoma cells with autophagy
involvement. Biochem Biophys Res Commun. 521:232–237. 2020.
View Article : Google Scholar : PubMed/NCBI
|
|
20
|
Horakova D, Cela P, Krejci P, Balek L,
Moravcova Balkova S, Matalova E and Buchtova M: Effect of FGFR
inhibitors on chicken limb development. Dev Growth Differ.
56:555–572. 2014. View Article : Google Scholar : PubMed/NCBI
|
|
21
|
Stevens DA, Harvey CB, Scott AJ, O'Shea
PJ, Barnard JC, Williams AJ, Brady G, Samarut J, Chassande O and
Williams GR: Thyroid hormone activates fibroblast growth factor
receptor-1 in bone. Mol Endocrinol. 17:1751–1766. 2003. View Article : Google Scholar : PubMed/NCBI
|
|
22
|
Batley BL, Doherty AM, Hamby JM, Lu GH,
Keller P, Dahring TK, Hwang O, Crickard K and Panek RL: Inhibition
of FGF-1 receptor tyrosine kinase activity by PD 161570, a new
protein-tyrosine kinase inhibitor. Life Sci. 62:143–150. 1998.
View Article : Google Scholar : PubMed/NCBI
|
|
23
|
Biyanee A, Yusenko MV and Klempnauer KH:
Src-Family protein kinase inhibitors suppress MYB activity in a
p300-dependent manner. Cells. 11:11622022. View Article : Google Scholar : PubMed/NCBI
|
|
24
|
Jaboin JJ, Shinohara ET, Moretti L, Yang
ES, Kaminski JM and Lu B: The role of mTOR inhibition in augmenting
radiation induced autophagy. Technol Cancer Res Treat. 6:443–447.
2007. View Article : Google Scholar : PubMed/NCBI
|
|
25
|
Rubinsztein DC, Gestwicki JE, Murphy LO
and Klionsky DJ: Potential therapeutic applications of autophagy.
Nat Rev Drug Discov. 6:304–312. 2007. View
Article : Google Scholar : PubMed/NCBI
|
|
26
|
Botti J, Djavaheri-Mergny M, Pilatte Y and
Codogno P: Autophagy signaling and the cogwheels of cancer.
Autophagy. 2:67–73. 2006. View Article : Google Scholar : PubMed/NCBI
|
|
27
|
Repici M, Mariani J and Borsello T:
Neuronal death and neuroprotection: A review. Methods Mol Biol.
399:1–14. 2007. View Article : Google Scholar : PubMed/NCBI
|
|
28
|
Yan L, Liu C, Zhai Z, Ren G and Qiu S: A
review of research progress on the mechanisms of programmed nerve
cell death. Altern Ther Health Med. 30:68–72. 2024.PubMed/NCBI
|
|
29
|
Liu W, Jin W, Zhu S, Chen Y and Liu B:
Targeting regulated cell death (RCD) with small-molecule compounds
in cancer therapy: A revisited review of apoptosis,
autophagy-dependent cell death and necroptosis. Drug Discov Today.
27:612–625. 2022. View Article : Google Scholar : PubMed/NCBI
|
|
30
|
Xie SB, He XX and Yao SK: Matrine-induced
autophagy regulated by p53 through AMP-activated protein kinase in
human hepatoma cells. Int J Oncol. 47:517–526. 2015. View Article : Google Scholar : PubMed/NCBI
|
|
31
|
Xie BS, He XX, Ai ZL and Yao SK:
Involvement of β-catenin in matrine-induced autophagy and apoptosis
in WB-F344 cells. Mol Med Rep. 9:2547–2553. 2014. View Article : Google Scholar : PubMed/NCBI
|
|
32
|
Xi H, Wang S, Wang B, Hong X, Liu X, Li M,
Shen R and Dong Q: The role of interaction between autophagy and
apoptosis in tumorigenesis (Review). Oncol Rep. 48:2082022.
View Article : Google Scholar : PubMed/NCBI
|
|
33
|
D'Arcy MS: Cell death: A review of the
major forms of apoptosis, necrosis and autophagy. Cell Biol Int.
43:582–592. 2019. View Article : Google Scholar : PubMed/NCBI
|
|
34
|
Park W, Wei S, Kim BS, Kim B, Bae SJ, Chae
YC, Ryu D and Ha KT: Diversity and complexity of cell death: A
historical review. Exp Mol Med. 55:1573–1594. 2023. View Article : Google Scholar : PubMed/NCBI
|
|
35
|
Liu K, Lou J, Wen T, Yin J, Xu B, Ding W,
Wang A, Liu D, Zhang C, Chen D and Li N: Depending on the stage of
hepatosteatosis, p53 causes apoptosis primarily through either
DRAM-induced autophagy or BAX. Liver Int. 33:1566–1574. 2013.
View Article : Google Scholar : PubMed/NCBI
|
|
36
|
Takahashi M, Kakudo Y, Takahashi S,
Sakamoto Y, Kato S and Ishioka C: Overexpression of DRAM enhances
p53-dependent apoptosis. Cancer Med. 2:1–10. 2013. View Article : Google Scholar : PubMed/NCBI
|
|
37
|
Crighton D, Wilkinson S and Ryan KM: DRAM
links autophagy to p53 and programmed cell death. Autophagy.
3:72–74. 2007. View Article : Google Scholar : PubMed/NCBI
|
|
38
|
Chen C, Liang QY, Chen HK, Wu PF, Feng ZY,
Ma XM, Wu HR and Zhou GQ: DRAM1 regulates the migration and
invasion of hepatoblastoma cells via autophagy-EMT pathway. Oncol
Lett. 16:2427–2433. 2018.PubMed/NCBI
|
|
39
|
Wu X, Qin Y, Zhu X, Liu D, Chen F, Xu S,
Zheng D, Zhou Y and Luo J: Increased expression of DRAM1 confers
myocardial protection against ischemia via restoring autophagy
flux. J Mol Cell Cardiol. 124:70–82. 2018. View Article : Google Scholar : PubMed/NCBI
|
|
40
|
Chang I, Majid S, Saini S, Zaman MS,
Yamamura S, Chiyomaru T, Shahryari V, Fukuhara S, Deng G, Dahiya R
and Tanaka Y: Hrk mediates 2-methoxyestradiol-induced mitochondrial
apoptotic signaling in prostate cancer cells. Mol Cancer Ther.
12:1049–1059. 2013. View Article : Google Scholar : PubMed/NCBI
|
|
41
|
Kaya-Aksoy E, Cingoz A, Senbabaoglu F,
Seker F, Sur-Erdem I, Kayabolen A, Lokumcu T, Sahin GN,
Karahuseyinoglu S and Bagci-Onder T: The pro-apoptotic Bcl-2 family
member Harakiri (HRK) induces cell death in glioblastoma
multiforme. Cell Death Discov. 5:642019. View Article : Google Scholar : PubMed/NCBI
|
|
42
|
Nakamura M, Shimada K and Konishi N: The
role of HRK gene in human cancer. Oncogene. 27 (Suppl 1):S105–S113.
2008. View Article : Google Scholar : PubMed/NCBI
|
|
43
|
Dave H, Trivedi S, Shah M and Shukla S:
Transforming growth factor beta 2: A predictive marker for breast
cancer. Indian J Exp Biol. 49:879–887. 2011.PubMed/NCBI
|