Introduction
Skeletal muscles require large amounts of energy to
generate the force and power needed to sustain physical activity.
To maintain a high-energy state, muscle tissues store important
fuel substrates, such as proteins (source of amino acids) and
glycogen (source of carbohydrates) (1). Thus, an adequate supply of metabolic
substrates is crucial for maintaining muscle mass and function.
However, due to various physiological and environmental conditions,
the supply of such substrates may be insufficient. In particular,
undernutrition and starvation are among the primary causes of
substrate shortage for energy production in skeletal muscles,
leading to muscle weakness and atrophy, which can lead to muscular
disorders, such as sarcopenia (2,3).
Various nutritional supplementation methods have
been proposed as effective strategies for maintaining muscle mass
and preventing muscle dysfunction and atrophy (4,5).
Muscle mass largely depends on the balance between protein
synthesis and degradation, regulated by cellular energy status
through specific anabolic and catabolic signaling pathways
(6,7). Among proteins and amino acids,
leucine, a branched-chain amino acid, has piqued interest as a
nutritional supplement for muscle maintenance owing to its potent
ability to stimulate anabolic signals both in vitro and
in vivo (7–9). A recent comprehensive clinical review
reported that, although the evidence supporting the recommendation
of leucine for increasing muscle mass and strength is low to
moderate, it is the best nutrient available among several other
nutrients that have been investigated (10).
In contrast, no clear recommendations are available
for specific nutrients that inhibit catabolic reactions, such as
muscle autophagy. When cells and tissues, particularly those with
high energy demands, such as the heart and muscles, encounter an
energy deficiency, they mobilize fuel substrates in response to the
cellular environment, shift the substrate preference to that
available for energy production, and attempt to maintain their
energy status at a safe level using these fuels (11–14).
However, an insufficient supply of extracellular nutrients for such
an adaptive reaction activates the autophagy pathway for mobilizing
glucose, amino acids, and fatty acids from different organelles for
use as a source of energy (15).
Therefore, ensuring a sufficient supply of certain nutrients that
can be efficiently utilized by muscle tissue may be a viable
strategy to prevent muscle catabolism.
Myotubes derived from mouse C2C12 myoblast cell
lines are commonly used as a model system for studying skeletal
muscle biology. Although the metabolic profile of C2C12-derived
myotubes is not identical to that of skeletal muscle, C2C12
myotubes exhibit characteristics similar to those of skeletal
muscle in terms of nutrient metabolism (16). Therefore, this cell line has been
used in studies investigating muscle metabolism and its alterations
(17–19). In addition, when C2C12 myotubes are
in a fasting state, they not only display atrophic morphology but
also exhibit specific metabolic profiles observed in atrophic
muscles, characterized by accelerated protein breakdown through the
activation of two major protein degradation systems: the
ubiquitin-proteasome and autophagy-lysosome systems (20,21).
Several nutrient substrates have been examined for their potential
to inhibit myotube atrophy induced by starvation. However, the
starvation conditions varied across studies, leading to
inconsistent results, even when the same substrates were used.
Therefore, in this study, we aimed to compare the
metabolic features of different substrates and their efficiency as
energy fuels in C2C12 muscle cells under fasting conditions. The
cells were starved by incubating them in a medium devoid of the
main nutrients, and their metabolic profile, including anabolic and
catabolic signaling, was analyzed in response to treatment with
each nutrient substrate.
Materials and methods
Materials
D-glucose (Glc), L-glutamine (Gln), L-glutamic acid
(Glu), L-leucine (Leu), L-valine (Val), β-hydroxy butyric acid
(βOHB), and FA-free bovine serum albumin (BSA) were purchased from
FUJIFILM Wako Pure Chemicals (Osaka, Japan). Palmitic acid (PA),
oleic acid (OA), and
3-(4,5-dimethylthiazol-2-y1)-2,5-diphenyltetrazoli-umbromide (MTT)
were purchased from Nacalai Tesque (Kyoto, Japan). Sodium lactate
(LA) and dimethyl α-ketoglutarate (αKG; an esterified form of
α-ketoglutarate) were purchased from Otsuka Pharmaceutical (Tokyo,
Japan) and Combi-Blocks (San Diego, CA, USA), respectively. All
chemicals, except PA and OA, were dissolved in deionized distilled
water.
Preparation of fatty acid complex
The cells were treated with fatty acids (FAs) using
a previously described method, wherein the fatty acids were
individually complexed with BSA in phosphate-buffered saline (PBS)
(22). Briefly, FAs (PA or OA)
were added to 100 mM NaOH solution and dissolved in a heat-block at
75°C for 30 min to obtain the FA solution. The prepared FA solution
was added to 10% (w/v) FA-free BSA in PBS at a ratio of 1:9 (v/v)
to obtain a 10 mM FA solution. This solution was added to the
medium at a final concentration of 0.1 or 0.2 mM FA. A mixture of
100 mM NaOH and 10% BSA/PBS (1:9) was used as the vehicle control.
Each prepared solution was heated up to 55°C before being added to
the cells.
Cell culture and treatment
Mouse C2C12 myoblast cell line (RCB0987) was
purchased from the RIKEN BioResource Research Center (Tsukuba,
Japan). The cells were cultured in Dulbecco's modified Eagle's
medium (DMEM) with 5.5 mM glucose (041-29775; FUJIFILM Wako Pure
Chemicals) supplemented with 10% fetal bovine serum at 37°C in a
humidified atmosphere with 5% CO2. To induce
differentiation of myoblasts into myotubes, C2C12 cells at 80%
confluency were maintained in the differentiation medium (DMEM
containing 2% horse serum; Thermo Fisher Scientific, Tokyo, Japan)
for 6 days. For starvation, the differentiation medium was replaced
with ‘starvation medium’-DMEM lacking glucose, glutamine, and
pyruvate (A14430; Thermo Fisher Scientific)- and the cells were
incubated for the specified durations before harvesting. The
control cells were incubated in regular DMEM without serum for the
same durations. For some experiments, a specific nutrient was added
to the starvation medium at concentrations within the medium to
high physiological range, which are typically used in cell
experiments. The concentrations of each nutrient used in this study
are shown in Table I.
 | Table I.Type and concentration of substrates
added to the cells. |
Table I.
Type and concentration of substrates
added to the cells.
| Type | Substrate
(abbreviation) | Concentration in
medium |
|---|
| Monosaccharide | Glucose (Glc) | 5.5 mM |
| Amino acid | Glutamine
(Gln) | 2.0 mM |
|
| Glutamic acid
(Glu) | 0.2 mM |
|
| Leucine (Leu) | 0.2 mM |
|
| Valine (Val) | 0.2 mM |
| Fatty acid | Palmitic acid
(PA) | 0.1 and 0.2 mM |
|
| Oleic acid
(OA) | 0.1 and 0.2 mM |
| Lactic acid | Lactate (LA) | 10 mM |
| Ketone | β-hydroxy butyric
acid (βOHB) | 0.5 mM |
| TCA cycle
intermediate | α-ketoglutarate
(αKG) | 2.0 mM |
MTT assay
Cell viability was assessed using the MTT assay. The
tetrazolium salt MTT is metabolized to insoluble purple formazan
crystals in the mitochondria, which can be quantified upon
solubilization using a spectrophotometer. The incubation medium was
replaced with a medium containing MTT (0.5 mg/ml) 3 h before
analysis. After the 3-h incubation period, the medium was replaced
with dimethyl sulfoxide (250 µl/well in a 24-well plate) to
dissolve the formazan crystals. The absorbance was measured at 570
nm using a microplate reader (Multiskan FC; Thermo Fisher
Scientific JP, Tokyo, Japan).
Reverse transcription-quantitative PCR
(RT-qPCR)
Total RNA was isolated from cells using the RNAiso
Plus reagent (TAKARA BIO, Shiga, Japan), and first-strand cDNA was
synthesized using the ReverTra Ace qPCR RT Master Mix (TOYOBO,
Osaka, Japan), according to the manufacturer's instructions. qPCR
was performed using TB Green Premix Ex Taq II (TAKARA BIO) in 10-µl
reactions on a StepOne Plus Real-Time PCR System (Thermo Fisher
Scientific). The qPCR cycling conditions were as follows: One cycle
of 30 sec at 95°C, followed by 40 cycles of 5 sec at 95°C, and
finally, one cycle of 30 sec at 60°C. Gene expression was
normalized to that of a standard housekeeping gene (β-actin)
and analyzed with the 2−ΔΔCq method (23). Experiments were performed in
duplicate. The primer sequences are listed in Table SI.
Western blotting
Cells were washed and lysed with 50 µl of lysis
buffer [1% Triton X-100, 0.45% sodium pyrophosphate, 100 mM NaF, 2
mM Na3VO4, 50 mM HEPES (pH 8.0), 147 mM NaCl,
1 mM EDTA, and a protease inhibitor mixture (cOmplete;
Sigma-Aldrich, Tokyo, Japan)]. Then, the lysed cells were
centrifuged at 13,000 × g, 4°C, for 15 min to obtain the
supernatant, which was used as the cell lysate. Equal amounts of
cell lysate proteins were loaded (10 µg per lane) onto a 15%
acrylamide gel for microtubule-associated protein light-chain 3
(LC3) and onto a 10% acrylamide gel for other proteins, separated
by SDS-PAGE electrophoresis, and transferred onto PVDF membranes
(Hybond-P; GE Healthcare Life Science, Tokyo, Japan). The membranes
were blocked with Blocking One-P (Nacalai Tesque) for 60 min at
room temperature (22–24°C) and then incubated overnight (16–18 h)
at 4°C with primary antibodies against each of the following
proteins: LC3 (#2775), 70-kDa ribosomal protein S6 kinase (p70S6K;
#9202), phosphorylated-p70S6K (#9205), AMP-activated protein kinase
(AMPK; #2532), and phosphorylated-AMPK (#2535), all purchased from
Cell Signaling (Danvers, MA, USA), or β-actin (#sc47778; Santa Cruz
Biotechnology, Dallas, TX, USA). After washing with PBS containing
0.1% Tween 20 (TBS-T), the membranes were incubated with
horseradish peroxidase-conjugated secondary antibodies for 1 h at
room temperature (22–24°C). Specific proteins were detected by
chemiluminescence using the ECL Select Western Blotting Detection
Reagent (GE Healthcare). Images were captured and quantified using
the iBright Imaging System (Thermo Fisher Scientific JP).
Fluorescence imaging of myotubes
Differentiated C2C12 cells were fixed and
permeabilized for 10 min at room temperature (22–24°C) using 1%
Triton-X containing 4% paraformaldehyde in PBS. Then, the cells
were incubated with MF-20 anti-MHC antibody (1:100; Hybridoma Bank,
Iowa, IA, USA) for 90 min at room temperature, washed with PBS-T,
and incubated for 1 h with fluorescein isothiocyanate-conjugated
anti-mouse IgG (1:500; #115-095-062; Jackson ImmunoResearch, West
Grove, PA, USA). For each condition, representative images of the
cells were captured using a 10× objective lens on a fluorescence
microscope (BZ-X700; Keyence, Osaka, Japan).
Analysis of ATP production and
glycolytic capacity
Cellular ATP production and glycolytic capacity were
evaluated using the Glycolysis/OXPHOS Assay Kit (G270; Dojindo,
Kumamoto, Japan), following the manufacturer's instructions.
Differentiated myotubes were incubated without or with 2.5 µM
oligomycin (an inhibitor of the mitochondrial respiratory chain) in
a 96-well culture plate for 3 h. Then, ATP working solution was
added to each well to assess ATP production. The plate was
incubated for 10 min at 25°C, and relative ATP content was measured
as luminescence intensity, using a multimode plate reader (EnSpire,
Perkin Elmer Japan, Yokohama, Japan).
Statistical analysis
Data are expressed as the mean ± standard error of
the mean. All statistical analyses were performed using the IBM
SPSS Statistics for Windows (version 29; IBM Japan, Tokyo, Japan).
The unpaired Student's t-test was used to identify significant
differences between two groups, and one-way analysis of variance
followed by Tukey's post-hoc test was performed to determine
differences among three or more groups. P<0.05 was considered to
indicate a statistically significant difference.
Results
Nutrient starvation suppresses
mitochondrial activity in muscle cells
Mitochondrial dehydrogenases reduce MTT to formazan;
thus, formazan production depends on the redox activity of the cell
and reflects mitochondrial function (24). Consequently, the amount of formazan
produced can be interpreted as an indicator of mitochondrial
activity and can also be used to assess cell viability. In this
study, the mitochondrial activity of C2C12 myotubes was suppressed
by incubation in the starvation medium in a time-dependent manner
(Fig. 1A). After 3, 8, and 24 h of
starvation, the mitochondrial activity in myotubes decreased to
approximately 60, 44, and 7%, respectively, when compared with that
in untreated cells. The decrease in cell viability after 5 h of
starvation was restored to levels comparable to those of control
cells by replacing the medium with regular DMEM for 3 h (Fig. 1B). This indicates that short-term
starvation of up to 5 h causes temporary suppression of
mitochondrial activity rather than irreversible cell damage. In
contrast, the decrease in cell viability after 8 h of starvation
was not fully recovered by replacing the medium with regular DMEM
(Fig. 1B). This irreversible
decline in mitochondrial activity became more pronounced with
longer starvation times (Fig. 1B),
suggesting a transition from reversible suppression of
mitochondrial respiration to irreversible cell damage due to
prolonged starvation.
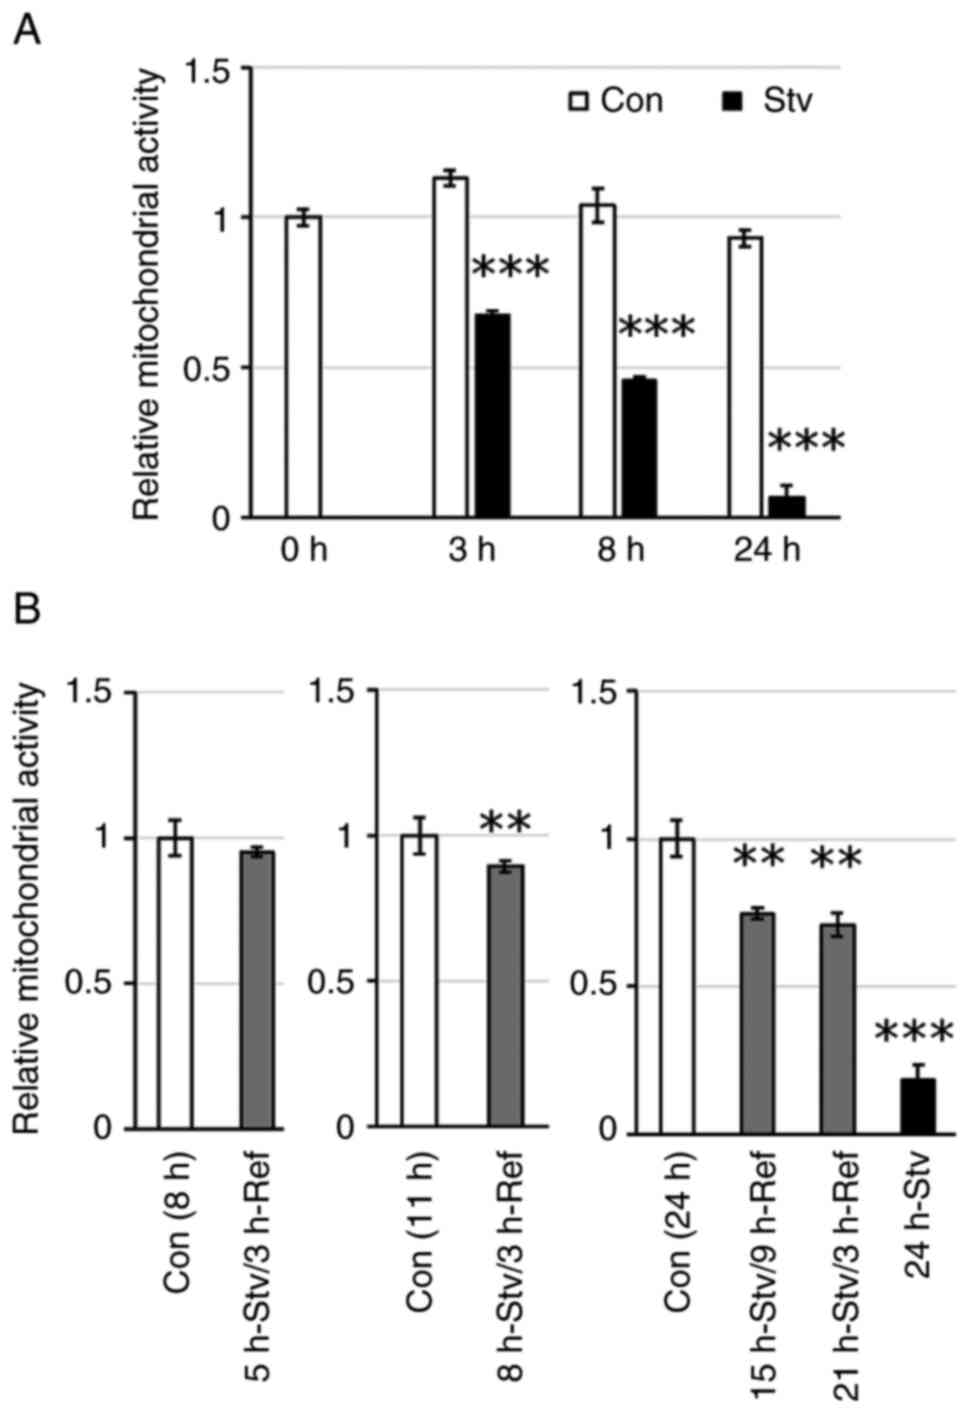 | Figure 1.Effect of starvation duration on
metabolic activity. (A) Cells were incubated in starvation medium
for 3, 8, or 24 h. (B) Cells were incubated in starvation medium
for 5, 8, 15, 21, or 24 h, followed by the replacement of the
medium with regular DMEM and incubated for an additional 3 or 9 h.
Control cells were incubated in regular DMEM for the same duration.
Metabolic activity was assessed by MTT assay, and the values are
expressed as fold-change compared with the values for control
cells. Values represent the mean ± SEM (n=4-6). **P<0.01,
***P<0.001 vs. control cells at the same time point. Con,
control; Stv, starvation; Ref, refeeding. |
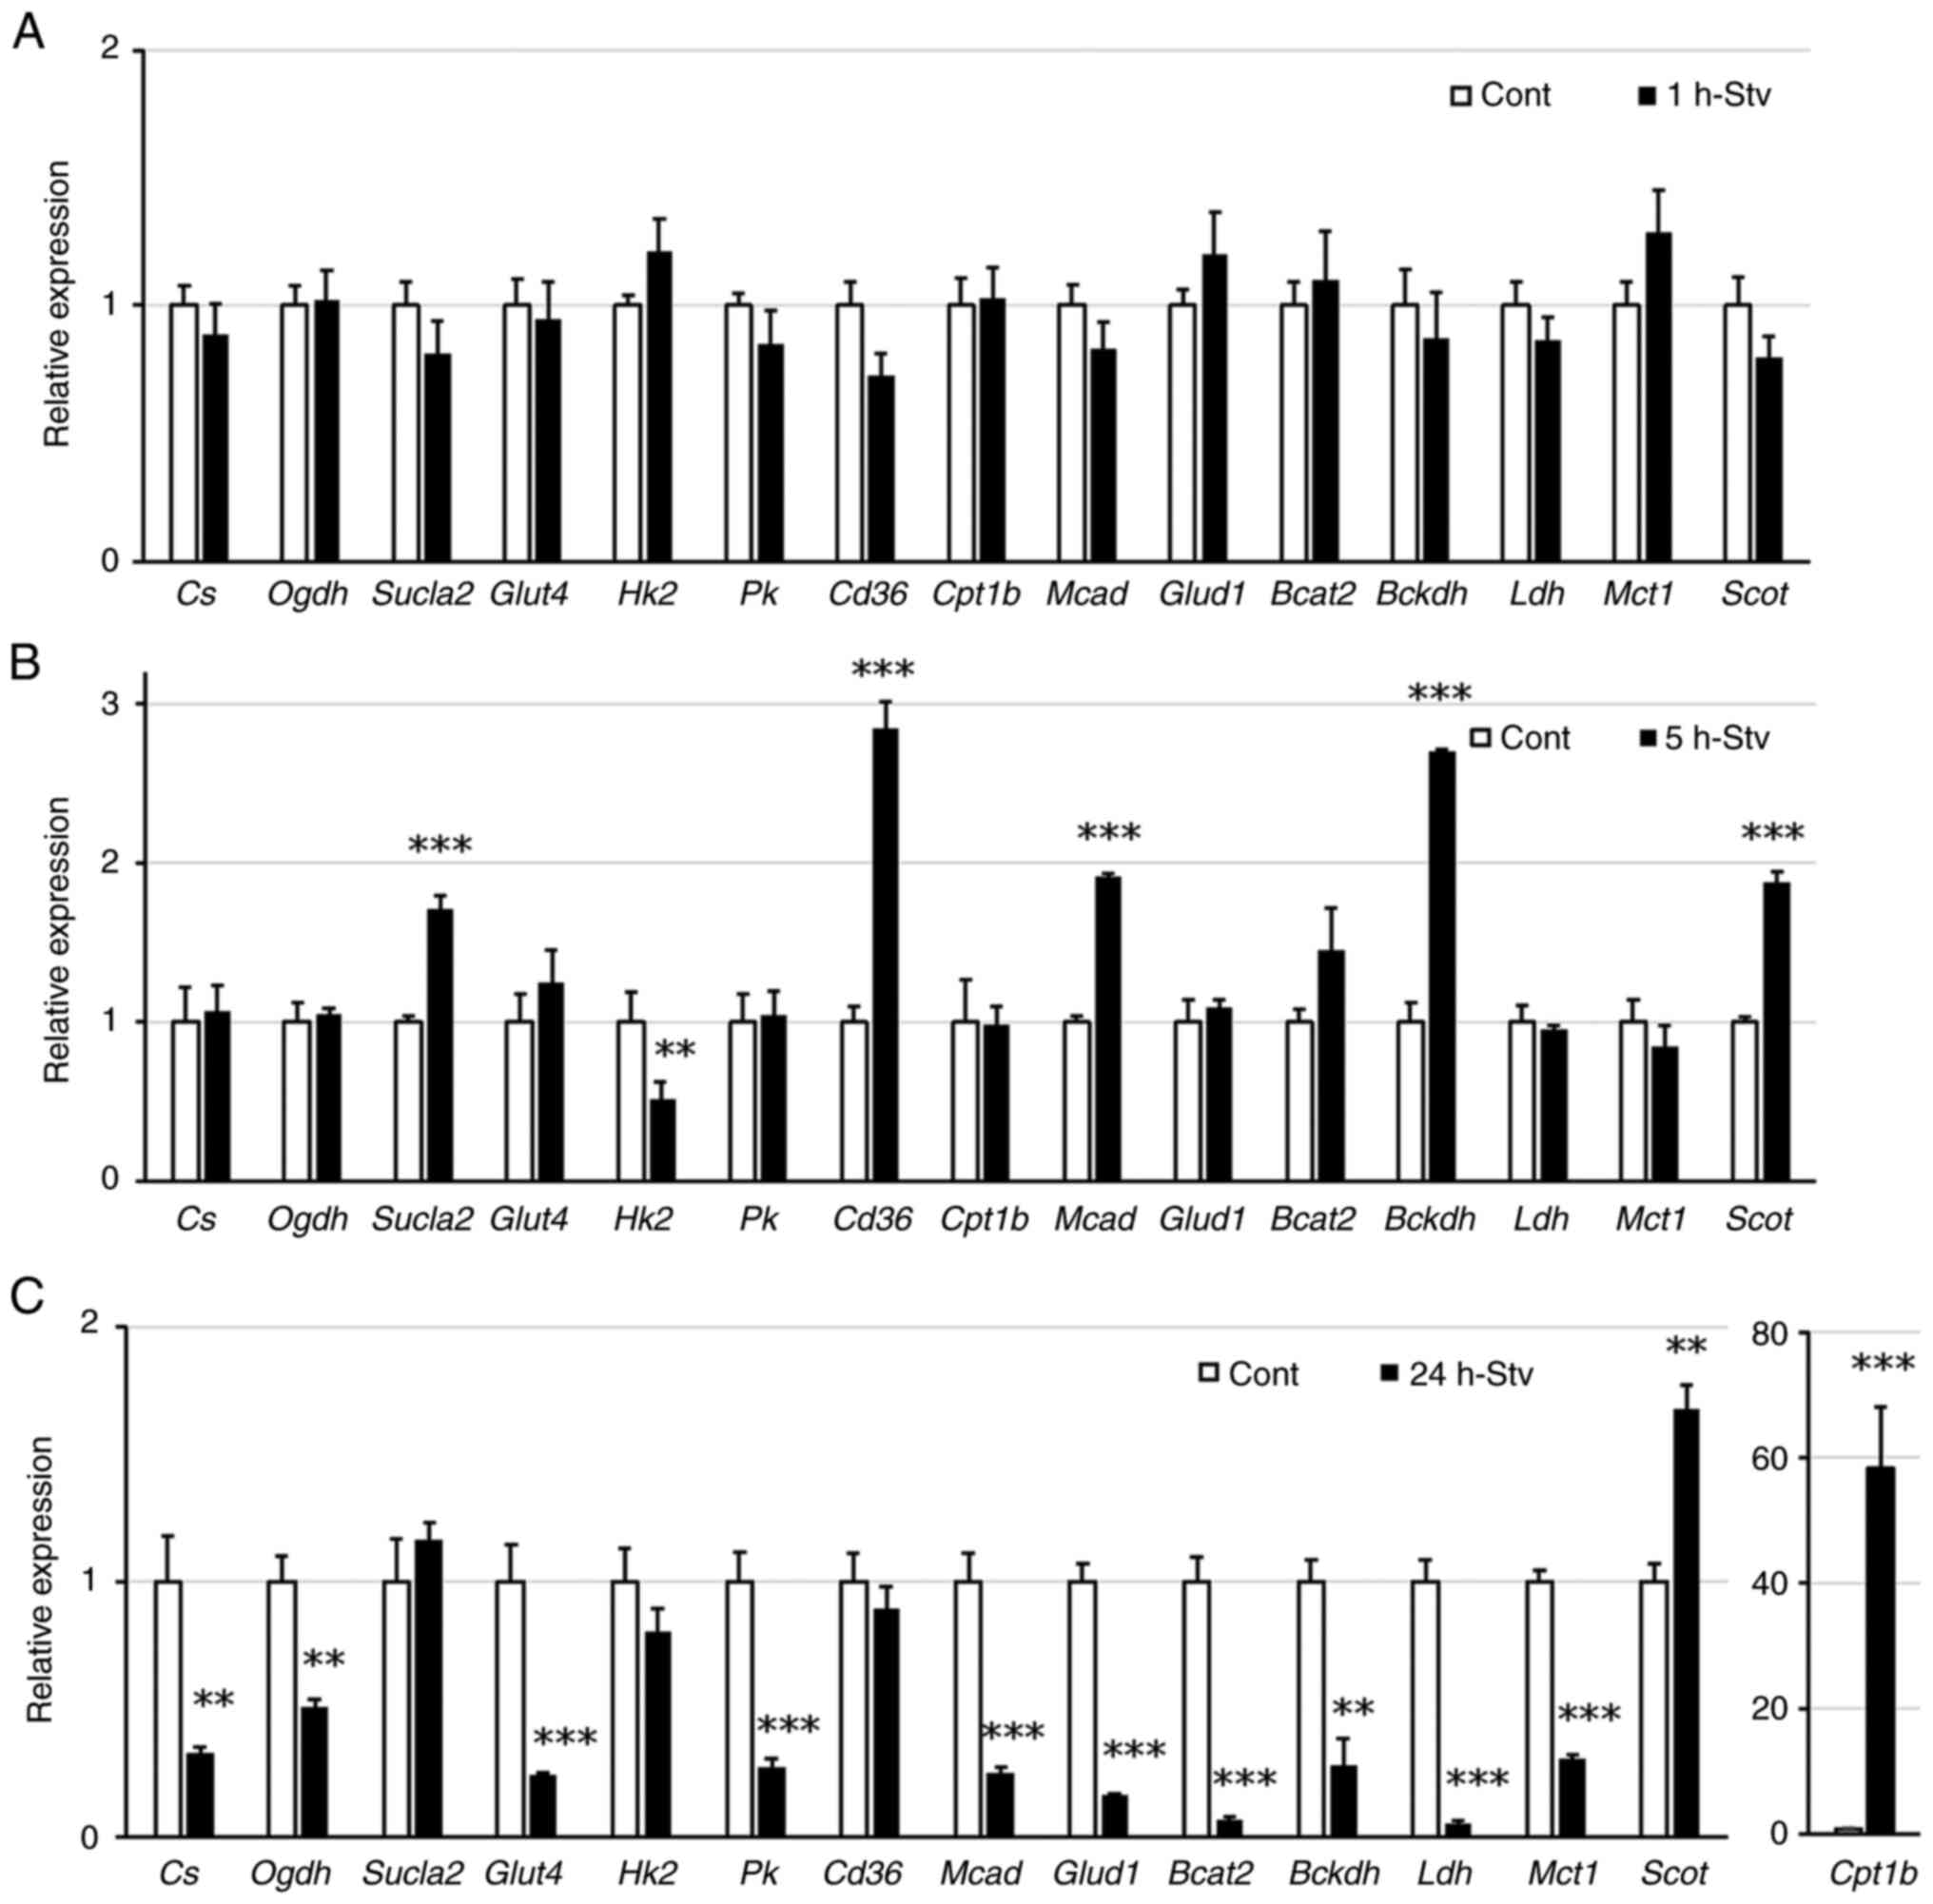
Nutrient starvation directly affects
the expression of genes related to substrate metabolism in muscle
cells
To evaluate the cellular metabolic response to
nutrient starvation, we examined the expression levels of key
metabolic genes using RT-qPCR. The names and roles of these genes
are listed in Table SI. After 1 h
of starvation, none of the genes tested showed a significant change
in their expression levels (Fig.
2A). After 5 h of starvation, the gene expression of hexokinase
2 (Hk) was suppressed, whereas that of several genes
involved in the uptake and degradation of fuel substrates, such as
succinate-CoA ligase, subunit β (Sucla2), cluster of
differentiation 36 (Cd36), medium-chain acyl-CoA
dehydrogenase (Mcad), branched chain α-keto acid
dehydrogenase E1α (Bckdha), and succinyl CoA 3-oxoacid CoA
transferase (Scot), increased (Fig. 2B). In contrast, the expression of
most metabolic genes was suppressed after 24 h of starvation, with
the exception of Scot and carnitine palmitoyl transferase
1-b (Cpt1b), the latter showing a notable increase in
expression (Fig. 2C).
Nutrient starvation regulates
signaling pathways involved in protein metabolism in muscle
cells
The balance between protein degradation and
synthesis is crucial for maintaining muscle mass and is regulated
by the energy status of muscle tissue. Therefore, we investigated
alterations in protein metabolism. After 1 h of starvation, the
expression levels of atrogin-1 (Atg1) and muscle ring finger
1 (Murf1), which contribute to muscle proteolysis, remained
unchanged. However, after 5 h of starvation, the expression levels
of these genes increased significantly, accompanied by a trend
toward AMPK activation (P=0.07) (Fig.
3A and B), whereas the LC3II/LC3I ratio, a representative
autophagy marker, showed no change (Fig. 3B).
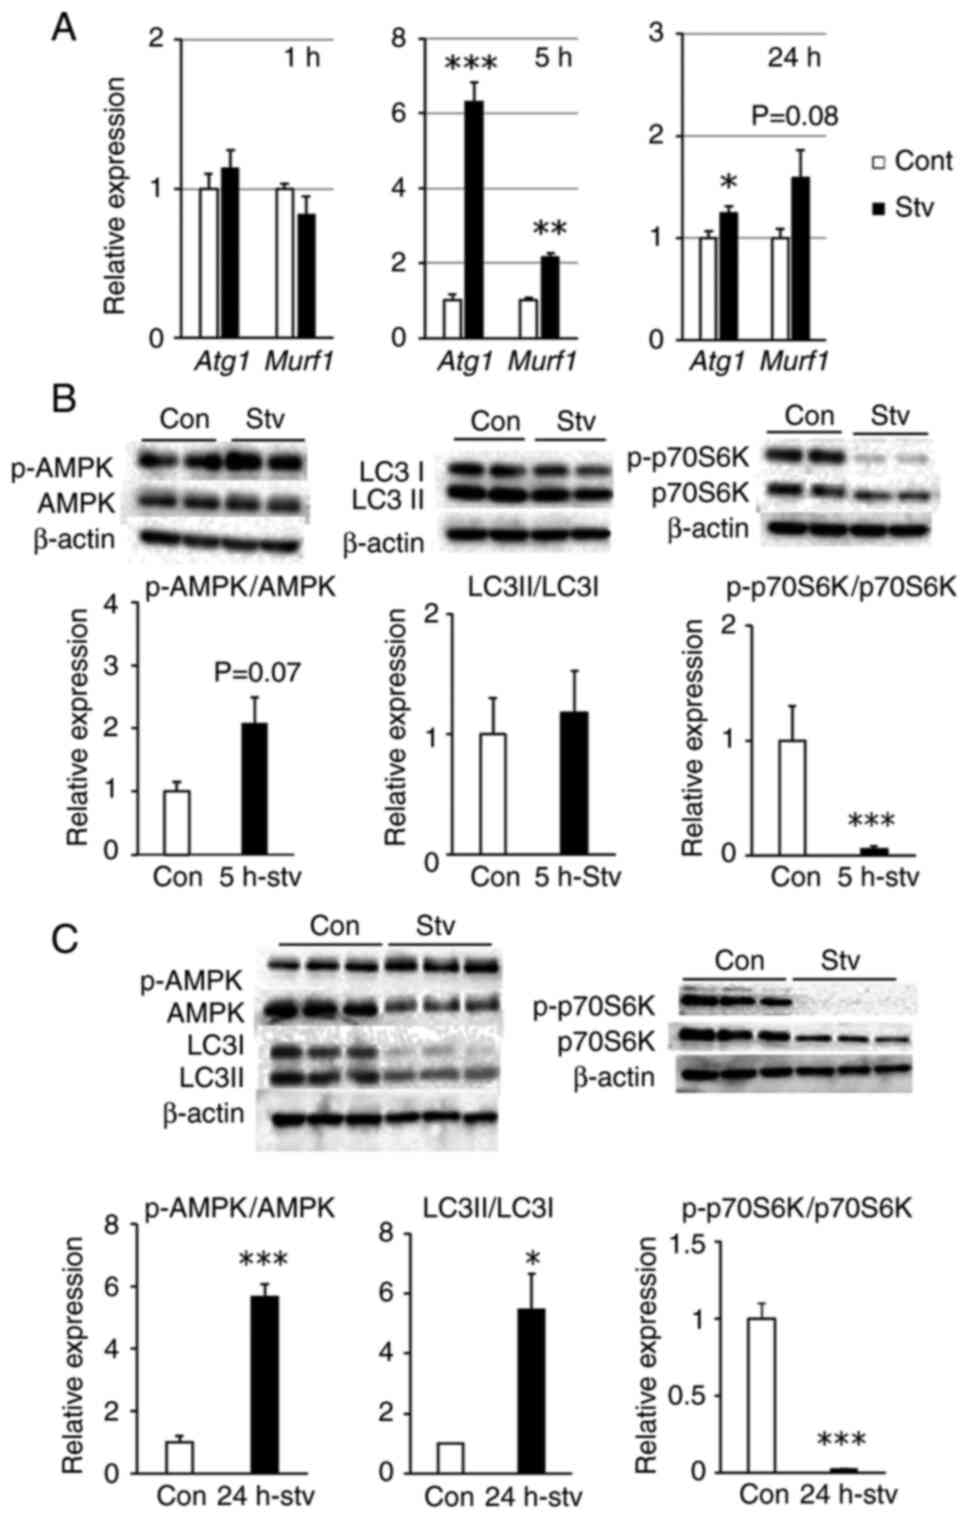 | Figure 3.Effect of starvation on protein
synthesis and degradation. Cells were incubated in starvation
medium for 1, 5, or 24 h. (A) The relative mRNA expression of Atg1
and Murf1 was quantified by reverse transcription-quantitative PCR.
(B and C) Protein phosphorylation levels of AMPK and p70S6K, and
the protein expression ratio of LC3II/LC3I after (B) 5, or (C) 24 h
of starvation were analyzed by western blotting. Representative
blot images are shown in the upper part. Values are expressed as
fold-change compared with the values of control cells incubated in
regular DMEM. Values are presented as the mean ± SEM (n=3).
*P<0.05, **P<0.01, ***P<0.001 vs. control. Atg1,
atrogin-1; Con, control; Murf1, muscle ring finger 1; p-,
phosphorylated; Stv, starvation. |
After 24 h of starvation, Atg1 and
Murf1 expression remained elevated when compared with that
in controls; however, the difference was less pronounced than that
after 5 h of starvation (Fig. 3A).
In contrast, the LC3II/LC3I ratio increased significantly,
accompanied by a marked increase in AMPK activity (Fig. 3C). Regarding protein synthesis, the
activity of p70S6K, which enhances the protein synthesis pathway,
was significantly suppressed after both 5 and 24 h of starvation
(Fig. 3B and C). In addition, the
protein levels of AMPK, LC3, and p70S6K decreased after 24 h of
starvation. When cultured cells are deprived of serum, a selective
proteolytic pathway is activated for specific proteins, which
applies to approximately 30% of cytosolic proteins (25,26).
Therefore, these proteins may have been partially degraded by this
pathway.
Glc, Gln, LA, and αKG alleviated
mitochondrial inactivity and alteration of metabolic gene
expression in starved muscle cells
Next, we evaluated whether any of the nutrient
substrates could improve the metabolic disturbances induced by
nutrient starvation. MTT assay was utilized to assess the toxic
effects of each nutrient at the concentrations used on
mitochondrial function in myotubes maintained in a differentiation
medium. PA treatment significantly impacted mitochondrial activity
after 24 h of incubation (Fig.
4A); therefore, we excluded PA from further studies.
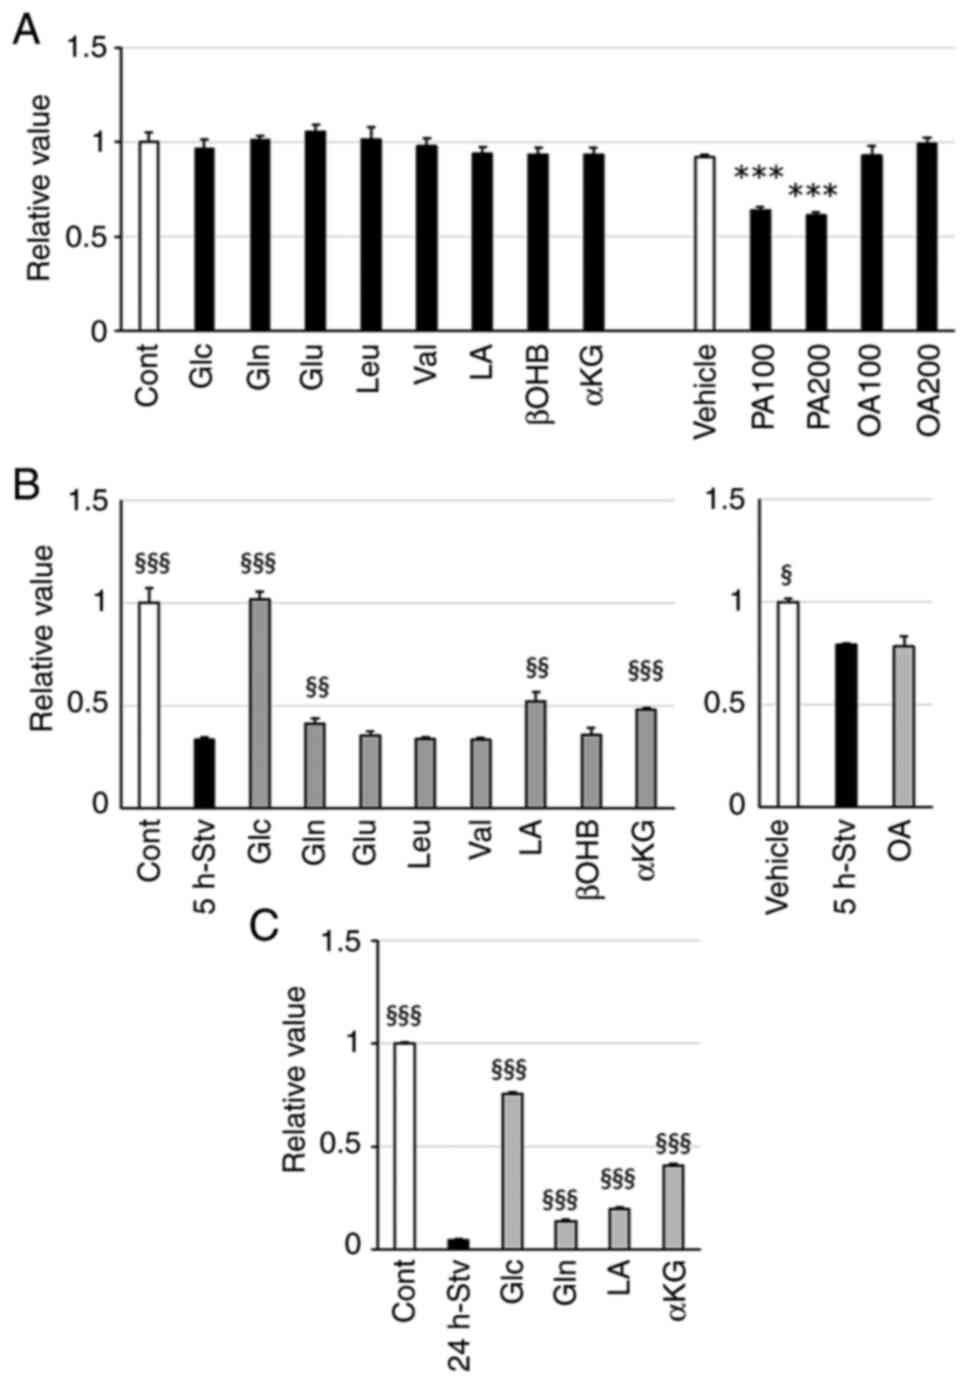 | Figure 4.Effect of single nutrient
supplementation on metabolic activity. (A) Cells were incubated in
regular DMEM supplemented with the indicated nutrient for 24 h. (B
and C) C2C12 myotubes were cultured in starvation medium only or
with the indicated nutrient for (B) 5 or (C) 24 h. Albumin and NaOH
were added as vehicle controls in both regular and starvation media
in the experiment for the fatty acid (PA and OA). Metabolic
activity was assessed using the MTT assay. Values are expressed as
fold-change compared with the values of the control cells incubated
in regular DMEM. Values are presented as the mean ± SEM (n=3-4).
***P<0.001 vs. vehicle control; §P<0.05,
§§P<0.01, §§§P<0.001 vs. starved cells
in the same group. Cont, control; Vehicle, vehicle control; Stv,
starvation; Glc, glucose; Gln, glutamine; Glu, glutamic acid; Leu,
leucine; Val, valine; LA, lactate; βOHB, β-hydroxy butyric acid;
αKG, α-ketoglutarate; PA, palmitic acid; OA, oleic acid. |
Glc replacement notably recovered the decrease in
mitochondrial activity induced by 5 h of starvation, as expected.
Starvation-induced metabolic inactivity in mitochondria was also
attenuated by adding Gln, LA, or αKG to the starvation medium.
However, other substrates did not achieve similar improvements at
the tested concentrations (Fig.
4B). Even after 24 h of starvation, which caused suppression of
redox activity to less than 5% of that of control cells, the
addition of each of these four substrates (Glc, Gln, LA, or αKG)
alleviated the decline in mitochondrial activity to varying extents
(Fig. 4C).
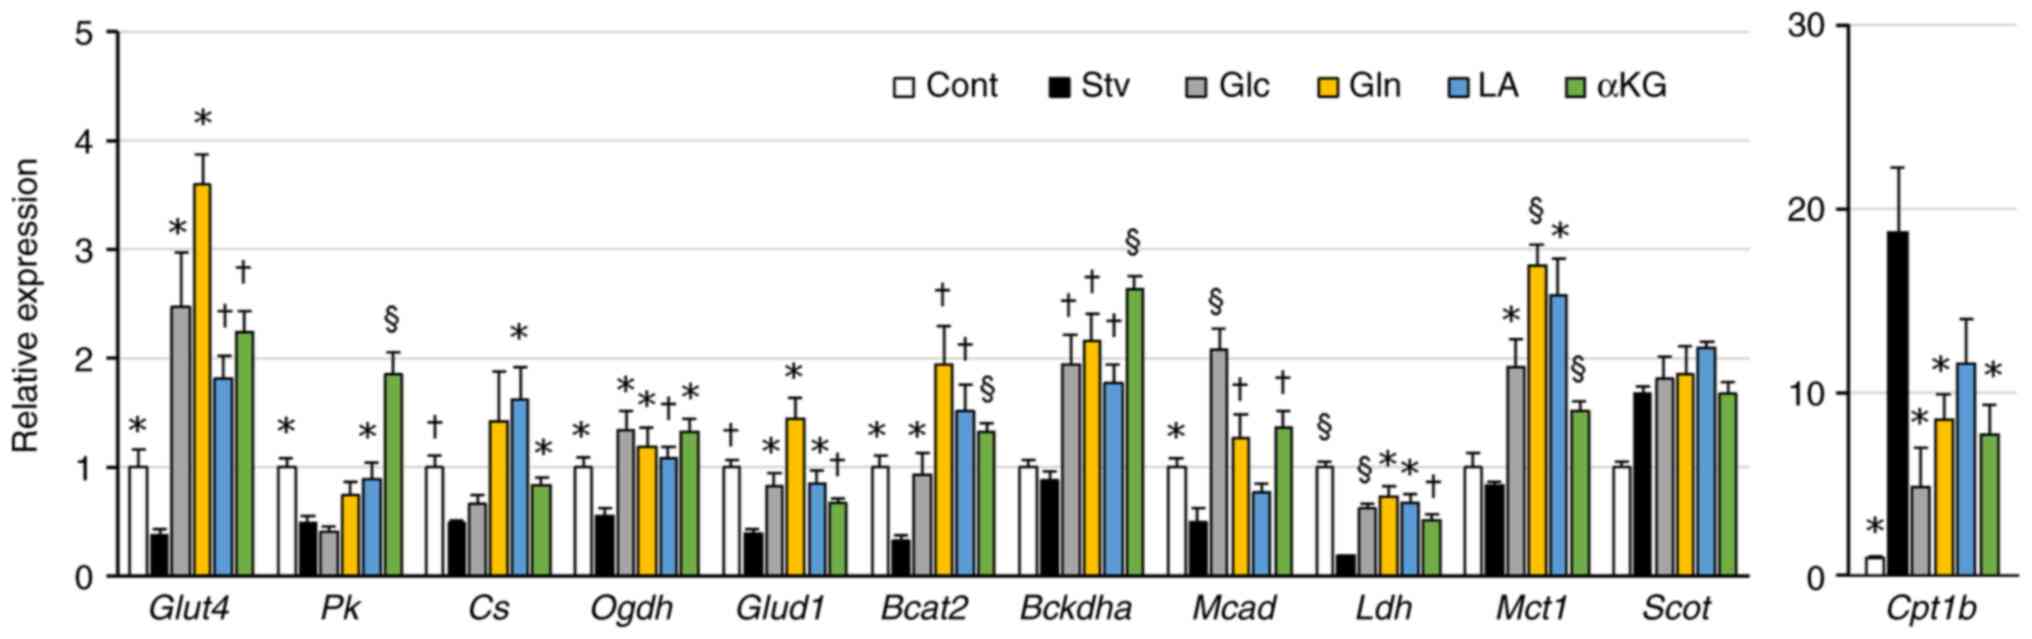
We also examined the expression levels of genes
whose expression changed after the cells were starved for 24 h. All
four substrates tested (Glc, Gln, LA, or αKG) attenuated the
decrease in the expression of the following genes in starved cells:
Glucose transporter 4 (Glut4), oxoglutarate dehydrogenase
(Ogdh), glutamate dehydrogenase 1 (Glud1),
branched-chain amino transaminase 2 (Bcat2), Bckdha,
lactate dehydrogenase (Ldh), and monocarboxylic acid
transporter 1 (Mct1) (Fig.
5). Additionally, LA or αKG attenuated fasting-induced decrease
in the expression of pyruvate kinase (Pk) and citrate
synthase (Cs). Glc, Gln, or αKG attenuated that of
Mcad, while they suppressed the fasting-induced increase in
Cpt1b expression (Fig.
5).
Glc, Gln, LA, and αKG inhibit protein
degradation and promote protein synthesis in starved muscle cells,
thereby alleviating myotube atrophy
We examined the effects of selected nutrients,
including βOHB, which generates acetoacetic acid as a substrate for
SCOT, and Leu, as a major activator of anabolic signaling, to
compare anabolic and catabolic signals. The expression of genes
related to the ubiquitin-proteasome system, which peaked in fasted
cells after 5 h of starvation, was suppressed upon treatment with
Glc, Gln, or αKG (for Atg1), and with Gln, LA, or αKG (for
Murf-1) (Fig. 6A). The
increase in AMPK activity after 24 h of starvation was
significantly inhibited by the administration of Glc, Gln, LA, or
αKG, but not by that of βOHB or Leu (Fig. 6B). After 24 h of starvation, the
enhancement of autophagy, as assessed by the LC3II/LC3I ratio, was
inhibited by Glc, LA, or αKG treatment, while the inhibition of
protein synthesis, as assessed by phosphorylation of p70S6K, was
restored by treatment with all the tested substrates, except βOHB
(Fig. 6B).
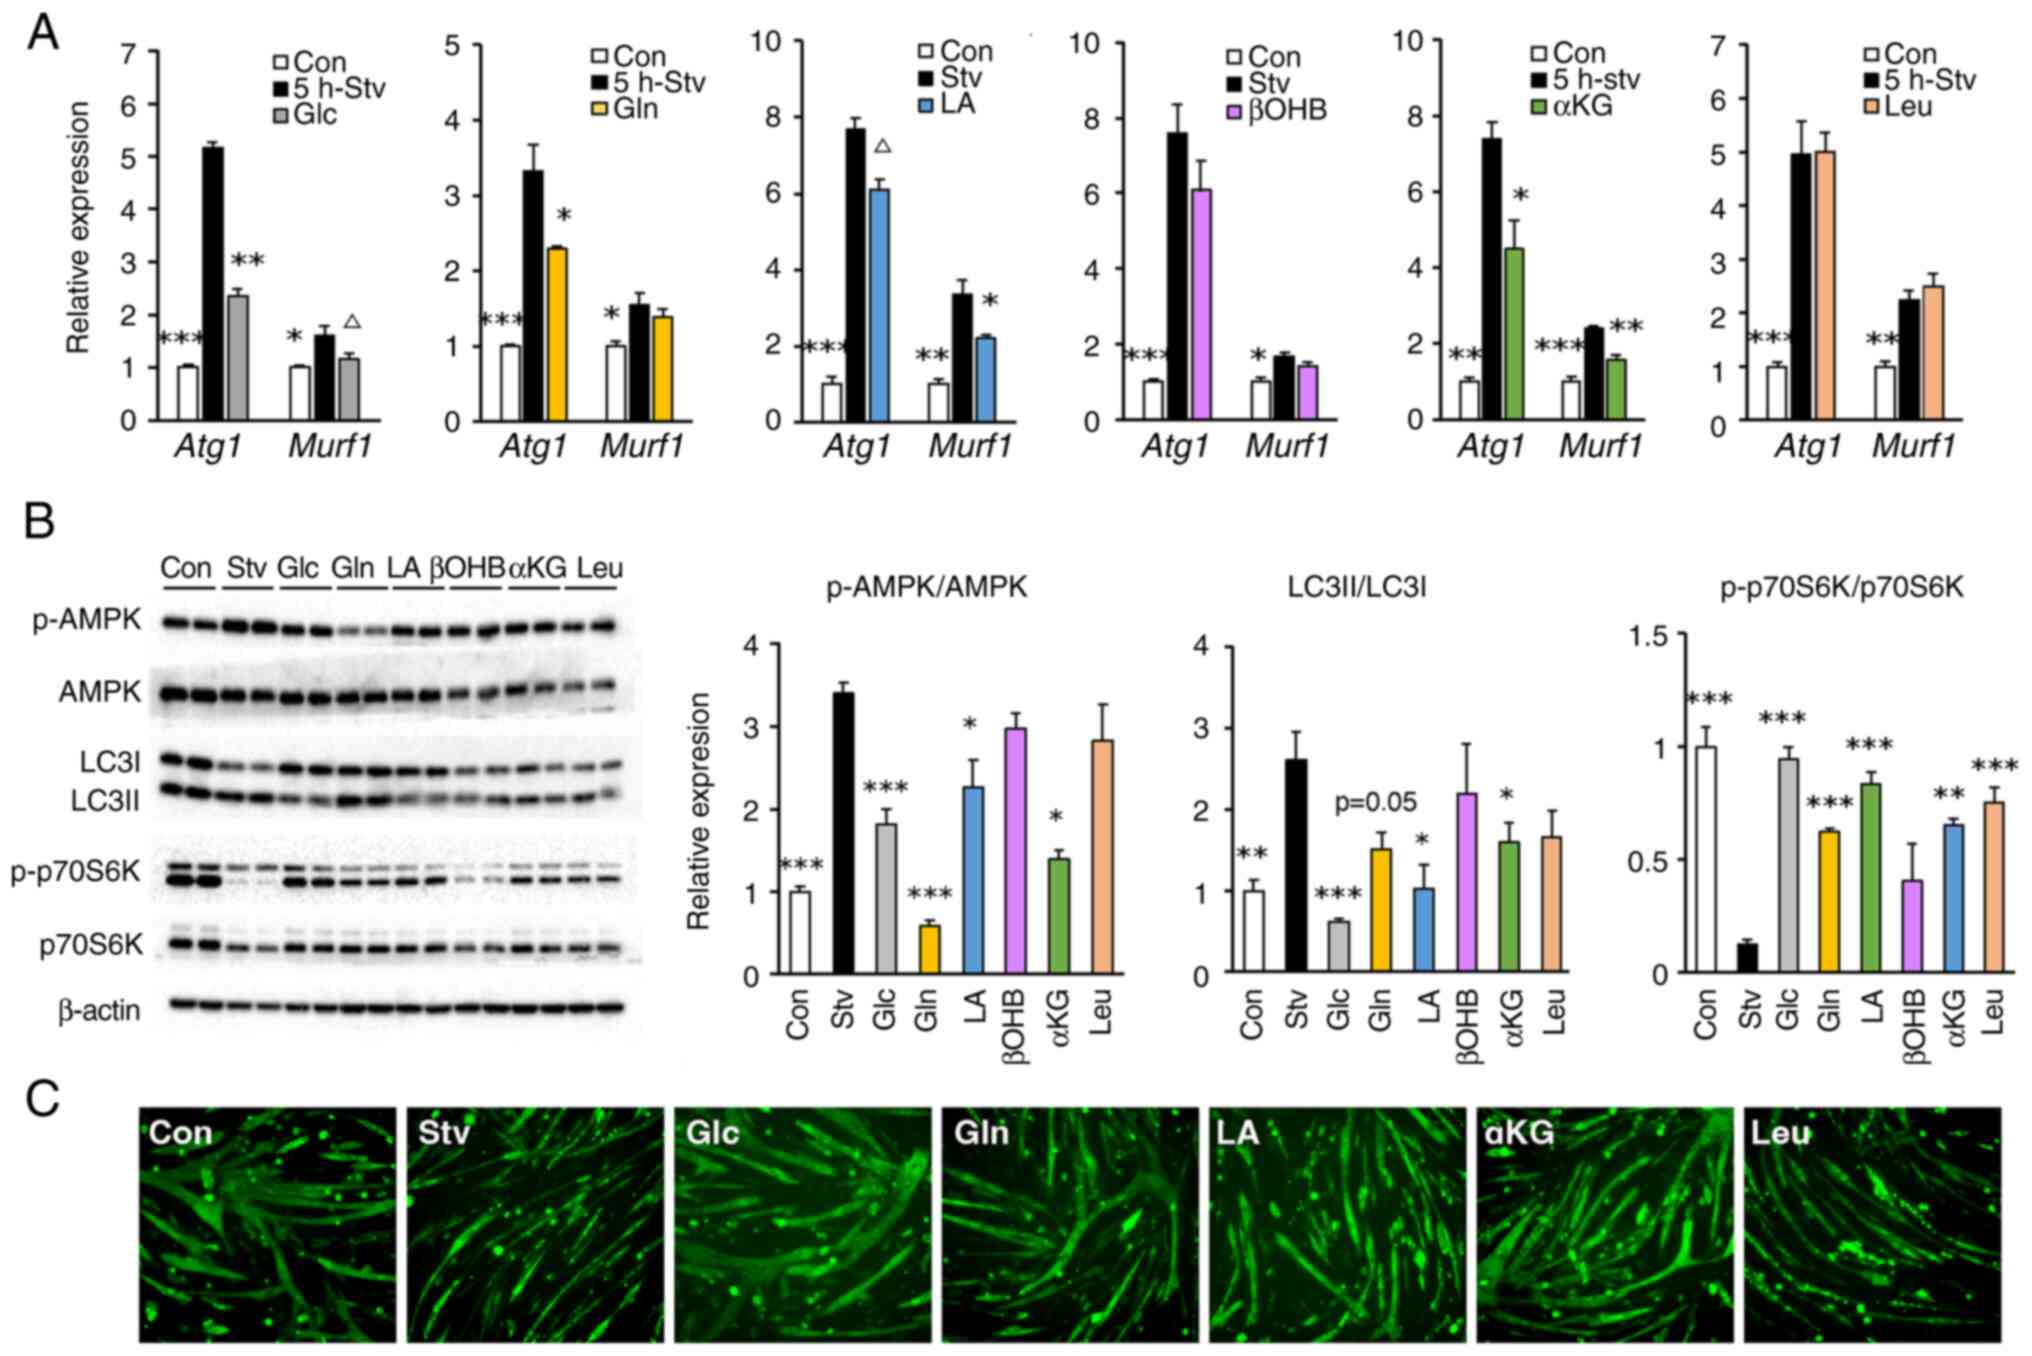 | Figure 6.Effect of single nutrient
supplementation on protein metabolism and morphological atrophy.
Cells were incubated in starvation medium with (colored bars) or
without (black bars) the indicated nutrients for (A) 5 or (B and C)
24 h. (A) Relative mRNA expression of Atg1 and Murf1 was quantified
by reverse transcription-quantitative PCR. (B) Protein
phosphorylation levels of AMPK and p70S6K, and the protein
expression ratio of LC3II/LC3I were analyzed by western blotting.
Representative blot images are shown on the left side. (C)
Representative fluorescence images of MHC antibody-stained myotubes
at ×200 magnification were captured using a fluorescence microscope
(BZ-X700; Keyence). Values are expressed as fold-change compared
with the values of the control cells incubated in regular DMEM.
Values are presented as mean ± SEM (n=3-4). ΔP<0.1,
*P<0.05, **P<0.01, ***P<0.001 vs. starved cells. Atg1,
atrogin-1; Con, control; Murf1, muscle ring finger 1; p-,
phosphorylated; Stv, starvation; Glc, glucose; Gln, glutamine; LA,
lactate; βOHB, β-hydroxy butyric acid; αKG, α-ketoglutarate; Leu,
leucine. |
Additionally, we evaluated the effect of nutrients,
which restored the starvation-induced inhibition of p70S6K
phosphorylation on myotube morphology (Fig. 6C). Generally, atrophy occurs when
protein breakdown exceeds protein synthesis in muscle cells.
Consistent with the results for anabolic and catabolic signaling in
the previous section, the incubation of cells in the starvation
medium for 24 h led to severe myotube atrophy. Notably, treatment
with Glc not only prevented fasting-induced atrophy but also
promoted hypertrophic changes in myotubes. Treatment with Gln, LA,
or αKG also prevented myotube atrophy but to a lesser extent than
that with Glc. Unexpectedly, Leu showed no protective effects
against myotube atrophy caused by nutrient starvation.
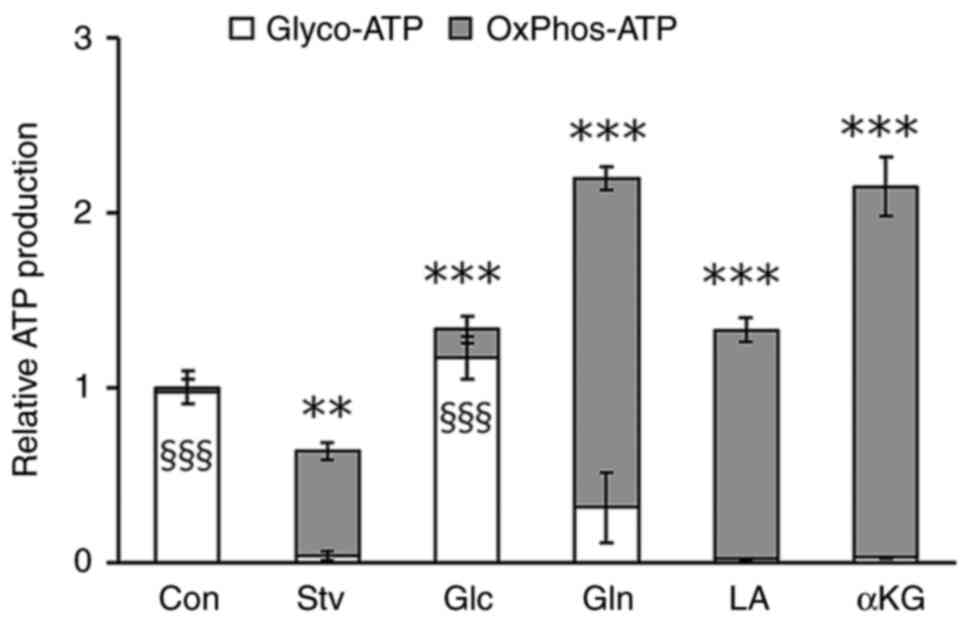
Gln, LA, and αKG enhance ATP
production in starved muscle cells via oxidative
phosphorylation
Finally, we investigated the metabolic pathways
through which each nutrient contributes to cellular energy
production. In the regular differentiation medium, ATP production
in myotubes primarily relied on glycolysis. After 24 h of
starvation, glycolytic ATP production significantly decreased,
leading to a reduction in total ATP production; however, ATP
production by oxidative phosphorylation (OxPhos) increased
(Fig. 7). This indicates that
nutritional inadequacy triggers a metabolic shift in muscle cells.
The starvation-induced decrease in intracellular ATP production was
fully restored by the addition of Glc, Gln, LA, or αKG to the
starvation medium, resulting in higher intracellular ATP production
when compared with that in control cells. This restoration of ATP
production was primarily driven by the recovery of glycolysis in
Glc-treated cells, whereas it was facilitated by an increase in
OxPhos-derived ATP generation in cells treated with Gln, LA, or αKG
(Fig. 7).
Discussion
In muscle tissues under starvation conditions, the
rate of protein degradation exceeds the rate of protein synthesis,
leading to a decrease in skeletal muscle mass. To assess muscle
cell biology in atrophied muscles, myocytes derived from C2C12
cells deprived of nutrient substrates have been utilized (20,27–30).
However, starvation conditions varied across these studies; either
saline (PBS or HEPES buffered saline) containing only inorganic
salts (28,29) or containing 2% horse serum
(20) was used as the starvation
medium, or serum-free DMEM with (27) or without (30) Glc. We confirmed that 6 h of
incubation with PBS resulted in the detachment of more than half of
the cells from the bottom of the dish. In contrast, incubation with
serum-free DMEM for up to 24 h had no effect on cell morphology
(data not shown). Therefore, in this study, we utilized DMEM as the
starvation medium, wherein the serum and main energetic nutrients
are absent, following the method used by Zeidler et al
(31). The authors stated that
short-term starvation in such a medium was an appropriate approach
for evaluating the influence of fuel substrates on cellular
metabolism.
Short-term (1 h) starvation using this medium did
not impact mitochondrial metabolic activity in C2C12 myotubes, as
assessed by the MTT assay. Similarly, 1 h of starvation caused no
changes in the expression levels of the metabolic genes that were
tested. These findings, consistent with the results of a previous
study (31), suggest that a 1-h
starvation period is unlikely to induce adaptive changes as the
presence of residual substrates within the cells prevents energy
depletion. Extending the starvation period to 5 h led to a
reversible decrease in mitochondrial activity and an increase in
the expression of genes involved in fuel utilization, particularly
Sucla2, Cd36, Mcad, Bckdha, and Scot. CD36 is a
glycoprotein that facilitates FA transport into cells, and MCAD is
an enzyme that catabolizes FA. Both of these play a role in FA
oxidation for mitochondrial ATP production (32). Studies have shown that the
expression of genes related to FA oxidation, including these two,
is upregulated in skeletal muscles during starvation across several
animal species (33–35). During starvation, animal bodies
attempt to maintain ATP production by rapidly shifting fuel
substrates from glucose to lipids (13). This aligns with our findings of
increased Cd36 and Mcad expression and decreased
Hk2 expression, a key enzyme for glycolysis, supporting this
adaptive phenomenon. Additionally, BCKDHA and SCOT metabolize
branched-chain amino acids and ketone bodies, respectively,
providing substrates for TCA cycle, while SUCLA2 is an enzyme
involved the TCA cycle. Thus, the increased expression of these
genes may represent an adaptive response to enhance intracellular
substrate supply for mitochondrial ATP production.
In the present study, starvation for more than 8 h
led to partial irreversible cellular damage. Prolonged starvation
(24 h) suppressed the expression of almost all genes tested, which
contrasts the results of short-term (5 h) starvation. Consistently,
studies focusing on rodent muscles have reported that the
expression of genes involved in the catabolic pathway, such as
glycolytic flux and mitochondrial respiration, was suppressed by
prolonged starvation, and this suppression was enhanced with an
increase in starvation duration (36,37).
In contrast, Cpt-1 expression significantly increased after
24 h starvation. These results align with those obtained in studies
with C. elegans (38,39),
which reported that the expression of genes associated with
catabolic pathways, including the proteasome, OxPhos, and the
tricarboxylic acid (TCA) cycle, was suppressed in C. elegans
fasted for 16 h, while that of Cpt-1 was markedly elevated.
In these studies, survival rates during fasting reduced in the
Cpt-1 knockout individuals, suggesting that the elevation of
Cpt-1 expression may be a crucial biological response to
endure prolonged fasting. In the present study, the expression of
Scot, a key enzyme in ketone metabolism, remained elevated
even after 24 h of starvation. Nevertheless, in this study, a
ketone body, βOHB, could not ameliorate starvation-induced myotube
atrophy. Few studies have examined the changes in Scot expression
in starved muscles, but one study reported its upregulation in
chicken sartorius muscle after 24 h of fasting (40). Recently ketone bodies have been
reported to induce a quiescent state of muscle cells during
starvation to enhance their resilience (41). An increase in Scot
expression may play a role in ketone signaling to prevent muscle
cells from starvation-induced damage.
Regarding the effects of individual nutrients on
starvation, among those tested in this study, the addition of Glc,
Gln, LA, or αKG mitigated the decrease in metabolic activity
observed in myotubes subjected to 5 h of starvation.
Supplementation with each of these four nutrients attenuated
metabolic alterations, such as the decrease in mitochondrial
activity and changes in metabolic gene expression to varying
degrees, even after 24 h of starvation. In contrast, OA
administration did not improve cellular metabolism under starvation
conditions, despite a significant increase in the expression of
Cpt-1, a key molecule for transporting long-chain FAs into
the mitochondria, after prolonged nutritional deprivation. In the
OA supplementation experiments, starvation-induced metabolic
changes were not observed (Fig.
4B), probably due to the addition of albumin as a vehicle
control in the starvation medium, which may have masked any
potential effects of starvation or OA treatment.
The mechanism by which certain nutrients, such as
Glc, Gln, LA, and αKG, improve metabolic disturbance in muscle
cells may involve AMPK, a crucial sensor of energy status in
skeletal muscles. In the present study, ATP content decreased in
24-h-starved cells, leading to significant activation of AMPK,
while administration of Glc, Gln, LA, or αKG, but not βOHB and Leu,
suppressed this starvation-induced activation of AMPK. Activated
AMPK inhibits mTOR activity via phosphorylation of the adaptor
protein, Raptor (42), resulting
in decreased protein synthesis via inhibition of the mTOR/p70S6K
pathway (43) and increased
proteolysis via autophagy (44,45),
ultimately leading to muscle fiber atrophy. In the present study,
Glc, Gln, LA, or αKG inhibited AMPK activation, reversing the
reduction in protein synthesis and preventing autophagy, thereby
ameliorating the histological atrophy of myotubes caused by
starvation. These results suggest that Glc, Gln, LA, and αKG
contribute to ATP production, which inhibits AMPK activation,
thereby preventing muscle atrophy. Additionally, Glu and its
metabolite αKG have been reported to directly activate mTORC1,
promoting protein synthesis (46),
which may contribute to their beneficial effects on muscle cell
atrophy. On the other hand, Leu is also a potent stimulator of
mTORC1 (47,48) and is widely recognized as a crucial
nutritional factor for preventing muscle atrophy (49,50).
Leu administration could restore experimentally induced atrophy in
C2C12 myotubes (51,52). However, in the present study,
although Leu enhanced mTOR-S6K signaling, it was unable to
ameliorate the metabolic abnormalities and histological atrophy
induced by starvation. Thus, an adequate supply of ATP to muscle
cells may be essential for leveraging the potential of Leu as a
protein synthesis stimulator to prevent muscle atrophy.
In the present study, treatment with Glc not only
prevented starvation-induced atrophy but also promoted hypertrophic
changes in myotubes. Consistent with this, Nakai et al
(30) reported that addition of
Glc markedly increased the phosphorylation of p70S6K only in
starved C2C12 myotubes and that starvation-induced autophagy
accounts for the activation of p70S6K by adding Glc. Gln, LA, and
αKG, also improve atrophic changes in nutrient-deficient muscle
cells. These findings are consistent with those of several studies
demonstrating that these nutrients prevent muscle atrophy or
promote muscle hypertrophy both in vitro and in vivo
(53–57). These studies reported as the
underlying mechanisms that αKG as well as Gln directly activated
the mTOR pathway (53), or that
αKG inhibited proline hydroxylase 3 to stimulate β2 adrenergic
receptor (54). Regarding LA, Ohno
et al (57) proposed that
the activation of GPR81 (with LA acting as a ligand)-ERK signaling
in muscle cells is involved in the mechanistic pathway. Thus, Gln,
LA, or αKG may function not only as energy fuels but also as
signaling molecules that help to prevent muscle atrophy.
To maintain energy supply, energy-consuming organs
such as heart and muscles can switch between and adapt to energy
substrates in response to external or internal environmental
factors. Glucose is the most preferred energy substrate for
skeletal muscles and when a sufficient amount of glucose is
available after feeding, skeletal muscles increase glucose
utilization and storage while reducing fatty acid oxidation. In
contrast, when nutrient supply to the muscles is interrupted, such
as during starvation or sleep, the rate of fatty acid oxidation
rapidly increases (13,58). In addition, several nutrients other
than fatty acids, such as lactate and glutamine are also gaining
attention as alternative energy sources for muscles during fasting.
One study using intravenous infusions of 13C-labelled
nutrients showed that lactate contributes significantly to the TCA
cycle carbon in muscle tissues of fasted mice, suggesting it as a
primary source for maintaining muscle ATP levels (59). Additionally, Li et al
(60) reported that in the muscles
of fasted mice, glutaminolysis was upregulated before an increase
in FA oxidation, indicating the crucial role of a substrate shift
from glucose to glutamine in sustaining muscle energy supply under
starvation condition. Metabolic shifting is generally believed to
be regulated by neurogenic and serum factors, such as hormones.
However, in the present study, we observed a similar phenomenon in
cultured muscle cells-ATP production shifted from glycolysis to
OxPhos when nutrient supply was interrupted. Moreover, LA, Gln, and
its metabolite αKG effectively supported cellular ATP production
through OxPhos. This suggests that even in the absence of neural
and serum regulators, muscle cells can switch their metabolism
based on the available substrates.
In conclusion, we examined the metabolic
characteristics of various nutritional substrates and their
efficiency in C2C12 muscle cells under starvation conditions. Our
findings revealed that certain nutrients, such as Gln, LA, and αKG,
help to improve metabolic imbalances and counteract atrophic
changes caused by energy deprivation in muscle cells. To the best
of our knowledge, this is the first study to compare the effects of
multiple nutrients on metabolic changes in muscle cells
experiencing energy substrate deficiency. Our findings could
potentially be translated into an effective nutritional strategy to
prevent muscle atrophy.
Supplementary Material
Supporting Data
Acknowledgements
Not applicable.
Funding
This work was supported by JSPS KAKENHI (grant nos. JP23K20665
and JP24K22267) from the Japan Society for the Promotion of
Science, and partially supported by Morinaga Seika Co., Tokyo,
Japan.
Availability of data and materials
The data generated in the present study may be
requested from the corresponding author.
Authors' contributions
MI, MM and KI designed and conceived the study,
analyzed the results and drafted the manuscript. MI, MM and MT
conducted the experiments and collected the data. MK contributed to
the study design and supervised the experiments. KI supervised the
entire project and obtained the research grants. MI and KI confirm
the authenticity of all the raw data. All authors read and approved
the final version of the manuscript.
Ethics approval and consent to
participate
Not applicable.
Patient consent for publication
Not applicable.
Competing interests
The authors declare that they have no competing
interests.
Glossary
Abbreviations
Abbreviations:
|
AMPK
|
AMP-activated protein kinase
|
|
ATG1
|
atrogin-1
|
|
Glc
|
glucose
|
|
Gln
|
glutamine
|
|
Glu
|
glutamic acid
|
|
αKG
|
α-ketoglutarate
|
|
LA
|
lactate
|
|
LC3
|
microtubule-associated protein
light-chain 3
|
|
Leu
|
leucine
|
|
Murf1
|
muscle ring finger 1
|
|
OA
|
oleic acid
|
|
βOHB
|
β-hydroxy butyric acid
|
|
PA
|
palmitic acid
|
|
p70S6K
|
70-kDa ribosomal protein S6 kinase
|
|
Val
|
valine
|
References
|
1
|
Frontera WR and Ochala J: Skeletal muscle:
A brief review of structure and function. Calcif Tissue Int.
96:183–195. 2015. View Article : Google Scholar : PubMed/NCBI
|
|
2
|
Sieber CC: Malnutrition and sarcopenia.
Aging Clin Exp Res. 31:793–798. 2019. View Article : Google Scholar : PubMed/NCBI
|
|
3
|
Yuan S and Larsson SC: Epidemiology of
sarcopenia: Prevalence, risk factors, and consequences. Metabolism.
144:1555332023. View Article : Google Scholar : PubMed/NCBI
|
|
4
|
Owens DJ: Nutritional support to
counteract muscle atrophy. Adv Exp Med Biol. 1088:483–495. 2018.
View Article : Google Scholar : PubMed/NCBI
|
|
5
|
Wang Y, Liu Q, Quan H, Kang SG, Huang K
and Tong T: Nutraceuticals in the prevention and treatment of the
muscle atrophy. Nutrients. 13:19142021. View Article : Google Scholar : PubMed/NCBI
|
|
6
|
Hoffman EP and Nader GA: Balancing muscle
hypertrophy and atrophy. Nat Med. 10:584–585. 2004. View Article : Google Scholar : PubMed/NCBI
|
|
7
|
Sartori R, Romanello V and Sandri M:
Mechanisms of muscle atrophy and hypertrophy: Implications in
health and disease. Nat Commun. 12:3302021. View Article : Google Scholar : PubMed/NCBI
|
|
8
|
Carbone JW, Margolis LM, McClung JP, Cao
JJ, Murphy NE, Sauter ER, Combs GF Jr, Young AJ and Pasiakos SM:
Effects of energy deficit, dietary protein, and feeding on
intracellular regulators of skeletal muscle proteolysis. FASEB J.
27:5104–5111. 2013. View Article : Google Scholar : PubMed/NCBI
|
|
9
|
Pasiakos SM, Margolis LM and Orr JS:
Optimized dietary strategies to protect skeletal muscle mass during
periods of unavoidable energy deficit. FASEB J. 29:1136–1142. 2015.
View Article : Google Scholar : PubMed/NCBI
|
|
10
|
Gielen E, Beckwée D, Delaere A, De
Breucker S, Vandewoude M and Bautmans I; Sarcopenia Guidelines
Development Group of the Belgian Society of Gerontology Geriatrics
(BSGG), : Nutritional interventions to improve muscle mass, muscle
strength, and physical performance in older people: An umbrella
review of systematic reviews and meta-analyses. Nutr Rev.
79:121–147. 2021. View Article : Google Scholar : PubMed/NCBI
|
|
11
|
Bertero E and Maack C: Metabolic
remodelling in heart failure. Nat Rev Cardiol. 15:457–470. 2018.
View Article : Google Scholar : PubMed/NCBI
|
|
12
|
Lopaschuk GD, Karwi QG, Tian R, Wende AR
and Abel ED: Cardiac energy metabolism in heart failure. Circ Res.
128:1487–1513. 2021. View Article : Google Scholar : PubMed/NCBI
|
|
13
|
Olson B, Marks DL and Grossberg AJ:
Diverging metabolic programmes and behaviours during states of
starvation, protein malnutrition, and cachexia. J Cachexia
Sarcopenia Muscle. 11:1429–1446. 2020. View Article : Google Scholar : PubMed/NCBI
|
|
14
|
Mengeste AM, Rustan AC and Lund J:
Skeletal muscle energy metabolism in obesity. Obesity (Silver
Spring). 29:1582–1595. 2021. View Article : Google Scholar : PubMed/NCBI
|
|
15
|
Boya P, Reggiori F and Codogno P: Emerging
regulation and functions of autophagy. Nat Cell Biol. 15:713–720.
2013. View Article : Google Scholar : PubMed/NCBI
|
|
16
|
Deshmukh AS, Murgia M, Nagaraj N, Treebak
JT, Cox J and Mann M: Deep proteomics of mouse skeletal muscle
enables quantitation of protein isoforms, metabolic pathways, and
transcription factors. Mol Cell Proteomics. 14:841–853. 2015.
View Article : Google Scholar : PubMed/NCBI
|
|
17
|
Pavlovic K, Krako Jakovljevic N, Isakovic
AM, Ivanovic T, Markovic I and Lalic NM: Therapeutic vs
suprapharmacological metformin concentrations: Different effects on
energy metabolism and mitochondrial function in skeletal muscle
cells in vitro. Front Pharmacol. 13:9303082022. View Article : Google Scholar : PubMed/NCBI
|
|
18
|
Akhtar J, Han Y, Han S, Lin W, Cao C, Ge
R, Babarinde IA, Jia Q, Yuan Y, Chen G, et al: Bistable insulin
response: The win-win solution for glycemic control. iScience.
25:1055612022. View Article : Google Scholar : PubMed/NCBI
|
|
19
|
Yang B, Liu Y and Steinacker JM:
α-Ketoglutarate stimulates cell growth through the improvement of
glucose and glutamine metabolism in C2C12 cell culture. Front Nutr.
10:11452362023. View Article : Google Scholar : PubMed/NCBI
|
|
20
|
Desgeorges MM, Freyssenet D, Chanon S,
Castells J, Pugnière P, Béchet D, Peinnequin A, Devillard X and
Defour A: Post-transcriptional regulation of autophagy in C2C12
myotubes following starvation and nutrient restoration. Int J
Biochem Cell Biol. 54:208–216. 2014. View Article : Google Scholar : PubMed/NCBI
|
|
21
|
Li F, Li X, Peng X, Sun L, Jia S, Wang P,
Ma S, Zhao H, Yu Q and Huo H: Ginsenoside Rg1 prevents
starvation-induced muscle protein degradation via regulation of
AKT/mTOR/FoxO signaling in C2C12 myotubes. Exp Ther Med.
14:1241–1247. 2017. View Article : Google Scholar : PubMed/NCBI
|
|
22
|
Matsuba I, Fujita R and Iida K: Palmitic
acid inhibits myogenic activity and expression of myosin heavy
chain MHC IIb in muscle cells through phosphorylation-dependent
MyoD inactivation. Int J Mol Sci. 24:58472023. View Article : Google Scholar : PubMed/NCBI
|
|
23
|
Livak KJ and Schmittgen TD: Analysis of
relative gene expression data using real-time quantitative PCR and
the 2(−Delta Delta C(T)) method. Methods. 25:402–408. 2001.
View Article : Google Scholar : PubMed/NCBI
|
|
24
|
Musser DA and Oseroff AR: The use of
tetrazolium salts to determine sites of damage to the mitochondrial
electron transport chain in intact cells following in vitro
photodynamic therapy with photofrin II. Photochem Photobiol.
59:621–626. 1994. View Article : Google Scholar : PubMed/NCBI
|
|
25
|
Dice JF: Selective degradation of
cytosolic proteins by lysosomes. Ann N Y Acad Sci. 674:58–64. 1992.
View Article : Google Scholar : PubMed/NCBI
|
|
26
|
Dice JF: Molecular determinants of protein
half-lives in eukaryotic cells. FASEB J. 1:349–357. 1987.
View Article : Google Scholar : PubMed/NCBI
|
|
27
|
Duan Y, Li F, Guo Q, Wang W, Zhang L, Wen
C, Chen X and Yin Y: β-Hydroxy-β-methyl butyrate is more potent
than leucine in inhibiting starvation-induced protein degradation
in C2C12 myotubes. J Agric Food Chem. 66:170–176. 2018. View Article : Google Scholar : PubMed/NCBI
|
|
28
|
Caldow MK, Ham DJ, Trieu J, Chung JD,
Lynch GS and Koopman R: Glycine protects muscle cells from wasting
in vitro via mTORC1 signaling. Front Nutr. 6:1722019. View Article : Google Scholar : PubMed/NCBI
|
|
29
|
Zhang H, Wang F, Pang X, Zhou Y, Li S, Li
W, Zhang P and Chen X: Decreased expression of H19/miR-675
ameliorates muscle atrophy by regulating the IGF1R/Akt/FoxO
signaling pathway. Mol Med. 29:782023. View Article : Google Scholar : PubMed/NCBI
|
|
30
|
Nakai N, Kitai S, Iida N, Inoue S and
Higashida K: Autophagy under glucose starvation enhances protein
translation initiation in response to re-addition of glucose in
C2C12 myotubes. FEBS Open Bio. 10:2149–2156. 2020. View Article : Google Scholar : PubMed/NCBI
|
|
31
|
Zeidler JD, Fernandes-Siqueira LO,
Carvalho AS, Cararo-Lopes E, Dias MH, Ketzer LA, Galina A and Da
Poian AT: Short-term starvation is a strategy to unravel the
cellular capacity of oxidizing specific exogenous/endogenous
substrates in mitochondria. J Biol Chem. 292:14176–14187. 2017.
View Article : Google Scholar : PubMed/NCBI
|
|
32
|
de Lange P, Moreno M, Silvestri E,
Lombardi A, Goglia F and Lanni A: Fuel economy in food-deprived
skeletal muscle: Signaling pathways and regulatory mechanisms.
FASEB J. 21:3431–3441. 2007. View Article : Google Scholar : PubMed/NCBI
|
|
33
|
Samec S, Seydoux J, Russell AP, Montani JP
and Dulloo AG: Skeletal muscle heterogeneity in fasting-induced
upregulation of genes encoding UCP2, UCP3, PPARgamma and key
enzymes of lipid oxidation. Pflugers Arch. 445:80–86. 2002.
View Article : Google Scholar : PubMed/NCBI
|
|
34
|
Frier BC, Jacobs RL and Wright DC:
Interactions between the consumption of a high-fat diet and fasting
in the regulation of fatty acid oxidation enzyme gene expression:
An evaluation of potential mechanisms. Am J Physiol Regul Integr
Comp Physiol. 300:R212–R221. 2011. View Article : Google Scholar : PubMed/NCBI
|
|
35
|
Saneyasu T, Kimura S, Kitashiro A, Tsuchii
N, Tsuchihashi T, Inui M, Honda K and Kamisoyama H: Differential
regulation of the expression of lipid metabolism-related genes with
skeletal muscle type in growing chickens. Comp Biochem Physiol B
Biochem Mol Biol. 189:1–5. 2015. View Article : Google Scholar : PubMed/NCBI
|
|
36
|
Jagoe RT, Lecker SH, Gomes M and Goldberg
AL: Patterns of gene expression in atrophying skeletal muscles:
Response to food deprivation. FASEB J. 16:1697–1712. 2002.
View Article : Google Scholar : PubMed/NCBI
|
|
37
|
Lecker SH, Jagoe RT, Gilbert A, Gomes M,
Baracos V, Bailey J, Price SR, Mitch WE and Goldberg AL: Multiple
types of skeletal muscle atrophy involve a common program of
changes in gene expression. FASEB J. 18:39–51. 2004. View Article : Google Scholar : PubMed/NCBI
|
|
38
|
Harvald EB, Sprenger RR, Dall KB, Ejsing
CS, Nielsen R, Mandrup S, Murillo AB, Larance M, Gartner A, Lamond
AI and Færgeman NJ: Multi-omics analyses of starvation responses
reveal a central role for lipoprotein metabolism in acute
starvation survival in C. elegans. Cell Syst. 5:38–52.e4. 2017.
View Article : Google Scholar : PubMed/NCBI
|
|
39
|
Dall KB, Havelund JF, Harvald EB, Witting
M and Faergeman NJ: HLH-30-dependent rewiring of metabolism during
starvation in C. elegans. Aging Cell. 20:e133422021. View Article : Google Scholar : PubMed/NCBI
|
|
40
|
Skiba-Cassy S, Collin A, Chartrin P,
Médale F, Simon J, Duclos MJ and Tesseraud S: Chicken liver and
muscle carnitine palmitoyltransferase 1: Nutritional regulation of
messengers. Comp Biochem Physiol B Biochem Mol Biol. 147:278–287.
2007. View Article : Google Scholar : PubMed/NCBI
|
|
41
|
Benjamin DI, Both P, Benjamin JS, Nutter
CW, Tan JH, Kang J, Machado LA, Klein JDD, de Morree A, Kim S, et
al: Fasting induces a highly resilient deep quiescent state in
muscle stem cells via ketone body signaling. Cell Metab.
34:902–918.e6. 2022. View Article : Google Scholar : PubMed/NCBI
|
|
42
|
Gwinn DM, Shackelford DB, Egan DF,
Mihaylova MM, Mery A, Vasquez DS, Turk BE and Shaw RJ: AMPK
phosphorylation of raptor mediates a metabolic checkpoint. Mol
Cell. 30:214–226. 2008. View Article : Google Scholar : PubMed/NCBI
|
|
43
|
Tavares MR, Pavan IC, Amaral CL,
Meneguello L, Luchessi AD and Simabuco FM: The S6K protein family
in health and disease. Life Sci. 131:1–10. 2015. View Article : Google Scholar : PubMed/NCBI
|
|
44
|
Diaz-Troya S, Pérez-Pérez ME, Florencio FJ
and Crespo JL: The role of TOR in autophagy regulation from yeast
to plants and mammals. Autophagy. 4:851–865. 2008. View Article : Google Scholar : PubMed/NCBI
|
|
45
|
Mugume Y, Kazibwe Z and Bassham DC: Target
of rapamycin in control of autophagy: Puppet master and signal
integrator. Int J Mol Sci. 21:82592020. View Article : Google Scholar : PubMed/NCBI
|
|
46
|
Durán RV, Oppliger W, Robitaille AM,
Heiserich L, Skendaj R, Gottlieb E and Hall MN: Glutaminolysis
activates Rag-mTORC1 signaling. Mol Cell. 47:349–358. 2012.
View Article : Google Scholar : PubMed/NCBI
|
|
47
|
Dodd KM and Tee AR: Leucine and mTORC1: A
complex relationship. Am J Physiol Endocrinol Metab.
302:E1329–E1342. 2012. View Article : Google Scholar : PubMed/NCBI
|
|
48
|
Han JM, Jeong SJ, Park MC, Kim G, Kwon NH,
Kim HK, Ha SH, Ryu SH and Kim S: Leucyl-tRNA synthetase is an
intracellular leucine sensor for the mTORC1-signaling pathway.
Cell. 149:410–424. 2012. View Article : Google Scholar : PubMed/NCBI
|
|
49
|
Leenders M and van Loon LJ: Leucine as a
pharmaconutrient to prevent and treat sarcopenia and type 2
diabetes. Nutr Rev. 69:675–689. 2011. View Article : Google Scholar : PubMed/NCBI
|
|
50
|
Ham DJ, Caldow MK, Lynch GS and Koopman R:
Leucine as a treatment for muscle wasting: A critical review. Clin
Nutr. 33:937–945. 2014. View Article : Google Scholar : PubMed/NCBI
|
|
51
|
Mobley CB, Fox CD, Ferguson BS, Amin RH,
Dalbo VJ, Baier S, Rathmacher JA, Wilson JM and Roberts MD:
L-leucine, beta-hydroxy-beta-methylbutyric acid (HMB) and creatine
monohydrate prevent myostatin-induced Akirin-1/Mighty mRNA
down-regulation and myotube atrophy. J Int Soc Sports Nutr.
11:382014. View Article : Google Scholar : PubMed/NCBI
|
|
52
|
Oelkrug C, Horn K, Makert GR and Schubert
A: Novel in vitro platform to investigate myotube atrophy.
Anticancer Res. 35:2085–2091. 2015.PubMed/NCBI
|
|
53
|
Wang L, Yi D, Hou Y, Ding B, Li K, Li B,
Zhu H, Liu Y and Wu G: Dietary supplementation with α-ketoglutarate
activates mTOR signaling and enhances energy status in skeletal
muscle of lipopolysaccharide-challenged piglets. J Nutr.
146:1514–1520. 2016. View Article : Google Scholar : PubMed/NCBI
|
|
54
|
Cai X, Yuan Y, Liao Z, Xing K, Zhu C, Xu
Y, Yu L, Wang L, Wang S, Zhu X, et al: α-Ketoglutarate prevents
skeletal muscle protein degradation and muscle atrophy through
PHD3/ADRB2 pathway. FASEB J. 32:488–499. 2018. View Article : Google Scholar : PubMed/NCBI
|
|
55
|
Tsukamoto S, Shibasaki A, Naka A, Saito H
and Iida K: Lactate promotes myoblast differentiation and myotube
hypertrophy via a pathway involving MyoD in vitro and enhances
muscle regeneration in vivo. Int J Mol Sci. 19:36492018. View Article : Google Scholar : PubMed/NCBI
|
|
56
|
Ohno Y, Oyama A, Kaneko H, Egawa T,
Yokoyama S, Sugiura T, Ohira Y, Yoshioka T and Goto K: Lactate
increases myotube diameter via activation of MEK/ERK pathway in
C2C12 cells. Acta Physiol (Oxf). 223:e130422018. View Article : Google Scholar : PubMed/NCBI
|
|
57
|
Ohno Y, Nakatani M, Ito T, Matsui Y, Ando
K, Suda Y, Ohashi K, Yokoyama S and Goto K: Activation of lactate
receptor positively regulates skeletal muscle mass in mice. Physiol
Res. 72:465–473. 2023. View Article : Google Scholar : PubMed/NCBI
|
|
58
|
Goodpaster BH and Sparks LM: Metabolic
flexibility in health and disease. Cell Metab. 25:1027–1036. 2017.
View Article : Google Scholar : PubMed/NCBI
|
|
59
|
Hui S, Ghergurovich JM, Morscher RJ, Jang
C, Teng X, Lu W, Esparza LA, Reya T, Zhan L, Yanxiang Guo J, et al:
Glucose feeds the TCA cycle via circulating lactate. Nature.
551:115–118. 2017. View Article : Google Scholar : PubMed/NCBI
|
|
60
|
Li M, Wang Y, Wei X, Cai WF, Wu J, Zhu M,
Wang Y, Liu YH, Xiong J, Qu Q, et al: AMPK targets PDZD8 to trigger
carbon source shift from glucose to glutamine. Cell Res.
34:683–706. 2024. View Article : Google Scholar : PubMed/NCBI
|