Introduction
Diabetes mellitus (DM) is a prevalent chronic
disease worldwide, with type 2 diabetes (T2D) accounting for
>90% of cases. The International Diabetes Federation estimates
that by 2040, 624 million individuals worldwide will be affected by
T2D (1). Diabetic cardiomyopathy
(DCM), a severe cardiovascular complication of DM, accounts for
50–60% of DM-associated mortality, representing the leading cause
of death in diabetic populations (2). DCM is associated with
immune-inflammatory infiltration, dysregulation of glucolipid
metabolism (2), mitochondrial
energy metabolism disorder, oxidative stress (3), focal myocardial cell death (4) and programmed necrosis (5). Metabolic remodeling is a
manifestation of DCM, characterized by the loss of cardiomyocyte
capacity for carbohydrate and fatty acid metabolism, which is
supplanted by mitochondrial fatty acid β-oxidation. This shift
leads to cardiac steatosis, lipotoxicity and apoptosis of
cardiomyocytes (6).
DCM is a pathophysiological condition associated
with DM that manifests as cardiac decompensation or heart failure
(3). It typically presents with
thickening of the left ventricular wall, impaired left ventricular
diastolic function (7) and heart
failure resulting from non-coronary artery disease, hypertension
and valvular heart disease. Decreased cardiomyocyte function is an
important contributor to the development of heart failure in DCM
(8), with early signs including
abnormal diastolic relaxation (9).
Chronic hyperglycemia (HG) and HG-induced oxidative stress lead to
ultrastructural changes in cardiomyocytes, characterized by
mitochondrial swelling, a decreased number of mitochondria and
defective collagen fibers (10).
These alterations may result in myocardial fibrosis, mitochondrial
dysfunction, myocyte hypertrophy and myogenic fibrosis disorder,
all of which disrupt the homeostasis of cardiomyocytes and may
ultimately lead to heart failure (10).
Metabolic disorders induced by HG and insulin
resistance are associated with the development of DCM (9). Protein glycosylation resulting from
HG leads to an increase in advanced glycation end products (AGEs),
which promotes collagen cross-linking, myocardial fibrosis and
impaired diastolic function, triggering the onset of DCM (9). HG, insulin resistance, AGEs, collagen
cross-linking, myocardial fibrosis and impaired diastolic function
serve key roles in the progression of DCM (9). Emerging evidence highlights the
potential of bariatric surgery, particularly Roux-en-Y gastric
bypass and sleeve gastrectomy, in ameliorating DCM (11). Insulin resistance is a key
pathogenic driver of DCM, leading to impaired myocardial insulin
signaling, mitochondrial dysfunction and endoplasmic reticulum (ER)
stress. In insulin resistance or hyperinsulinemia, the heart
experiences notable metabolic dysregulation, characterized by
diminished glucose uptake and use alongside heightened dependence
on fatty acid oxidation. These metabolic shifts exacerbate cardiac
dysfunction by fostering oxidative stress, chronic inflammation and
cell injury, collectively contributing to the progression of DCM
(12). The energy and lipid
metabolism associated with DCM, along with its regulatory
mechanisms, are complex and not fully understood. Therefore, it is
important to investigate the pathogenesis of DCM through a combined
analysis of genomics and metabolomics, as the underlying mechanisms
of DCM at the metabolic level.
Materials and methods
Ethics approval
All experimental procedures involving db/db and db/m
mice were conducted in accordance with the ARRIVE guidelines and
were approved by the Institutional Animal Care and Use Committee of
Hubei University of Medicine (Shiyan, China; (approval no.
2024S071). Humane endpoints were as follows: i) Body weight loss
≥20% within 48 h (relative to peak body weight); ii) severe
hypoglycemia (<40 mg/dl) or hyperglycemia (>600 mg/dl)
refractory to clinical stabilization (for example, dietary
adjustment or insulin administration); iii) functional impairment
(inability to access food/water independently or lethargy
persisting >24 h) and iv) overt signs of distress (labored
breathing, hunched posture lasting >12 h or ulcerative lesions
affecting >5% body surface area). No animals met criteria for
early euthanasia. Animals were humanely euthanized via
intraperitoneal injection of sodium pentobarbital at a dose of 150
mg/kg body weight. Animal death was confirmed by the absence of
heartbeat, breathing and corneal reflex. These methods align with
the American Veterinary Medical Association guidelines to ensure
minimal animal suffering (13).
Data source
Key genes associated with DCM were investigated
using The National Center for Biotechnology Information Gene
Expression Omnibus (GEO) database (ncbi.nlm.nih.gov/geo/). A total
of three rat transcriptome expression profiling datasets (accession
nos. GSE4745, GSE5606 and GSE6880) were retrieved from the GEO
database (Table I). To eliminate
batch effects and other sources of variance, surrogate variable
analysis (14) and limma packages
(version 3.54.2, http://bioconductor.org/packages/release/bioc/html/limma.html)
were employed in R (version 4.2.3; http://cran.r-project.org/bin/windows/base/old/4.2.3/)
to merge the GSE4745 and GSE6880 datasets, and the resulting merged
dataset served as the internal training set. For independent
validation, GSE5606 dataset as an external validation cohort. This
strategic approach of combining GSE4745 and GSE6880 not only
increased statistical power but also maintained platform diversity
within the training set. Importantly, all three datasets
investigated identical species and disease models, ensuring
biological consistency while allowing rigorous assessment of model
generalizability across different experimental platforms.
 | Table I.Gene Expression Omnibus datasets of
mRNA expression in rat heart tissue. |
Table I.
Gene Expression Omnibus datasets of
mRNA expression in rat heart tissue.
| Accession no. | Platform | Control, n | Diabetic
cardiomyopathy, n |
|---|
| GSE4745 | GPL85 | 12 | 12 |
| GSE5606 | GPL1355 | 6 | 7 |
| GSE6880 | GPL341 | 3 | 3 |
Screening for differentially expressed
genes (DEGs)
GEO datasets were corrected using the limma package.
The expression data files of the combined dataset were investigated
for deviation analysis on the basis of |log2 (fold-change)|≥1 and
adjusted P-value <0.05. DEGs were visualized using heatmaps
generated by the heatmap package (version 1.0.12;
cran.r-project.org/web/packages/pheatmap/index.html) and volcano
plots created with the ggplot2 package (version 3.5.1; http://ggplot2.tidyverse.org/).
Functional enrichment analysis
Gene Ontology (GO) (15) and Kyoto Encyclopedia of Genes and
Genomes (KEGG) (16) pathway
enrichment analyses were performed using the clusterProfiler R
package (version 4.7.1; bioconductor.org/packages/release/bioc/html/clusterProfiler.html).
GO enrichment analysis provides a comprehensive description of the
gene and protein functions associated with biological processes
(BPs), molecular functions and cellular components. Adjusted
P<0.05 was considered to indicate a statistically significant
difference. For the Gene Set Enrichment Analysis (GSEA), the
clusterProfiler package (version 4.7.1;
bioconductor.org/packages/release/bioc/html/clusterProfiler.html)
was utilized with adjusted P<0.05 to indicate statistically
significant enrichment. The results of enrichment analyses were
visualized using the ggplot2 package (version 3.5.1; ggplot2.tidyverse.org/), and chord plots were
generated using the Xian Tao Academic Online Analysis platform
(xiantaozi.com/products/apply/c0b6febb-52dd-4525-970a-61bbe9e263ff/analyse/f9496965-0e1a-4249-b123-e6a00c924021).
Weighted gene co-expression network
analysis (WGCNA)-mediated core gene screening
WGCNA is a bioinformatics tool that calculates gene
expression levels and clusters genes with similar expression
patterns into modules. These functional gene clusters are used to
explore interactions between genes and biological phenotypes within
the modules (17). The present
study employed the WGCNA package (version 1.72;
cran.r-project.org/web/packages/WGCNA/index.html) to identify gene
modules with similar expression patterns by constructing a gene
co-expression network using the mean chained hierarchical
clustering algorithm. These modules were further distinguished
through hierarchical clustering based on proximity. Additionally,
the association of each module was inferred by calculating the
association between different modules and biological phenotype.
Finally, core genes from key modules were identified. Diagnostic
potential was evaluated by ROC curve analysis (AUC >0.7), with
differential expression visualized through boxplots (Wilcoxon test,
P<0.05).
Least absolute shrinkage and selection
operator (LASSO) regression screening for key DCM genes
Expression of DEGs intersecting with modal genes
significantly associated with DCM, as identified through WGCNA,
were analyzed. Intersection analysis was performed using the Venn
package (version 1.12;
cran.r-project.org/web/packages/venn/index.html) The GLMNET package
(version 4.1; cran.r-project.org/web/packages/glmnet/index.html)
was employed to construct a LASSO regression model for the
intersected genes and DCM feature genes were identified through
cross-validation. The genes corresponding to the points with the
lowest cross-validation error were designated key genes associated
with DCM.
Validation of key genes
To analyze the expression of key genes in both
internal and external datasets, the Limma package was used.
P<0.05 was considered to indicate a statistically significant
difference. Additionally, the ggpubr package (version 0.6.0;
http://cran.r-project.org/web/packages/ggpubr/index.html)
was employed to create a diverging box plot to visualize
significant differences in key gene expression levels between the
disease and control groups.
Receiver operating characteristic
(ROC) curve
ROC curves were used to validate the accuracy of key
genes in diagnosing DCM. R software (version 4.2.3;
cran.r-project.org/bin/windows/base/old/4.2.3/) was used to analyze
key gene expression and the pROC (version 1.18.5; http://xrobin.github.io/pROC/) package was used
to calculate and plot the area under the curve (AUC), with a larger
AUC indicating a greater diagnostic value of the key gene.
Cell culture and model
The HL-1 murine cardiomyocyte cell line (Unico) was
maintained at 37°C in a humidified atmosphere of 5% CO2,
21% O2 and 74% N2. The cells were maintained
in high-glucose DMEM (cat. no. SH30022.01; Cytiva) supplemented
with 10% fetal bovine serum (FBS; Cat. No. SA101.02, Cellmax,
Beijing, China). The medium was changed every 2 days, and cells in
mid-logarithmic growth phase were collected for experiments.
Cultured HL-1 cells were divided into low- (5.5 mM) and
high-glucose (33.3 mM) groups, and incubated at 37°C for 48 h
(18,19).
Animals
All experimental protocols were approved by the
Animal Ethics Committee of Hubei University of Medicine (Shiyan,
Hubei, China). A total of six male db/db diabetic mice (age, 6
weeks; body weight 27.5±1.6 g at study initiation; Certificate No.
202341294-202341295, Jiangsu Huachuang Sino Pharmaceutical
Technology Co., Ltd, China) were used to establish a model of DCM,
with six db/m mice serving as controls. Mice were maintained under
a 12/12-h light/dark cycle at a controlled temperature of 22±1°C
and 50±10% relative humidity, with ad libitum access to food and
water. All animals were acclimatized for 2 weeks prior to
experiments. Body weight and blood glucose levels were measured.
Blood glucose levels were monitored via tail vein sampling.
Briefly, the distal 1–2 mm of the tail tip was sterilized with 70%
ethanol and air-dried. A sterile lancet was used to make an
incision, and a single blood droplet (~1 µl) was collected. Glucose
concentration was analyzed using a Sinocare Blood Glucose
Monitoring System (Sinocare Inc., Changsha). Triplicate
measurements were averaged per mouse to ensure reliability. All
measurements were performed between 9:00 and 11:00 AM under
non-fasting conditions to minimize circadian variation. In
longitudinal studies, sequential sampling was restricted to the
same tail region to avoid tissue damage. The animals were monitored
in SPF-grade animal laboratories for 24 weeks, with echocardiograms
performed every 4 weeks. Sampling was conducted at 32 weeks of
age.
Lentivirus transfection and hexokinase
2 (HK2) overexpression
HL-1 cardiomyocytes were transduced with recombinant
lentiviral particles carrying the human HK2 gene (Lenti-HK2; Vigene
Biosciences, cat. no. FC-6073) following the manufacturer's
recommended protocol. HL-1 cells were seeded in 12-well plates at
1×10⁵ cells/well and cultured at 37°C until reaching
40–50% confluence. Cells were maintained at 37°C in medium, which
was replaced with 420 µl fresh complete DMEM supplemented with 10%
FBS [cat. no. SA101.02; CellTech (Beijing) Co., Ltd.], supplemented
with 20 µl LV-Enhance (50X, Vigene Biosciences) and 60 µl/ml
lentivirus overexpressing human HK2 (LV-hHK2-OE) (Vigene
Biosciences, cat. no. FBE0001, Shandong, China; http://www.wzbio.com.cn/). LV-ZsGreen-Puro-CON (Vigene
Biosciences) served as negative controls. Subsequent experiments
were performed 48 h post-transfection. The transfection was
conducted at 37°C in a 5% CO2 atmosphere for 18–24 h,
followed by the addition of 500 µl complete DMEM (supplemented with
10% FBS [cat. no. SA101.02; CellTech (Beijing) Co., Ltd.]) for an
additional 24 h under the same culture conditions. Green
fluorescence was monitored for 24–48 h post-transfection to assess
transfection efficiency. Once green fluorescence was detected in
the cells, puromycin (3 g/ml; cat. no. HY-K1057; MedChemExpress)
was added to each well, and the same concentration of puromycin was
maintained for 7 days at 37°C with 5% CO. The cells were collected
for further experiments and cryopreserved (−196°C) in liquid
nitrogen.
Western blotting
Total protein was extracted from heart tissue and
HL-1 cells using RIPA lysis buffer (Servicebio Technology Co.,
Wuhan, China; cat. no. G2002) containing 50 mM Tris-HCl (pH 7.4),
150 mM NaCl, 1 mM EDTA-2Na, 1% sodium deoxycholate, 0.1% SDS and 1%
Triton X-100. Protein concentration was determined using the BCAk
method. Equal amounts of protein (20 µg/lane) were separated by 10%
SDS-PAGE and transferred to a PVDF membrane (Immobilon-PSQ Blotting
Membranes; 0.2 µm; Merck KGaA). Following 1-hour blocking at room
temperature with 5% skimmed milk, the membranes were incubated
overnight at 4°C with the following antibodies: Anti-GAPDH mouse
monoclonal (cat. no. 60004-1-Ig; 1:5,000; Proteintech Group, Inc.),
anti-microsomal glutathione S-transferase 1 (MGST1) rabbit
monoclonal (cat. no. A0880; 1:500; ABclonal Biotech Co., Ltd.),
anti-HK2 rabbit polyclonal (1:1,000; cat. no. A0994; ABclonal
Biotech Co., Ltd,) and anti-Phosphatidylinositol-4-Phosphate
3-Kinase C2 Domain-Containing Subunit Gamma (PIK3C2G) polyclonal
antibody (cat. no. 25904-1-AP; 1:2,000; Proteintech Group, Inc.).
Following three washes with TBST (0.05% Tween-20), the membranes
were incubated with horseradish peroxidase-conjugated secondary
antibody (1:1,000; Beyotime Institute of Biotechnology, cat. no.
A0208) at room temperature for 1 h. The membranes were washed three
additional times with TBST, and chemiluminescent signals were
detected using an ultra-sensitive ECL substrate (cat. no. BL520B,
Biosharp, China) and imaged with a gel imaging system (Bio-Rad
ChemiDoc XRS+; Bio-Rad Laboratories, Inc.). Data were analyzed
using Image Lab 6.0 software (Bio-Rad), and semi-quantification of
band intensities was performed with ImageJ 1.54d (National
Institutes of Health, USA).
Echocardiography
Echocardiography was performed using a Visualsonic
Vevo 2100 (VisualSonics, Inc.) equipped with a 30 MHz linear array
ultrasound transducer (20).
Echocardiography was performed under inhalant anesthesia using
isoflurane delivered via a nose cone connected to an anesthetic
vaporizer. Induction was achieved with 4% isoflurane and
maintenance was performed using 1.5–2.0% isoflurane. The internal
diameter of the left ventricle (LV) was measured in M-mode over ≥3
cardiac cycles, and the mean value was subsequently calculated. The
left ventricular end-diastolic inner diameter (LVEDd) and left
ventricular end-systolic inner diameter (LVESd) were measured at
the maximum and minimum LV areas, respectively. The left
ventricular shortening fraction (LVFS) and left ventricular
ejection fraction (LVEF) were calculated as follows: LVFS
%=(LVEDd-LVESd)/LVEDd ×100%.
Immunohistochemical staining
The myocardial tissues were fixed in 4%
paraformaldehyde (PFA, cat. no. BL539A, Biosharp, China) at 4°C for
24–48 h, processed through graded ethanol, cleared in xylene, and
embedded in paraffin. Samples were sliced into 5-µm-thick serial
sections were prepared, dewaxed in xylene at room temperature
(25°C) for 30 min and hydrated with graded alcohol. Antigens were
retrieved using microwave heating at 95–100°C with sodium citrate
buffer (pH 6.0; cat. no. 36311-B, Yeasen, China) for 30 min.
Endogenous peroxidase activity was blocked with 3% hydrogen
peroxide for 10 min at room temperature. Next, 5% bovine serum
albumin (cat. no. HY-D0842; MedChemExpress) was applied at 37°C for
1 h. The sections were incubated overnight at 4°C with anti-MGST1
rabbit monoclonal (1:100) and anti-HK2 rabbit polyclonal antibody
(1:200), followed by incubation with liquid 3,3′-diaminobenzidine
(cat. no. 36311-H and 36311-I, Yeasen) substrate for color
development according to the manufacturer's instructions. Sections
were stained with hematoxylin at room temperature for 3 min to
visualize nuclei, differentiated using 1% hydrochloric acid
alcohol, dehydrated through ascending ethanol series (70, 95, and
100% ethanol; 2 min each at room temperature) and cleared in xylene
(two changes, 3 min each at room temperature) prior to mounting
with neutral balsam.
Stained sections were visualized and digitized using
an Aperio CS2 digital slide scanner (Leica Biosystems, Germany)
under bright-field microscopy.
Hematoxylin and eosin (H&E) and
Masson's trichrome staining
Cardiac tissue was fixed in 4% paraformaldehyde
(PFA, cat. no. BL520B, Biosharp, China) at 4°C for 24 h. Following
fixation, the samples were washed in phosphate-buffered saline
(PBS) and processed through a graded ethanol series (70, 85, 95,
and 100%), cleared in xylene, and embedded in paraffin using an
automated tissue processor (Leica TP1020; Leica Biosystems). Serial
sections (5 µm thickness) were cut using a rotary microtome (Leica
RM2235; Leica Biosystems) and mounted on poly-L-lysine-coated glass
slides for subsequent histological staining. The sections were
stained with H&E following deparaffinization and dehydration as
previously described (21).
Following deparaffinization and rehydration, the sections were
stained with hematoxylin solution for 5 min, rinsed in running tap
water for 5 min, differentiated in 1% acid alcohol for 30 sec, and
blued in 0.2% ammonia water. Subsequently, the sections were
counterstained with eosin for 3 min, dehydrated through a graded
ethanol series (70, 95, and 100%), cleared in xylene, and mounted
with neutral balsam. Additionally, sections were stained using a
modified Masson's Trichrome Stain kit (cat. no. G1340; Beijing
Solarbio Science & Technology Co., Ltd.) according to the
manufacturer's instructions. Sections were visualized using an
Aperio CS2 digital slide scanner (Leica Biosystems, Germany) under
bright-field microscopy.
Transcriptomic assay
To investigate the regulatory effect of HK2
overexpression on downstream gene expression in HL-1 cells,
cultured wild-type (WT) HL-1 cells (HK2-WT) and
lentivirus-transfected HK2 overexpressing HL-1 cells (HK2-OE) were
washed with a sterile PBS solution, lysed by adding TRIzol (cat.
no. 15596026CN; Thermo Fisher Scientific, USA) lysis solution and
incubated for 5 min at room temperature. The lysed cells were mixed
and transferred to 1.5 ml sterile Eppendorf tubes for storage at
−80°C. The samples were preserved and transported on dry ice to
Metware Biotechnology Co., Ltd. (Wuhan, China) for analysis. Total
RNA was processed with the NEBNext Ultra II RNA Library Prep kit
(Cat. No. E7770; New England Biolabs) for Illumina sequencing. RNA
integrity was verified using the Qsep400 Bioanalyzer (Bioptic Inc.)
with all samples exhibiting RNA Integrity Number >7.0.
Sequencing was performed on the Illumina NovaSeq 6000 platform
using the NovaSeq 6000 SP Reagent Kit (300 cycles; Cat. No.
20027464; Illumina Inc.) for paired-end 150 bp sequencing. Final
libraries were quantified by qPCR using the KAPA Library
Quantification Kit (Cat. No. KK4824; Roche) and loaded at 12.5 pM
concentration. Unsupervised principal component analysis) was
performed by statistics function prcomp within R (version 3.5.1;
r-project.org). The data was unit variance scaled before
unsupervised PCA.
Quantitative analysis of energy
metabolism and lipid metabolism
To investigate the effects of HK2 gene expression on
energy and lipid metabolism in HL-1 cells, targeted quantification
of metabolites was performed using liquid chromatography-tandem
mass spectrometry (LC-MS/MS) as previously described (22). All metabolites were detected
through MetWare (metware.cn/) using the AB Sciex QTRAP 6500
LC-MS/MS platform. The analysis was performed in both positive and
negative ionization modes, with the following parameters: Ion spray
voltage set at 5,500 V (positive) and −4,500 V (negative), curtain
gas at 35 psi, and source temperature maintained at 550°C. Multiple
reaction monitoring (MRM) transitions were optimized for each
metabolite, with specific precursor and product ion pairs (m/z)
selected for quantification. The nebulizer gas flow rate was
maintained at 1.5 l/min, and the collision gas pressure was set to
medium. Pearson correlation analysis was performed using
quantitative values of genes and metabolites from all samples.
Fold-change differences in correlation coefficients with absolute
values >0.8 and P<0.05 were analyzed.
Sample preparation and extraction
The cells were pelleted by centrifugation at 1,000 ×
g for 10 min at 4°C, and the resulting cell pellets were stored at
−80°C until metabolomic analysis. The collected cell pellet samples
for metabolomic analysis were thawed on ice and 100 µl ultrapure
water was added to resuspend the cell pellet. A 50-µl aliquot of
the cell suspension was added to 200 µl methanol (precooled to
−20°C). The mixture was vortexed for 2 min at 1,000 × g at 4°C. The
sample was flash-frozen in liquid nitrogen (−196°C) for 5 min,
thawed on ice (0–4°C) for 5 min and vortexed at maximum speed (700
× g) at room temperature for 2 min. The freeze-thaw-vortex cycle
was repeated three times. The sample was centrifuged at 12,000 × g
for 10 min at 4°C and 200 µl supernatant was transferred to a new
centrifuge tube and stored at −20°C for 30 min. The supernatant was
centrifuged again at 12,000 × g for 10 min at 4°C. A total of 180
µl supernatant was filtered through a protein precipitation plate
for LC-MS analysis, while the 50 µl cell suspension underwent three
freeze-thaw cycles, followed by centrifugation at 12,000 × g for 10
min at 4°C. The protein concentration in the supernatant was
determined using a BCA protein assay kit.
Quantitative PCR
Total RNA was extracted from cells using TRIzol®
reagent (Invitrogen; Thermo Fisher Scientific, Inc., Waltham, MA,
USA) and reverse-transcribed into cDNA using HiScript IV RT
SuperMix for qPCR (+gDNA wiper) (cat. no. R423-01; Vazyme Biotech
Co., Ltd., Nanjing, China). Quantitative PCR was performed using
the CFX Connect™ Real-Time PCR Detection System (Bio-Rad
Laboratories, Inc., Hercules, CA, USA) with Taq Pro Universal SYBR
qPCR Master Mix (cat. no. Q712; Vazyme Biotech Co., Ltd.). The
thermal cycling conditions consisted of an initial denaturation at
95°C for 30 sec, followed by 40 cycles of 95°C for 10 sec and 60°C
for 30 sec. Gene expression levels were normalized to GAPDH
reference genes and calculated using the 2-ΔΔCq method (23). All primers were synthesized by
Sangon Biotech Co., Ltd. (Shanghai, China; Table SI).
Protein-protein interaction (PPI)
network analysis
PPI networks were constructed using the STRING
database (version 12.0; minimum required interaction score, 0.4;
http://cn.string-db.org/) with the differentially
expressed genes as input. The networks were visualized and analyzed
using Cytoscape software (version 3.9.0; National Institute of
General Medical Sciences), with the CytoHubba plugin (version 0.1,
http://apps.cytoscape.org/apps/cytohubba) used to
identify hub genes based on topological parameters (degree
centrality and betweenness centrality).
Statistical analysis
All data are presented as the mean ± standard
deviation from three independent experimental repeats. All analyses
were conducted using GraphPad Prism 9.0 software (Dotmatics). Two
samples were compared using unpaired two-tailed Student's t-test.
For >2 groups, one-way ANOVA followed by Tukey's post hoc test
was used if the data met the assumptions of normality (assessed by
the Shapiro-Wilk test) and homogeneity of variance (verified by
Levene's test). If these assumptions were violated, the
non-parametric Kruskal-Wallis test, followed by Dunn's post hoc
test, was applied. P<0.05 was considered to indicate a
statistically significant difference.
Results
Identification of DEGs
To identify DEGs, a fold-change threshold of |log2
(fold-change)|≥1 and adjusted P<0.05 were employed. In the
merged dataset of GSE4745 and GSE6880, 47 DEGs were identified,
comprising 25 up- and 22 downregulated genes (Fig. 1A and B). To explore the biological
functions of the DEGs and the potential biological pathways
associated with DCM, GO functional and KEGG pathway enrichment
analysis were performed (Tables
SII and SIII).
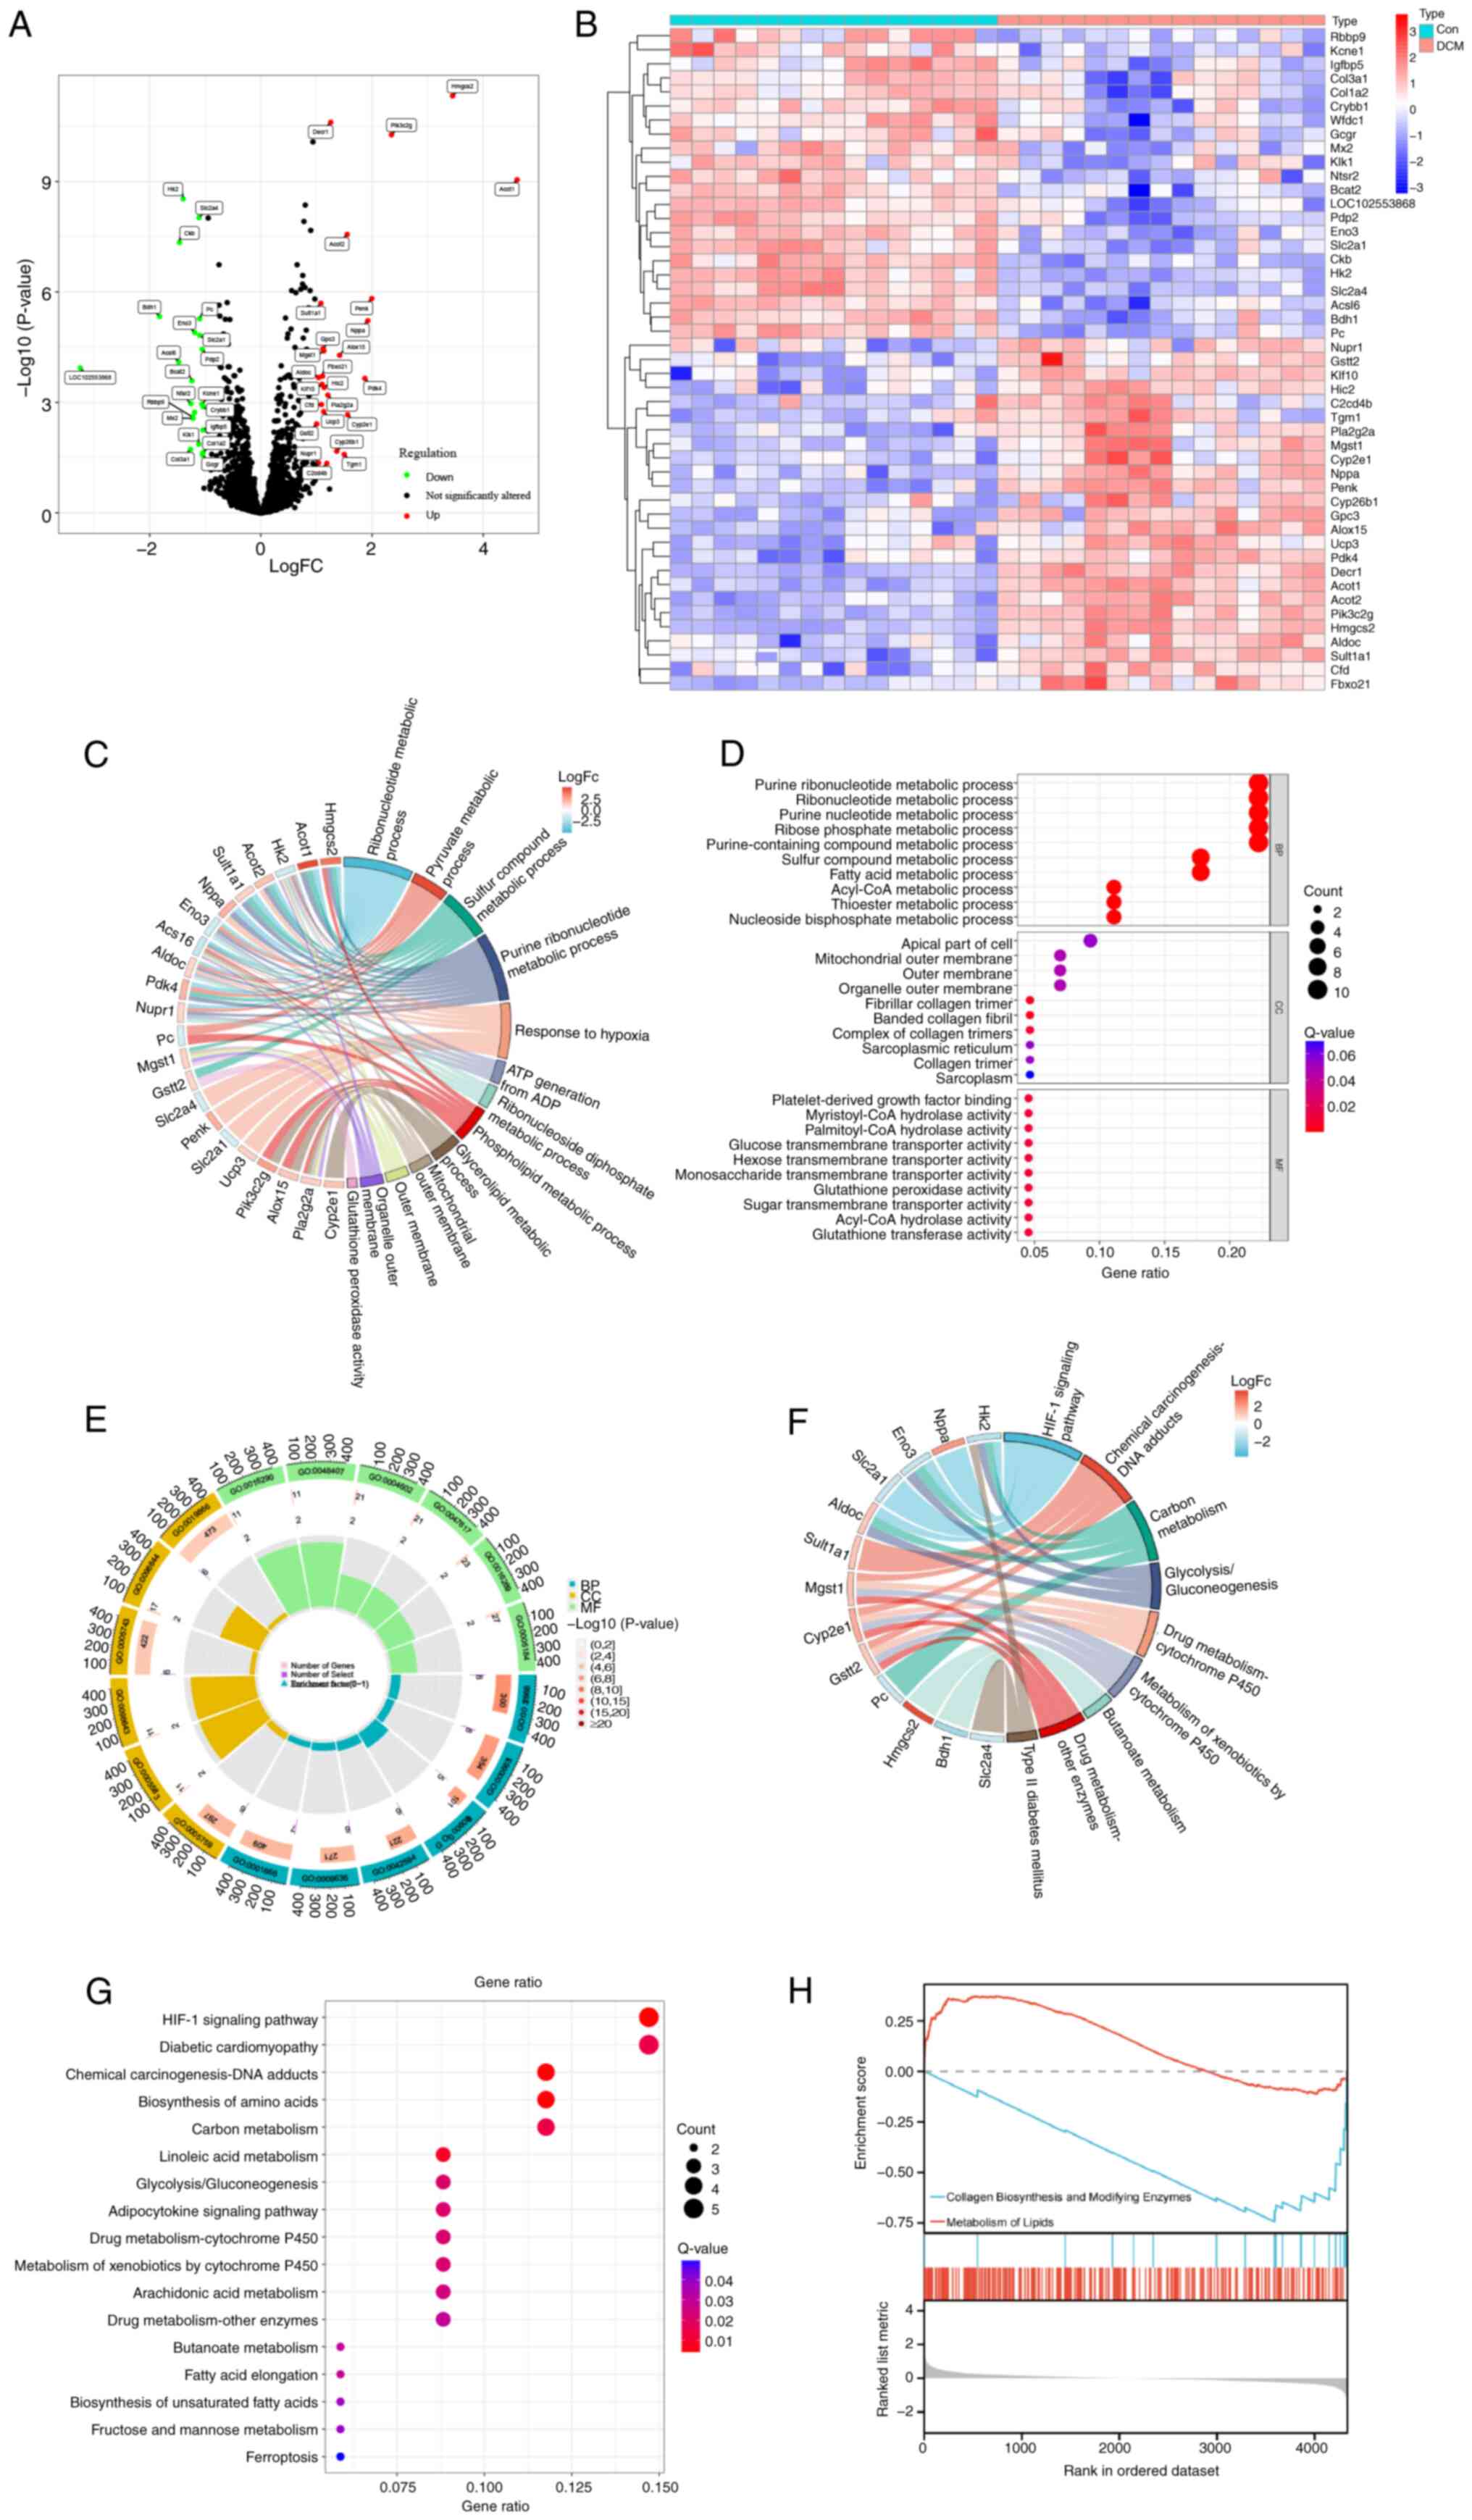 | Figure 1.Identification and enrichment
analysis of DEGs. (A) Volcano plot of DEGs. (B) DEG expression
heatmap. (C) Chord, (D) bubble and (E) Circos plot of the GO
enrichment analysis results. (F) Chord and (G) bubble plot of the
KEGG enrichment analysis results. (H) Gene Set Enrichment Analysis
of gene sets. Red curve indicates that the gene set is upregulated,
while the blue color indicates that the gene set is downregulated.
DEG, differentially expressed gene; GO, Gene Ontology; KEGG, Kyoto
Encyclopedia of Genes and Genomes; Con, control; DCM, diabetic
cardiomyopathy; FC, fold change; BP, biological process; CC,
cellular component; MF, molecular function. |
Functional characterization of
DEGs
GO enrichment analysis indicated DEGs were involved
in BPs, including ‘fatty acid metabolic process’, ‘pyruvate
metabolic process’, ‘small molecule catabolic process’, ‘response
to toxic substance’, ‘response to starvation’, ‘response to
hypoxia’ and ‘response to insulin’ (Fig. 1D). Additionally, the DEGs were
localized to cellular components such as ‘banded collagen fibril’,
‘fibrillar collagen trimer’, ‘organelle outer membrane’,
‘sarcolemma’, ‘organelle inner membrane’, ‘mitochondrial inner
membrane’ and ‘mitochondrial matrix’. Furthermore, DEGs associated
with ‘hexose transmembrane transporter activity’, ‘glucose
transmembrane transporter activity’, ‘neuropeptide hormone
activity’, ‘CoA hydrolase activity’, ‘acyl-CoA hydrolase activity’,
‘glutathione peroxidase activity’, ‘platelet-derived growth factor
binding’, ‘palmitoyl-CoA hydrolase activity’ and ‘phospholipid
binding’ were significantly enriched (Fig. 1C-E).
Pathway enrichment analysis
KEGG enrichment analyses indicated that the DEGs
were significantly enriched in ‘fatty acid elongation’, ‘drug
metabolism-other enzymes’, ‘butanoate metabolism’, ‘arachidonic
acid metabolism’, ‘metabolism of xenobiotics by cytochrome P450’,
‘drug metabolism-cytochrome P450’, ‘adipocytokine signaling
pathway’, ‘glycolysis/gluconeogenesis’, ‘diabetic cardiomyopathy’,
‘carbon metabolism’, ‘linoleic acid metabolism’, ‘biosynthesis of
amino acids’ and ‘HIF-1 signaling pathway’ (Fig. 1F and G). Additionally, GSEA
demonstrated enrichment of DCM-associated genes in ‘collagen
biosynthesis and modifying enzymes’ and ‘metabolism of lipids’
(Fig. 1H).
Identification of the most relevant
module genes to DCM through WGCNA
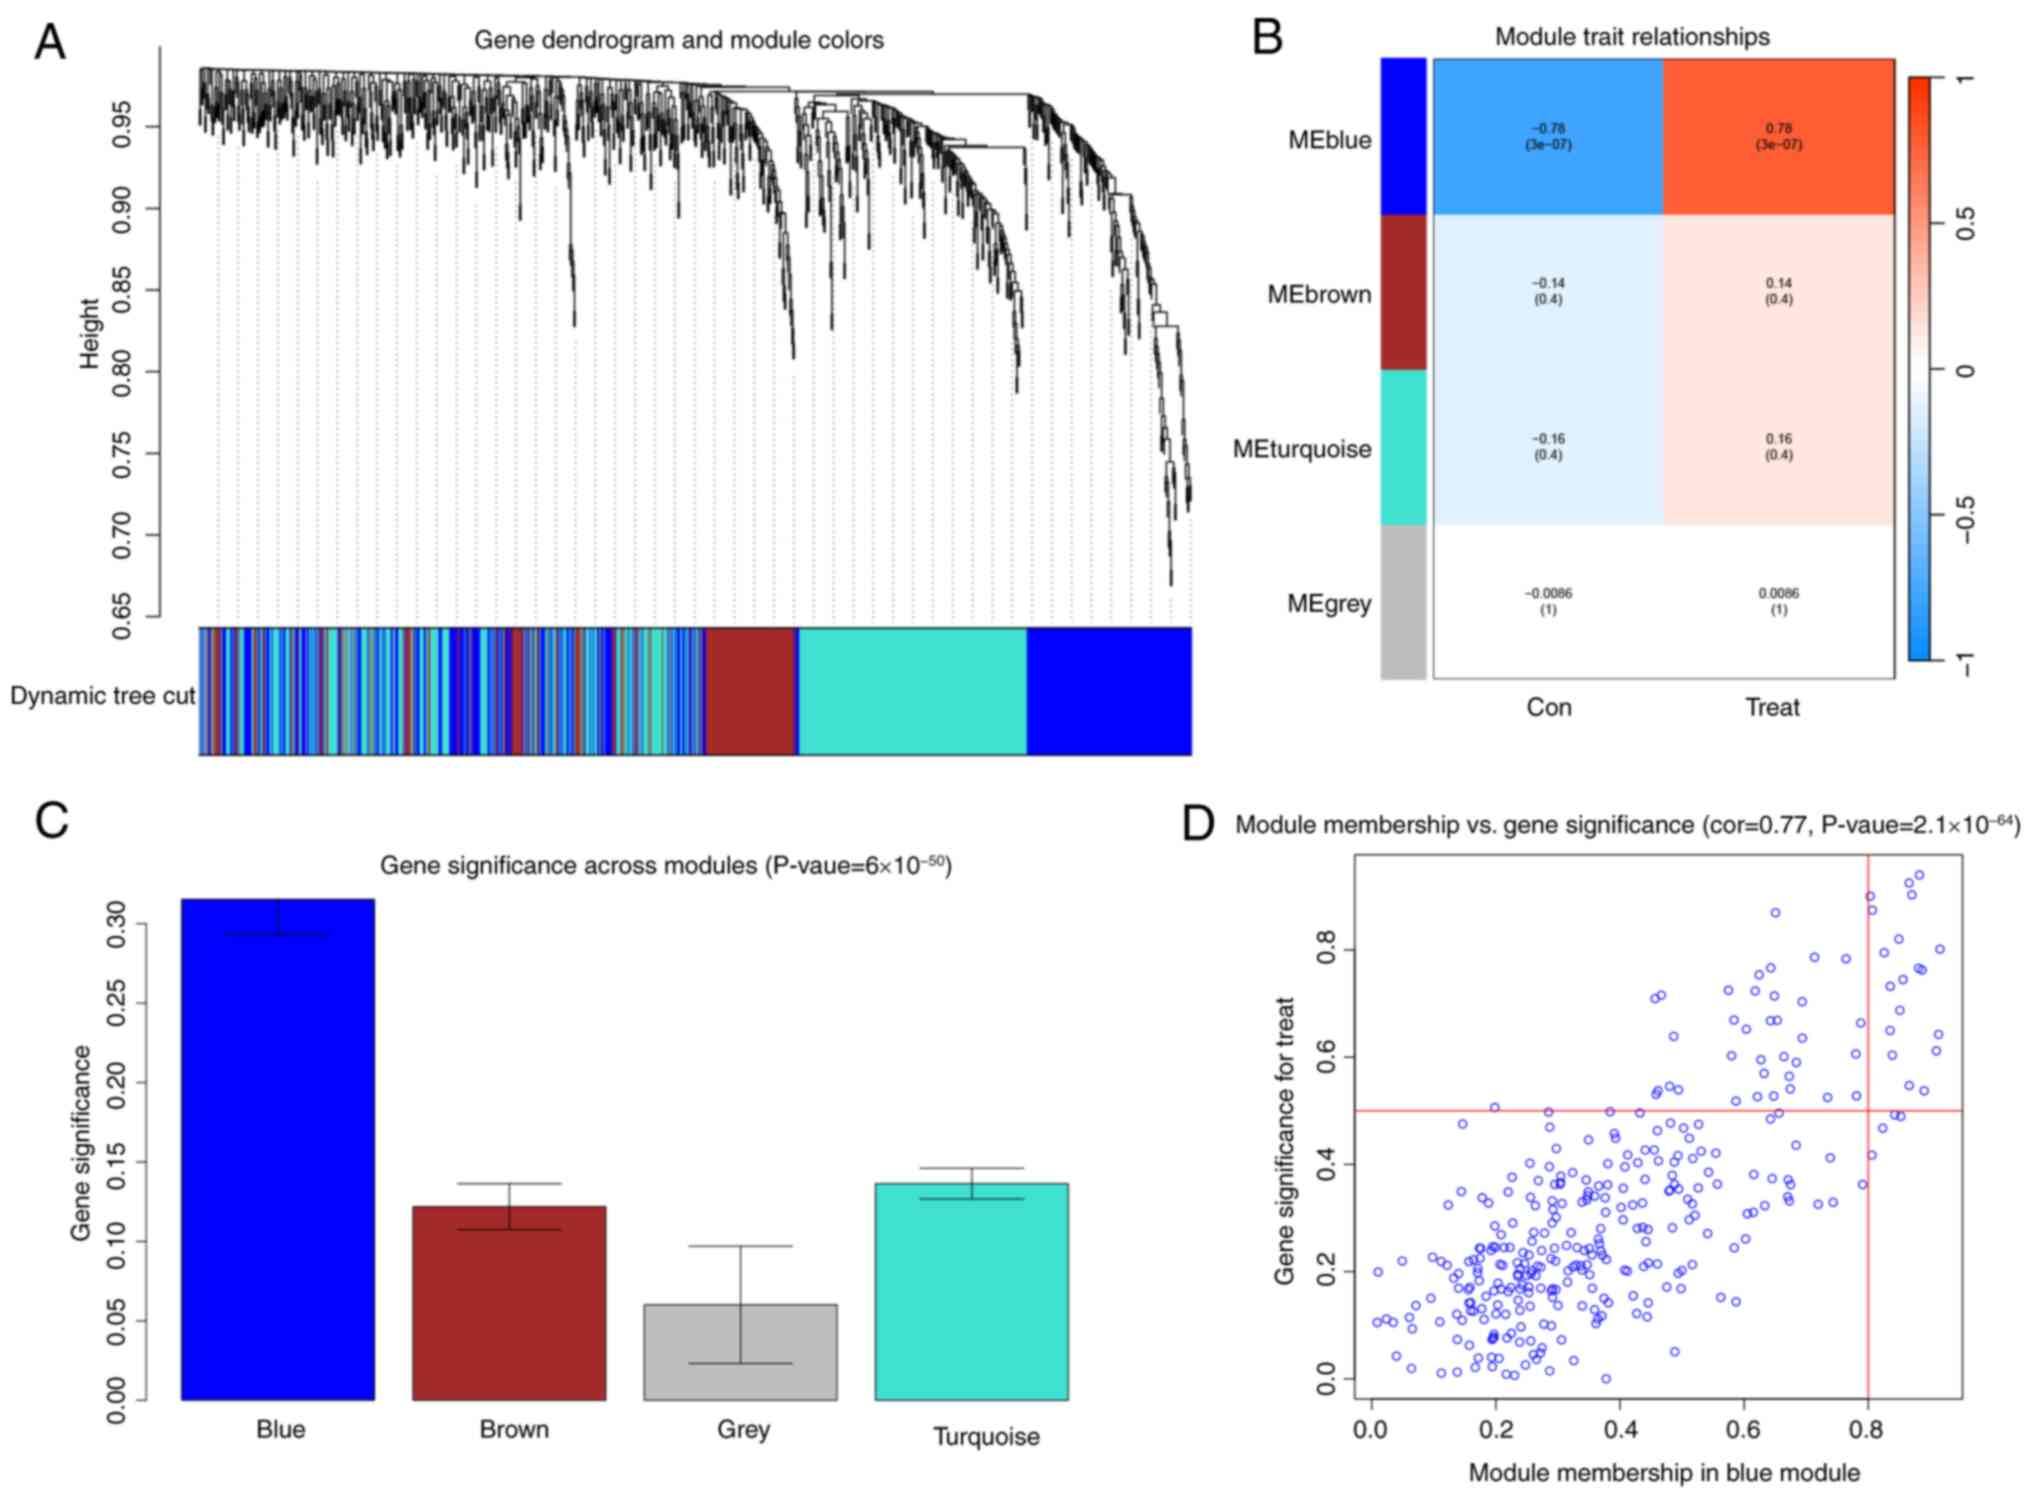
After conducting a WGCNA, the blue module was the
most relevant to DCM (Fig. 2A-D).
This module contained 19 functionally diverse hub genes that
represent critical pathways in cardiac pathophysiology. The
metabolic regulators included acyl-CoA thioesterases (ACOT1 and
ACOT2) and acyl-CoA synthetase long-chain family member 6 (ACSL6),
which coordinate lipid metabolism, along with β-hydroxybutyrate
dehydrogenase (BDH1) and 3-hydroxy-3-methylglutaryl-CoA synthase 2
(HMGCS2), key enzymes in ketone body metabolism. Extracellular
matrix remodeling was represented by collagen type I α2 chain
(COL1A2) and collagen type III α1 chain (COL3A1), while immune
modulation involved CD74 molecule (CD74) and cathepsin K. Metabolic
enzymes included cytochrome P450 2E1 (CYP2E1), hexokinase 2 (HK2),
and microsomal glutathione S-transferase 1 (MGST1). Additional
significant genes were natriuretic peptide A, pyruvate
dehydrogenase phosphatase catalytic subunit 2 (PDP2), proenkephalin
(PENK), phosphatidylinositol-4-phosphate 3-kinase catalytic subunit
type 2 gamma (PIK3C2G), phospholipase A2 group IIA (PLA2G2A), WAP
four-disulfide core domain 1 (WFDC1), and the uncharacterized
protein LOC102553868. These molecular networks provide crucial
insights into the complex interplay of metabolic dysregulation,
structural remodeling, and inflammatory responses in DCM
development.
Identification and characterization of
DCM signature genes
Using Venn analysis of DEGs and WGCNA module genes,
17 overlapping genes were identified (Fig. 3A). A LASSO regression model was
constructed based on the expression matrix of these genes. Using
the GLMNET package, the cross-validation curves (Fig. 3B) and LASSO coefficient path
diagrams (Fig. 3C) of the model
were visualized. Ultimately, four disease signature genes (HMGCS2,
PIK3C2G, HK2 and MGST1) were identified. A comparative analysis of
the expression of these genes was conducted in both the internal
and external datasets using the limma package. Next, the ggpubr
package was employed to visualize the differences in gene
expression between the disease and control groups using boxplots
(Fig. 3D and F). Compared with the
control group, HK2 expression was downregulated in the DCM group,
while the expression of HMGCS2, PIK3C2G and MGST1 was upregulated.
Finally, the diagnostic value of signature genes for DCM was
assessed using the pROC package. All four genes demonstrated high
diagnostic value for DCM, with AUC >0.9 (Fig. 3E and G).
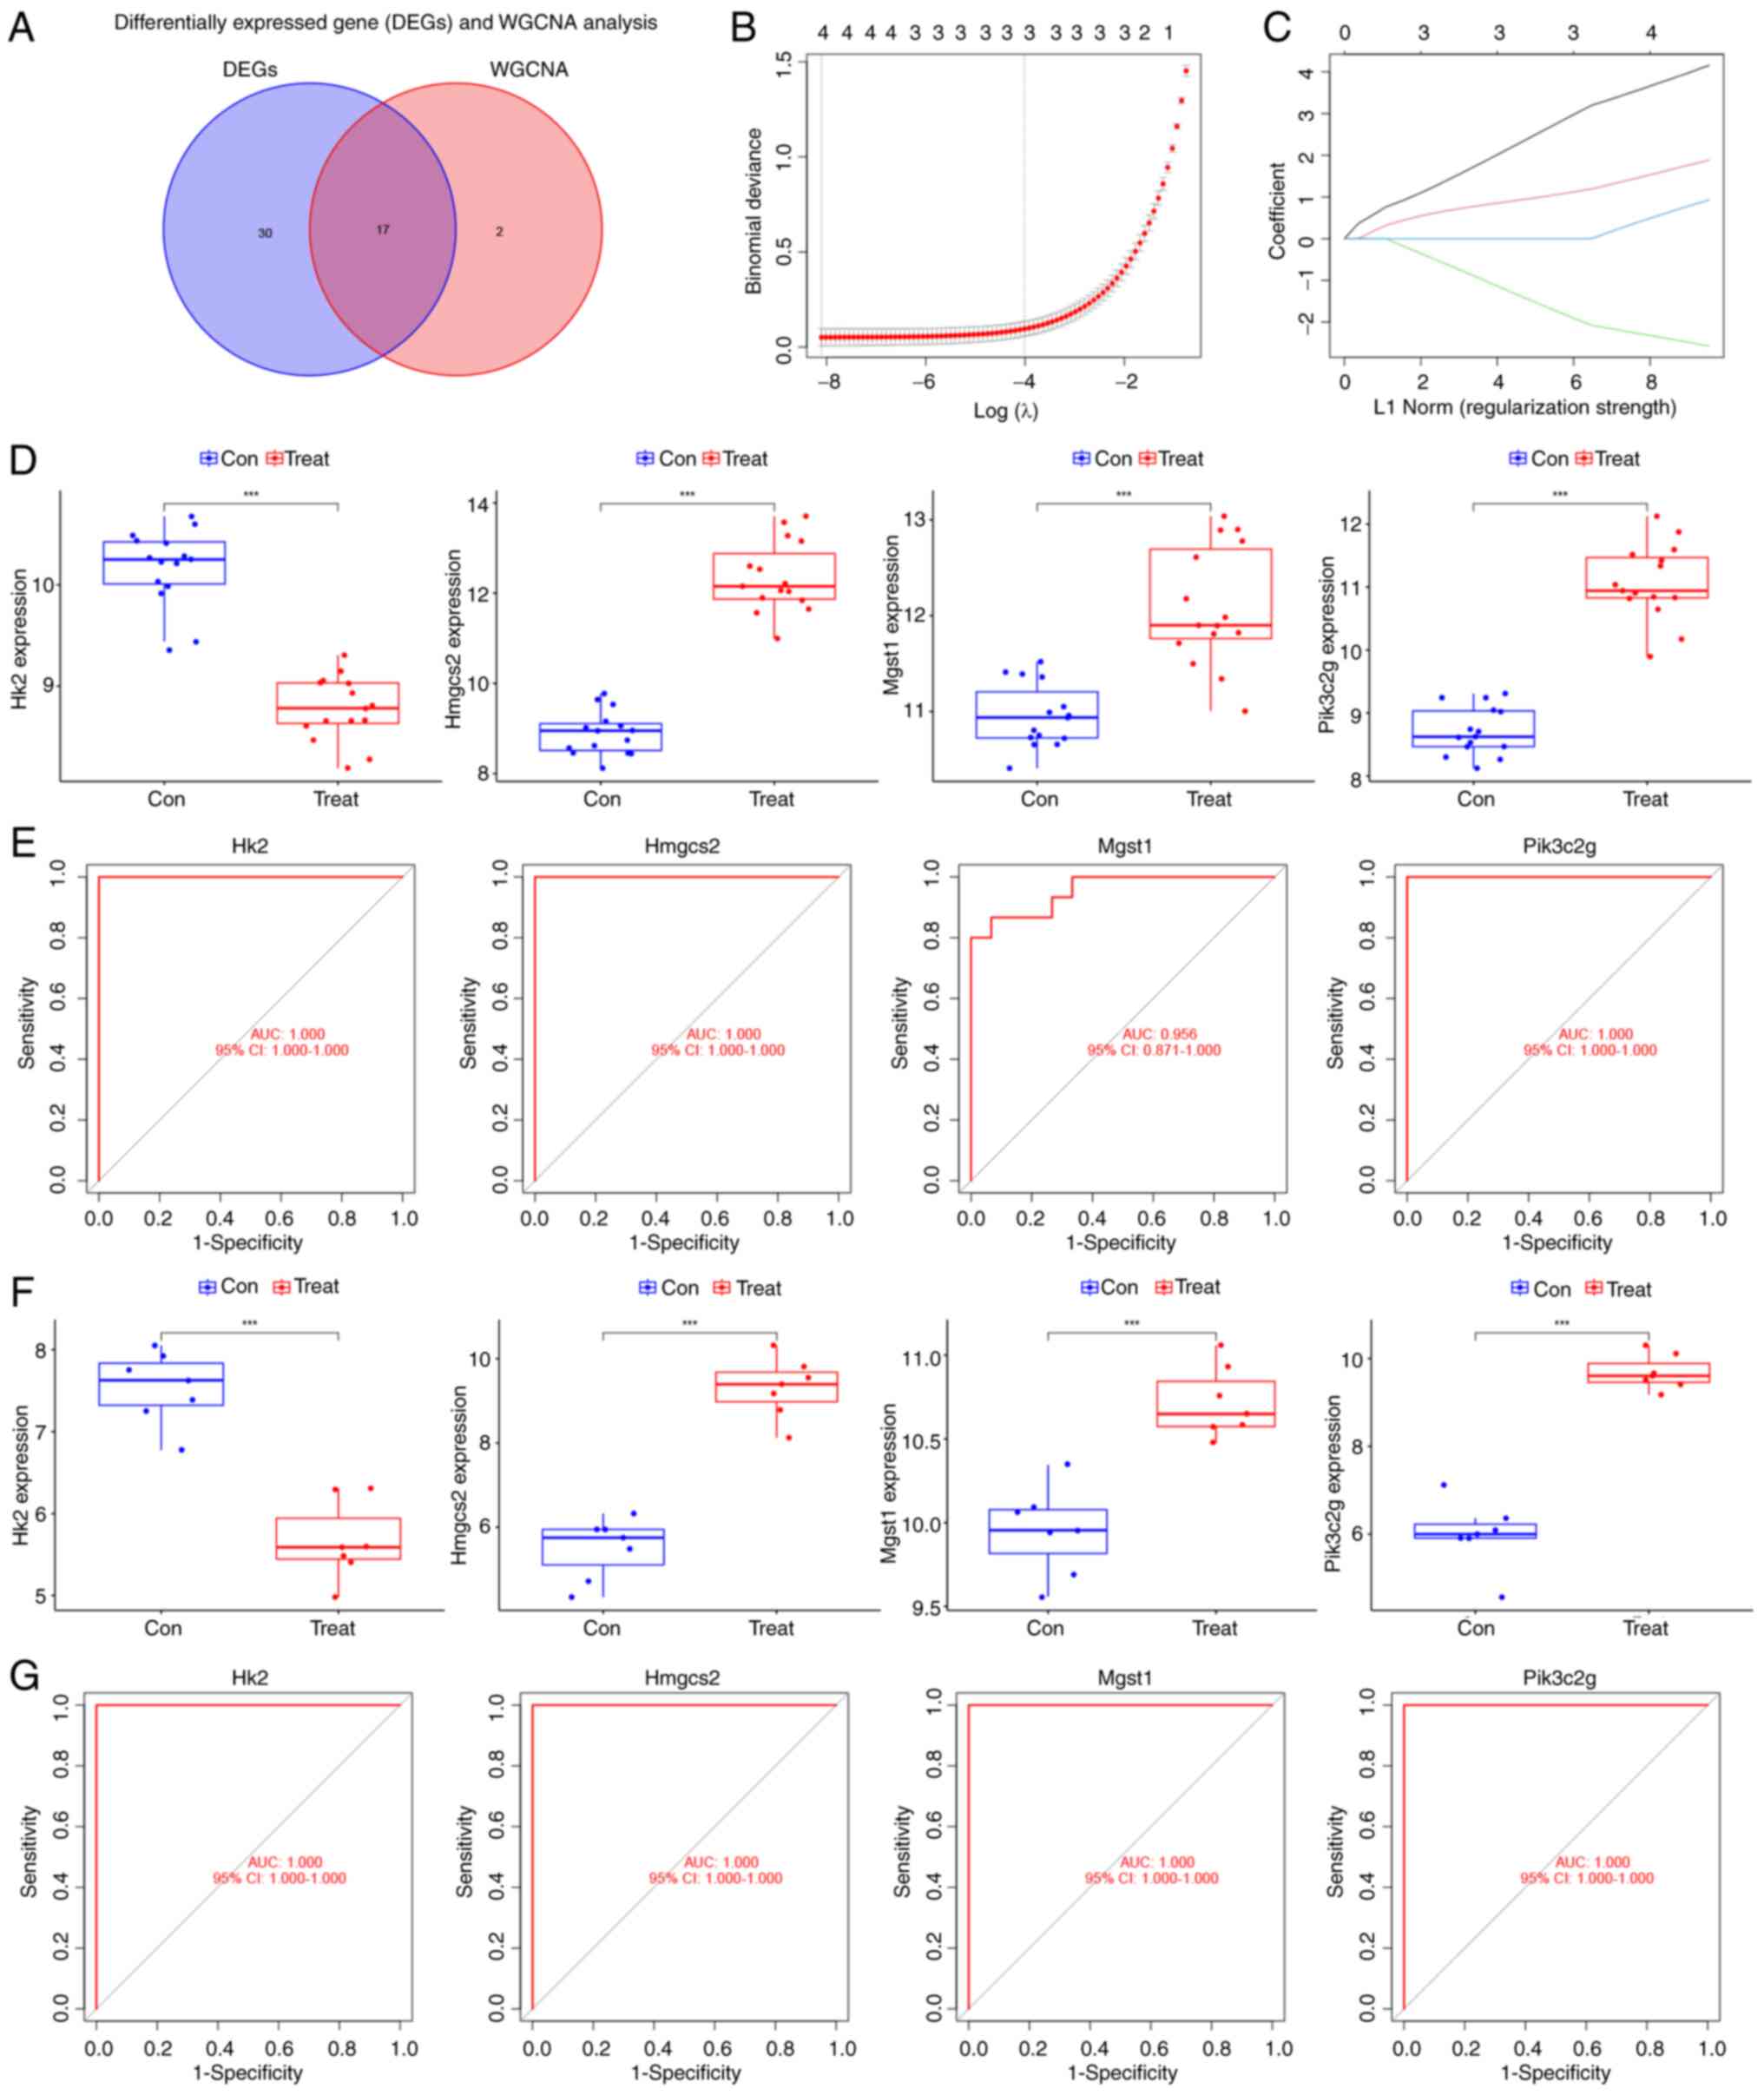 | Figure 3.LASSO regression analysis and
validation of intersecting genes in DCM. (A) Venn diagram of
intersecting genes in the differentially expressed genes and WGCNA
modules. (B) Cross-validation curves of the LASSO regression
analysis. (C) LASSO coefficient path plots of feature genes, with
each curve representing the coefficient trajectory of a variable
gene. LASSO regression employed an L1 norm penalty, defined as the
sum of absolute coefficient values (Σ|βi|), to enforce
sparsity by driving non-essential feature coefficients to zero. (D)
Differential expression box plots of characteristic genes in the
internal dataset (training dataset). (E) ROC curves of the feature
genes in the internal dataset and area under the curve response
genes for DCM diagnostic value. (F) Differential expression box
plots of the feature genes in the external dataset (validation
dataset). (G) ROC curves of genes in the external dataset.
***P<0.001. LASSO, least absolute shrinkage and selection
operator; DCM, diabetic cardiomyopathy; ROC, receiver operating
characteristic; Con, control; Treat, treated; WGCNA, weighted gene
co-expression network analysis; AUC, area under the curve; CI,
confidence interval; HK2, hexokinase 2; HMGCS2,
3-hydroxy-3-methylglutaryl-CoA synthase 2; MGST1, microsomal
glutathione S-transferase 1; PIK3C2G,
phosphatidylinositol-4-phosphate 3-kinase catalytic subunit type 2
γ. |
Signature gene expression and
validation in HL-1 cardiomyocytes
The surface area of HL-1 cardiomyocytes cultured in
a high-glucose environment was notably increased compared with that
of cardiomyocytes cultured in a low-glucose environment (Fig. 4A). A significant increase in cell
surface area was confirmed by quantitative analysis following 48 h
high-glucose treatment (Fig. 4B).
The number of apoptotic cells was significantly higher following
high-glucose compared with low-glucose treatment (Fig. 4D and E).
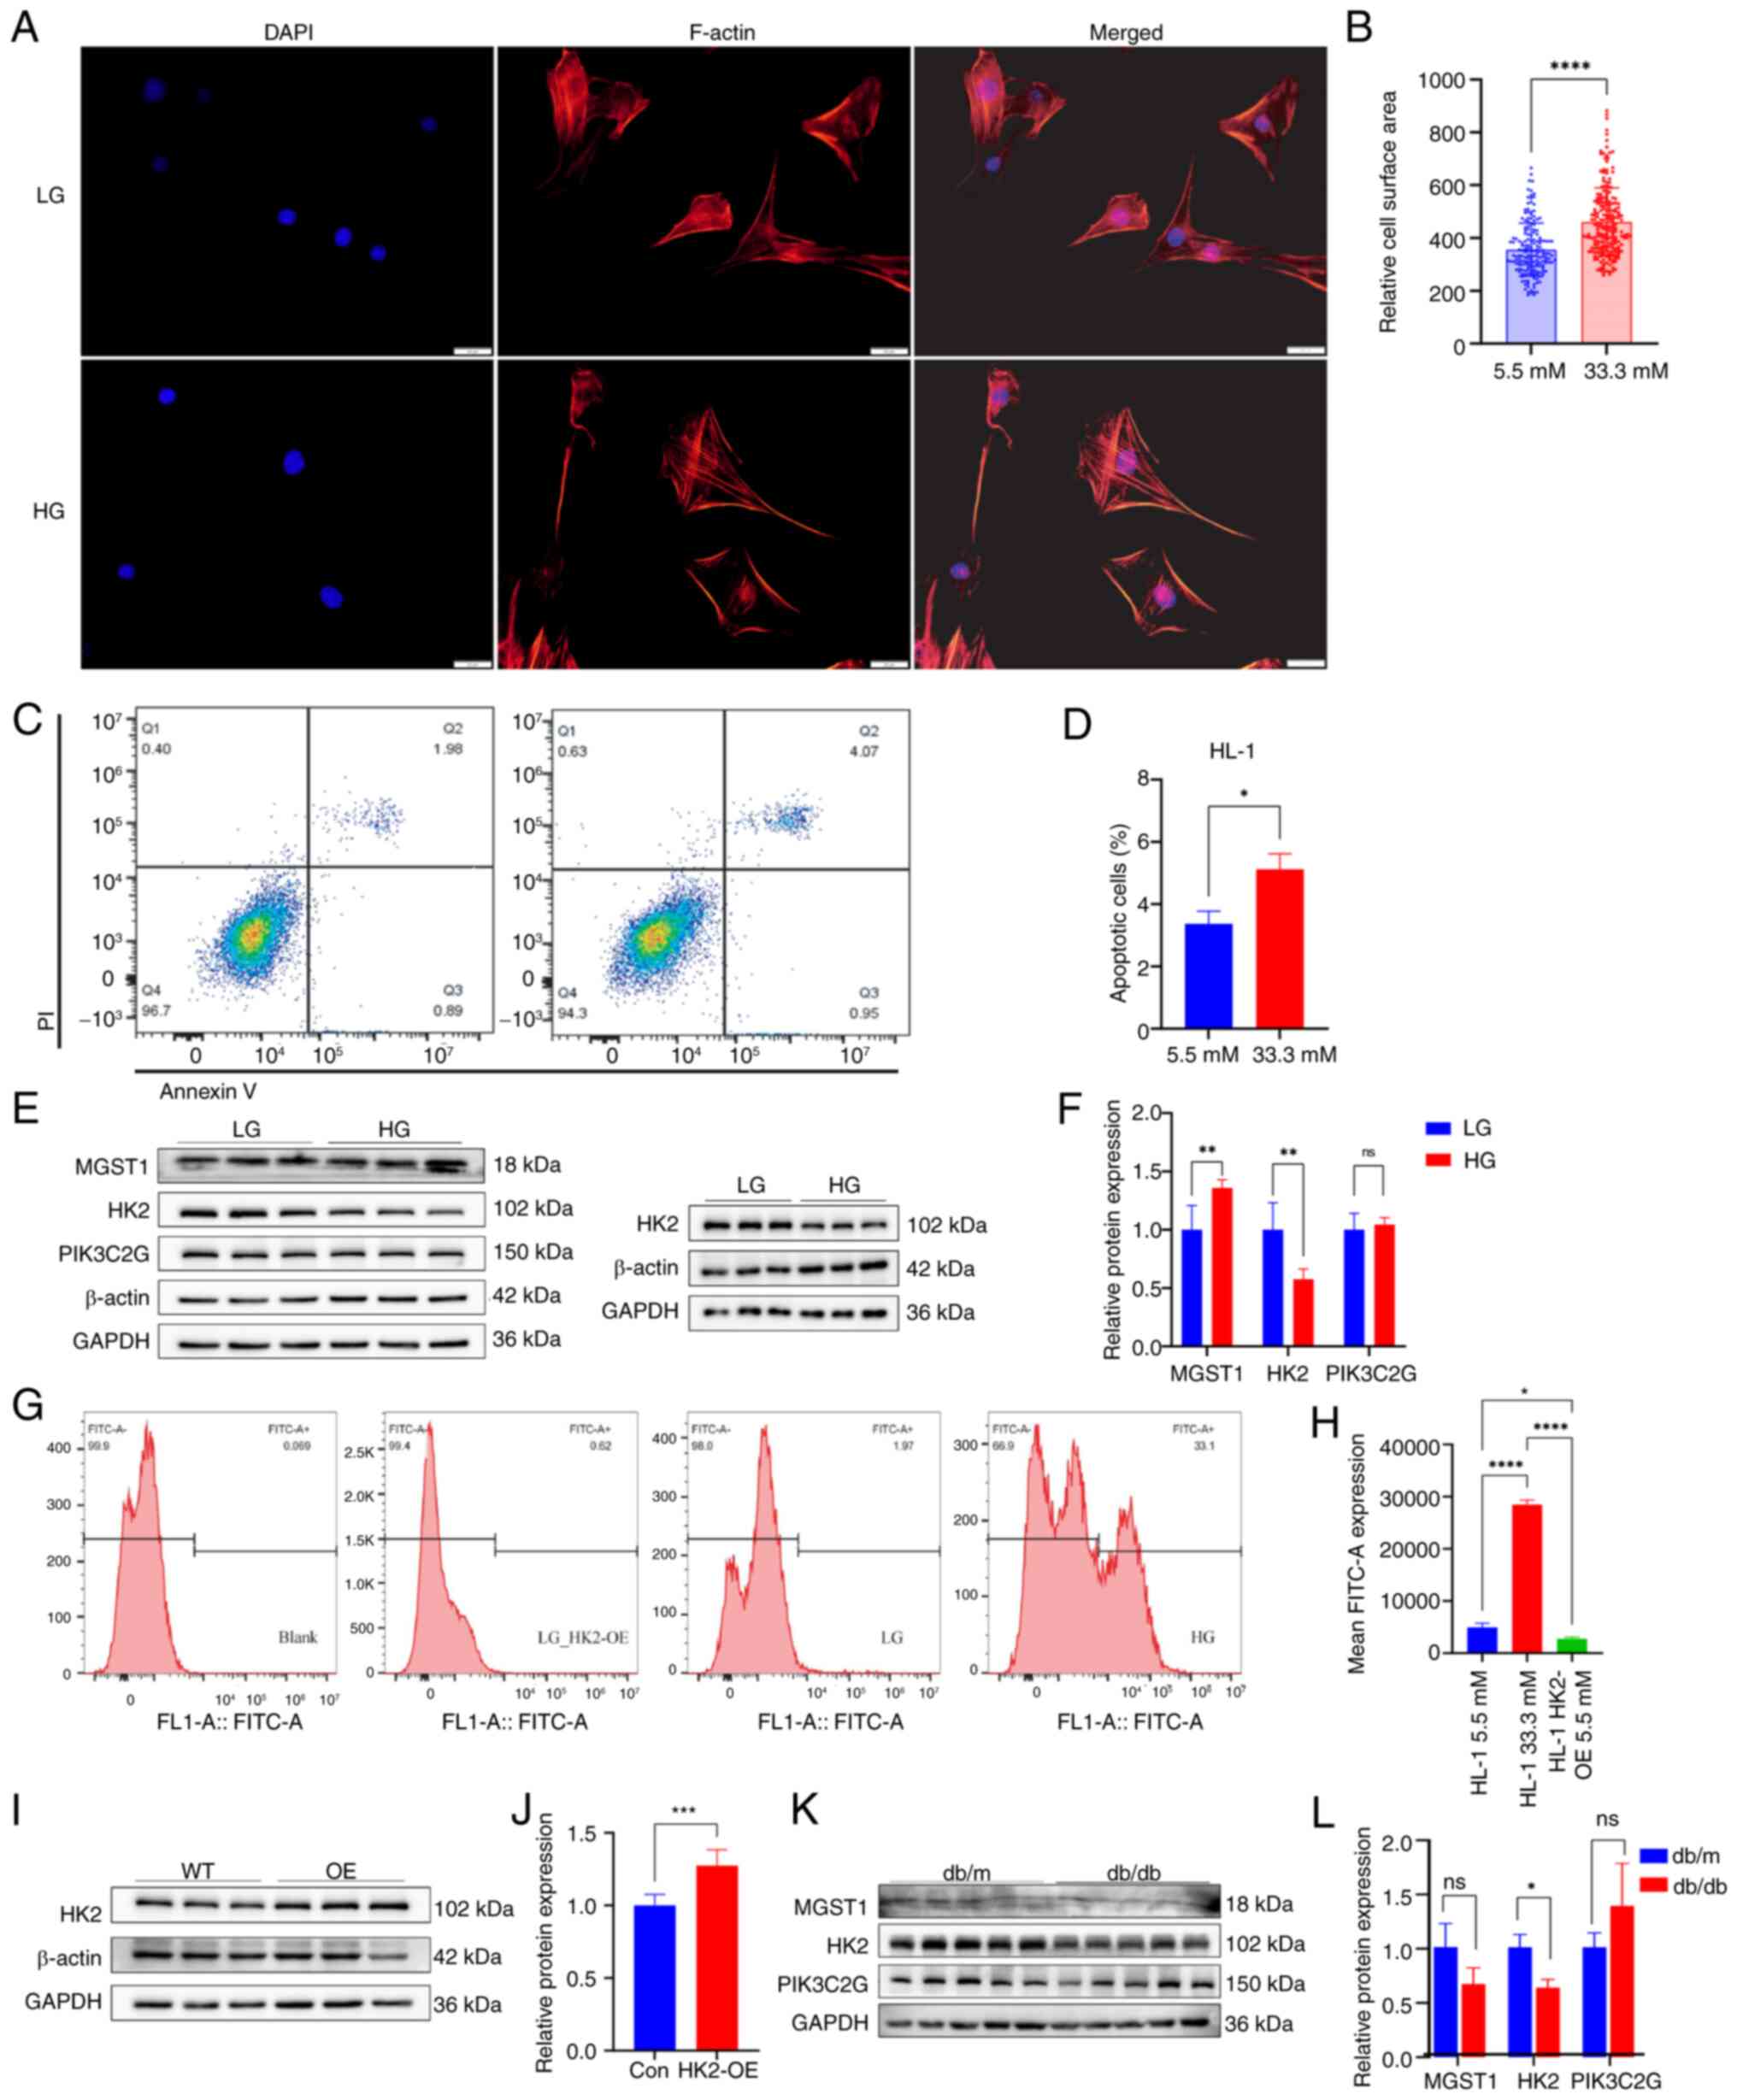 | Figure 4.Validation of the HL-1 cardiomyocyte
model and western blot analysis of myocardial tissue. (A) F-actin
in HL-1 cardiomyocytes treated with HG or LG. (B) Cell surface
area. (C) HL-1 cardiomyocytes treated for 48 h were subjected to
apoptosis analysis via flow cytometry. (D) Proportion of apoptotic
cells. (E) Western blot analysis of HL-1 cardiomyocytes. (F)
Semi-quantitative results of western blot analysis. (G)
Representative flow cytometry and (H) quantification of ROS levels
revealed high ROS levels in the HG group and a significant decrease
in ROS levels in response to HK2-OE. (I) Representative western
blotting images and (J) semi-quantification of HK2-OE and WT HL-1
cardiomyocytes. (K) Representative western blot and (L)
semi-quantification of db/db and db/m mouse cardiomyocytes.
*P<0.05, **P<0.01, and ****P<0.0001. ROS, reactive oxygen
species; HK2, hexokinase 2; OE, overexpression; LG, low glucose;
HG, high glucose; WT, wild-type; QQ, quantile-quantile; ns, not
significant; F, filamentous; MGST1, microsomal glutathione
S-transferase 1; PIK3C2G, phosphatidylinositol-4-phosphate 3-kinase
catalytic subunit type 2 gamma; con, control. |
Western blot analysis revealed that MGST1 protein
expression increased, while HK2 protein expression decreased in
HL-1 cells treated with high- compared with low-glucose (Fig. 4E and F). PIK3C2G expression did not
significantly differ between low-glucose and high-glucose treatment
groups (Fig. 4E and F)
ROS production was significantly elevated in HL-1
cells treated with high-glucose, whereas ROS production was
significantly decreased in HL-1 cells following HK2-OE (Fig. 4G and H). The increase in HK2
protein expression after HK2-OE was validated by a lentiviral
transfection assay (Fig. 4I and
J).
The present study found that HK2 was abundantly
expressed in the nuclei of HL-1 cells cultured under high-glucose
conditions (Fig. S1), suggesting
it may influence the regulation of disease-associated genes in DCM.
LLPS was detected in both HK2-WT and HK2-OE HL-1 cardiomyocytes by
immunofluorescence analysis (Fig.
S2).
Mouse model validation and
histological testing
In the present study, db/db mice were selected as a
model for T2D, whereas db/m mice served as the control group.
Western blot analysis of cardiac tissue revealed that HK2 was
expressed at lower levels in the cardiac tissue of db/db compared
with db/m mice. The difference in MGST1 and PIK3C2G cardiac tissue
expression between the two groups was not significant (Fig. 4K and L). The heart-to-body weight
ratio and the heart weight-to-tibia length ratio did not
significantly differ between the two groups (Fig. 5A). Gross examination of the cardiac
tissue indicated that the hearts of db/m mice were larger than
those of db/db mice (Fig. 5B). A
total of one db/db mouse died at ~32 weeks of age, and four of the
surviving db/db mice exhibited significant frontal bladder overfill
(4/5), suggesting the possibility of neurogenic cystitis with
urinary retention (Fig. 5C).
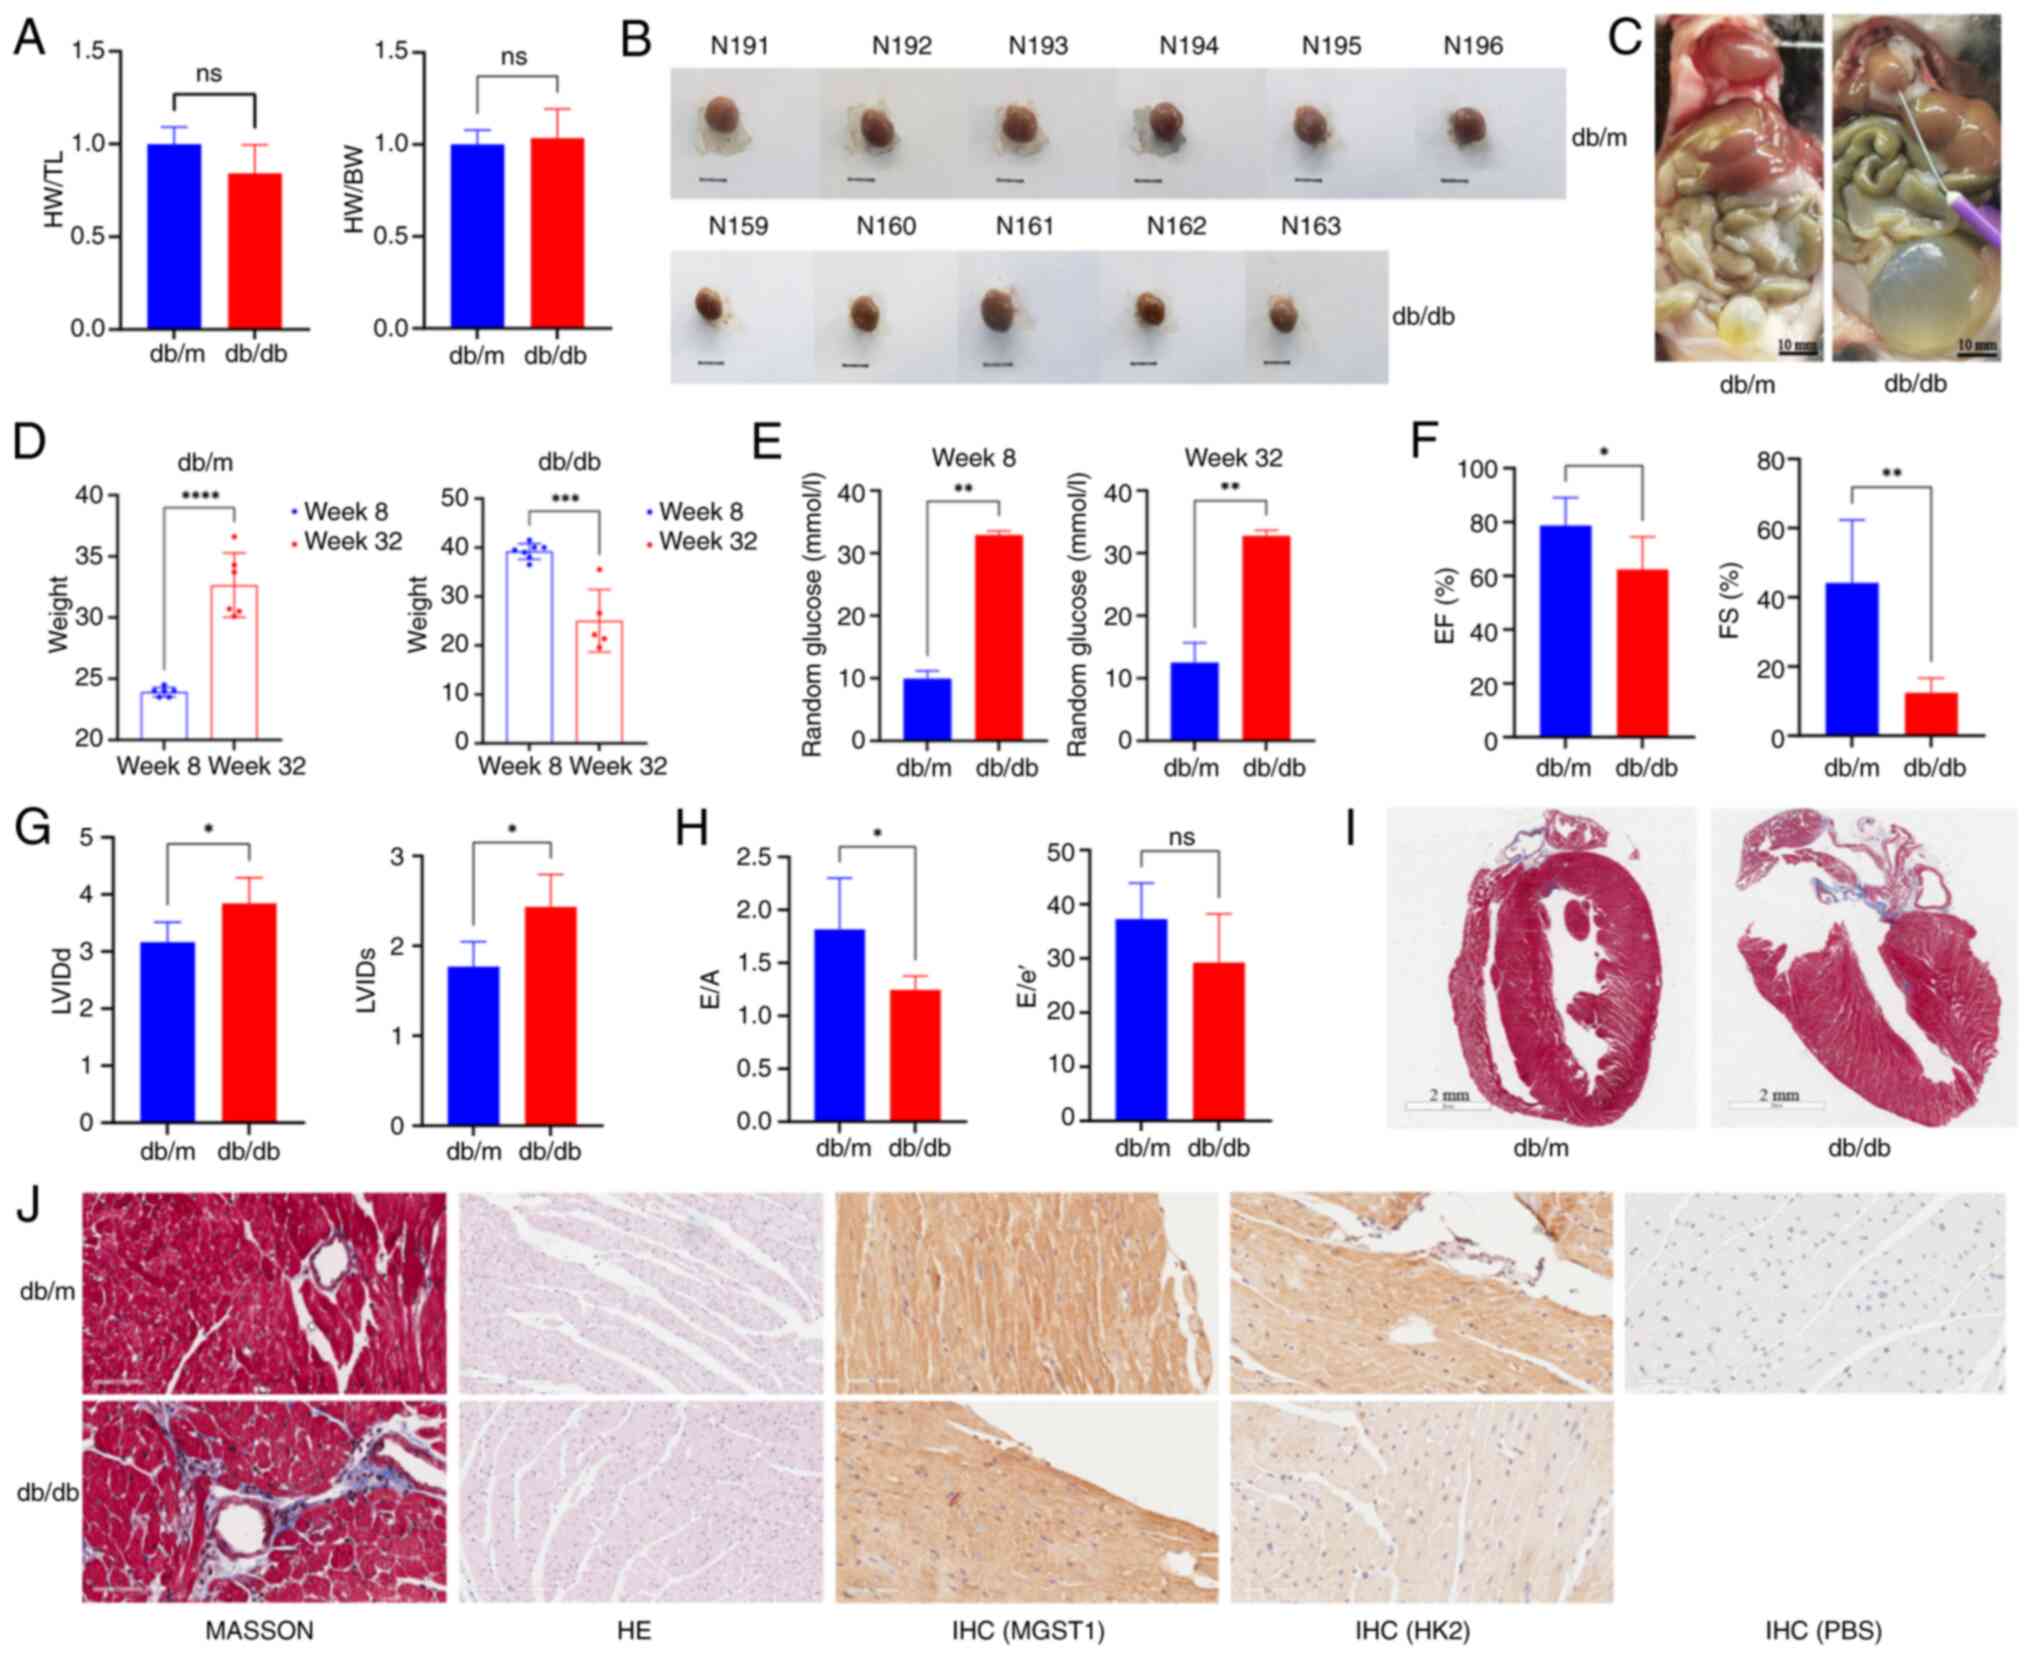 | Figure 5.Indicators of metabolic and cardiac
dysfunction, cardiac structure, and function in mice. (A) HW/TL and
HW/BW ratio. (B) Mouse hearts. N191-N196 are db/m mouse hearts,
while N159-N163 are db/db mouse hearts. Scale bar, 5 mm. (C) Mouse
anatomy. db/db mice exhibited large white fat deposits on the heart
surface and overfilled bladders. (D) Mouse body weight change. (E)
Blood glucose levels. (F) EF. (G) LVIDd and LVIDs. (H) E/A and E/e’
ratios reflecting cardiac diastolic function. (I) Masson staining
of left ventricular long axis sections. (J) Masson, H&E and
immunohistochemical staining of cardiac tissue. Compared with db/m
mice, db/db mice presented severe fibrosis, decreased cardiomyocyte
hypertrophy, reduced tissue gap and low hexokinase 2 expression.
*P<0.05, **P<0.01, ***P<0.001 and ****P<0.0001. ns, not
significant; IHC, immunohistochemistry; H&E, hematoxylin and
eosin; EF, ejection fraction; LVIDd, diastolic left ventricular
internal diameter; LVIDs, systolic left ventricular internal
diameter; HW, heart weight; TL, tibia length; FS, fractional
shortening; BW, body weight; E/A, early-to-late diastolic mitral
inflow ratio; E/e’, early diastolic mitral annular velocity to
early diastolic mitral inflow ratio; MGST1, microsomal glutathione
S-transferase; HK2, hexokinase 2. |
To evaluate the effects of the intervention, blood
glucose levels and body weight were measured at 8 and 32 weeks of
age. At 8 weeks, the body weight of the db/db mice was
significantly greater than that of the control mice, with a mean
body weight ranging from 35 to 40 g. However, at 32 weeks, the
db/db mice exhibited a significant decrease in body weight, and
their mean weight was notably lower compared with that of the
control mice (Fig. 5D). Blood
glucose levels were significantly elevated in db/db mice compared
with control mice at 8 and 32 weeks (Fig. 5E). Echocardiography data indicated
that the LVEF and LVFS were significantly lower in db/db compared
with db/m mice at 32 weeks (Fig.
5F). Additionally, the left intraventricular diameter was
greater in db/db mice (Figs. 5G
and S3), and diastolic function
was impaired in these mice (Fig.
5H). Histological staining revealed increased cardiac fibrosis
and cardiomyocyte hypertrophy in db/db mice (Fig. 5I and J).
Immunohistochemistry staining revealed no notable
difference in MGST1 expression. By contrast with db/db mice,
expression of HK2 was higher in the cardiac tissue of db/m mice.
Similarly, the expression levels of HK2 in both db/m and db/db mice
were greater than those in the PBS-treated controls (Fig. 5J).
Transcriptomic analysis and metabolic
data
Transcriptomic sequencing analysis was conducted on
HK2-WT and HK2-OE cells. Energy and lipid metabolisms were
quantitatively analyzed in six samples from each group.
Transcriptomic sequencing was performed using Illumina
high-throughput sequencing platform, which included three HK2-WT
and three HK2-OE samples. Similarities between the samples were
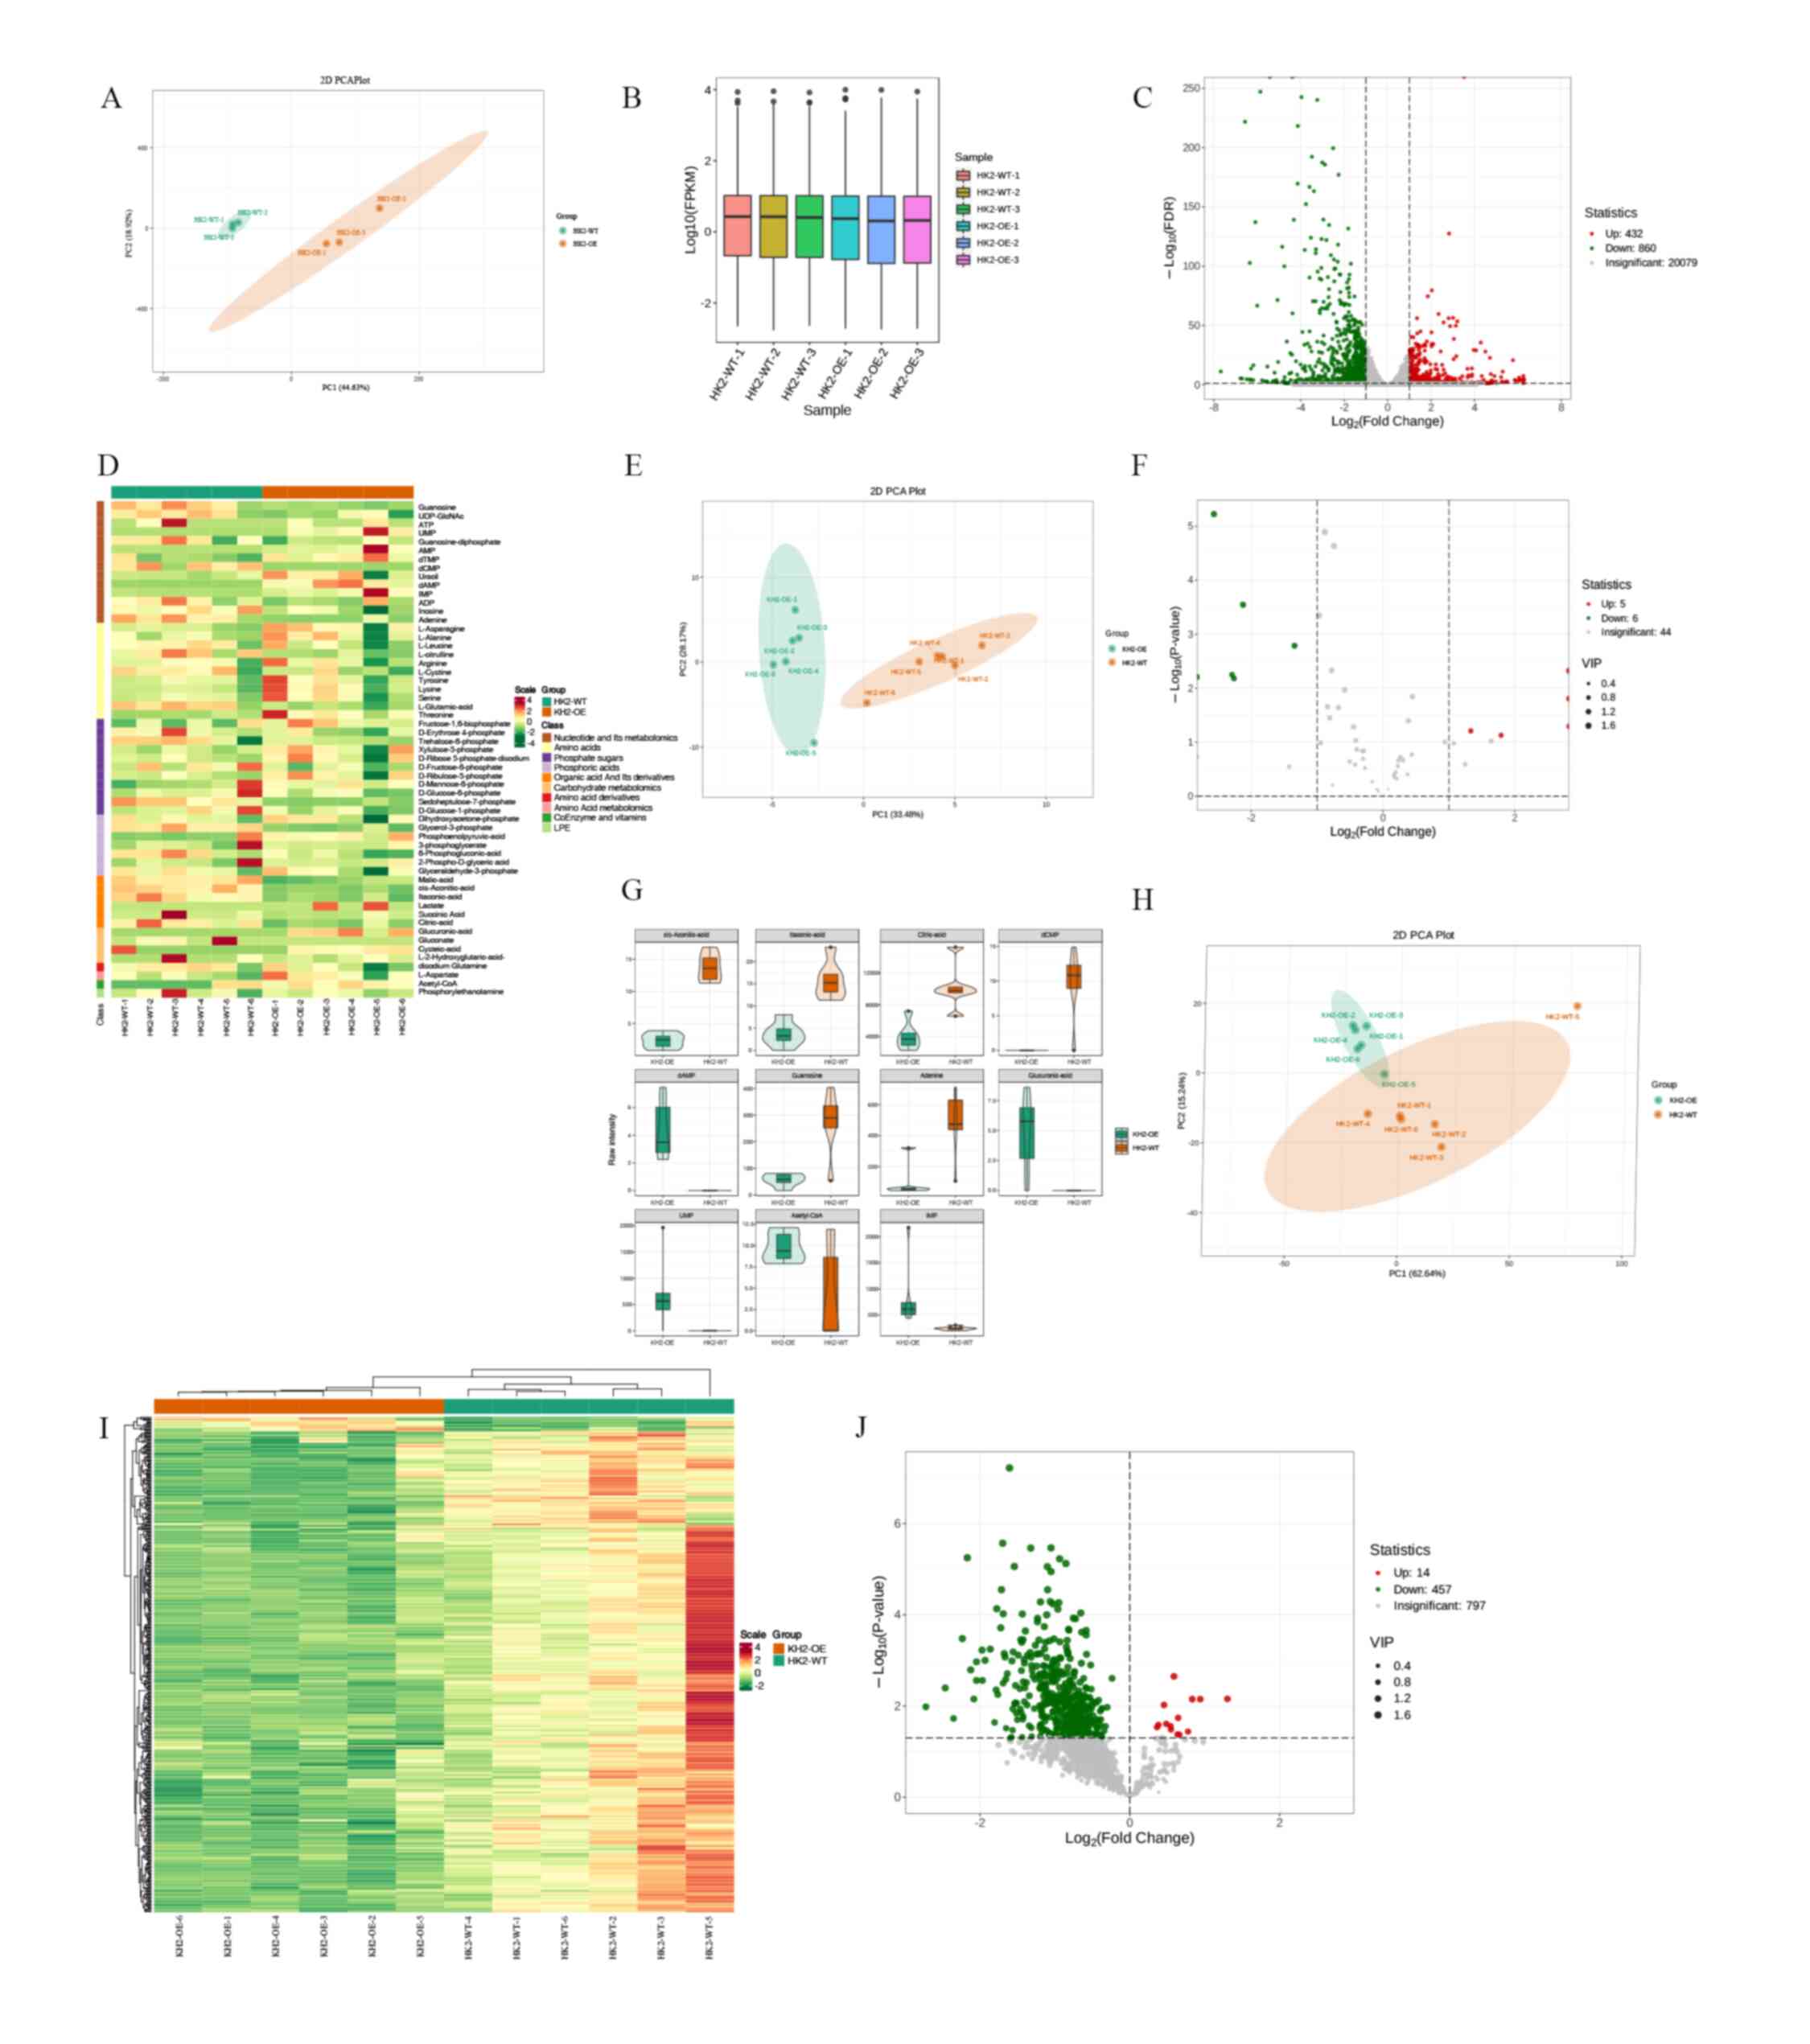
assessed through principal component analysis (PCA) (Fig. 6A). Gene expression was quantified
using fragments per kilobase of transcript per million fragments
mapped as a measure of gene expression levels (Fig. 6B). DEGs were identified with |log2
(fold-change)|≥1 and a false discovery rate <0.05.
A total of 1,292 DEGs were identified, comprising
432 up- and 860 downregulated genes (Fig. 6C). Energy metabolomics analysis was
performed using a LC-MS/MS detection platform in conjunction with
the MetWare database, resulting in the detection of 57 metabolites
(Fig. 6D; Table SIV). Differences in metabolites
within sample groups were analyzed using PCA (24) (Fig.
6E). In total, 11 differentially expressed metabolites were
identified based on fold-change ≥2 and ≤0.5 (Fig. 6F and G; Table SV). Lipid metabolomics was used to
quantify 1,269 lipids, and PCA was used to elucidate the overall
metabolic differences and variability between samples within groups
(Fig. 6H). Lipid cluster analysis
revealed significant differential expression of genes associated
with lipid metabolism (Fig. 6I).
After screening for variable importance in projection value >1
and P<0.05, 471 differential lipids were identified (Fig. 6J; Table SVI).
Co-analysis of transcriptomics and
energy metabolism
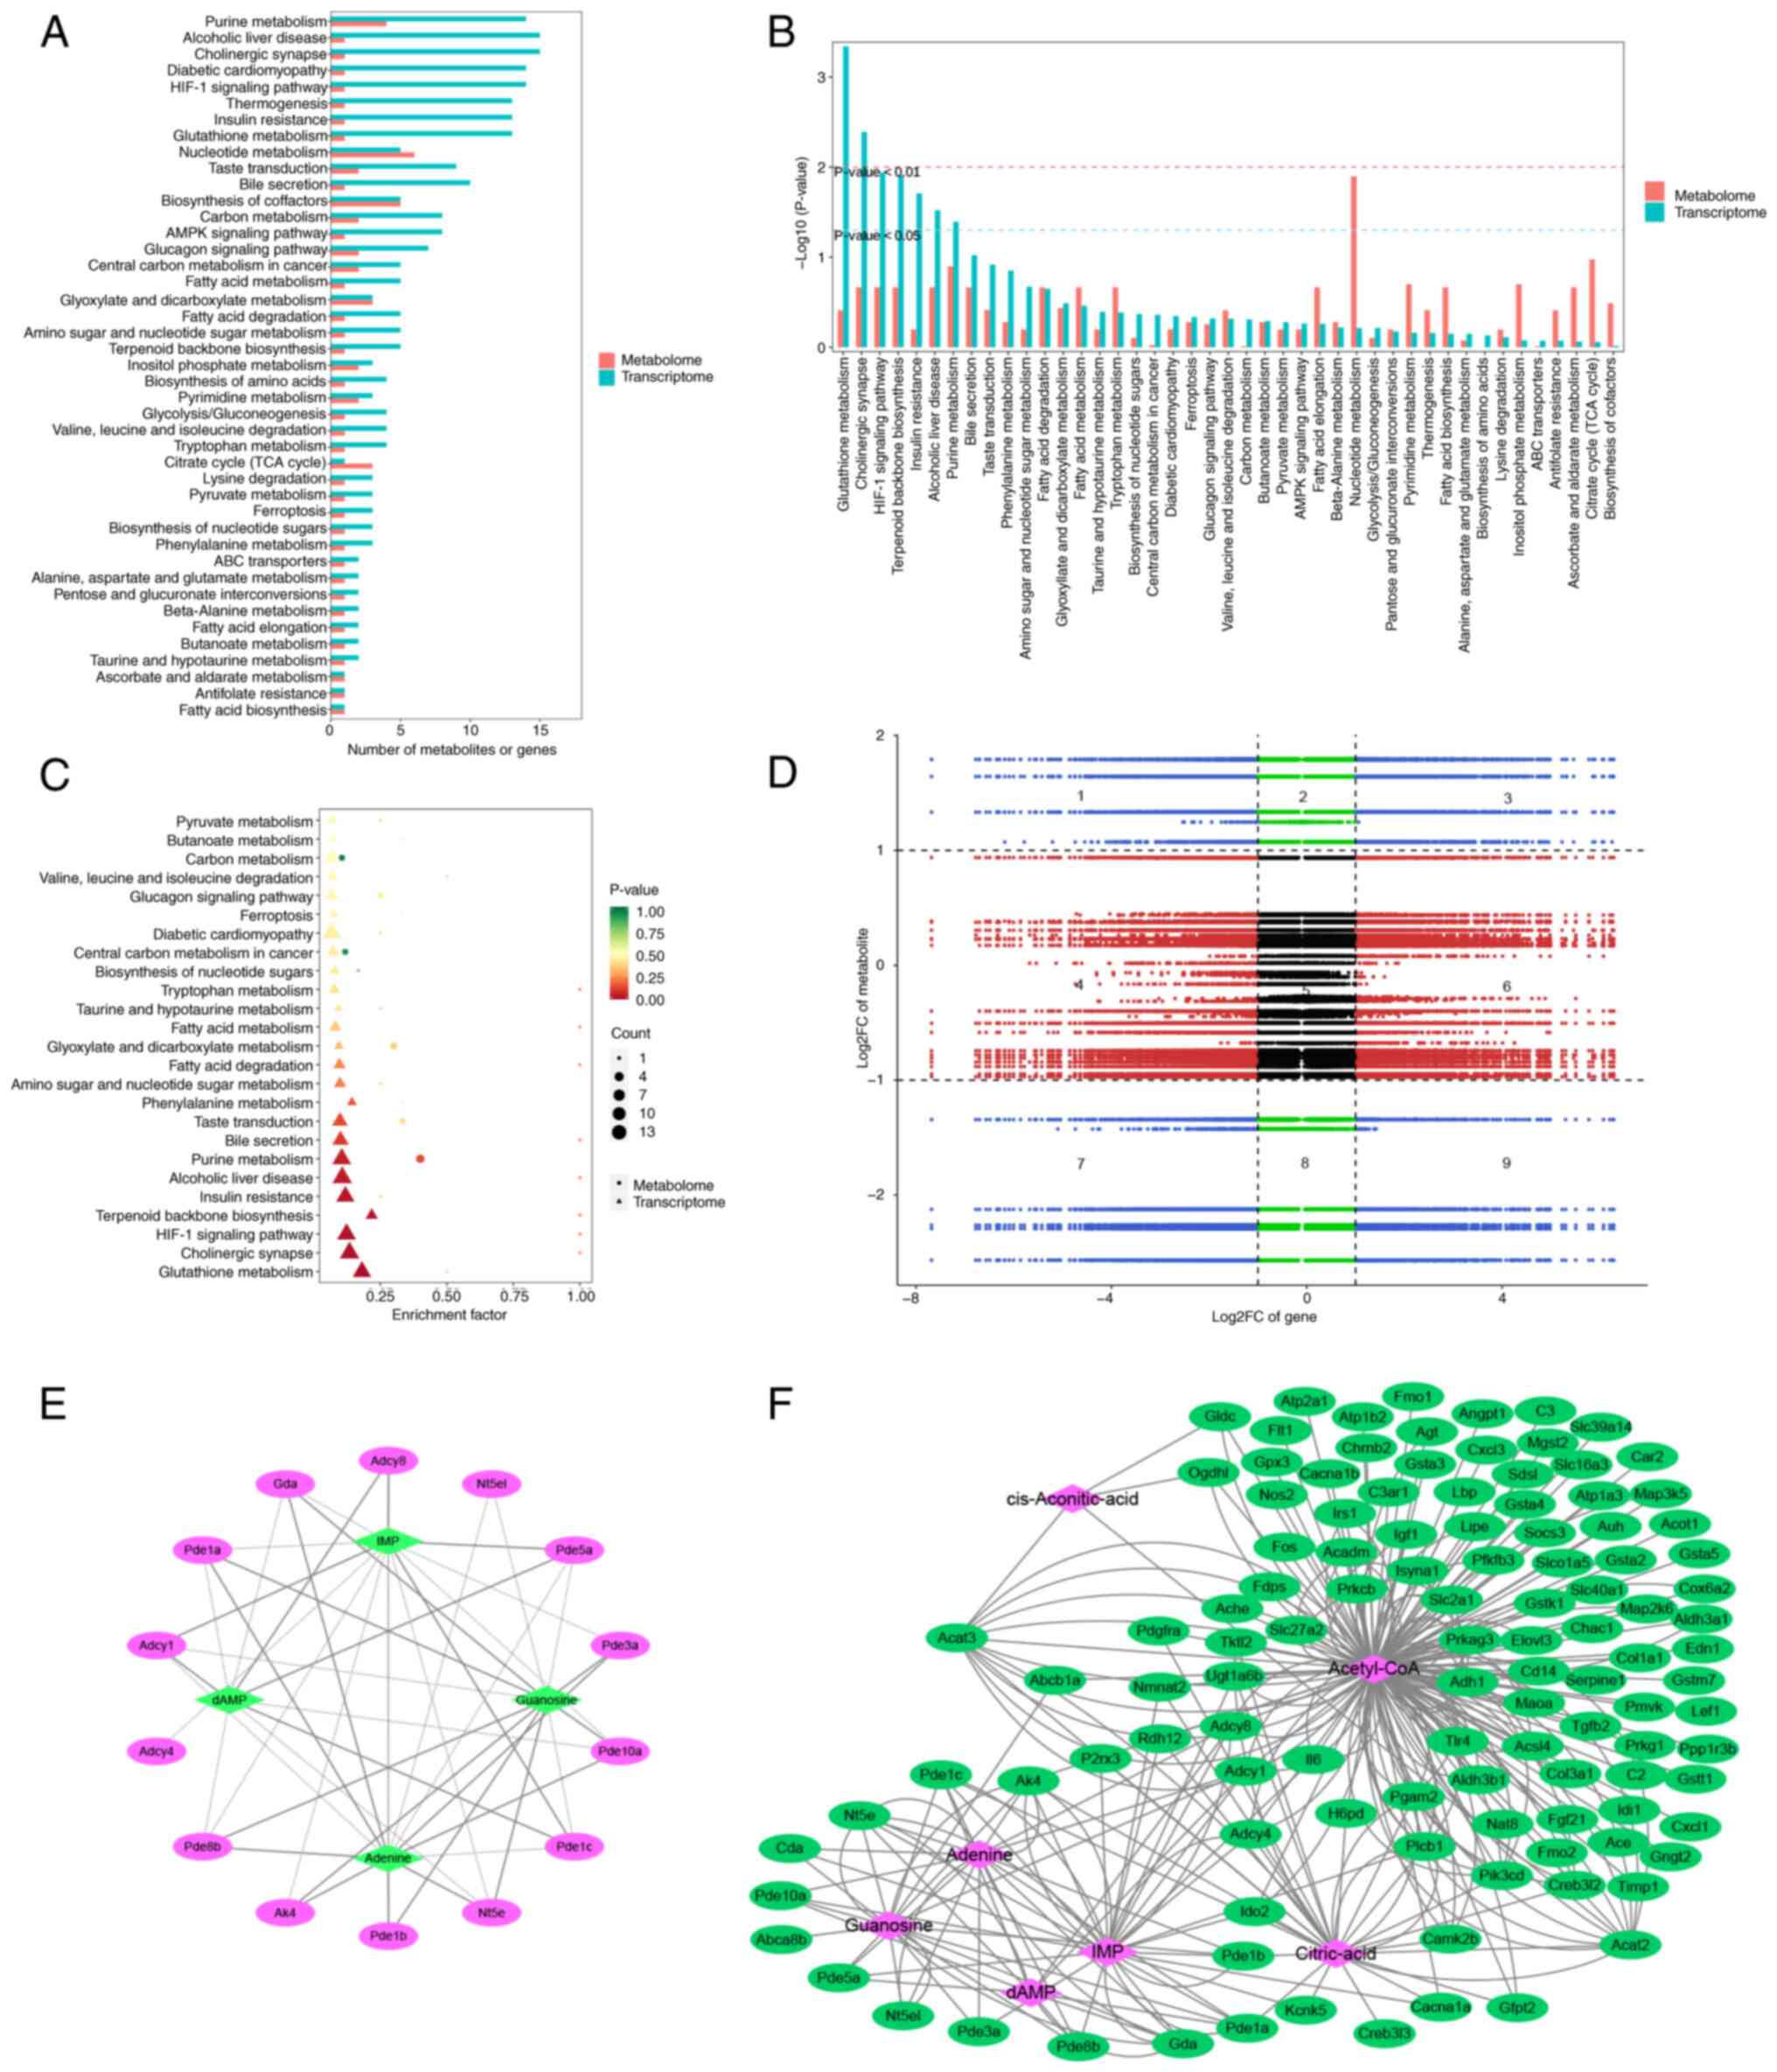
KEGG pathway enrichment was compared to identify
co-enriched KEGG pathways (Fig.
7A). DEGs and metabolites were enriched in ‘purine metabolism’,
‘nucleotide metabolism’ and ‘biosynthesis of cofactors’. KEGG
enrichment analysis was conducted using the P-values from the
transcriptome to identify common pathways within the top 50 most
significantly enriched pathways. Transcriptomic analysis revealed
significant enrichment of pathways associated with ‘glutathione
metabolism’, ‘cholinergic synapse’, ‘HIF-1 signaling pathway’,
‘terpenoid backbone biosynthesis’, ‘insulin resistance’, ‘alcoholic
liver disease’ and ‘purine metabolism’ (P<0.05). Additionally,
metabolites involved in ‘nucleotide metabolism’ were significantly
enriched (Fig. 7B). Both
histologies exhibited significant enrichment in ‘purine metabolism’
(Fig. 7C).
Gene and metabolite expression patterns showed
consistent differential regulation in quadrants 3 and 7, but
opposing patterns in quadrants 1 and 9 (demarcated by black dashed
lines), which visualizes gene-metabolite fold-change relationships
1 and 9 (Fig. 7D). DEGs and
metabolites enriched in ‘purine metabolism’ were selected for
correlation analysis. A total of four energy-associated metabolites
were significantly associated with 14 genes involved in ‘purine
metabolism’ (Fig. 7E). Finally, by
constructing a correlation network of genes and metabolites, 114
genes associated with seven energy metabolites were identified
(Fig. 7F).
Co-analysis of transcriptomic and
lipid metabolism data
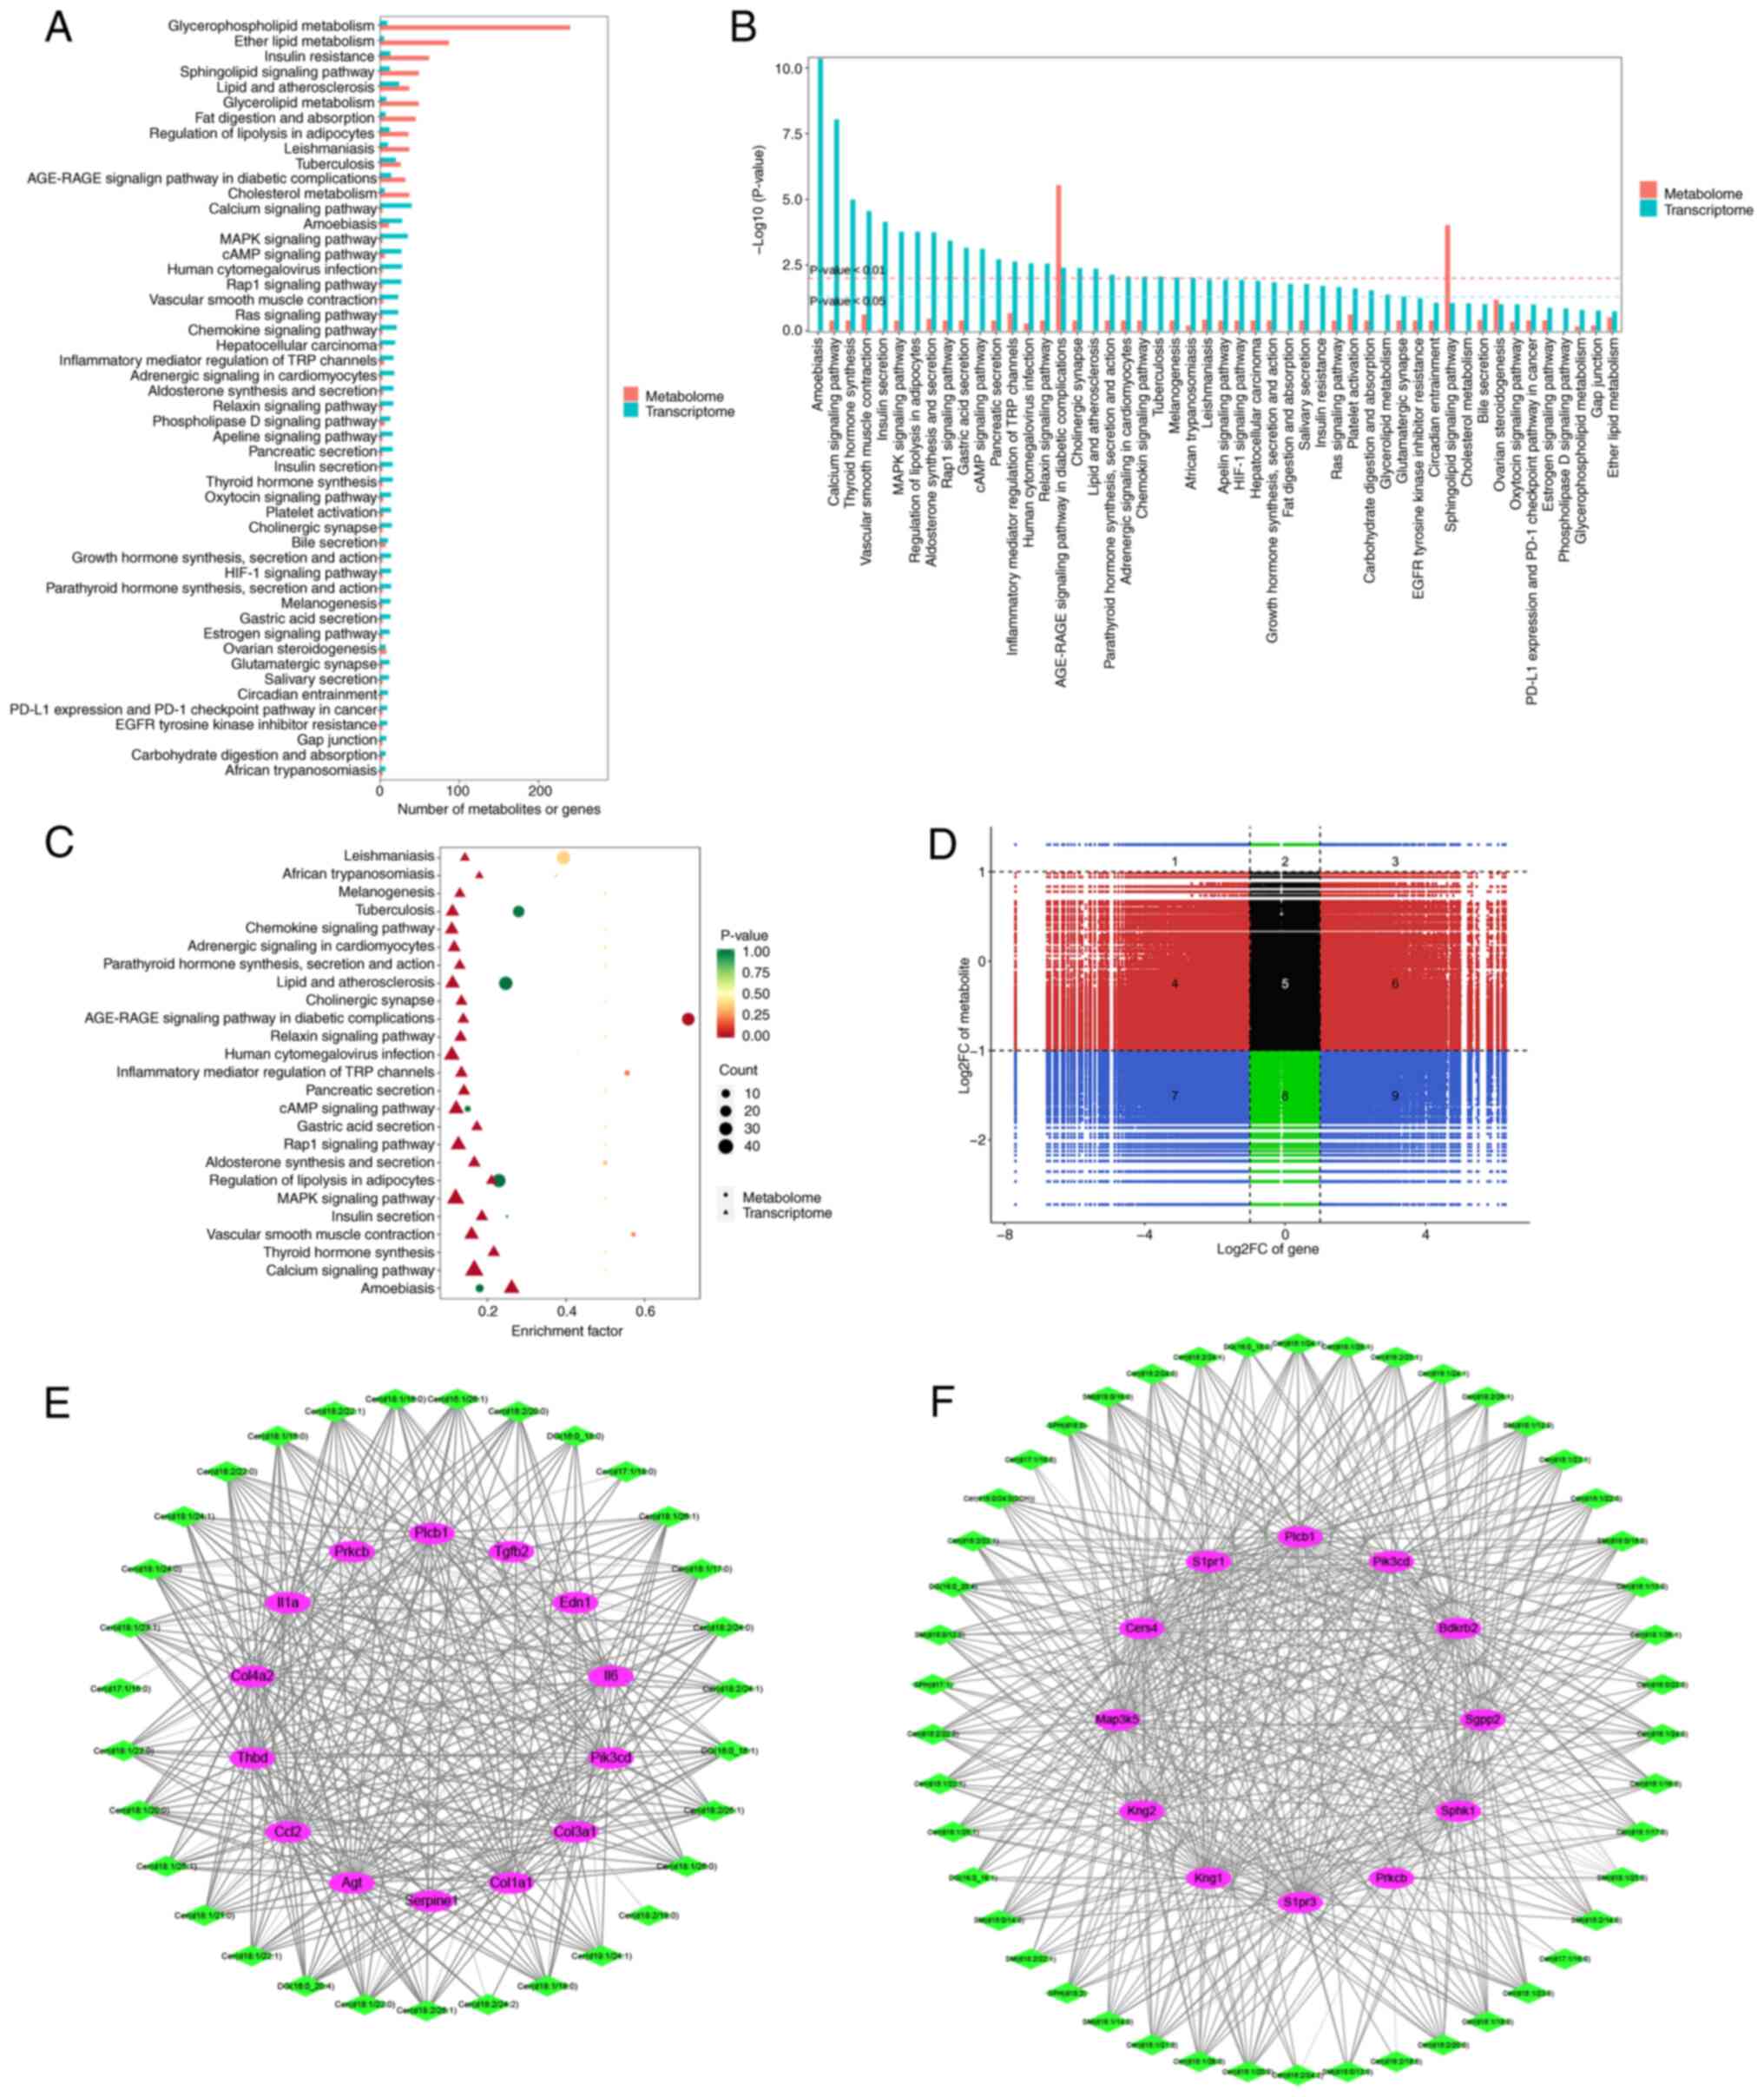
Transcriptomics and lipid metabolomics of the
co-enriched KEGG pathways were compared. Metabolites associated
with ‘glycerolipid metabolism’, ‘lipid and atherosclerosis’,
‘sphingolipid signaling pathway’, ‘insulin resistance’, ‘ether
lipid metabolism’ and ‘glycerophospholipid metabolism’ were
enriched (Fig. 8A). Transcriptomic
data revealed enrichment in ‘vascular smooth muscle contraction’,
‘Rap1 signaling pathway’, ‘human cytomegalovirus infection’, ‘cAMP
signaling pathway’, ‘MAPK signaling pathway’, ‘amoebiasis’ and
‘calcium signaling pathway’ (Fig.
8A). Downstream genes of HK2, which are involved in various
BPs, were significantly enriched in ‘calcium signaling pathway’,
‘thyroid hormone synthesis’, ‘vascular smooth muscle contraction’,
‘insulin secretion’, ‘MAPK signaling pathway’, ‘regulation of
lipolysis in adipocytes’, ‘aldosterone synthesis and secretion’,
‘Rap1 signaling pathway’, ‘cAMP signaling pathway’, ‘inflammatory
mediator regulation of TRP channels’ and ‘AGE-RAGE signaling
pathway in diabetic complications’. Additionally, metabolites
associated with ‘AGE-RAGE signaling pathway in diabetic
complications’ and ‘sphingolipid signaling pathway’ were also
significantly enriched (Fig. 8B and
C). Numerous metabolites correlated with specific genes
(Fig. 8D). Based on this analysis,
regulatory network maps for genes and metabolites associated with
‘AGE-RAGE signaling pathway in diabetic complications’ and
‘sphingolipid signaling pathway’ were constructed (Fig. 8E and F).
‘AGE-RAGE signaling pathway in
diabetic complications’
A total of 14 genes [I16, I11A, thrombomodulin
(THBD), angiotensinogen (AGT), COL1A1, COL3A1, endothelin-1 (EDN1),
phospholipase C (Plc)b1 (PLCB1), COL4A2, CCL2, TGFB2, SERPINE1,
PIK3CD and protein kinase Cβ (PRKCB)] and 32 lipid metabolites were
identified by combined analysis of transcriptomics and lipid
metabolomics within ‘AGE-RAGE signaling pathway in diabetic
complications’ and significantly enriched (Fig. 8E). Of these, I16 and I11A were
excluded due to the absence of specific primers (Table SI). Quantitative PCR analysis of
the mRNAs of the remaining 12 genes in HL-1 cardiomyocytes from the
WT and HK2-OE strains indicated that the difference between the
subgroups was not significant for COL3A1. PRKCB exhibited high
expression levels in HL-1 cardiomyocytes from the HK2-OE strain,
while the other genes were expressed at low levels (Fig. 9A-C). Additionally, protein-protein
interaction network maps were constructed for the remaining 12
genotypes (Fig. 9D).
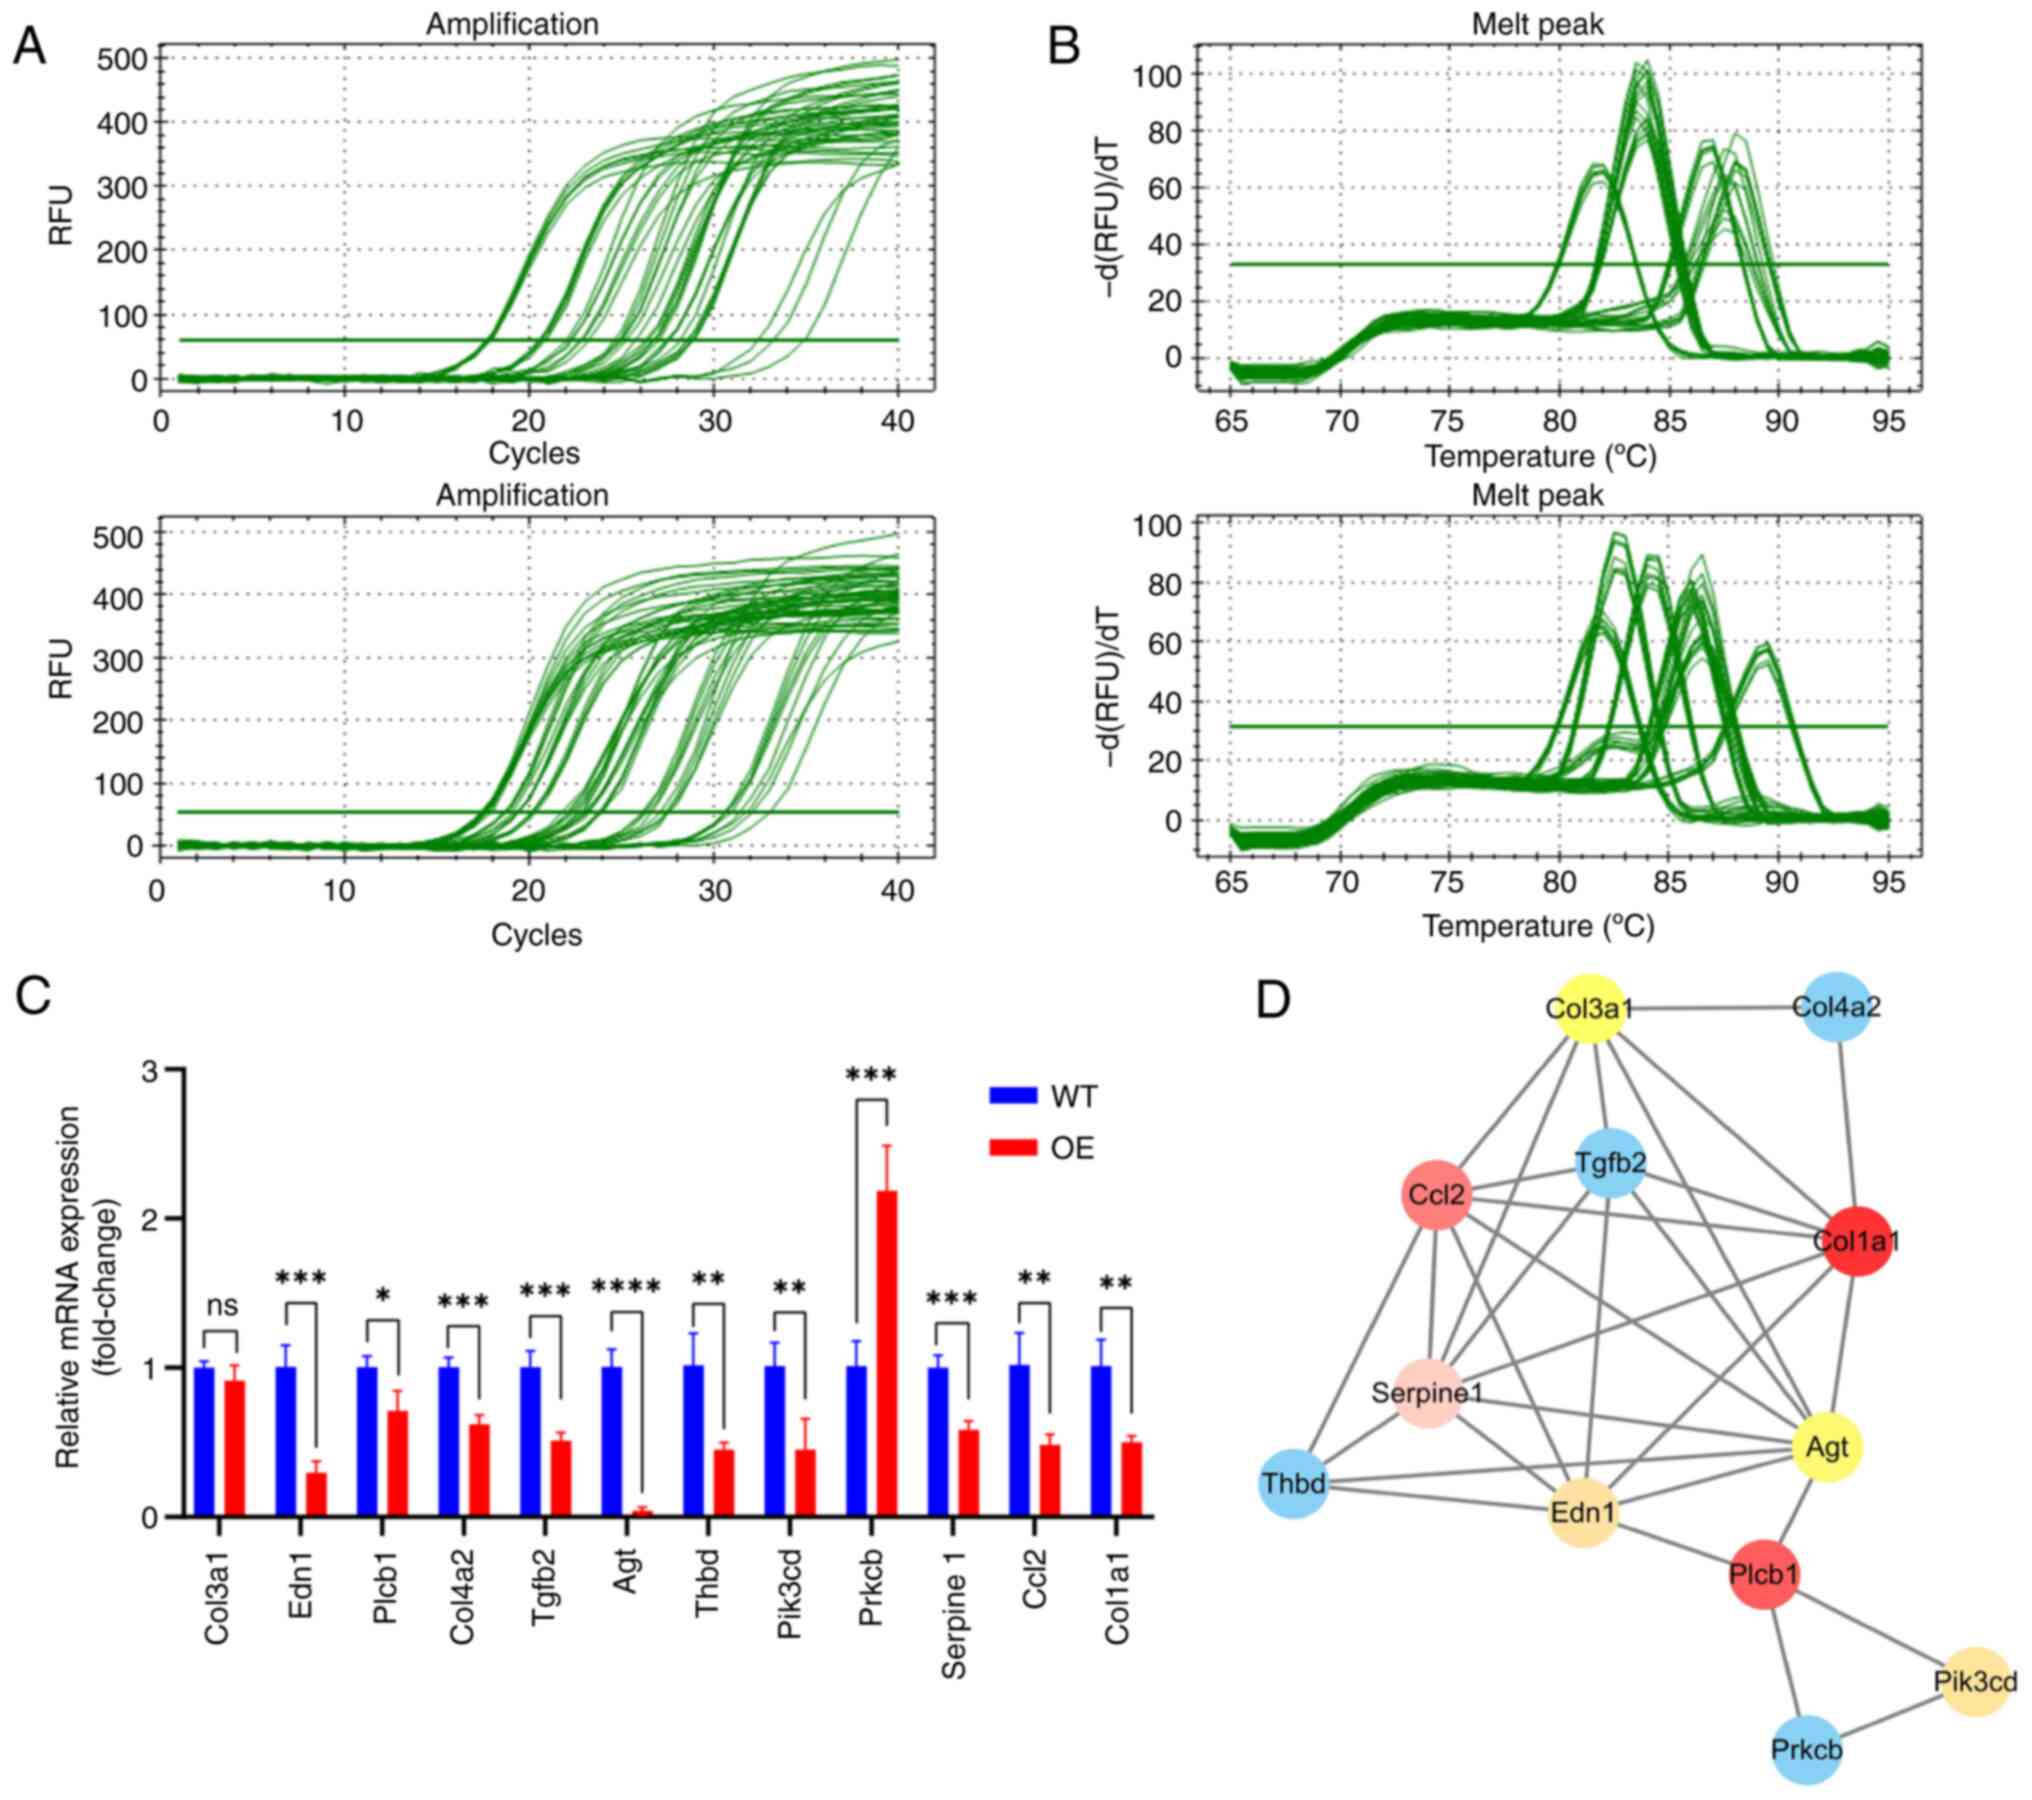 | Figure 9.mRNA qPCR data for 12 HK2 downstream
genes in ‘AGE-RAGE signaling pathway in diabetic complications’.
qPCR (A) amplification and (B) melt curve and (C) quantification.
(D) Protein-protein interaction network diagram of 12 HK2
downstream genes. *P<0.05, **P<0.01, ***P<0.001 and
****P<0.0001. q, quantitative; HK2, hexokinase 2. WT, wild-type;
OE, overexpression; COL3A1, collagen type III alpha 1 chain; EDN1,
endothelin-1; PLCB1, phospholipase C beta 1; TGFB2, transforming
growth factor β2; THBD, thrombomodulin; PIK3CD, phosphoinositide
3-kinase catalytic delta; PRKCB, protein kinase C beta; RAGE,
receptor for advanced glycation end-products; RFU, relative
fluorescence units; ns,; CCL2, C-C motif chemokine ligand 2. |
Discussion
DCM is a distinct form of cardiomyopathy associated
with diabetes, characterized by ventricular dysfunction in the
absence of traditional cardiovascular risk factors such as coronary
atherosclerosis, hypertension or valvular disease (1). DCM typically presents with early
diastolic dysfunction, which can progress to late systolic
dysfunction accompanied by fibrosis. This multifaceted disease
involves various underlying mechanisms, including mitochondrial
dysfunction, ER and oxidative stress, alterations in the
extracellular matrix, disruptions in the insulin signaling pathway,
inflammation, microvascular dysfunction and cardiometabolic
abnormality (7). Despite extensive
research (6,8), the underlying mechanisms of DCM
remain poorly understood, and, to the best of our knowledge, there
are currently no targeted treatments or preventive strategies
available.
In the present study, bioinformatics analysis
revealed that HK2, HMGSC2, MGST1 and PIK3C2G were characteristic
genes associated with DCM. Both in vitro and in vivo
experiments confirmed that HK2 was associated with DCM, exhibiting
significantly decreased expression levels in affected tissues.
Apoptosis and ROS levels were notably elevated in HL-1
cardiomyocytes treated with high-glucose. HK2-OE resulted in a
significant decrease in ROS production and apoptosis in HL-1
cardiomyocytes.
Oxidative stress serves a key role in the
progression of DCM. ROS interact with protein, lipids and DNA,
leading to detrimental remodeling of cardiac tissue (25). Mitochondrial ROS production is a
key factor in the pathogenic mechanisms triggered by elevated blood
sugar levels; excessive ROS can cause DNA damage as well as
oxidative modifications of proteins and lipid (26). The upregulation of heme oxygenase
induced by diabetes contributes to oxidative stress in the
myocardium (27). The activation
of acidic sphingomyelinase (ASMase) in cardiomyocytes due to a
high-fat diet may exacerbate oxidative stress and apoptosis by
upregulating the expression of NADPH oxidase 4, leading to DCM
(28).
The present analysis revealed that the HK2 gene
regulates the expression of 12 genes in ‘sphingolipid signaling
pathway’ (including sphingosine-1-phosphate receptors 1/S1PR3,
kinases SPHK1/PIK3CD/PRKCB, metabolic enzymes CERS4/SGPP1, and
kallikrein-kinin system components KNG1/KNG2/BDKRB2) and 49 lipid
metabolites, including glycerolipids, ceramides and sphingomyelins
(SMs). SM serves as a precursor to ceramide, a metabolite generated
by the cleavage of SM by neutral sphingomyelinase or ASMase
(29). SM is a key component of
cell membranes, while ceramide functions as a second messenger of
lipids, regulating phosphatase, kinases and transcription factors
(30), and is associated with cell
proliferation and apoptosis. Lower concentrations of SM and
ceramide promote cell proliferation and function, whereas elevated
levels lead to cell dysfunction and death (31). Diacylglycerol (DG) and SM are
produced by SM synthase 1 (SMS1) from phosphatidylcholine and
ceramide as substrates. SMS1 catalyzes the biosynthesis of DG,
which modulates SMS1 activity (32). Therefore, HK2 may influence the
function of cardiomyocytes in DCM through the metabolism of
ceramide and SM.
In the present study, db/db mice revealed a notable
accumulation of white adipose tissue on the epicardial surface. The
bladder of these mice exhibited excessive urinary storage,
suggesting that the 32-week-old db/db mice may have experienced
severe diabetic neurogenic cystitis and abnormal lipid accumulation
as comorbidities. By contrast with Li et al (33), db/db mice in the present study
displayed significant emaciation after 24 weeks of continuous
feeding from baseline (8 weeks). There was no notable difference in
heart size or weight or cardiac decompensation. This may be
associated with the severe protrusion of the enlarged bladder into
the gastrointestinal tract, which affects feeding and inflammatory
responses in the mice. Cardiac tissue staining indicated increased
myocardial fibrosis, myocardial hypertrophy, reduced myofibrillar
interstitial space and low expression of HK2, which was consistent
with the present bioinformatics analysis.
Previous studies have reported decreased HK2
expression in diabetic mice (34–36).
HK2-OE has been demonstrated to improve cardiomyocyte contractile
function and elevate ATP levels in hypoxic diabetic mice (37). During aging, methyltransferase-like
3 induces HK2 expression, leading to metabolic reprogramming that
promotes liquid-liquid phase separation (LLPS) (38). LLPS is a biophysical phenomenon
characterized by the condensation of biomolecules, such as protein
or nucleic acids, into membraneless, liquid-like droplets within
cells. This process is primarily driven by multivalent interactions
and the presence of intrinsically disordered regions within
proteins (39). These dynamic
condensates serve a key role in cellular function by spatially
organizing molecules and promoting specific biochemical reactions
(40). Notably, LLPS was more
prominent in HK2-OE compared with HK2-WT cells. This suggests
HK2-OE may facilitate the formation of biomolecular condensates,
potentially via enhanced interactions with protein or nucleic acids
that drive phase separation. Previous studies have demonstrated
that metabolic enzymes, including HK2, engage in LLPS, thereby
influencing cellular metabolism and stress responses (41,42).
The increased LLPS in HK2-OE cells may indicate a role for HK2 in
the assembly of metabolic compartments or stress granules, which
may be vital for maintaining cardiomyocyte function under both
physiological and pathological conditions (43). The detection of LLPS in
cardiomyocytes underscores its potential role in cardiac biology.
For example, LLPS is associated with the regulation of sarcomere
organization, calcium signaling and cellular stress responses in
the heart (44). Further
exploration of the molecular mechanisms governing LLPS in
cardiomyocytes, particularly in the context of HK2-OE, may yield
valuable insights into the pathogenesis of cardiac disorders,
including hypertrophy, heart failure and ischemia-reperfusion
injury. Purines serve a key role in cellular metabolism, serving as
an energy source and essential component in ATP synthesis. HK2 is a
key enzyme that regulates purine metabolism, and is involved in the
metabolic processes of AMP, ADP, ATP, inosine monophosphate,
adenosine and inosine (38). The
present energy analysis revealed that HK2 modulated the purine
metabolites adenine, dAMP, guanosine and IMP through 14 downstream
genes. In a normal resting state, 70% of total cardiac energy
production from ATP is derived from fatty acid oxidation. However,
in hearts affected by DCM, glucose use is notably altered, and the
energy source of the heart predominantly relies on fatty acids
(45).
T2D is a chronic inflammatory disease characterized
by inflammation and immune senescence (46). Metabolic stress-driven immune
senescence is a key factor contributing to cardiac dysfunction in
DCM (47). AGEs are formed when
protein, lipid and nucleic acids undergo non-enzymatic modification
through glycosylation (involving glucose, fructose and pentose) via
the Maillard reaction (48). The
interaction of AGEs with RAGE triggers oxidative stress,
inflammatory response and increased extracellular matrix
accumulation (49). Blocking RAGE
prevents cardiac dysfunction in db/db mice (50). The present study identified that
HK2 regulated 30 lipid submetabolites (including glycerolipids and
ceramides) through 14 downstream genes (I16, I11A, THBD, AGT,
COL1A1, COL3A1, EDN1, PLCB1, COL4A2, CCL2, TGFB2, SERPINE1, PIK3CD,
PRKCB). The accumulation of toxic lipid metabolites is associated
with mitochondrial function, bioenergetics and metabolic
regulation, leading to metabolic remodeling of the DCM heart
(51) and supporting alterations
in the cardiomyocyte microenvironment (52).
THBD is implicated in coagulation, innate immunity,
inflammation and cell proliferation, and is primarily located in
the vascular endothelium (53).
THBD-dependent activated protein C formation protects glomerular
cells and podocytes from glucose-induced injury (54). Through its lectin-like domain, THBD
mitigates ischemia-reperfusion injury in cardiomyocytes (55).
EDN1 may mediate cardiomyocyte hypertrophy in DCM
via the MAPK pathway, while EDN1 antagonists prevent
glucose-induced cardiomyocyte hypertrophy and AGT expression
(56). AGT, the precursor of all
angiotensin peptides, not only serves as a renin-angiotensin system
substrate but also promotes macrophage infiltration, enhances
adipocyte metabolic activity (57)
and accelerates cancer progression (58). Hepatocytes are the primary source
of AGT, with adipose tissue contributing ~25% of plasma AGT levels.
Elevated AGT expression is associated with cardiovascular disease
and obesity (59). The
upregulation of COL1A1 and COL3A1 promotes myocardial fibrosis in
DCM, facilitated by an increase in circular RNA
homeodomain-Interacting Protein Kinase 3 (circHIPK3) in DCM mice
(60). COL4A2 encodes type IV
collagen fibers, which are key for the integrity and function of
the basement membrane (61) and
are poorly expressed in DCM (62).
The PLC enzyme hydrolyzes phosphatidylinositol
diphosphate into DG and inositol triphosphate, which are key lipid
mediators involved in cardiomyocyte regulatory signaling as second
messengers (63). Elevated PLCB1
expression is associated with atrial dilation in both humans and
mice (64). High-glucose induces
an increase in CCL2 and IL-6 expression, with glycemic control
decreasing IL-6 but not CCL2 levels (65). This may explain why partial
glycemic control is ineffective in alleviating DCM progression.
High-glucose-induced expression of TGFB and receptor activation
promotes myocardial fibrosis in DCM (66).
SERPINE1 is a key gene in DCM and may be associated
with impaired mitochondrial function, although the exact mechanism
remains unclear (67). Hepatic
PIK3CD levels are significantly decreased in mouse models of
diabetes, and PIK3CD is associated with insulin resistance
(68). High-glucose triggers the
activation of PRKCB and increases DG levels. Overexpression of
PRKCB induces cardiac hypertrophy and heart failure in mice.
HG-induced oxidative stress may promote diabetic complications via
the DG/PRKCB pathway (69).
Consequently, downstream HK2-regulated genes involved in the
AGE/RAGE pathway are associated with DCM.
Although the present study provided insight into the
role of HK2 in DCM and its potential as a therapeutic target, there
are limitations. First, the findings are primarily derived from
preclinical models, including HL-1 cardiomyocytes and db/db mice,
which may not fully replicate the complexity of the human DCM
pathophysiology. Second, the present study lacked transcriptomic
and metabolomic analyses of myocardial tissue, as well as
investigation of the functional effects of altered metabolite
levels on DCM progression. Third, the lack of validation using
clinical samples limits the direct translation of the present
results to human patients. Future studies should incorporate
patient-derived samples or clinical data to validate the
therapeutic potential of HK2 and explore the mechanisms of HK2 by
manipulating key genes or metabolites within the metabolic pathway
to facilitate clinical application.
In conclusion, HK2 is a key enzyme in glycolysis and
associated with the pathogenesis of DCM. HK2-OE in DCM
cardiomyocytes markedly protects against apoptosis and decreased
ROS levels. Additionally, HK2 modulates glucose and lipid
metabolism in cardiomyocytes through numerous metabolic pathways.
Metabolic intermediates and end products may inversely regulate
gene and protein expression. The present study suggested that the
AGE/RAGE signaling pathway is a notable mechanism by which HK2
regulates lipid metabolism and is associated with diabetic
complications.
Supplementary Material
Supporting Data
Supporting Data
Acknowledgements
Not applicable.
Funding
The present study was supported by National Natural Science
Foundation of China (grant no. 82270530) and Research Fund of the
Science and Technology Program of Fujian Province (grant no.
2023J011776).
Availability of data and materials
The data generated in the present study may be found
in the National Center for Biotechnology Information BioProject and
European Molecular Biology Laboratory's European Bioinformatics
Institute MetaboLights under accession number PRJNA1234119 and
MTBLS12315 and MTBLS12314, respectively, or at the following URL:
(https://www.ncbi.nlm.nih.gov/sra/?term=PRJNA1234119;
https://www.ebi.ac.uk/metabolights/MTBLS12315;
http://www.ebi.ac.uk/metabolights/MTBLS12314).
Authors' contributions
YD and YZ conceived the study. BL and XZ designed
experiments, analyzed data and constructed figures. BL, XZ, LM, XW,
YD and YZ performed experiments. YD supervised the study. BL, XZ,
LM and XW wrote the manuscript. BL, XZ, YD and YZ edited the
manuscript. YD and YZ confirm the authenticity of all the raw data.
All authors have read and approved the final manuscript.
Ethics approval and consent to
participate
The animal experiments were approved by the Center's
Experimental Animal Ethics Committee of Hubei University of
Medicine (approval no 2024S071; Shiyan, China) and were conducted
in accordance with the Declaration of Helsinki.
Patient consent for publication
Not applicable.
Competing interests
The authors declare that they have no competing
interests.
References
|
1
|
Ogurtsova K, da Rocha Fernandes JD, Huang
Y, Linnenkamp U, Guariguata L, Cho NH, Cavan D, Shaw JE and
Makaroff LE: IDF diabetes atlas: Global estimates for the
prevalence of diabetes for 2015 and 2040. Diabetes Res Clin Pract.
128:40–50. 2017. View Article : Google Scholar : PubMed/NCBI
|
|
2
|
Peng C and Zhang Y, Lang X and Zhang Y:
Role of mitochondrial metabolic disorder and immune infiltration in
diabetic cardiomyopathy: New insights from bioinformatics analysis.
J Transl Med. 21:662023. View Article : Google Scholar : PubMed/NCBI
|
|
3
|
Fuentes-Antrás J, Picatoste B, Ramírez E,
Egido J, Tuñón J and Lorenzo Ó: Targeting metabolic disturbance in
the diabetic heart. Cardiovasc Diabetol. 14:172015. View Article : Google Scholar : PubMed/NCBI
|
|
4
|
Yuan Q, Sun Y, Yang F, Yan D, Shen M, Jin
Z, Zhan L, Liu G, Yang L, Zhou Q, et al: CircRNA DICAR as a novel
endogenous regulator for diabetic cardiomyopathy and diabetic
pyroptosis of cardiomyocytes. Signal Transduct Target Ther.
8:992023. View Article : Google Scholar : PubMed/NCBI
|
|
5
|
Tan Y, Zhang Z, Zheng C, Wintergerst KA,
Keller BB and Cai L: Mechanisms of diabetic cardiomyopathy and
potential therapeutic strategies: Preclinical and clinical
evidence. Nat Rev Cardiol. 17:585–607. 2020. View Article : Google Scholar : PubMed/NCBI
|
|
6
|
Murtaza G, Virk HUH, Khalid M, Lavie CJ,
Ventura H, Mukherjee D, Ramu V, Bhogal S, Kumar G, Shanmugasundaram
M and Paul TK: Diabetic cardiomyopathy-A comprehensive updated
review. Prog Cardiovasc Dis. 62:315–326. 2019. View Article : Google Scholar : PubMed/NCBI
|
|
7
|
Jia G, Hill MA and Sowers JR: Diabetic
cardiomyopathy: An update of mechanisms contributing to this
clinical entity. Circ Res. 122:624–638. 2018. View Article : Google Scholar : PubMed/NCBI
|
|
8
|
Dillmann WH: Diabetic cardiomyopathy. Circ
Res. 124:1160–1162. 2019. View Article : Google Scholar : PubMed/NCBI
|
|
9
|
Jia G, Whaley-Connell A and Sowers JR:
Diabetic cardiomyopathy: A hyperglycaemia- and
insulin-resistance-induced heart disease. Diabetologia. 61:21–28.
2018. View Article : Google Scholar : PubMed/NCBI
|
|
10
|
Adeghate E and Singh J: Structural changes
in the myocardium during diabetes-induced cardiomyopathy. Heart
Fail Rev. 19:15–23. 2014. View Article : Google Scholar : PubMed/NCBI
|
|
11
|
Song K, Liang D, Xiao D, Kang A and Ren Y:
Role of bariatric surgery in improving diabetic cardiomyopathy:
Molecular mechanisms and therapeutic perspectives (Review). Mol Med
Rep. 30:1992024. View Article : Google Scholar : PubMed/NCBI
|
|
12
|
Jia G, DeMarco VG and Sowers JR: Insulin
resistance and hyperinsulinaemia in diabetic cardiomyopathy. Nat
Rev Endocrinol. 12:144–153. 2016. View Article : Google Scholar : PubMed/NCBI
|
|
13
|
Leary S, Anthony R, Gwaltney-Brant S,
Cartner S, Dewell R, Webb P, Plummer P, Hoenig DE, Moyer W, Smith
SA, et al: AVMA guidelines for the depopulation of animals.
2019.
|
|
14
|
Leek JT, Johnson WE, Parker HS, Jaffe AE
and Storey JD: The sva package for removing batch effects and other
unwanted variation in high-throughput experiments. Bioinformatics.
28:882–883. 2012. View Article : Google Scholar : PubMed/NCBI
|
|
15
|
Ashburner M, Ball CA, Blake JA, Botstein
D, Butler H, Cherry JM, Davis AP, Dolinski K, Dwight SS, Eppig JT,
et al: Gene ontology: Tool for the unification of biology. The gene
ontology consortium. Nat Genet. 25:25–29. 2000. View Article : Google Scholar : PubMed/NCBI
|
|
16
|
Kanehisa M and Goto S: KEGG: Kyoto
encyclopedia of genes and genomes. Nucleic Acids Res. 28:27–30.
2000. View Article : Google Scholar : PubMed/NCBI
|
|
17
|
Langfelder P and Horvath S: WGCNA: An R
package for weighted correlation network analysis. BMC
Bioinformatics. 9:5592008. View Article : Google Scholar : PubMed/NCBI
|
|
18
|
Gao P, Cao M, Jiang X, Wang X, Zhang G,
Tang X, Yang C, Komuro I, Ge J, Li L and Zou Y: Cannabinoid
receptor 2-centric molecular feedback loop drives necroptosis in
diabetic heart injuries. Circulation. 147:158–174. 2023. View Article : Google Scholar : PubMed/NCBI
|
|
19
|
Sun HJ, Xiong SP, Wu ZY, Cao L, Zhu MY,
Moore PK and Bian JS: Induction of caveolin-3/eNOS complex by
nitroxyl (HNO) ameliorates diabetic cardiomyopathy. Redox Biol.
32:1014932020. View Article : Google Scholar : PubMed/NCBI
|
|
20
|
Hu L, Wei J, Zhang Y, Wang Z, Tang J, Tang
J, Gao Y, Zhang X, Li Y, Liu Y, et al: ANGPTL8 is a negative
regulator in pathological cardiac hypertrophy. Cell Death Dis.
13:6212022. View Article : Google Scholar : PubMed/NCBI
|
|
21
|
Wu Y, Wang J, Zhao T, Sun M, Xu M, Che S,
Pan Z, Wu C and Shen L: Polystyrenenanoplastics lead to ferroptosis
in the lungs. J Adv Res. 56:31–41. 2024. View Article : Google Scholar : PubMed/NCBI
|
|
22
|
An Z, Hu T, Lv Y, Li P and Liu L: Targeted
amino acid and related amines analysis based on iTRAQ®-LC-MS/MS for
discovering potential hepatotoxicity biomarkers. J Pharm Biomed
Anal. 178:1128122020. View Article : Google Scholar : PubMed/NCBI
|
|
23
|
Livak KJ and Schmittgen TD: Analysis of
relative gene expression data using real-time quantitative PCR and
the 2(−Delta Delta C(T)) method. Methods. 25:402–408. 2001.
View Article : Google Scholar : PubMed/NCBI
|
|
24
|
Chen W, Gong L, Guo Z, Wang W, Zhang H,
Liu X, Yu S, Xiong L and Luo J: A novel integrated method for
large-scale detection, identification, and quantification of widely
targeted metabolites: Application in the study of rice
metabolomics. Mol Plant. 6:1769–1780. 2013. View Article : Google Scholar : PubMed/NCBI
|
|
25
|
Kaludercic N and Di Lisa F: Mitochondrial
ROS formation in the pathogenesis of diabetic cardiomyopathy. Front
Cardiovasc Med. 7:122020. View Article : Google Scholar : PubMed/NCBI
|
|
26
|
Sitte N, Huber M, Grune T, Ladhoff A,
Doecke WD, Von Zglinicki T and Davies KJ: Proteasome inhibition by
lipofuscin/ceroid during postmitotic aging of fibroblasts. FASEB J.
14:1490–1498. 2000. View Article : Google Scholar : PubMed/NCBI
|
|
27
|
Farhangkhoee H, Khan ZA, Mukherjee S,
Cukiernik M, Barbin YP, Karmazyn M and Chakrabarti S: Heme
oxygenase in diabetes-induced oxidative stress in the heart. J Mol
Cell Cardiol. 35:1439–1448. 2003. View Article : Google Scholar : PubMed/NCBI
|
|
28
|
Liu R, Duan T, Yu L, Tang Y, Liu S, Wang C
and Fang WJ: Acid sphingomyelinase promotes diabetic cardiomyopathy
via NADPH oxidase 4 mediated apoptosis. Cardiovasc Diabetol.
22:252023. View Article : Google Scholar : PubMed/NCBI
|
|
29
|
Xiang H, Jin S, Tan F, Xu Y, Lu Y and Wu
T: Physiological functions and therapeutic applications of neutral
sphingomyelinase and acid sphingomyelinase. Biomed Pharmacother.
139:1116102021. View Article : Google Scholar : PubMed/NCBI
|
|
30
|
Imgrund S, Hartmann D, Farwanah H,
Eckhardt M, Sandhoff R, Degen J, Gieselmann V, Sandhoff K and
Willecke K: Adult ceramide synthase 2 (CERS2)-deficient mice
exhibit myelin sheath defects, cerebellar degeneration, and
hepatocarcinomas. J Biol Chem. 284:33549–33560. 2009. View Article : Google Scholar : PubMed/NCBI
|
|
31
|
Cutler RG and Mattson MP: Sphingomyelin
and ceramide as regulators of development and lifespan. Mech Ageing
Dev. 122:895–908. 2001. View Article : Google Scholar : PubMed/NCBI
|
|
32
|
Suzuki R, Murakami C, Dilimulati K,
Atsuta-Tsunoda K, Kawai T and Sakane F: Human sphingomyelin
synthase 1 generates diacylglycerol in the presence and absence of
ceramide via multiple enzymatic activities. FEBS Lett.
597:2672–2686. 2023. View Article : Google Scholar : PubMed/NCBI
|
|
33
|
Li X, Wu Y, Zhao J, Wang H, Tan J, Yang M,
Li Y, Deng S, Gao S, Li H, et al: Distinct cardiac energy
metabolism and oxidative stress adaptations between obese and
non-obese type 2 diabetes mellitus. Theranostics. 10:2675–2695.
2020. View Article : Google Scholar : PubMed/NCBI
|
|
34
|
Da Silva D, Ausina P, Alencar EM, Coelho
WS, Zancan P and Sola-Penna M: Metformin reverses hexokinase and
phosphofructokinase downregulation and intracellular distribution
in the heart of diabetic mice. IUBMB Life. 64:766–774. 2012.
View Article : Google Scholar : PubMed/NCBI
|
|
35
|
Palsgaard J, Brøns C, Friedrichsen M,
Dominguez H, Jensen M, Storgaard H, Spohr C, Torp-Pedersen C, Borup
R, De Meyts P and Vaag A: Gene expression in skeletal muscle
biopsies from people with type 2 diabetes and relatives:
Differential regulation of insulin signaling pathways. PLoS One.
4:e65752009. View Article : Google Scholar : PubMed/NCBI
|
|
36
|
Osawa H, Sutherland C, Robey RB, Printz RL
and Granner DK: Analysis of the signaling pathway involved in the
regulation of hexokinase II gene transcription by insulin. J Biol
Chem. 271:16690–16694. 1996. View Article : Google Scholar : PubMed/NCBI
|
|
37
|
Ye G, Donthi RV, Metreveli NS and Epstein
PN: Overexpression of hexokinase protects hypoxic and diabetic
cardiomyocytes by increasing ATP generation. Cardiovasc Toxicol.
5:293–300. 2005. View Article : Google Scholar : PubMed/NCBI
|
|
38
|
Wang C, Tanizawa H, Hill C, Havas A, Zhang
Q, Liao L, Hao X, Lei X, Wang L, Nie H, et al: METTL3-mediated
chromatin contacts promote stress granule phase separation through
metabolic reprogramming during senescence. Nat Commun. 15:54102024.
View Article : Google Scholar : PubMed/NCBI
|
|
39
|
Banani SF, Lee HO, Hyman AA and Rosen MK:
Biomolecular condensates: Organizers of cellular biochemistry. Nat
Rev Mol Cell Biol. 18:285–298. 2017. View Article : Google Scholar : PubMed/NCBI
|
|
40
|
Alberti S and Hyman AA: Biomolecular
condensates at the nexus of cellular stress, protein aggregation
disease and ageing. Nat Rev Mol Cell Biol. 22:196–213. 2021.
View Article : Google Scholar : PubMed/NCBI
|
|
41
|
Zhang H, Ji X, Li P, Liu C, Lou J, Wang Z,
Wen W, Xiao Y, Zhang M and Zhu X: Liquid-liquid phase separation in
biology: Mechanisms, physiological functions and human diseases.
Sci China Life Sci. 63:953–985. 2020. View Article : Google Scholar : PubMed/NCBI
|
|
42
|
Nott TJ, Craggs TD and Baldwin AJ:
Membraneless organelles can melt nucleic acid duplexes and act as
biomolecular filters. Nat Chem. 8:569–575. 2016. View Article : Google Scholar : PubMed/NCBI
|
|
43
|
Riback JA, Katanski CD, Kear-Scott JL,
Pilipenko EV, Rojek AE, Sosnick TR and Drummond DA:
Stress-Triggered phase separation is an adaptive, evolutionarily
tuned response. Cell. 168:1028–1040.e19. 2017. View Article : Google Scholar : PubMed/NCBI
|
|
44
|
Mo Y, Feng Y, Huang W, Tan N, Li X, Jie M,
Feng T, Jiang H and Jiang L: Liquid-liquid phase separation in
cardiovascular diseases. Cells. 11:30402022. View Article : Google Scholar : PubMed/NCBI
|
|
45
|
Bayeva M, Sawicki KT and Ardehali H:
Taking diabetes to heart-deregulation of myocardial lipid
metabolism in diabetic cardiomyopathy. J Am Heart Assoc.
2:e0004332013. View Article : Google Scholar : PubMed/NCBI
|
|
46
|
Barbé-Tuana F, Funchal G, Schmitz CRR,
Maurmann RM and Bauer ME: The interplay between immunosenescence
and age-related diseases. Semin Immunopathol. 42:545–557. 2020.
View Article : Google Scholar : PubMed/NCBI
|
|
47
|
Henson SM and Aksentijevic D: Senescence
and type 2 diabetic cardiomyopathy: How young can you die of old
age? Front Pharmacol. 12:7165172021. View Article : Google Scholar : PubMed/NCBI
|
|
48
|
Shen CY, Lu CH, Wu CH, Li KJ, Kuo YM,
Hsieh SC and Yu CL: The development of maillard reaction, and
advanced glycation end product (AGE)-receptor for AGE (RAGE)
signaling inhibitors as novel therapeutic strategies for patients
with AGE-related diseases. Molecules. 25:55912020. View Article : Google Scholar : PubMed/NCBI
|
|
49
|
Bodiga VL, Eda SR and Bodiga S: Advanced
glycation end products: Role in pathology of diabetic
cardiomyopathy. Heart Fail Rev. 19:49–63. 2014. View Article : Google Scholar : PubMed/NCBI
|
|
50
|
Nielsen JM, Kristiansen SB, Nørregaard R,
Andersen CL, Denner L, Nielsen TT, Flyvbjerg A and Bøtker HE:
Blockage of receptor for advanced glycation end products prevents
development of cardiac dysfunction in db/db type 2 diabetic mice.
Eur J Heart Fail. 11:638–647. 2009. View Article : Google Scholar : PubMed/NCBI
|
|
51
|
Chong CR, Clarke K and Levelt E: Metabolic
remodeling in diabetic cardiomyopathy. Cardiovasc Res. 113:422–430.
2017. View Article : Google Scholar : PubMed/NCBI
|
|
52
|
Heather LC, Gopal K, Srnic N and Ussher
JR: Redefining diabetic cardiomyopathy: Perturbations in substrate
metabolism at the heart of its pathology. Diabetes. 73:659–670.
2024. View Article : Google Scholar : PubMed/NCBI
|
|
53
|
Loghmani H and Conway EM: Exploring
traditional and nontraditional roles for thrombomodulin. Blood.
132:148–158. 2018. View Article : Google Scholar : PubMed/NCBI
|
|
54
|
Isermann B, Vinnikov IA, Madhusudhan T,
Herzog S, Kashif M, Blautzik J, Corat MA, Zeier M, Blessing E, Oh
J, et al: Activated protein C protects against diabetic nephropathy
by inhibiting endothelial and podocyte apoptosis. Nat Med.
13:1349–1358. 2007. View
Article : Google Scholar : PubMed/NCBI
|
|
55
|
Herzog C, Lorenz A, Gillmann HJ, Chowdhury
A, Larmann J, Harendza T, Echtermeyer F, Müller M, Schmitz M,
Stypmann J, et al: Thrombomodulin's lectin-like domain reduces
myocardial damage by interfering with HMGB1-mediated TLR2
signalling. Cardiovasc Res. 101:400–410. 2014. View Article : Google Scholar : PubMed/NCBI
|
|
56
|
Chen S, Khan ZA, Karmazyn M and
Chakrabarti S: Role of endothelin-1, sodium hydrogen exchanger-1
and mitogen activated protein kinase (MAPK) activation in
glucose-induced cardiomyocyte hypertrophy. Diabetes Metab Res Rev.
23:356–367. 2007. View Article : Google Scholar : PubMed/NCBI
|
|
57
|
Wu M, Zhou Y, Pei D and Gao S: Unveiling
the role of AGT in lipid metabolism and regulated cell death in
colon cancer. Neoplasia. 54:1010092024. View Article : Google Scholar : PubMed/NCBI
|
|
58
|
Wu F, Zhang L, Wang L and Zhang D: AGT may
serve as a prognostic biomarker and correlated with immune
infiltration in gastric cancer. Int J Gen Med. 15:1865–1878. 2022.
View Article : Google Scholar : PubMed/NCBI
|
|
59
|
Cassis LA, Police SB, Yiannikouris F and
Thatcher SE: Local adipose tissue renin-angiotensin system. Curr
Hypertens Rep. 10:93–98. 2008. View Article : Google Scholar : PubMed/NCBI
|
|
60
|
Wang W, Zhang S, Xu L, Feng Y, Wu X, Zhang
M, Yu Z and Zhou X: Involvement of circHIPK3 in the pathogenesis of
diabetic cardiomyopathy in mice. Diabetologia. 64:681–692. 2021.
View Article : Google Scholar : PubMed/NCBI
|
|
61
|
Yurchenco PD: Basement membranes: Cell
scaffoldings and signaling platforms. Cold Spring Harb Perspect
Biol. 3:a0049112011. View Article : Google Scholar : PubMed/NCBI
|
|
62
|
Lu Y, Huo H, Liang F, Xue J, Fang L, Miao
Y, Shen L and He B: Role of pericytes in cardiomyopathy-associated
myocardial infarction revealed by multiple single-cell sequencing
analysis. Biomedicines. 11:28962023. View Article : Google Scholar : PubMed/NCBI
|
|
63
|
Fazio A, Evangelisti C, Cappellini A,
Mongiorgi S, Koufi FD, Neri I, Marvi MV, Russo M, Ghigo A, Manzoli
L, et al: Emerging roles of phospholipase C beta isozymes as
potential biomarkers in cardiac disorders. Int J Mol Sci.
24:130962023. View Article : Google Scholar : PubMed/NCBI
|
|
64
|
Woodcock EA, Grubb DR, Filtz TM, Marasco
S, Luo J, McLeod-Dryden TJ, Kaye DM, Sadoshima J, Du XJ, Wong C, et
al: Selective activation of the ‘b’ splice variant of phospholipase
Cbeta1 in chronically dilated human and mouse atria. J Mol Cell
Cardiol. 47:676–683. 2009. View Article : Google Scholar : PubMed/NCBI
|
|
65
|
Bernal-Lopez MR, Llorente-Cortes V,
Calleja F, Lopez-Carmona D, Mayas MD, Gomez-Huelgas R, Badimon L
and Tinahones FJ: Effect of different degrees of impaired glucose
metabolism on the expression of inflammatory markers in monocytes
of patients with atherosclerosis. Acta Diabetol. 50:553–562. 2013.
View Article : Google Scholar : PubMed/NCBI
|
|
66
|
Yue Y, Meng K, Pu Y and Zhang X:
Transforming growth factor beta (TGF-β) mediates cardiac fibrosis
and induces diabetic cardiomyopathy. Diabetes Res Clin Pract.
133:124–130. 2017. View Article : Google Scholar : PubMed/NCBI
|
|
67
|
Tuersuntuoheti M, Zhou L, Li J, Yang S,
Zhou S and Gong H: Investigation of crucial genes and mitochondrial
function impairment in diabetic cardiomyopathy. Gene.
923:1485632024. View Article : Google Scholar : PubMed/NCBI
|
|
68
|
Du X, Li X, Chen L, Zhang M, Lei L, Gao W,
Shi Z, Dong Y, Wang Z, Li X and Liu G: Hepatic miR-125b inhibits
insulin signaling pathway by targeting PIK3CD. J Cell Physiol.
233:6052–6066. 2018. View Article : Google Scholar : PubMed/NCBI
|
|
69
|
Koya D and King GL: Protein kinase C
activation and the development of diabetic complications. Diabetes.
47:859–866. 1998. View Article : Google Scholar : PubMed/NCBI
|