Introduction
In patients with glioblastoma (GB), overall survival
(OS) remains poor despite advances in diagnostic precision
(1) and targeted therapies
(2,3). Standard therapy for patients in good
clinical condition consists of tumor biopsy/resection followed by
radiotherapy with temozolomide chemotherapy yielding a median
overall survival slightly below 15 months after diagnosis (4). The predominant immune cell population
in GB comprises glioma-associated microglia and macrophages (GAM),
which can originate from brain-resident microglia (GAM-MG) or
monocyte-derived macrophages (GAM-MDM) from the periphery (5–7). The
immune polarization of GAM is complex (8–13)
and the specific role of different microglial subtypes in GB
pathogenesis still only poorly understood with conflicting
prognostic data on the role of the innate immune system (12,14–17).
Moreover, the effects of GB therapy with standard alkylating or
novel targeted treatment approaches on GAM have not been
investigated in detail, while in preclinical brain metastases
models profound effects of tumor-associated innate immune cells on
therapy efficacy have been reported (18,19).
Activation of the mammalian target of rapamycin
(mTOR) pathway is frequently found in GB (20). Enhanced signaling occurs through
amplified and/or mutated receptor tyrosine kinases including the
epidermal growth factor receptor (EGFR), deletion of the tumor
suppressor PTEN and other alterations in the upstream signaling
cascade. The mTOR pathway engages a central role in the regulation
of proliferation, metabolism and other biological processes
important for cell growth proliferation and the adaptation to the
tumor microenvironment (21,22)
(Fig. 1A). mTOR exists as part of
2 different multiprotein complexes termed mTOR complex 1 and 2
(mTORC1 and 2) that integrate upstream signals from diverse stimuli
including growth factor receptors but also nutrient and oxygen
availability (23). Important
downstream effects of mTORC1 are mediated through targets that
regulate mRNA translation. For instance, the activation of the
mTORC1 pathway triggers phosphorylation of the eukaryotic
translation initiation factor 4E-binding protein 1 (4E-BP1) at the
phosphorylation sites Thr37/Thr46, as well as phosphorylation of
the S6 ribosomal protein (S6RP) at Ser240/244 via S6-kinase (S6K).
mTORC2 signaling is less well understood and plays important roles
in the reorganization of the cytoskeleton as well as regulation of
proliferation (23). mTORC2
targets include the glucocorticoid-regulated kinase 1 (SGK1), which
in turn activates N-myc downstream-regulated gene 1 (NDRG1) through
phosphorylation of Thr346 (24).
4E-BP1 phosphorylation is to some degree resistant to
first-generation mTORC1 inhibitors such as rapamycin and its
derivatives, while second-generation mTOR inhibitors including
torin2 effectively induce dephosphorylation of 4E-BP1 (Fig. 1A) (25). Taken together, EGFR and its
downstream target mTOR are plausible targets for therapeutic
intervention that have been extensively studied in various cancers,
including GB (3,21,22,26).
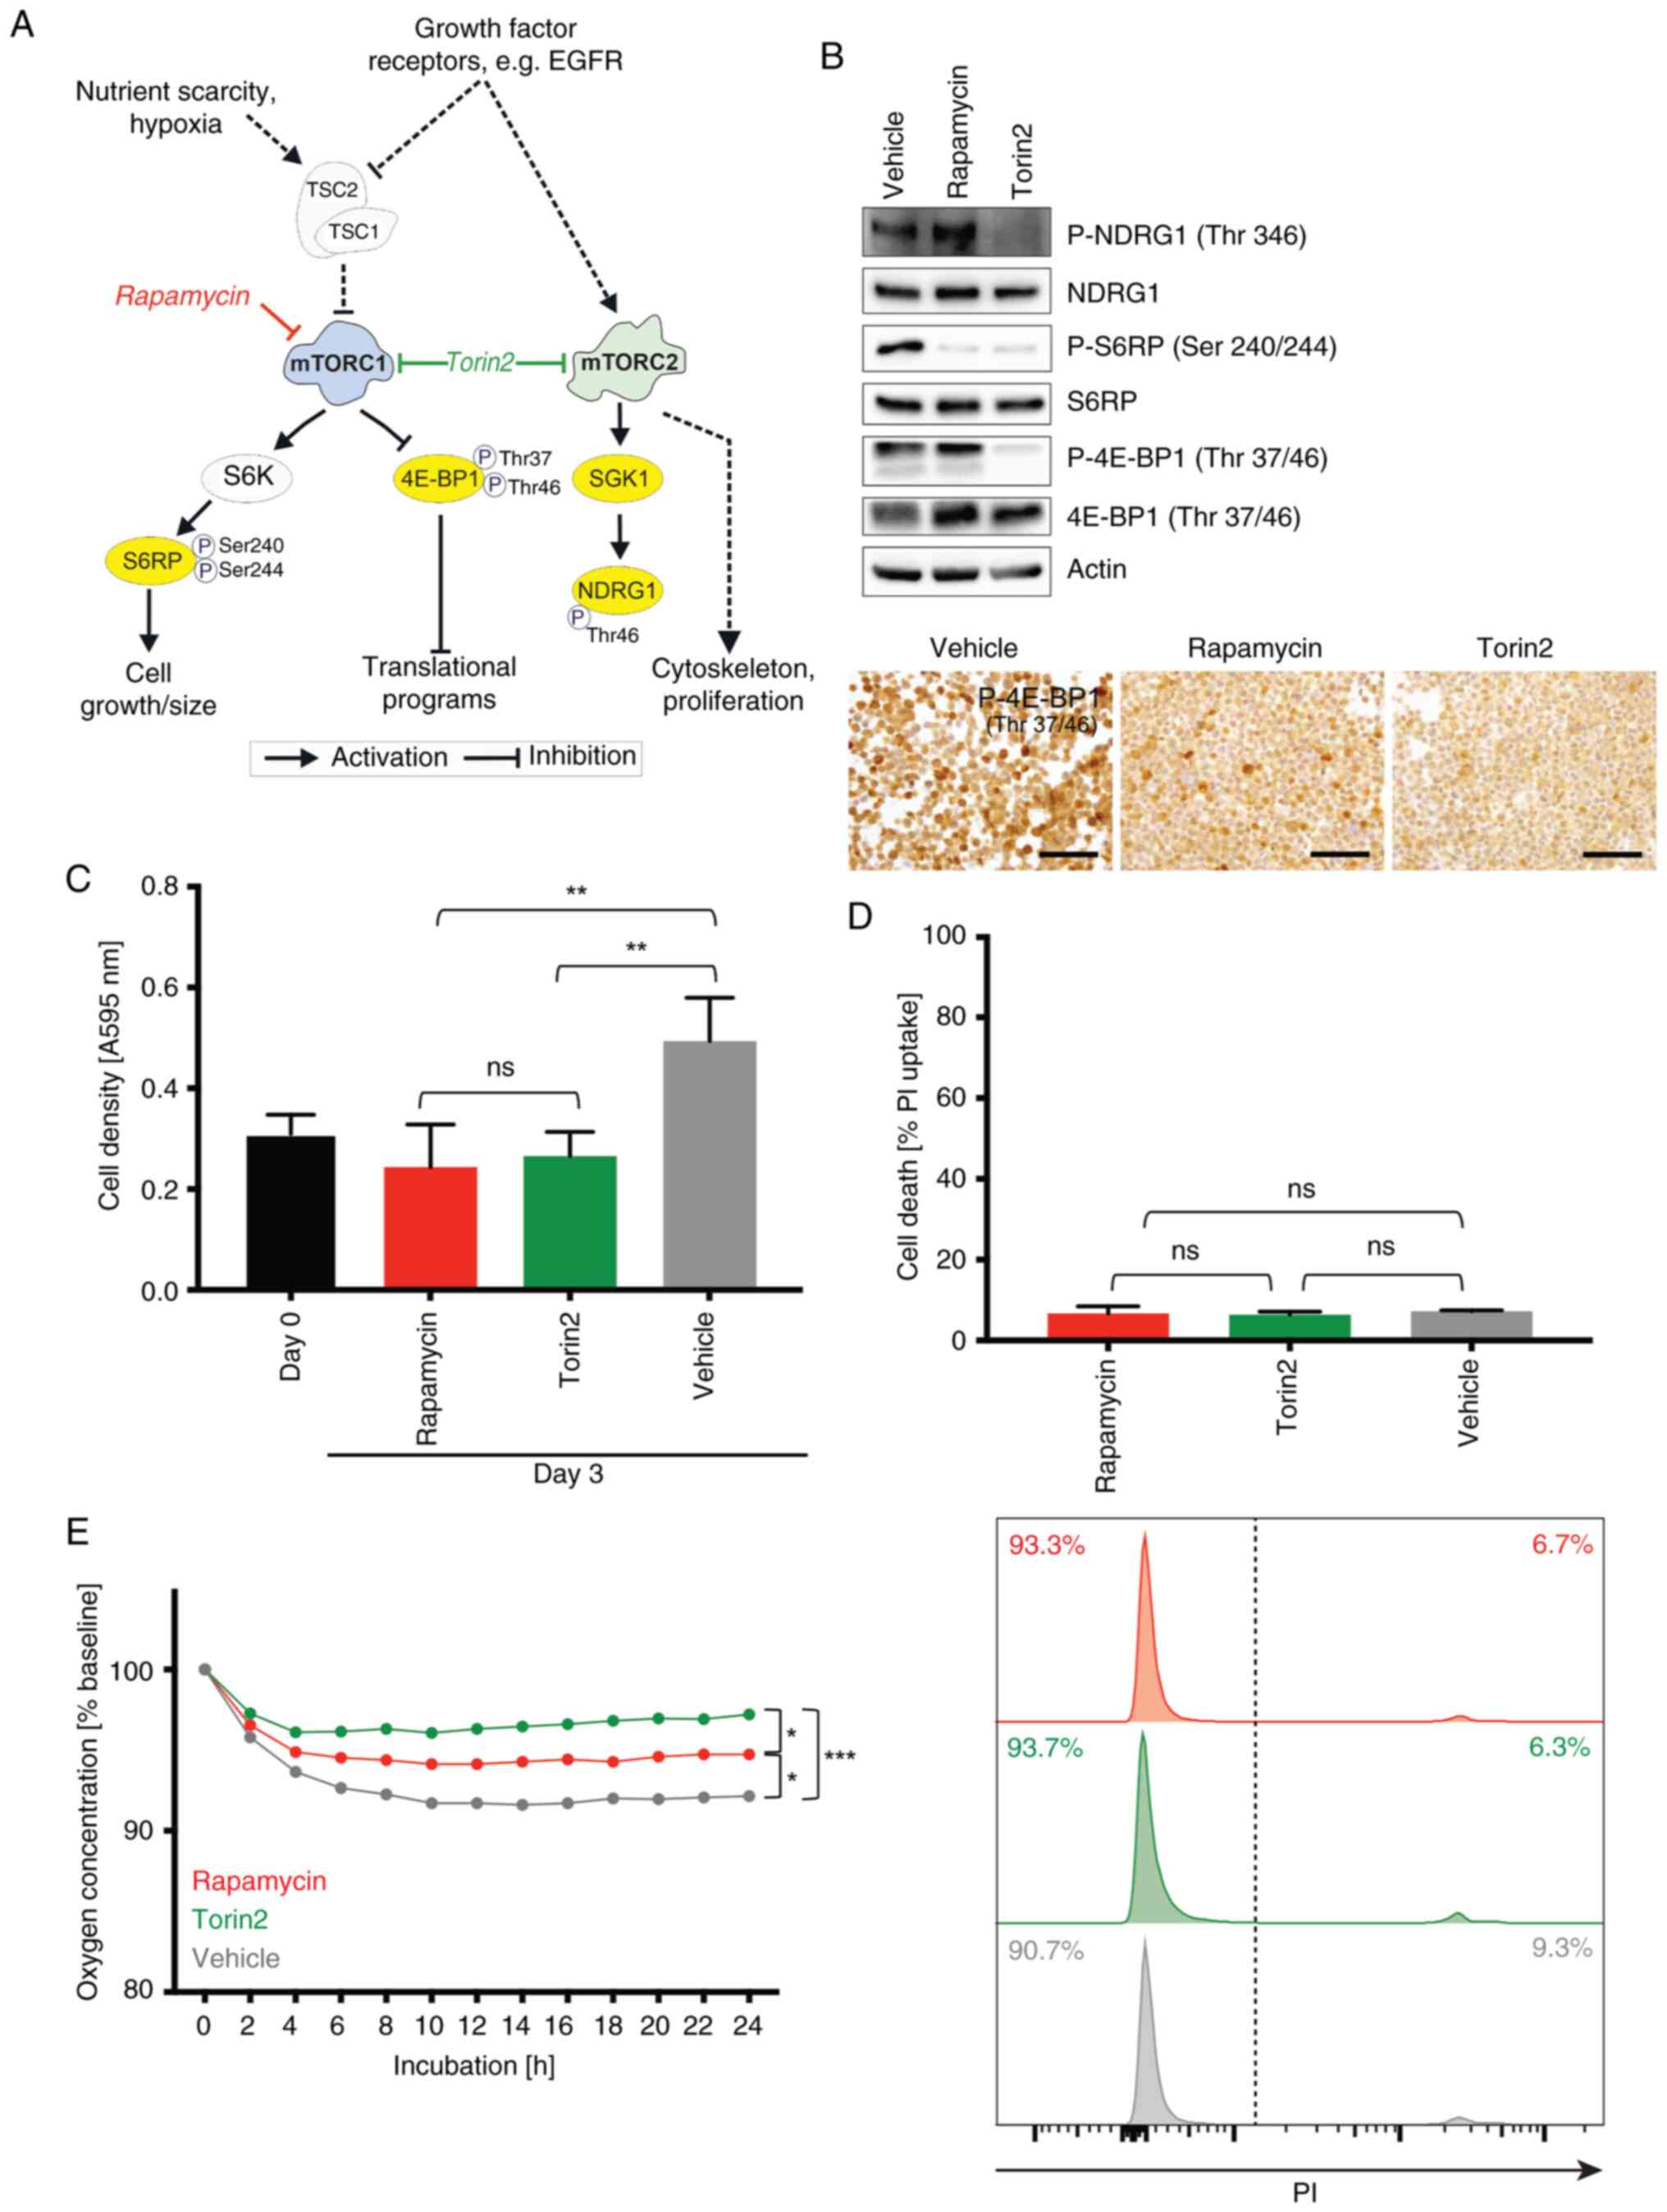 | Figure 1.Impact of pharmacological mTOR
inhibition on basal functions of human microglia cell lines. (A)
Overview of the mTOR pathway and targets of the mTOR inhibitors
investigated in this study. Scheme adapted from (33). (B) C20 cells were incubated with
100 nM rapamycin, 100 nM torin2 and vehicle control for 24 h.
Protein lysates were analyzed by immunoblotting with antibodies for
NDRG1, P-NDRG1 (Thr346), S6RP, P-S6RP (Ser240/244), 4E-BP1,
P-4E-BP1 (Thr37/46) and actin as well as by immunocytochemistry
stainings of P-4E-BP1 (scale bar, 100 µm) of C20 cell pellets
incubated with 100 nM rapamycin, 100 nM torin2 and vehicle control
for 24 h. (C-E) C20 microglia cells were treated with 100 nM
rapamycin (red), 100 nM, torin2 (green) or vehicle control (grey).
(C) Crystal violet staining was used to quantify cell density at
baseline (day 0, after a 24 h attachment period prior to any
treatment intervention, black) and after 72 h of exposure to the
respective treatment conditions. Data are presented as mean ± SD
(n=4; one-way ANOVA, Tukey's multiple comparisons test). (D) Cell
death was quantified by PI FACS after 72 h. Data represent mean ±
SD (n=3; one-way ANOVA, Tukey's multiple comparisons test).
Histograms were depicted. (E) Quantification of oxygen by a
fluorescence-based assay was performed in C20 cells during 24 h
treatment. Oxygen consumption is shown relative to the start of the
experiment as mean (n=3) every hour; treatment groups were then
compared at timepoint 24 h (n=3; one-way ANOVA, Tukey's multiple
comparisons test). *P<0.05, **P<0.01 and ***P<0.001. ns,
not significant; PI, propidium iodide; SD, standard deviation;
NDRG1, N-myc downstream-regulated gene 1; P-, phosphorylated; S6RP,
S6 ribosomal protein; 4E-BP1, 4E-binding protein 1. |
However, despite the biological rationale and
consistent activation of this pathway, clinical trials with mTOR
inhibitors in GB have so far only produced only weak and sometimes
even antagonistic signals in unselected GB patient cohorts
(3,27). Therefore, the results of biomarker
selected GB cohorts treated with mTOR inhibition (mTORi) in
multi-arm trials are eagerly awaited. The NCT Neuro Master Match
trial (N2M2, NOA-20) investigated temsirolimus-based mTORi in newly
diagnosed GB with upregulated mTOR signaling in bulk tumor tissue
(28), while the GBM AGILE trial
is testing paxalisib-based PI3K/mTORi in newly diagnosed or
recurrent tumors (29).
Additionally, several resistance mechanisms to mTORi in the complex
GB microenvironment, such as protection of tumor cells from
hypoxia-induced cell death or from temozolomide chemotherapy have
been reported (21,22,30,31).
Furthermore, biomarkers of mTOR activity could indicate a
subpopulation of GB patients more prone to benefit from mTOR
inhibitor treatment (26,32).
Interestingly, mTORC1 not only drives GB cell growth
and proliferation (21), but also
shows significant activity in GAM in vivo, as reflected by
the analysis of phosphorylation status of the mTOR target proteins
4E-BP1 and S6RP (33). The
regulation of peripheral innate immune cell functions by mTOR has
been extensively studied (34,35).
For example, the mTORC1 inhibitor rapamycin can enhance
pro-inflammatory cytokine production in macrophages (35). Also, various effects of mTORi on
tumor-associated macrophages in peripheral cancers have been
identified (36). In contrast, the
role of mTOR signaling for innate immune functions in the central
nervous system (CNS) and specifically MG and GAM has not been
understood in detail, yet. In certain preclinical models, mTOR
inhibition has been shown to exert anti-inflammatory effects on MG
during stroke (37,38) or aging (39) and to suppress LPS-induced
proinflammatory cytokine production (40). In contrast, in the context of
glioma, mTOR inhibition showed a pro-inflammatory GAM phenotype in
a rat glioma model (41) as well
as a reduced expression of anti-inflammatory markers in cell
culture (42). Additionally, the
landmark paper of Dumas et al (43) identified mTOR regulation in GAM-MG
(as opposed to GAM-MDM) as a central mechanism for glioma
progression with a correlation of mTOR activity and effector immune
evasion in the GB microenvironment. Genetic inactivation of mTORC1
in GAM-MG had anti-tumor effects and reduced glioma growth,
suggesting a prognostic relevance of mTOR signaling specifically in
microglia (43). Furthermore, we
previously reported that GB patients with higher levels of GAM had
improved OS when EGFR/mTOR signaling was targeted (within the OSAG
101-BSA-05 trial) (26). These
findings support the hypothesis that GAM could be a promising
target for a precision mTORi approach in GB. The aim of our study
was to further investigate the properties of GAM under
pharmacological mTORi compared to standard chemotherapy in GB.
Materials and methods
Reagents, cell lines and culture
conditions
A split of passage three of the human C20 MG cell
line was kindly provided in 2017 by Dr. David Alvarez-Carbonell
from the Department of Molecular Biology and Microbiology at the
Case Western Reserve University (10900 Euclid Ave., SOM WRT 205,
Cleveland, Ohio 44106, USA). The C20 cell line has the advantage
that it was generated from primary human MG obtained from fresh CNS
cortical tissue of adult patients by magnetic cell sorting
(44). Negativity for human
viruses (including HIV, HCV, HBV) in C20 cells was confirmed. The
resulting classification as biosafety level 1 of the C20 by the
department for biological safety of the University Hospital
Frankfurt was approved by the local authority (Regierungspräsidium
Gießen, Central regional council of Hesse). The human microglial
clone 3 cell line HMC3 was purchased from the ATCC (45) and originally derives from human
embryonic MG (46). LNT-229 cells
were a kind gift of Dr. Nicolas de Tribolet from the Department of
Neurosurgery and Laboratory of Brain Tumor Biology and Genetics
(Centre Hospitalier Universitaire Vaudois and University of
Lausanne, Lausanne, Switzerland) (47). No passage number was available for
LN-229 cells that are amongst the most widely spread glioblastoma
cell lines. LNT-229 glioma cells differ from LN-229 cells in having
retained wild-type p53 status (48). LNT-229 cells were authenticated
using short tandem repeat analysis (Multiplexion, Heidelberg,
Germany) and the STR profile of LNT-229 cells matched with the
known profile for LN-229 (49).
Cells were cultured in Dulbecco's modified eagle medium (DMEM)
containing 100 IU/ml penicillin and 100 mg/ml streptomycin (Life
Technologies, Darmstadt Germany) and 10% fetal calf serum (FCS)
(Biochrom KG, Berlin, Germany). All reagents not specified were
purchased from Sigma/Merck.
Transwell co-cultivation of microglia
and glioma cells as an in vitro GAM model
Transwell co-cultivation of the human MG cell lines
C20 or HMC3 with the glioma cell line LNT-229 was performed using
6- or respective 24-well cell culture inserts (1 µm pore; Greiner
bio-one, Frickenhausen, Germany). 6-well inserts were used for
experiments with protein and RNA analyses and 24-well inserts for
oxygen consumption analyses. MG were seeded into the lower chamber
(6-well: 500,000/well, 24-well: 120,000/well) and glioma cells into
the inserts (6-well insert: 400,000/well, 24-well insert:
30,000/well) separately in DMEM with 10% FCS 24 h prior to
co-cultivation. To provide a MG monoculture control condition, C20
or HMC3 MG were seeded into the inserts and lower chambers.
Cultivation was performed in serum-free DMEM with a total volume of
3 ml/500 µl or 2 ml/200 µl added to the well and insert (6-/24-well
plate, respectively). Cultured cells were treated with the mTOR
inhibitors 100 nM rapamycin and 100 nM torin2 as well as 400 µM
temozolomide or corresponding vehicle controls for 24 h. Rapamycin
and torin2 concentrations were selected based on previous studies
in glioblastoma cells demonstrating effective target inhibition
without cytotoxicity (21,25). Treatment durations were designed to
allow for steady-state cellular adaptation and to model prolonged
drug exposure, approximating clinical administration schedules of
mTOR inhibitors and temozolomide over a continuous period. The
temozolomide condition was used as a control to enable comparison
between the effects of standard GB chemotherapy and mTORi
treatment. After the incubation period, C20 or HMC3 cells in the
lower chamber were harvested for further analyses (RNA sequencing,
immunoblot, human cytokine array or oxygen consumption).
Cell density and viability assays
Cell density was assessed by crystal violet staining
as previously described (50)
after treatment of C20 or HMC3 with 100 nM rapamycin and 100 nM
torin2 as well as vehicle controls for 72 h in serum-free medium or
DMEM with 10% FCS. Cell viability measurement using propidium
iodide (PI) uptake and flow cytometry was performed as previously
described (21).
Oxygen consumption
After 24 h Transwell cultivation in mono- or
co-culture condition (see above), oxygen consumption was assessed
during 24 h treatment of C20 or HMC3 with 100 nM rapamycin, 100 nM
torin2 or vehicle control. Plates with oxygen sensors (Oxo Dish
OD24, PreSens, Regensburg, Germany) were used to quantify oxygen
consumption. Airtight conditions were achieved by covering with
sterile paraffin oil as previously described (22). Fluorescence-based measurement of
oxygen consumption was performed in triplicates.
Immunocytochemistry
Immunocytochemistry (ICC) was performed in C20 or
HMC3 cells after treatment with 100 nM rapamycin and 100 nM torin2
as well as a vehicle control. Paraffin embedded cell pellets were
prepared as previously described (33). Pellets were cut in slices of 3 µm
thickness using a microtome (Leica Microsystems, Nussloch GmbH,
Nussloch, Germany) and placed onto SuperFrost slides (Thermo
Scientific, Dreieich, Germany). mTORi was investigated according to
the phosphorylation status of the mTORC1 target protein 4E-BP1
using the phospho-4E-BP1 (Thr37/46) antibody diluted 1:1,000
(236B4; Cell Signaling). ICC was performed according to
standardized protocols of the Leica BOND-III automated stainer
(Leica, Wetzlar, Germany) and stainings were analyzed using a light
microscope (BX41, Olympus, Hamburg, Germany).
Protein isolation and immunoblot
analysis
Protein lysates were prepared using lysis buffer P
followed by a determination of protein concentration by
Bradford-Assay to analyze equal amounts of protein loading of each
sample as previously described (51). Electrophoretic separation of the
denatured proteins was performed on 12% SDS-polyacrylamide gels
followed by a blotting process as described previously (12). Membranes were blocked in 1×
Roti-Block blocking buffer (Roth, Karlsruhe, Germany) and then
incubated with antibodies against 4E-BP1 (Cell Signaling),
phospho-4E-BP1 (Thr37/46) (236B4; Cell Signaling), S6RP (5G10; Cell
Signaling), phospho-S6RP (Ser240/244) (D68F8; Cell Signaling),
NDRG1 (D8G9; Cell Signaling), phospho-NDRG1 (Thr346) (D98G11; Cell
Signaling) or beta-actin (Santa Cruz Biotechnology) as a loading
control. The secondary antibodies were purchased from Jackson
ImmunoResearch, USA. Immunodetection was performed by HRP
enzyme-coupled secondary antibodies, which oxidize luminol
(AppliChem GmbH, Darmstadt, Germany) resulting in a
chemiluminescent reaction on X-ray films (Super RX, Fujifilm Europe
GmbH, Düsseldorf, Germany).
Human cytokine array
After 24 h Transwell cultivation of the MG cell
lines C20 or HMC3 with the glioma cell line LNT-229 in serum-free
DMEM, protein lysates of HMC3 or C20 cells were prepared.
Experiments were performed in biological triplicates and pooled for
a sufficient protein concentration to perform the human cytokine
array according to the manufacturer's protocol (ARY005B, R&D
Systems). The array enables a simultaneously detection of 36
different cytokines, chemokines and acute-phase proteins per sample
(CCL1/I-309, CCL2/MCP-1, MIP-1α/MIP-1β, CCL5/RANTES, CD40
Ligand/TNFSF5, Complement Component C5/C5a, CXCL1/GROα,
CXCL10/IP-10, CXCL11/I-TAC, CXCL12/SDF-1, G-CSF, GM-CSF,
ICAM-1/CD54, IFN-γ, IL-1α/IL-1F1, IL-1β/IL-1F2, IL-1ra/IL-1F3,
IL-2, IL-4, IL-5, IL-6, IL-8, IL-10, IL-12 p70, IL-13, IL-16,
IL-17A, IL-17E, IL-18/IL-1F4, IL-21, IL-27, IL-32α, MIF, Serpin
E1/PAI-1, TNF-α and TREM-1). The coordinates of the array are
available in the protocol (https://resources.rndsystems.com/pdfs/datasheets/ary005b.pdf?v=20250615).
Immunodetection was performed as described in the section
immunoblot analysis. Quantification was performed by measuring the
pixel density of scanned films using ImageJ software (NIH).
Whole transcriptome analysis
Extraction of total RNA using TRIzol and the
ExtractMe Total RNA Kit (Blirt, Danzig, Poland) was performed as
described previously (22). Paired
end, 150 base pair, sequencing was performed with an Illumina
HiSeq2500 by Genewiz (New Jersey, USA). RNA-sequencing libraries
were generated with the SMART-Seq preparation kit (CloneTech) and
fragmented with the Nextera XT kit (Illumina). The following steps
were performed as previously described (52,53).
Pre-processing of fastq-files of bulk sequenced samples including
filtering for quality scores, poly-A trimming, removal of N
containing reads, artifact removal and clearing of rRNA
contamination was achieved using a pipeline in the HUSAR platform,
provided by DKFZ (Heidelberg, Germany). Transcriptomes were mapped
to the human genome using the genecode annotations (release v. 32;
genome assembly version GRCh38.p13) and TopHat2 (v. 2.0.14)
(54). The number of reads per
gene was determined by HTSeq count. Overlaps were considered as
unique. Further analysis was performed within R (v. 4.1.2),
operating in RStudio (v. 2022.02.0) with BioMart package (v.
2.50.3) and DESeq2 (v. 1.34.0) (55).
Gene expression analyses
Gene annotation and species conversion was done
using the biomaRt R package (v. 2.38.0). For principal component
analysis (PCA) and unsupervised clustering, read counts were
normalized using variance-stabilized transformed (vst) data (‘vst’
function of DESeq2 package which equals log2 transformation),
respecting a base mean >20 and an adjusted P-value of 0.05 (=
FDR 5 %). PCAs were plotted using the ‘autoplot’ function of
ggplot2 package (v. 3.3.5). Heatmaps of the top 2,000 genes were
created with the pheatmap package (v. 1.0.12). Hierarchical
clustering of the top 100 gene loadings of the PCAs was performed
in JMP 16.2.0 by use of the complete linkage variance method. The
first PC obtained by the PCA was used as an ordering column sorting
the clusters by these values.
Gene set enrichment analysis
(GSEA)
GSEA was performed using fgsea R package (v. 1.18.0)
as reported before (53). Genes
with base mean <20 were removed and the remaining genes were
ranked ascendingly based on the log2 fold change. The ranked gene
list was compared against the MSigDB database (v. 7.4) using
‘fgseaMultilevel’ function with the default settings. Normalized
enrichment scores (NES) were used for subsequent heatmaps of the
top 50 Hallmark signatures graphed with JMP 16.2.0.
Statistical analysis and data
visualization
Statistical analyses were conducted using JMP 16.2.0
(SAS, Cary, USA), GraphPad Prism V9 or R (v. 3.5 or v. 4.2.1).
Detailed information on the respective analyses was indicated in
the corresponding figure legend or specific methods section.
Quantitative data were depicted including mean and standard
deviation (SD). Statistically significant P-values were indicated
(*P<0.05; **P<0.01; ***P<0.001). BioRender was used for
illustrations.
Results
Pharmacological inhibition of mTOR
signaling in microglia cell lines
To determine the sensitivity of human MG cell lines
to pharmacological mTORi, the C20 cell line (with the advantage of
having been generated by a cell sorting approach) (44) and the established HMC3 MG cell line
(45,46) were treated with the allosteric
mTORC1 inhibitor rapamycin or torin2 that inhibits both mTORC1 and
mTORC2 in an ATP-competitive manner. Both MG cell lines showed a
strong expression of mTOR signaling per se and were sensitive to
treatment with rapamycin and torin2. Treatment with torin2 resulted
in a profound reduction of the phosphorylation of all investigated
target proteins, whereas rapamycin treatment mainly reduced the
signal of S6RP phosphorylation (Fig.
1B). These results are in line with the known effects of the
first generation mTORC1 inhibitors rapamycin and its derivatives in
contrast to second generation mTOR inhibitors like torin2 in glioma
cells (25,33). The assessment of basal MG cellular
functions commonly affected by mTORi with rapamycin and torin2
showed a reduced proliferation (Fig.
1C) without displaying major cytotoxicity (Fig. 1D) and a reduced oxygen consumption
in the MG cell lines (C20 in Fig.
1E, HMC3 in Fig. S1) similar
as previously reported from glioma cell lines with stronger effects
of torin2 (22,25).
Effects of pharmacological mTOR
inhibition on the GAM transcriptome
To examine effects of mTORi on the GAM phenotype we
employed a defined co-culture model (Fig. 2A). The C20 or the HMC3 cell line
was cultured either in co-cultivation with the GB cell line LNT-229
(GAM co-culture) or in a monoculture condition with the MG cell
line in both compartments of the well (MG mono-culture). The PCAs
of the entire transcriptome dataset as well as the unsupervised
clustering of the top regulated genes across all conditions
exhibited a discernible C20 or HMC3 signature induced by rapamycin,
which triggered marked differences compared to temozolomide or the
untreated condition (Figs. 2B,
S2, S3A, B). For example, in C20 cells, PC 1
of the PCA primarily differentiated the samples based on
temozolomide treatment, while PC 2 distinguished the samples based
on rapamycin treatment and the culture condition (Fig. 2B). Notably, the pharmacological
treatment with rapamycin or temozolomide had more influence on the
transcriptional phenotype than the presence or absence of glioma
cells (GAM co-culture vs. MG mono-culture condition). These effects
were observed in both the C20 and HMC3 cell lines, although they
were clearer in the C20 cell line (C20 in Figs. 2B, S2; HMC3 in Fig. S3A, B). Effects of co-culturing in
the unsupervised transcriptome-based clustering analysis were most
apparent in the rapamycin treatment condition in the C20 as
compared to the HMC3 cell system (Figs. S2, S3B). Upon analyzing the most
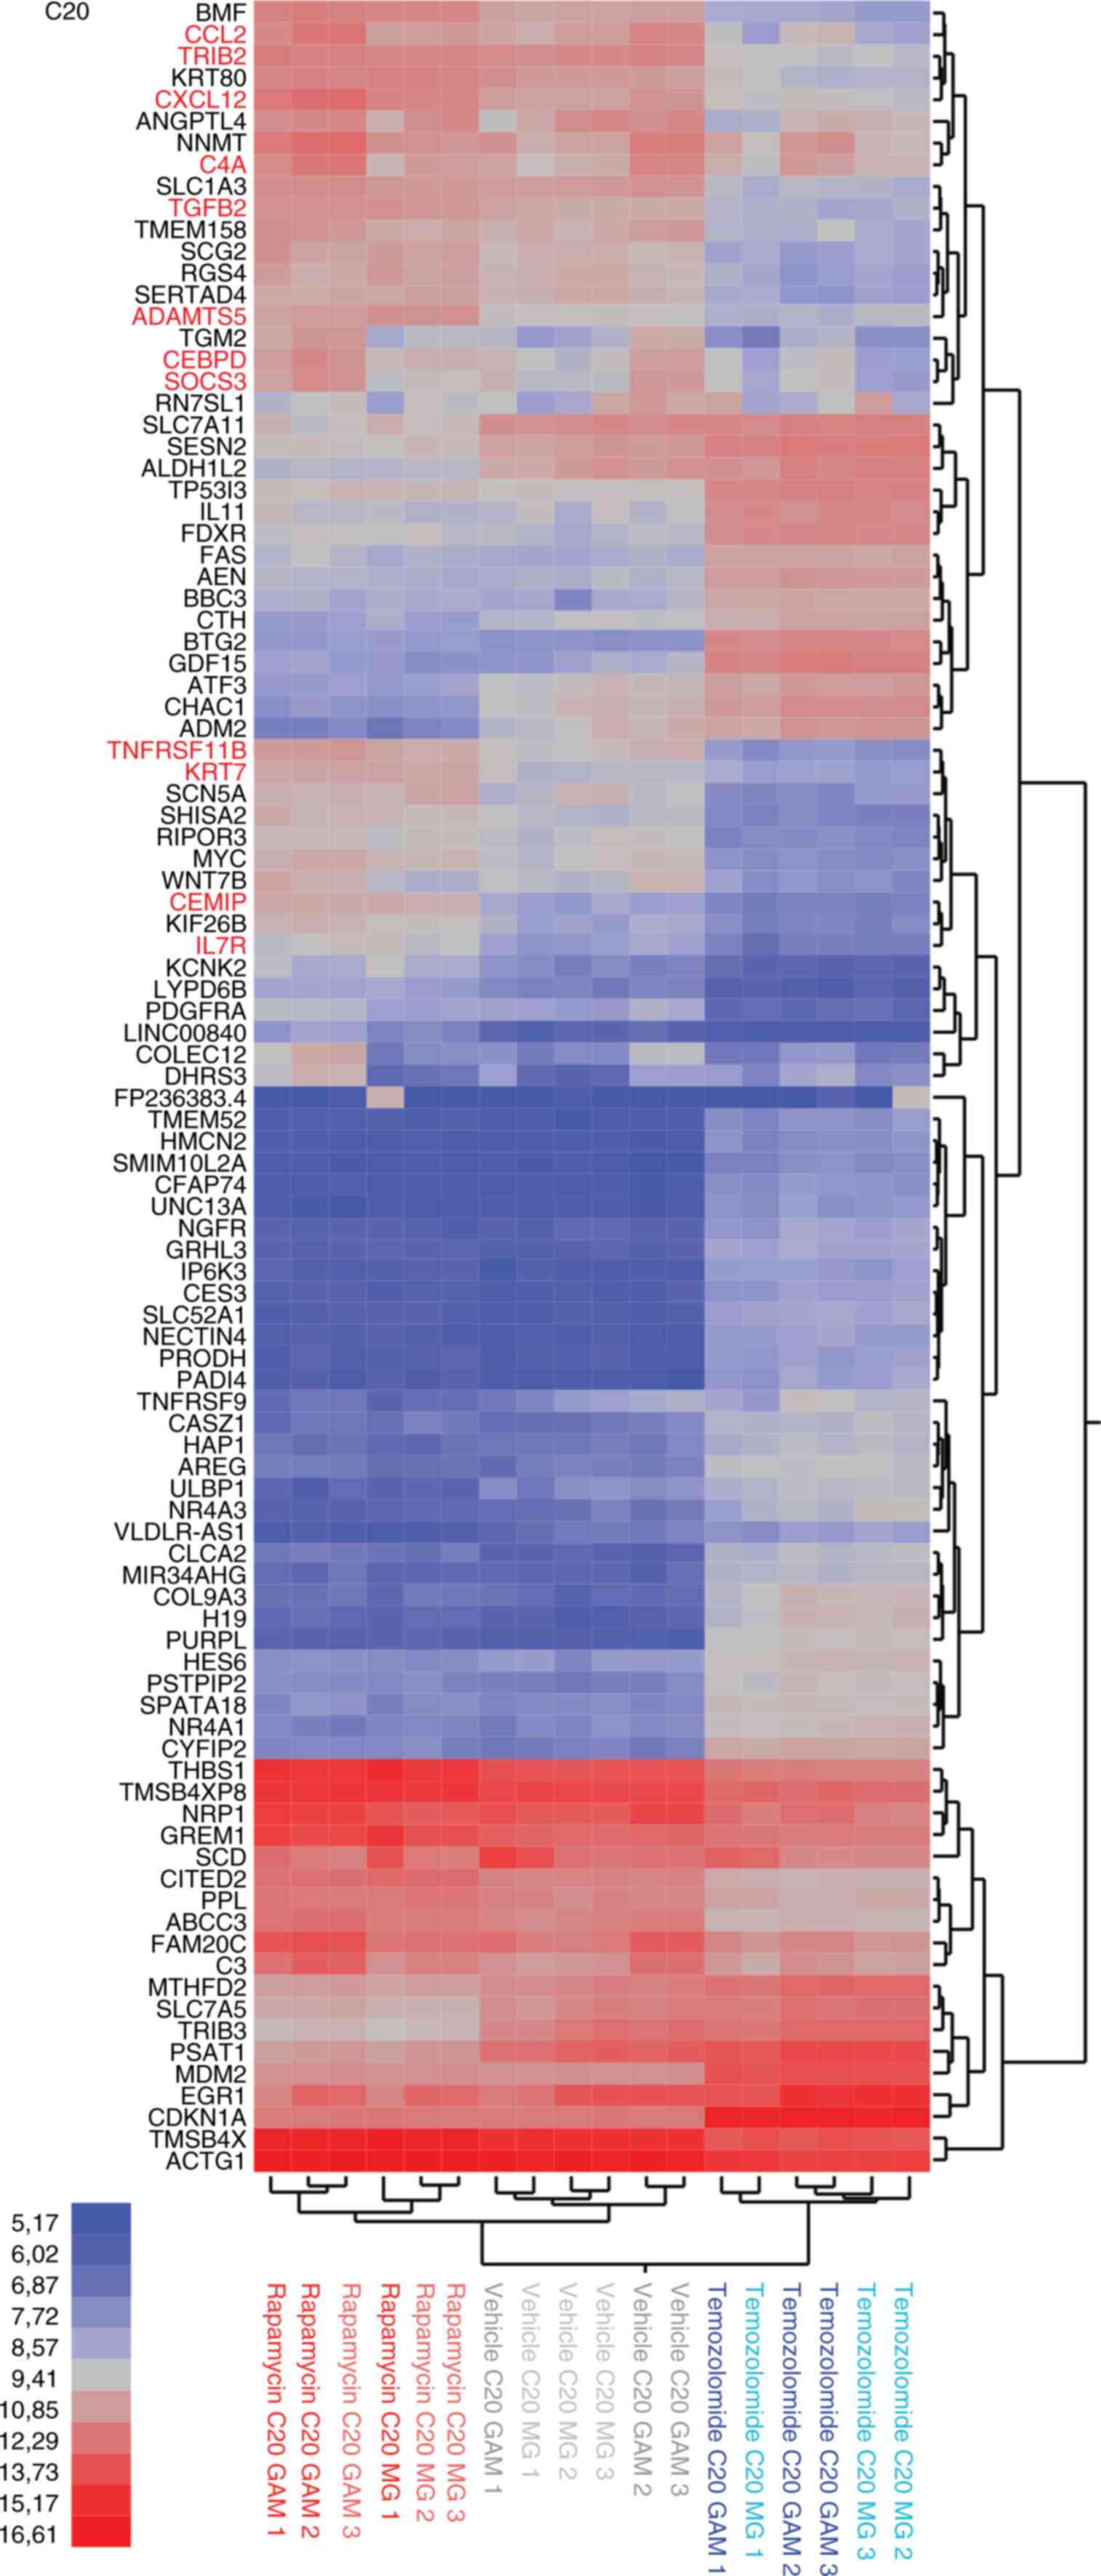
significantly regulated genes, we found that treatment with
rapamycin resulted in increased expression levels of genes
associated with inflammatory processes. These included
pro-inflammatory cytokines, components of the complement system,
and signaling molecules involved in migration and invasion (such as
ADAMTS5, C4A, CCL2, CEBPD, CEMIP, CXCL12, IL7R, KRT7, SOCS3,
TNFRSF11B or TRIB3). Notably, this effect was more
explicit in the GAM co-culture condition compared to the MG
mono-culture condition. In contrast to rapamycin, temozolomide
treatment had a significant impact on genes related to cell death
(such as AEN, BBC3, BTG2 or FAS) (Fig. 3). Also, there was a substantial
overlap in the top regulated genes of C20 and HMC3 cells (Fig. S4A, B). To gain a broader
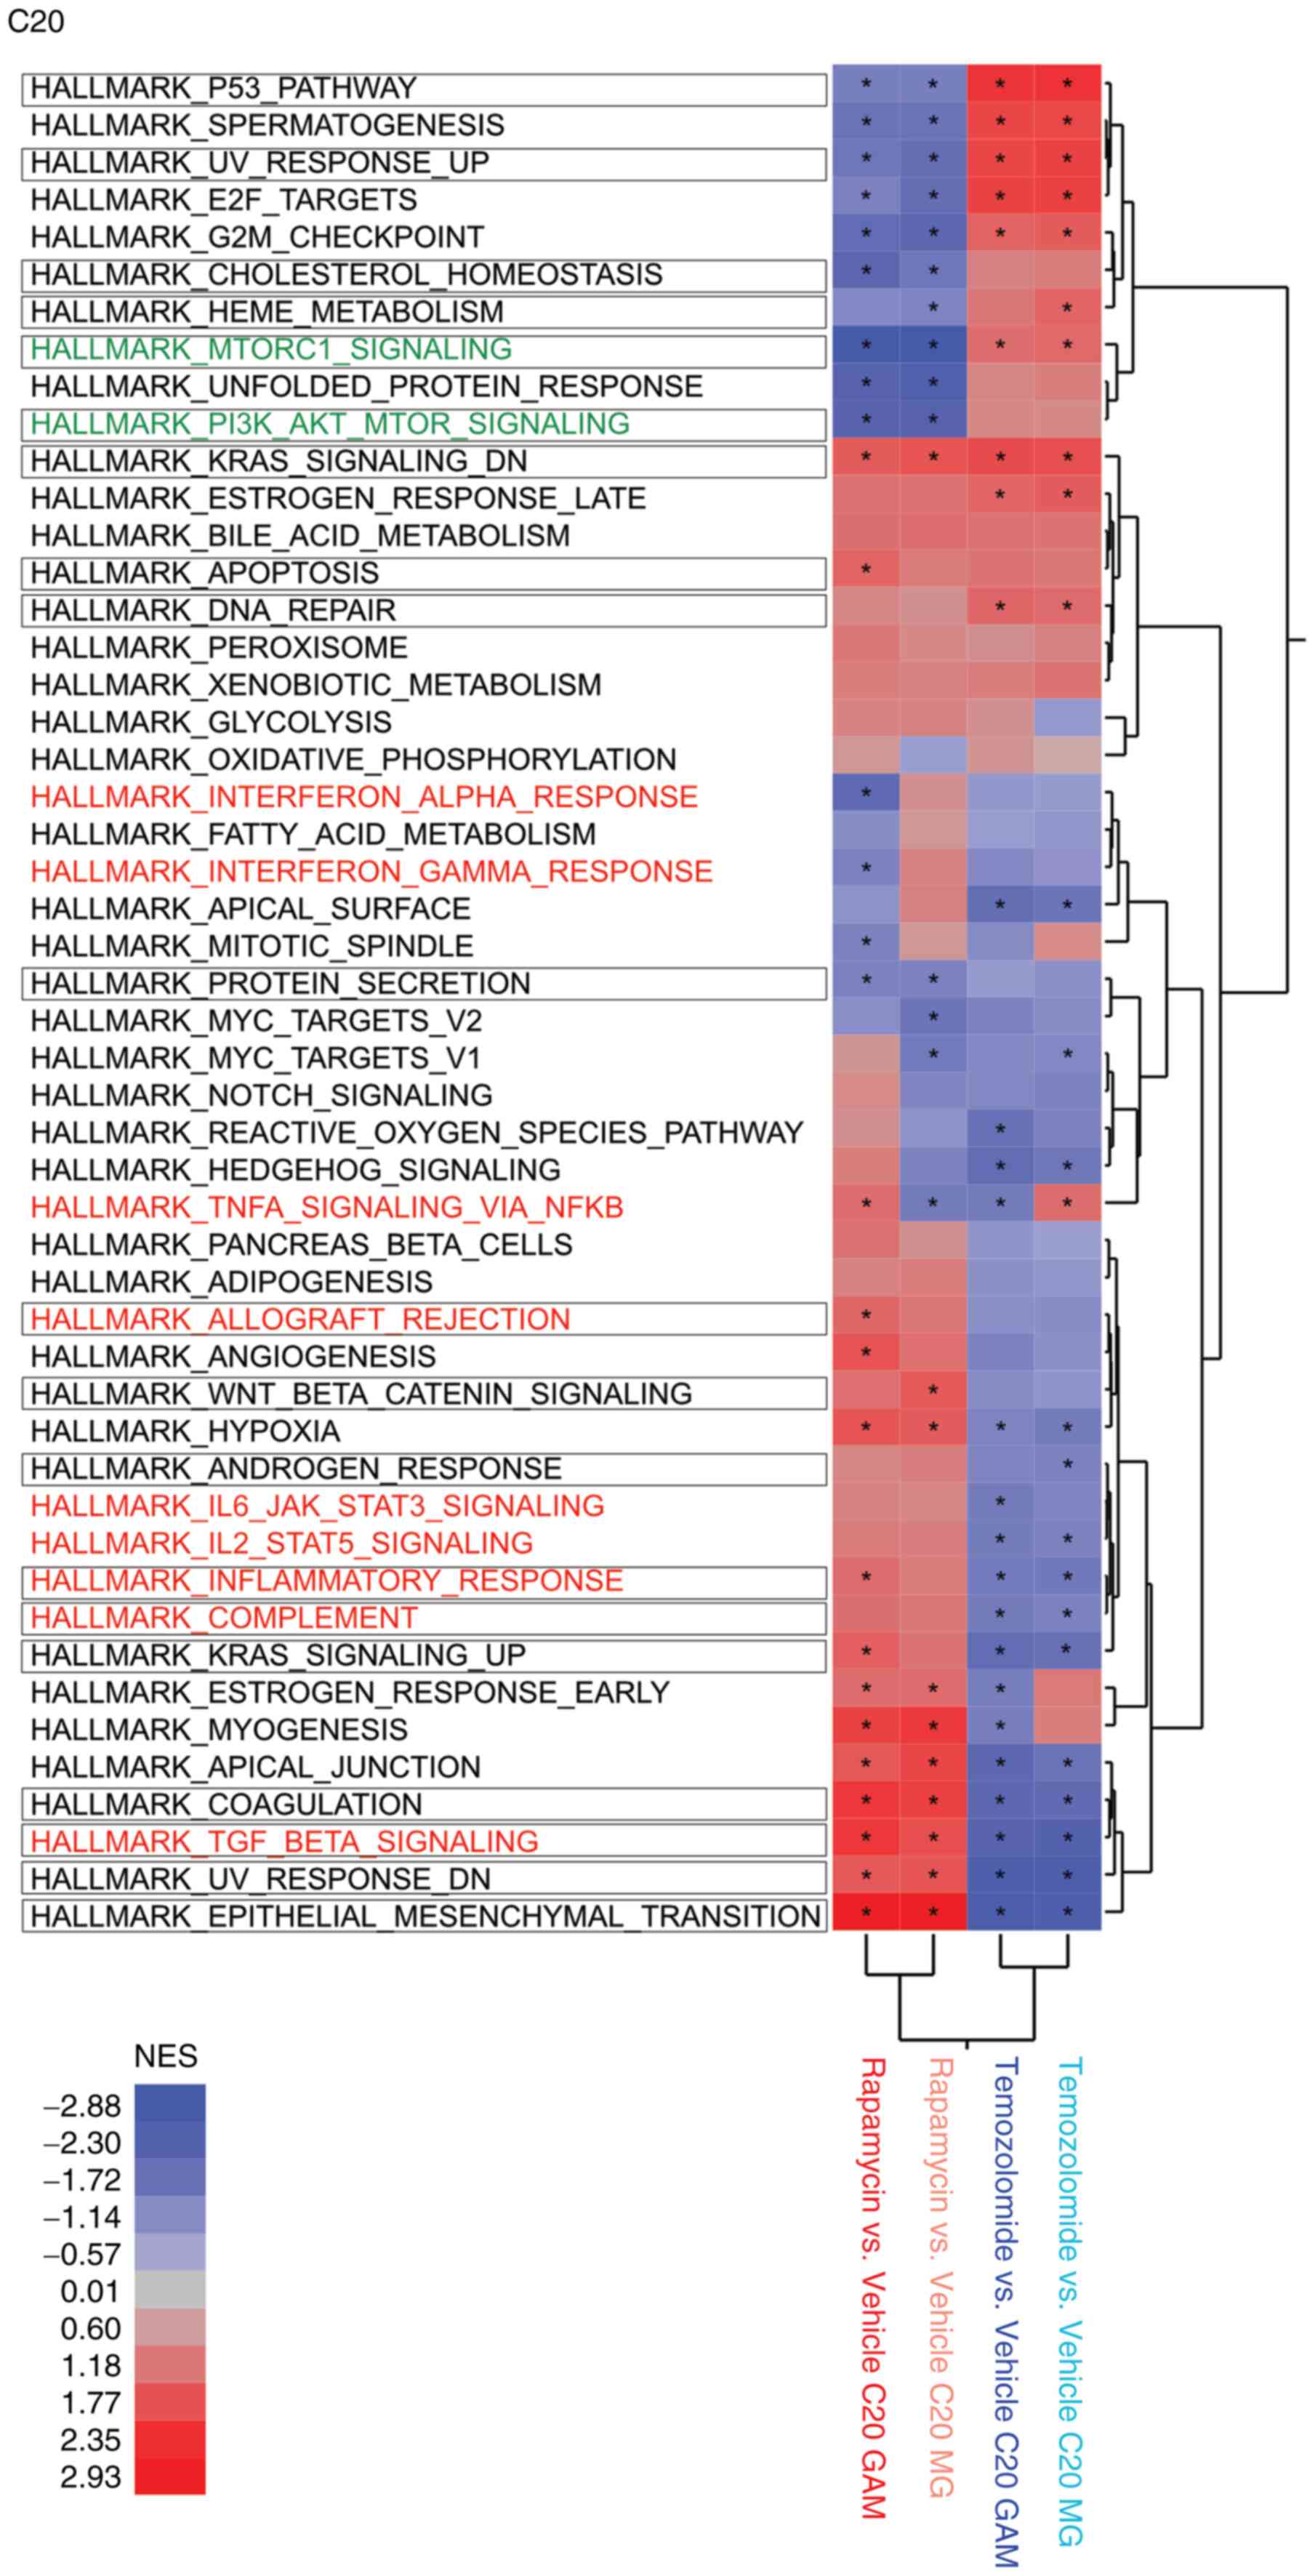
understanding of the signaling pathways and gene programs involved,
we conducted GSEA, which corroborated that rapamycin upregulated
key immunogenic hallmark gene sets in both MG and GAM, whereas the
standard alkylating chemotherapy agent temozolomide appeared to be
associated with cell cycle related hallmark gene sets (Fig. 4). As a proof of concept, the GSEA
indicated that the rapamycin-induced phenotype in both MG and GAM
showed reduced mTORC1 signaling (Fig.
4).
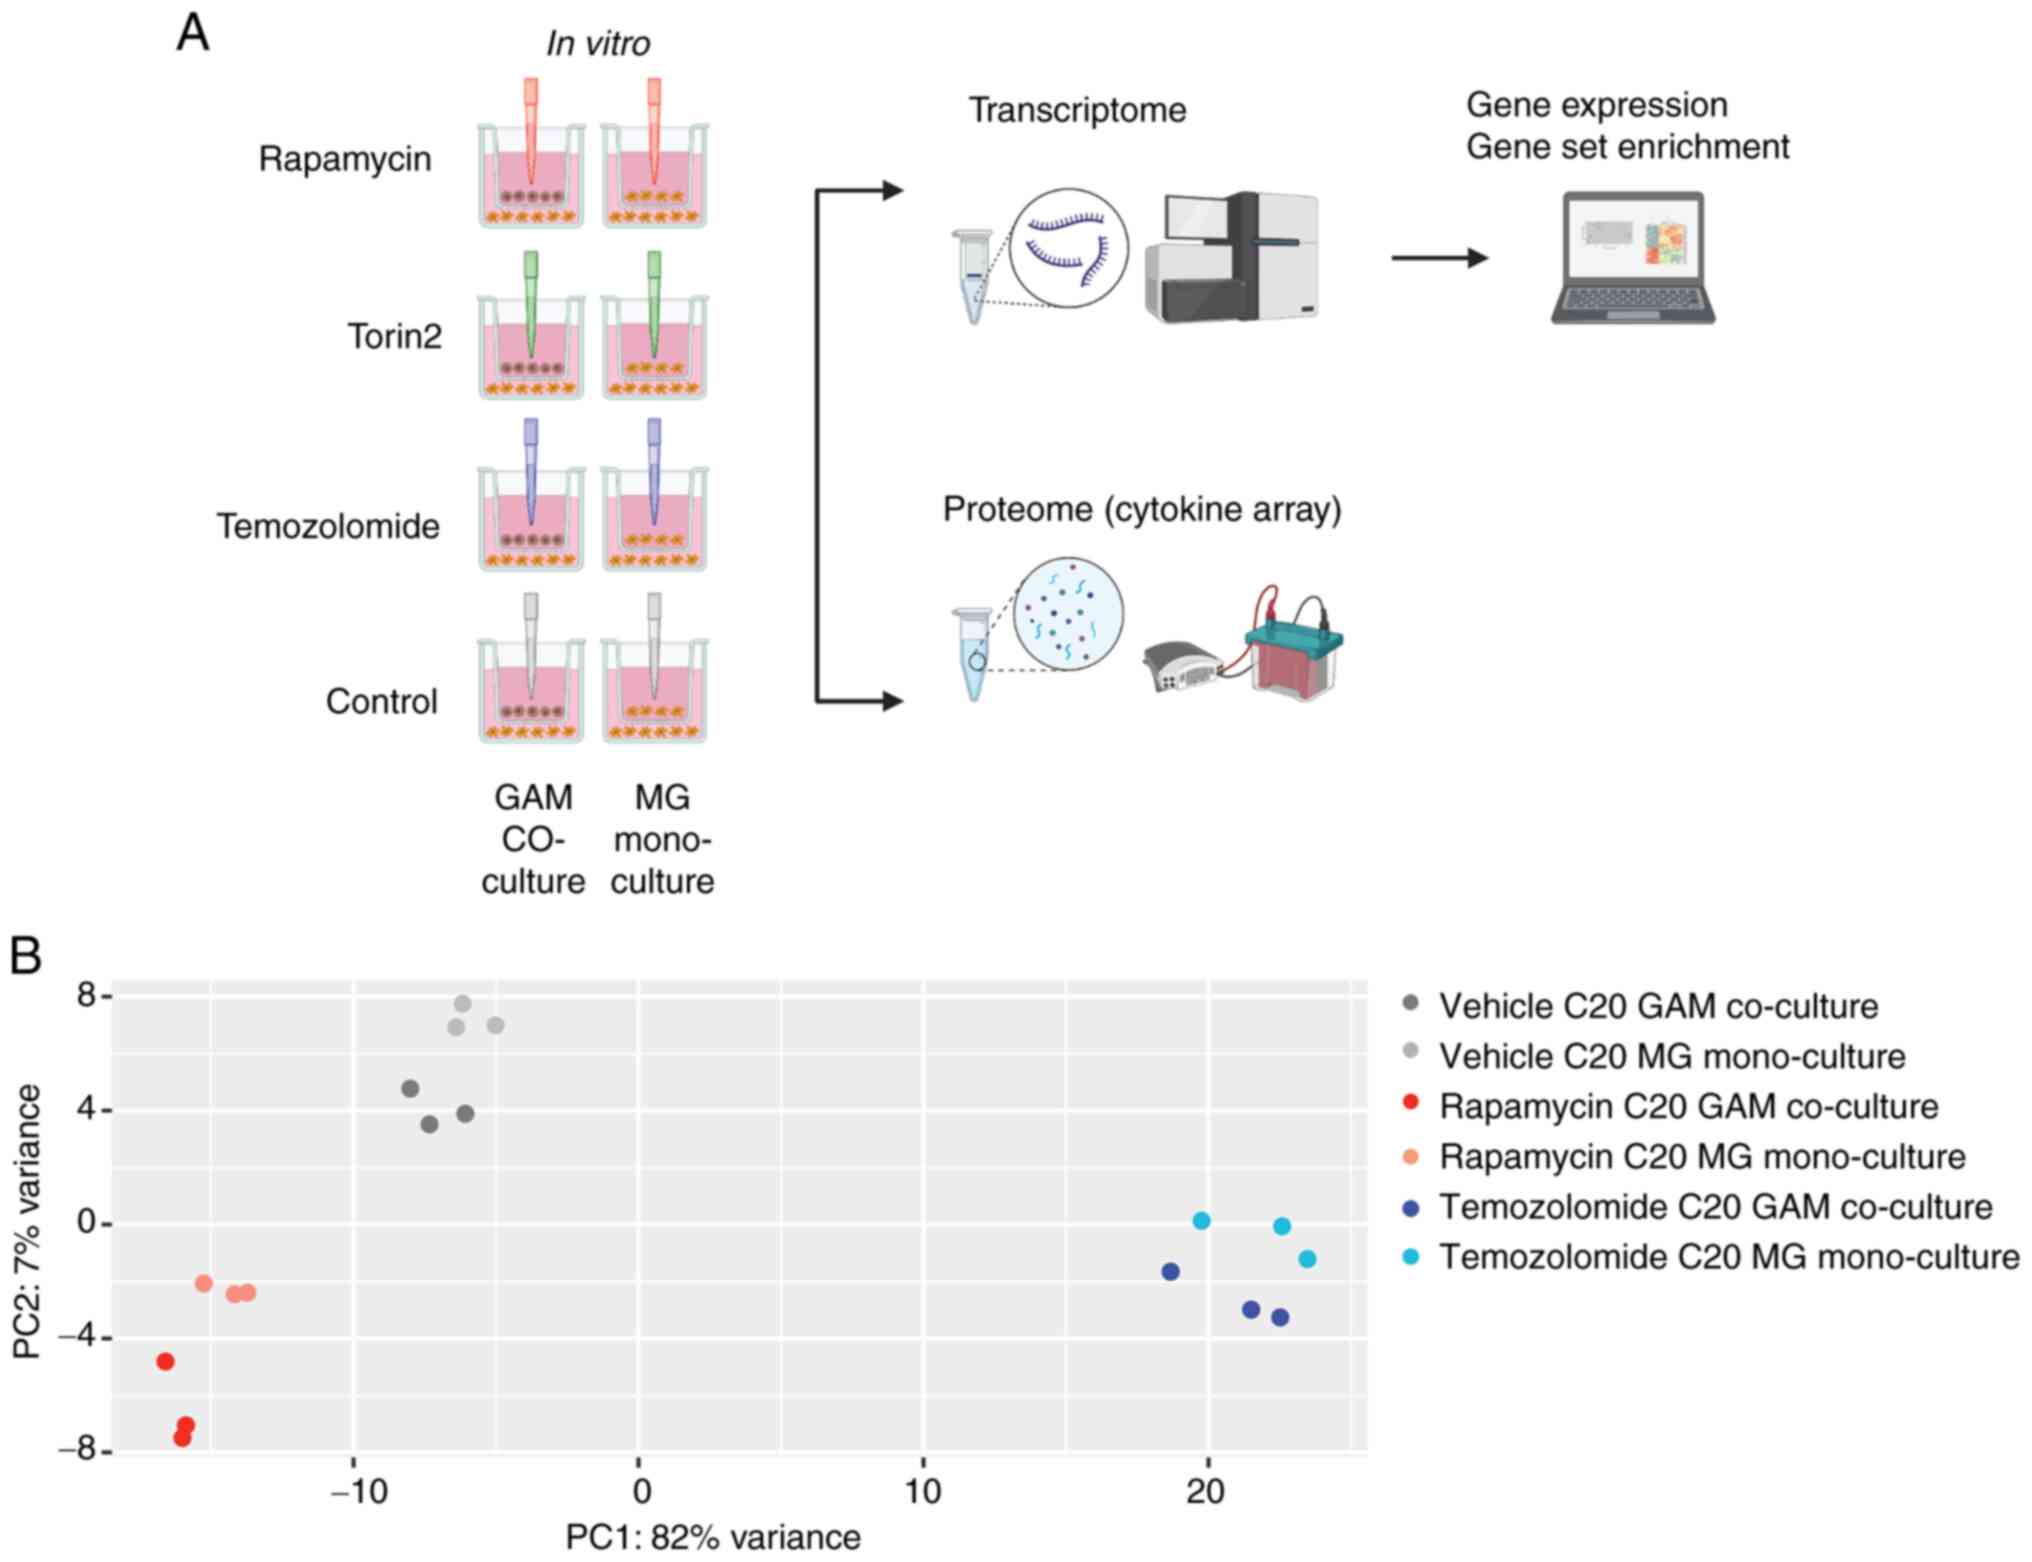 | Figure 2.Impact of rapamycin compared with
temozolomide on the GAM transcriptome. (A) Overview on all
treatment conditions used throughout the experimental setup
(created in BioRender, Strecker, M. (2025); http://BioRender.com/wgg6ezp). Temozolomide effects
were only analyzed by RNA sequencing (transcriptome), torin2
co-culture experiments were only analyzed in the cytokine assay.
(B) Gene expression was analyzed in the whole transcriptome dataset
by PCA across all C20 samples including triplicates of the
different treatments (rapamycin, temozolomide and vehicle control)
in the co-culture (C20 microglia with LNT-229 glioma cells) or the
C20 mono-culture condition (bright colors, GAM co-culture of C20
with LNT-229; light colors, MG mono-culture control condition; red,
treatment with 100 nM rapamycin; blue, 400 µM temozolomide; grey,
vehicle control) (biological replicates were labelled 1 to 3). PCA,
principal component analysis; GAM, glioma-associated
microglia/macrophages; MG, microglia. |
Effects of pharmacological mTOR
inhibition on the GAM phenotype
In line with the transcriptome analysis, the human
cytokine array revealed elevated protein levels of pro-inflammatory
cytokines following mTORi by rapamycin or torin2 especially under
co-culture with GB cells (GAM model). Strikingly, torin2 induced 28
whereas rapamycin only 2 out of 36 proteins of the cytokine array
in C20 GAM (Fig. 5). Comparing the
transcriptome (C20: Figs. 3,
4, HMC3: Figs. S5, S6) and cytokine array protein data (C20:
Fig. 5, HMC3: Fig. S7), rapamycin-induced enrichment
for certain gene sets including Hallmark_IL6_JAK_STAT3_signaling
(Fig. 4) could be confirmed by an
increased IL-6 cytokine protein level in the GAM condition in C20
cells (Fig. 5B, C). Comparatively
minor effects were observed in the HMC3 model (Fig. S7). Rapamycin-induced enrichment of
other inflammatory gene sets or immunogenic pathways in GAM in C20
or HMC3 was not traceable in the human cytokine array except for an
upregulation of IL-8 in C20 (Fig. 5B,
C). However, cytokines corresponding to a portion of the gene
sets regulated by rapamycin on the transcriptional level (Fig. 4) could be detected in GAM and/or MG
following treatment with torin2, e.g. TNF-α or IFN-γ signaling
(Fig. 5B, C). When comparing
effects in a microglia mono-culture (MG model) rapamycin and torin2
induced the same cytokines. Both in C20 as well as HMC3 cells these
included macrophage migration inhibitory factor (MIF) as well as
Serpin E1/PAI-1 (Figs. 5C;
S7B).
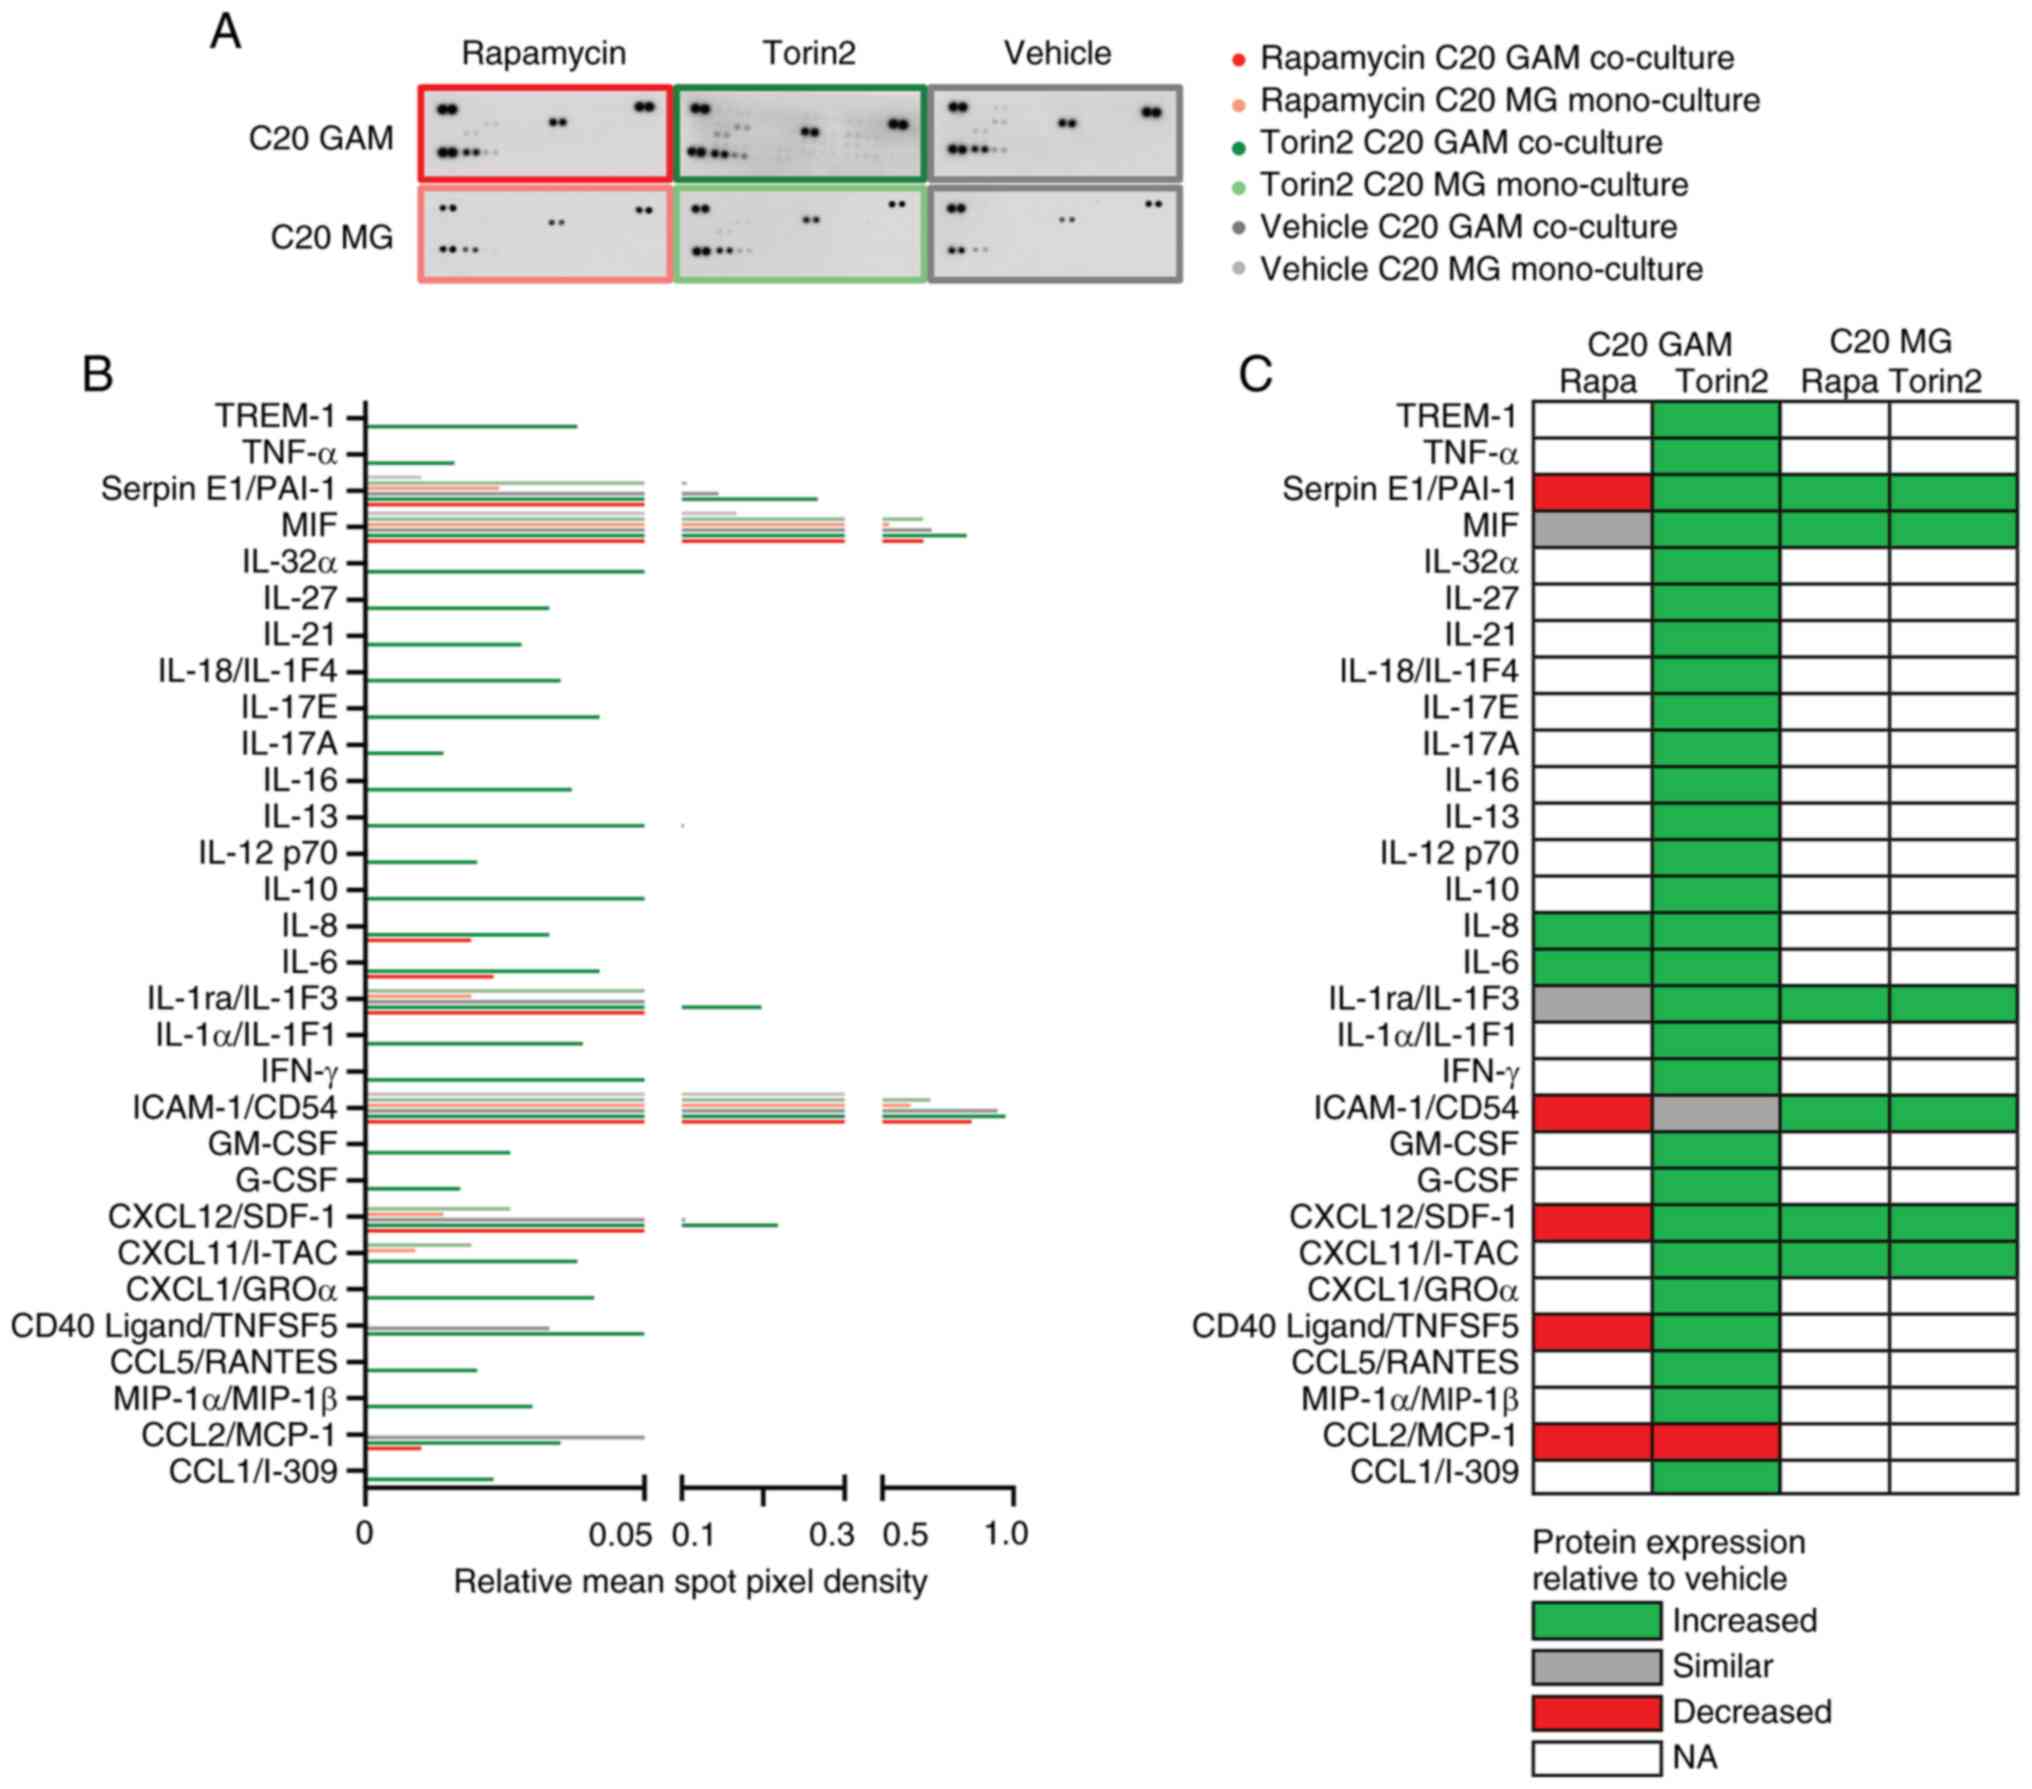 | Figure 5.Impact of pharmacological mTOR
inhibition on cytokine expression profiles of GAM. (A)
Immunodetection of 36 different cytokines (each in duplicate) per
pooled sample (pool of n=3) incubated with rapamycin, torin2 or
vehicle. (B) Quantification by relative mean spot pixel density for
each cytokine was depicted. (A and B) Bright colors, GAM co-culture
of C20 with LNT-229; light colors, MG mono-culture control
condition; red, treatment with 100 nM rapamycin; green, 100 nM
torin2; grey, vehicle control. (C) Overview of protein expression
in the treatment conditions rapamycin and torin2 compared to
vehicle control in C20 GAM and C20 MG, respectively. Green,
increased; grey, similar; red, decreased; no color, not
analyzable/detectable. GAM, glioma-associated
microglia/macrophages; MG, microglia. |
Discussion
Our study demonstrated a regulation of key
immunogenic pathways in GAM by pharmacological mTORi with rapamycin
and torin2 in a human cell line co-culture model. These findings
are in line with the study by Dumas et al (43) and other pre-clinical glioma models
(41,42), which showed that mTORi in
GAM-microglia reshaped the GB microenvironment towards a
pro-inflammatory and anti-tumorigenic state with effects on
survival in glioma tumor models. Mechanistically, mTORi interfered
with a GB cell-mediated activation of mTOR in GAM microglia which
otherwise promoted an immunosuppressive phenotype that hampered the
anti-tumor adaptive immune response (43). Of note, mTOR inhibition has also
been reported to exert anti-inflammatory effects on MG, e.g. in the
context of stroke or aging (37–39).
Therefore, our observed pro-inflammatory effects in GAM-microglia
might depend on the cellular microenvironment or disease model
which needs to be considered when evaluating mTORi as a
therapeutic. Our previous study identified the GB immune
microenvironment as a potential factor relevant for the response to
therapies targeting EGFR/mTOR signaling in human GB patients
(26). Analyses of the GB patient
cohort of the OSAG 101-BSA-05 trial revealed that higher levels of
GAM in the initial treatment-naïve tissue were associated with
improved OS in patients treated with the anti-EGFR antibody
nimotuzumab (26), despite the
overall negative outcome of the study (of a non-biomarker selected
study population) (56). These
findings (26,43), together with our present study,
support the hypothesis that GAM could pose a co-target for
therapeutic mTORi in GB.
In our study, we investigated the effects of
pharmacological mTORi on GAM and observed overall largely similar
outcomes with both the first generation mTORC1 inhibitor rapamycin
and the more potent second-generation ATP-competitive mTOR
inhibitor torin2, which targets both mTORC1 and mTORC2. Because
mTOR besides protein translation affects various other cellular
processes including autophagy and metabolism a longer incubation
period was chosen to allow cellular processes to reach their new
equilibrium. Both inhibitors had similar effects on basal cellular
functions, such as reduced proliferation and oxygen consumption,
also comparable to previous results from mTORi treatment in glioma
cells (22,25), but divergent from effects on immune
cells, like T cells that have been shown to increase oxidative
phosphorylation under rapamycin treatment (57). Our transcriptome analysis revealed
a distinct GAM phenotype triggered by rapamycin-mediated mTORi,
which differed from the profile of temozolomide that-expectably for
a chemotherapeutic agent-mainly triggered cell death and cell cycle
related alterations. Interestingly, at the transcriptional level
rapamycin treatment led to an upregulation of pro-inflammatory
genes and key immunogenic pathways in the GAM co-culture setting
(for example in C20 and HMC3 Hallmark_TNFA_SIGNALING_VIA NFKB) as
well as more general in the GAM and MG setting (for example in C20
the Hallmark_IL6_JAK_STAT3, summarizing the transcriptional
response driven by IL-6 signaling via the JAK/STAT3 pathway), but
also exclusively in the C20 MG mono-culture setting (for example
Hallmark_INTERFERON response genesets). Of note, there was a
substantial overlap in the top regulated genes of C20 and HMC3
cells as well as in the differential gene expression and GSEA
analyses of both cell lines. The overall pro-inflammatory effect of
mTOR inhibition on the GAM and MG profile was supported by protein
level data, which revealed an increase in pro-inflammatory
cytokines following mTORi treatment with rapamycin and torin2
treatment. On protein level, the strongest and most complex effects
were observed in the C20 GAM setting treated with torin2, where
many pro-inflammatory proteins were upregulated. Taken together,
the torin2-induced microglial profile in especially C20 GAM, and
less pronounced C20 MG, indicates an activated, mostly
pro-inflammatory microglial state important for immune cell
recruitment (via chemokines) and modulation of the immune
microenvironment (via for example IL-1β, TNF-α, IFN-γ, but also
IL-10, IL-1ra, Serpin E1, MIF). C20 GAM were characterized by the
expression of chemotactic chemokines (CCL1/I-309, MIP-1α (CCL3),
CCL5/RANTES, CXCL1/GROα, CXCL11/I-TAC or CXCL12/SDF-1),
co-stimulatory/immune regulation ligands (CD40 Ligand/TNFSF5,
TREM-1), colony-stimulating growth factors (G-CSF and GM-CSF), type
II cytokines/interferon (IFN-γ), pro-inflammatory interleukins
(IL-1α, IL-6, IL-8, IL-12p70, IL-17A, IL-17E, IL-18, IL-21, IL-27,
IL-32α), interleukins linked to T cell differentiation (IL-13,
IL-16), regulatory or mixed interleukins (IL-1ra (IL-1F3), IL-10),
pro-inflammatory mediators linked to invasion and migration (MIF,
Serpin E1 (PAI-1) as well as TNF-α as a central mediator of
inflammation. Beyond this strong torin2-induced upregulation of
pro-inflammatory cytokines in the C20 GAM co-culture setting,
torin2 also induced several, though not all, pro-inflammatory
cytokines in the C20 MG mono-culture. In contrast, rapamycin showed
a partially divergent effect in the C20 GAM co-culture setting
compared to the C20 MG mono-culture setting: Despite a generally
pro-inflammatory signature (e.g., IL-6 and IL-8 upregulation),
rapamycin-treated C20 GAM also displayed a reduced expression of
several cytokines compared to the vehicle control, suggesting a
dampened expression of some cytokines under tumor cell influence.
This divergence between C20 MG mono- and GAM co-cultures was also
apparent in the transcriptomic data, with interferon α/γ response
genes upregulated only in mono-cultures. Notably, cytokines reduced
by rapamycin in C20 GAM, such as ICAM-1 and CD40L, are
interferon-associated, therefore supporting concordant
transcriptomic and proteomic changes. Also, the rapamycin-induced
activation of the Hallmark_IL6_JAK_STAT3_signaling pathway in C20
GAM and MG was supported by increased IL-6 and IL-8 protein levels.
However, some immunogenic pathways enriched at the transcriptomic
level did not show matching protein changes under rapamycin, while
related cytokines such as TNF-α and IFN-γ were detected in GAM
and/or MG after torin2 treatment. Interestingly, in our in
vitro model, MIF exhibited high baseline levels in both MG and
GAM of C20 and HMC3, even under untreated (vehicle) controls and
mTOR inhibition further increased MIF expression in the HMC3 GAM
co-culture setting as well as the C20 microglia mono-culture and
GAM co-culture setting. In HMC3 GAM, rapamycin appeared to exert
even stronger effects than torin2 on the cytokines MIF and Serpin
E1/PAI-1. In contrast, in C20 GAM, torin2 led to a marked
upregulation of both cytokines compared to control conditions.
However, rapamycin treatment in C20 GAM showed lower levels of
Serpin E1 and relatively unchanged MIF expression. Notably,
elevated levels of GAM subtype expressing the MIF receptor CD74
were associated with prolonged OS in patients with IDH-wildtype GB
(12). In this regard, it is
important to mention that the dichotomic categorization of
macrophages as either pro-tumor M1 or anti-tumor M2 (58) has been challenged in microglia and
especially in the brain tumor immune microenvironment. Over the
past decade, complex GAM phenotypes with simultaneous expression of
pro- and anti-inflammatory cytokines have been identified and
extensively studied (8–13). Overall, our data suggest that
torin2 more effectively modulates the inflammatory GAM and MG
phenotype than rapamycin, which may have implications for the use
of its derivatives, such as temsirolimus, currently under
investigation in the N2M2 trial (28).
Pro-inflammatory effects of mTOR inhibition in GAM
could be highly relevant, considering the increasing importance of
immunotherapeutic approaches in GB treatment (59–62)
that may be more effective in a pro-inflammatory and
anti-tumorigenic state of the innate GB microenvironment. However,
despite the intriguing findings in our GAM model that provided a
consistent and standardized experimental framework, our study is
limited by its in vitro nature and the use of immortalized
microglia cell lines. Both the C20 and the HMC3 cell line display
overall high similarities but also show distinct context-dependent
differences and therefore offer distinct advantages and limitations
for studying various aspects of microglial biology that researchers
should be aware of. For example, a recent comparative study
analyzing morphology, proteome, and secretome of HMC3 and C20
revealed both shared and distinct responses to inflammatory stimuli
(LPS or IFN-γ). While the baseline proteome of HMC3 was described
as more transcriptionally and metabolically active, the C20
proteome was interpreted as displaying a higher phagocytic
capacity. Upon inflammatory stimulation, HMC3 activated immune and
metabolic pathways, whereas C20 activated mitochondrial besides
immune pathways. Both cell lines secreted IL-6 under LPS treatment
(63). For our experimental
setting in the context of GAM, we considered the newer C20 line,
derived from adult human cortical microglia via magnetic cell
sorting, a more physiologically suitable model than the HMC3 cell
line, derived from human embryonic microglial cells and modified
via SV40-dependent immortalization. Therefore, the HMC3 cell line
was primarily used as a secondary validation model to support the
reproducibility of key findings. The C20 microglia cell line showed
a broader and more robust response to the mTOR inhibitors, whereas
the effects observed in HMC3 cells were less pronounced but
remained largely consistent with those seen in C20 cells. For
example, in the cytokine expression analysis torin2 treatment of
C20 cells (co-cultured with GB cells) yielded 30 different
cytokines while in HMC3 cells only two of the 36 covered cytokines
of the assay were regulated. Although other genetic models
(43) support our findings,
potential off-target effects of mTOR inhibitors cannot be fully
excluded and represent a limitation of our experimental setting. In
this regard, rapamycin is considered an uncommonly specific
inhibitor due to its association with the intracellular adaptor
FKBP12 which then allosterically inhibits mTORC1. Torin2 was
developed as an ATP-competitive inhibitor and off-target effects
are more likely. Torin2 has been shown to potentially interfere
also with signaling from phosphoinositide 3-kinase (PI3K) however
with an approximately 800-fold lesser selectivity than for cellular
mTOR. Additionally, torin2 can interfere with signaling from the
kinases ATM, ATR and DNA-PK, however, again with reduced
selectivity in comparison to mTOR (64). Thus, while the major effects of
torin2 observed in our study are most likely due to on-target mTOR
inhibition, some minor contribution of other kinases cannot be
ruled out. Also, treatment durations in our study were chosen to
approximate steady-state cellular adaptation and mimic continuous
exposure to the substances (21,25)
. Nonetheless, shorter or extended treatment periods, not assessed
here, may provide further mechanistic insights. Therefore, future
studies should incorporate genetic models and rescue experiments as
well as a broader variety of treatment durations to confirm the
specificity of the observed effects. Dumas et al (43) supported their preclinical models
employing an in silico analysis in which they could
demonstrate a correlation of enhanced mTOR signaling in
GAM-microglia with reduced effector immune cell infiltration.
Unfortunately, a similar approach was not feasible in our
experimental setting due to a lack of GAM-microglia specific
transcriptome data in publicly available datasets of human GB
patients as well as no in vivo datasets of human GB samples
under mTORi treatment.
Given the recent report on a potential therapeutic
activity of temsirolimus in mTOR-activated GB in the N2M2 trial
(65), human GB tissue samples of
responders vs. non-responders as well as of recurrent tumors after
mTORi treatment might become available in the near future. The
analysis of such samples with a focus on tumor-intrinsic and
microenvironmental features, particularly GAM, would represent an
ideal setting to validate both our in vitro findings and the
effects observed in animal models (43). Ideally, such analyses could be
incorporated into future prospective studies.
In conclusion, our findings support targeting of
mTOR signaling in GAM to promote a favorable state within the GB
microenvironment as a therapeutic approach. Notably, innovative
techniques for even a cell-type specific delivery of therapeutic
agents are currently under development (66). Furthermore, our results stress the
importance of a comprehensive understanding of therapy effects in
the GB microenvironment which is essential for optimizing the
design of treatment combinations and identifying specific patient
subgroups that are more likely to benefit from both established and
novel targeted therapies. Given that mTORC1 activation in bulk
tumor tissue is estimated in approximately 35% of cases (28,32),
a significant proportion of GB patients might be candidates for
mTOR inhibitor therapy. Eagerly awaited initial results of the N2M2
trial reported a benefit from treatment with mTOR inhibition in
mTOR-activated GBs (65)
emphasizing the clinical need for a deeper understanding of
mTOR-mediated effects in the GB immune microenvironment.
Supplementary Material
Supporting Data
Acknowledgements
The authors would like to thank Mrs. Tatjana
Starzetz (Institute of Neurology, Edinger-Institute, Frankfurt,
Germany), for their technical support in performing the
immunocytochemistry stainings.
Funding
Funding was provided by the Mildred Scheel Career Center
Frankfurt (German Cancer Aid Foundation) and the Goethe University
(Frankfurt Research Funding). In addition, the Dr. Senckenberg
Institute of Neurooncology is supported by the Dr. Senckenberg
Foundation.
Availability of data and materials
Bulk RNA sequencing data have been deposited to the
NCBI Gene Expression Omnibus and can be accessed via accession no.
GSE242829 (https://www.ncbi.nlm.nih.gov/geo/query/acc.cgi?acc=GSE242829).
The rest of the data generated in the present study may be
requested from the corresponding author
Authors' contributions
PSZ, JPS, PNH, MWR conceived and designed the study.
PSZ, MS, JS, JBW, NIL, BS, BR, KJW, ALL, AB, KHP, LS, JPS, MHM, PNH
and MWR acquired and analyzed the data. PSZ and MS confirm the
authenticity of all the raw data. PSZ, MS, JPS, MHM, PNH and MWR
drafted the manuscript. All authors read, reviewed and edited the
manuscript and approved the final version.
Ethics approval and consent to
participate
Not applicable.
Patient consent for publication
Not applicable.
Competing interests
JPS has received honoraria for lectures, advisory
board participation, consulting or travel grants from Abbvie,
Roche, Boehringer, Bristol-Myers Squibb, Medac, Mundipharma,
Servier and UCB. MHM is meanwhile an employee of Sanofi. MWR has
received a research grant from UCB as well as honoraria for
advisory board participation from Alexion and Servier. PSZ, MS, JS,
NIL, JBW, BS, BR, KJW, ALL, AB, KHP, LS and PNH report no
disclosures relevant to the manuscript.
Authors' information
ORCiD: Pia S. Zeiner, 0000-0001-6626-9211; Michael
W. Ronellenfitsch, 0000-0002-1402-6290.
References
|
1
|
Capper D, Jones DTW, Sill M, Hovestadt V,
Schrimpf D, Sturm D, Koelsche C, Sahm F, Chavez L, Reuss DE, et al:
DNA methylation-based classification of central nervous system
tumours. Nature. 555:469–474. 2018. View Article : Google Scholar : PubMed/NCBI
|
|
2
|
Mandel JJ, Yust-Katz S, Patel AJ, Cachia
D, Liu D, Park M, Yuan Y, Kent TA and de Groot JF: Inability of
positive phase II clinical trials of investigational treatments to
subsequently predict positive phase III clinical trials in
glioblastoma. Neuro Oncol. 20:113–122. 2018. View Article : Google Scholar : PubMed/NCBI
|
|
3
|
Ronellenfitsch MW, Steinbach JP and Wick
W: Epidermal growth factor receptor and mammalian target of
rapamycin as therapeutic targets in malignant glioma: Current
clinical status and perspectives. Target Oncol. 5:183–191. 2010.
View Article : Google Scholar : PubMed/NCBI
|
|
4
|
Stupp R, Mason WP, van Den Bent MJ, Weller
M, Fisher B, Taphoorn MJ, Belanger K, Brandes AA, Marosi C, Bogdahn
U, et al: Radiotherapy plus concomitant and adjuvant temozolomide
for glioblastoma. New Engl J Med. 352:987–996. 2005. View Article : Google Scholar : PubMed/NCBI
|
|
5
|
Bowman RL, Klemm F, Akkari L, Pyonteck SM,
Sevenich L, Quail DF, Dhara S, Simpson K, Gardner EE,
Iacobuzio-Donahue CA, et al: Macrophage ontogeny underlies
differences in tumor-specific education in brain malignancies. Cell
Rep. 17:2445–2459. 2016. View Article : Google Scholar : PubMed/NCBI
|
|
6
|
Klemm F, Maas RR, Bowman RL, Kornete M,
Soukup K, Nassiri S, Brouland JP, Iacobuzio-Donahue CA, Brennan C,
Tabar V, et al: Interrogation of the microenvironmental landscape
in brain tumors reveals disease-specific alterations of immune
cells. Cell. 181:1643–1660. 2020. View Article : Google Scholar : PubMed/NCBI
|
|
7
|
Friebel E, Kapolou K, Unger S, Núñez NG,
Utz S, Rushing EJ, Regli L, Weller M, Greter M, Tugues S, et al:
Single-cell mapping of human brain cancer reveals tumor-specific
instruction of tissue-invading leukocytes. Cell. 181:1626–1642.
2020. View Article : Google Scholar : PubMed/NCBI
|
|
8
|
Gabrusiewicz K, Rodriguez B, Wei J,
Hashimoto Y, Healy LM, Maiti SN, Thomas G, Zhou S, Wang Q, Elakkad
A, et al: Glioblastoma-infiltrated innate immune cells resemble M0
macrophage phenotype. JCI Insight. 1:e858412016. View Article : Google Scholar : PubMed/NCBI
|
|
9
|
Selenica MLB, Alvarez JA, Nash KR, Lee DC,
Cao C, Lin X, Reid P, Mouton PR, Morgan D and Gordon M: Diverse
activation of microglia by chemokine (C-C motif) ligand 2
overexpression in brain. J Neuroinflammation. 10:8562013.
View Article : Google Scholar : PubMed/NCBI
|
|
10
|
Stables MJ, Shah S, Camon EB, Lovering RC,
Newson J, Bystrom J, Farrow S and Gilroy DW: Transcriptomic
analyses of murine resolution-phase macrophages. Blood.
118:e192–e208. 2011. View Article : Google Scholar : PubMed/NCBI
|
|
11
|
Szulzewsky F, Pelz A, Feng X, Synowitz M,
Markovic D, Langmann T, Holtman IR, Wang X, Eggen BJ, Boddeke HW,
et al: Glioma-associated microglia/macrophages display an
expression profile different from M1 and M2 polarization and highly
express Gpnmb and Spp1. PLoS One. 10:e01166442015. View Article : Google Scholar : PubMed/NCBI
|
|
12
|
Zeiner PS, Preusse C, Blank AE, Zachskorn
C, Baumgarten P, Caspary L, Braczynski AK, Weissenberger J, Bratzke
H, Reiß S, et al: MIF receptor CD74 is restricted to
microglia/macrophages, associated with a M1-polarized immune milieu
and prolonged patient survival in gliomas. Brain Pathol.
25:491–504. 2015. View Article : Google Scholar : PubMed/NCBI
|
|
13
|
Keane L, Cheray M, Blomgren K and Joseph
B: Multifaceted microglia-key players in primary brain tumour
heterogeneity. Nat Rev Neurol. 17:243–259. 2021. View Article : Google Scholar : PubMed/NCBI
|
|
14
|
Gieryng A, Pszczolkowska D, Walentynowicz
KA, Rajan WD and Kaminska B: Immune microenvironment of gliomas.
Lab Invest. 97:498–518. 2017. View Article : Google Scholar : PubMed/NCBI
|
|
15
|
Kennedy BC, Showers CR, Anderson DE,
Anderson L, Canoll P, Bruce JN and Anderson RCE: Tumor-associated
macrophages in glioma: Friend or foe? J Oncol. 2013:4869122013.
View Article : Google Scholar : PubMed/NCBI
|
|
16
|
Zeiner PS, Preusse C, Golebiewska A, Zinke
J, Iriondo A, Muller A, Kaoma T, Filipski K, Müller-Eschner M,
Bernatz S, et al: Distribution and prognostic impact of
microglia/macrophage subpopulations in gliomas. Brain Pathol.
29:513–529. 2019. View Article : Google Scholar : PubMed/NCBI
|
|
17
|
Kaffes I, Szulzewsky F, Chen Z, Herting
CJ, Gabanic B, Vega JE, Shelton J, Switchenko JM, Ross JL, McSwain
LF, et al: Human mesenchymal glioblastomas are characterized by an
increased immune cell presence compared to proneural and classical
tumors. Oncoimmunology. 8:e16553602019. View Article : Google Scholar : PubMed/NCBI
|
|
18
|
Klemm F, Möckl A, Salamero-Boix A,
Alekseeva T, Schäffer A, Schulz M, Niesel K, Maas RR, Groth M, Elie
BT, et al: Compensatory CSF2-driven macrophage activation promotes
adaptive resistance to CSF1R inhibition in breast-to-brain
metastasis. Nat Cancer. 2:1086–1101. 2021. View Article : Google Scholar : PubMed/NCBI
|
|
19
|
Niesel K, Schulz M, Anthes J, Alekseeva T,
Macas J, Salamero-Boix A, Möckl A, Oberwahrenbrock T, Lolies M,
Stein S, et al: The immune suppressive microenvironment affects
efficacy of radio-immunotherapy in brain metastasis. EMBO Mol Med.
13:e134122021. View Article : Google Scholar : PubMed/NCBI
|
|
20
|
Cancer Genome Atlas Research Network, .
Comprehensive genomic characterization defines human glioblastoma
genes and core pathways. Nature. 455:1061–1068. 2008. View Article : Google Scholar : PubMed/NCBI
|
|
21
|
Ronellenfitsch MW, Brucker DP, Burger MC,
Wolking S, Tritschler F, Rieger J, Wick W, Weller M and Steinbach
JP: Antagonism of the mammalian target of rapamycin selectively
mediates metabolic effects of epidermal growth factor receptor
inhibition and protects human malignant glioma cells from
hypoxia-induced cell death. Brain. 132:1509–1522. 2009. View Article : Google Scholar : PubMed/NCBI
|
|
22
|
Thiepold AL, Lorenz NI, Foltyn M, Engel
AL, Divé I, Urban H, Heller S, Bruns I, Hofmann U, Dröse S, et al:
Mammalian target of rapamycin complex 1 activation sensitizes human
glioma cells to hypoxia-induced cell death. Brain. 140:2623–2638.
2017. View Article : Google Scholar : PubMed/NCBI
|
|
23
|
Liu GY and Sabatini DM: mTOR at the nexus
of nutrition, growth, ageing and disease. Nat Rev Mol Cell Biol.
21:183–203. 2020. View Article : Google Scholar : PubMed/NCBI
|
|
24
|
García-Martínez JM and Alessi DR: mTOR
complex 2 (mTORC2) controls hydrophobic motif phosphorylation and
activation of serum- and glucocorticoid-induced protein kinase 1
(SGK1). Biochem J. 416:375–385. 2008. View Article : Google Scholar : PubMed/NCBI
|
|
25
|
Heinzen D, Divé I, Lorenz NI, Luger AL,
Steinbach JP and Ronellenfitsch MW: Second generation mTOR
inhibitors as a double-edged sword in malignant glioma treatment.
Int J Mol Sci. 20:44742019. View Article : Google Scholar : PubMed/NCBI
|
|
26
|
Ronellenfitsch MW, Zeiner PS, Mittelbronn
M, Urban H, Pietsch T, Reuter D, Senft C, Steinbach JP, Westphal M
and Harter PN: Akt and mTORC1 signaling as predictive biomarkers
for the EGFR antibody nimotuzumab in glioblastoma. Acta Neuropathol
Commun. 6:812018. View Article : Google Scholar : PubMed/NCBI
|
|
27
|
Chinnaiyan P, Won M, Wen PY, Rojiani AM,
Werner-Wasik M, Shih HA, Ashby LS, Yu HH, Stieber VW, Malone SC, et
al: A randomized phase II study of everolimus in combination with
chemoradiation in newly diagnosed glioblastoma: Results of NRG
oncology RTOG 0913. Neuro Oncol. 20:666–673. 2018. View Article : Google Scholar : PubMed/NCBI
|
|
28
|
Wick W, Dettmer S, Berberich A, Kessler T,
Karapanagiotou-Schenkel I, Wick A, Winkler F, Pfaff E, Brors B,
Debus J, et al: N2M2 (NOA-20) phase I/II trial of molecularly
matched targeted therapies plus radiotherapy in patients with newly
diagnosed non-MGMT hypermethylated glioblastoma. Neuro Oncol.
21:95–105. 2019. View Article : Google Scholar : PubMed/NCBI
|
|
29
|
Alexander BM, Ba S, Berger MS, Berry DA,
Cavenee WK, Chang SM, Cloughesy TF, Jiang T, Khasraw M, Li W, et
al: Adaptive global innovative learning environment for
glioblastoma: GBM AGILE. Clin Cancer Res. 24:737–743. 2018.
View Article : Google Scholar : PubMed/NCBI
|
|
30
|
Divé I, Klann K, Michaelis JB, Heinzen D,
Steinbach JP, Münch C and Ronellenfitsch MW: Inhibition of mTOR
signaling protects human glioma cells from hypoxia-induced cell
death in an autophagy-independent manner. Cell Death Discov.
8:4092022. View Article : Google Scholar : PubMed/NCBI
|
|
31
|
Sauer B, Lorenz NI, Divé I, Klann K, Luger
AL, Urban H, Schröder JH, Steinbach JP, Münch C and Ronellenfitsch
MW: Mammalian target of rapamycin inhibition protects glioma cells
from temozolomide-induced cell death. Cell Death Discov. 10:82024.
View Article : Google Scholar : PubMed/NCBI
|
|
32
|
Wick W, Gorlia T, Bady P, Platten M, van
den Bent MJ, Taphoorn MJ, Steuve J, Brandes AA, Hamou MF, Wick A,
et al: Phase II study of radiotherapy and temsirolimus versus
radiochemotherapy with temozolomide in patients with newly
diagnosed glioblastoma without MGMT promoter hypermethylation
(EORTC 26082). Clin Cancer Res. 22:4797–4806. 2016. View Article : Google Scholar : PubMed/NCBI
|
|
33
|
Harter PN, Jennewein L, Baumgarten P,
Ilina E, Burger MC, Thiepold AL, Tichy J, Zörnig M, Senft C,
Steinbach JP, et al: Immunohistochemical assessment of
phosphorylated mTORC1-pathway proteins in human brain tumors. PLoS
One. 10:e01271232015. View Article : Google Scholar : PubMed/NCBI
|
|
34
|
Weichhart T, Hengstschläger M and Linke M:
Regulation of innate immune cell function by mTOR. Nat Rev Immunol.
15:599–614. 2015. View Article : Google Scholar : PubMed/NCBI
|
|
35
|
Weichhart T, Costantino G, Poglitsch M,
Rosner M, Zeyda M, Stuhlmeier KM, Kolbe T, Stulnig TM, Hörl WH,
Hengstschläger M, et al: The TSC-mTOR signaling pathway regulates
the innate inflammatory response. Immunity. 29:565–577. 2008.
View Article : Google Scholar : PubMed/NCBI
|
|
36
|
Soave DF, Miguel MP, Tomé FD, de Menezes
LB, Nagib PRA and Celes MRN: The fate of the tumor in the hands of
microenvironment: Role of TAMs and mTOR pathway. Mediators Inflamm.
2016:89105202016. View Article : Google Scholar : PubMed/NCBI
|
|
37
|
Li D, Wang C, Yao Y, Chen L, Liu G, Zhang
R, Liu Q, Shi FD and Hao J: mTORC1 pathway disruption ameliorates
brain inflammation following stroke via a shift in microglia
phenotype from M1 type to M2 type. FASEB J. 30:3388–3399. 2016.
View Article : Google Scholar : PubMed/NCBI
|
|
38
|
Xie L, Sun F, Wang J, Mao X, Xie L, Yang
SH, Su DM, Simpkins JW, Greenberg DA and Jin K: mTOR signaling
inhibition modulates macrophage/microglia-mediated
neuroinflammation and secondary injury via regulatory T cells after
focal ischemia. J Immunol. 192:6009–6019. 2014. View Article : Google Scholar : PubMed/NCBI
|
|
39
|
Keane L, Antignano I, Riechers SP,
Zollinger R, Dumas AA, Offermann N, Bernis ME, Russ J, Graelmann F,
McCormick PN, et al: mTOR-dependent translation amplifies microglia
priming in aging mice. J Clin Invest. 131:e1327272021. View Article : Google Scholar : PubMed/NCBI
|
|
40
|
Hu Y, Mai W, Chen L, Cao K, Zhang B, Zhang
Z, Liu Y, Lou H, Duan S and Gao Z: mTOR-mediated metabolic
reprogramming shapes distinct microglia functions in response to
lipopolysaccharide and ATP. Glia. 68:1031–1045. 2020. View Article : Google Scholar : PubMed/NCBI
|
|
41
|
Lisi L, Laudati E, Navarra P and dello
Russo C: The mTOR kinase inhibitors polarize glioma-activated
microglia to express a M1 phenotype. J Neuroinflammation.
11:1252014. View Article : Google Scholar : PubMed/NCBI
|
|
42
|
Lisi L, Ciotti GMP, Chiavari M,
Pizzoferrato M, Mangiola A, Kalinin S, Feinstein DL and Navarra P:
Phospho-mTOR expression in human glioblastoma microglia-macrophage
cells. Neurochem Int. 129:1044852019. View Article : Google Scholar : PubMed/NCBI
|
|
43
|
Dumas AA, Pomella N, Rosser G, Guglielmi
L, Vinel C, Millner TO, Rees J, Aley N, Sheer D, Wei J, et al:
Microglia promote glioblastoma via mTOR-mediated immunosuppression
of the tumour microenvironment. EMBO J. 39:e1037902020. View Article : Google Scholar : PubMed/NCBI
|
|
44
|
Garcia-Mesa Y, Jay TR, Checkley MA, Luttge
B, Dobrowolski C, Valadkhan S, Landreth GE, Karn J and
Alvarez-Carbonell D: Immortalization of primary microglia: A new
platform to study HIV regulation in the central nervous system. J
Neurovirol. 23:47–66. 2017. View Article : Google Scholar : PubMed/NCBI
|
|
45
|
Janabi N, Peudenier S, Héron B, Ng KH and
Tardieu M: Establishment of human microglial cell lines after
transfection of primary cultures of embryonic microglial cells with
the SV40 large T antigen. Neurosci Lett. 195:105–108. 1995.
View Article : Google Scholar : PubMed/NCBI
|
|
46
|
Dello Russo C, Cappoli N, Coletta I,
Mezzogori D, Paciello F, Pozzoli G, Navarra P and Battaglia A: The
human microglial HMC3 cell line: Where do we stand? A systematic
literature review. J Neuroinflammation. 15:2592018. View Article : Google Scholar : PubMed/NCBI
|
|
47
|
Studer A, de Tribolet N, Diserens AC,
Gaide AC, Matthieu JM, Carrel S and Stavrou D: Characterization of
four human malignant glioma cell lines. Acta Neuropathol.
66:208–217. 1985. View Article : Google Scholar : PubMed/NCBI
|
|
48
|
Wischhusen J, Naumann U, Ohgaki H,
Rastinejad F and Weller M: CP-31398, a novel p53-stabilizing agent,
induces p53-dependent and p53-independent glioma cell death.
Oncogene. 22:8233–8245. 2003. View Article : Google Scholar : PubMed/NCBI
|
|
49
|
Lorenz NI, Sittig ACM, Urban H, Luger AL,
Engel AL, Münch C, Steinbach JP and Ronellenfitsch MW: Activating
transcription factor 4 mediates adaptation of human glioblastoma
cells to hypoxia and temozolomide. Sci Rep. 11:141612021.
View Article : Google Scholar : PubMed/NCBI
|
|
50
|
Roth W, Fontana A, Trepel M, Reed JC,
Dichgans J and Weller M: Immunochemotherapy of malignant glioma:
Synergistic activity of CD95 ligand and chemotherapeutics. Cancer
Immunol Immunother. 44:55–63. 1997. View Article : Google Scholar : PubMed/NCBI
|
|
51
|
Steinbach JP, Wolburg H, Klumpp A, Probst
H and Weller M: Hypoxia-induced cell death in human malignant
glioma cells: Energy deprivation promotes decoupling of
mitochondrial cytochrome c release from caspase processing and
necrotic cell death. Cell Death Differ. 10:823–832. 2003.
View Article : Google Scholar : PubMed/NCBI
|
|
52
|
Schulz M, Michels B, Niesel K, Stein S,
Farin H, Rödel F and Sevenich L: Cellular and molecular changes of
brain metastases-associated myeloid cells during disease
progression and therapeutic response. iScience. 23:1011782020.
View Article : Google Scholar : PubMed/NCBI
|
|
53
|
Michels BE, Mosa MH, Grebbin BM, Yepes D,
Darvishi T, Hausmann J, Urlaub H, Zeuzem S, Kvasnicka HM, Oellerich
T and Farin HF: Human colon organoids reveal distinct physiologic
and oncogenic Wnt responses. J Exp Med. 216:704–720. 2019.
View Article : Google Scholar : PubMed/NCBI
|
|
54
|
Kim D, Pertea G, Trapnell C, Pimentel H,
Kelley R and Salzberg SL: TopHat2: Accurate alignment of
transcriptomes in the presence of insertions, deletions and gene
fusions. Genome Biol. 14:R362013. View Article : Google Scholar : PubMed/NCBI
|
|
55
|
Love MI, Huber W and Anders S: Moderated
estimation of fold change and dispersion for RNA-seq data with
DESeq2. Genome Biol. 15:5502014. View Article : Google Scholar : PubMed/NCBI
|
|
56
|
Westphal M, Heese O, Steinbach JP, Schnell
O, Schackert G, Mehdorn M, Schulz D, Simon M, Schlegel U, Senft C,
et al: A randomised, open label phase III trial with nimotuzumab,
an anti-epidermal growth factor receptor monoclonal antibody in the
treatment of newly diagnosed adult glioblastoma. Eur J Cancer.
51:522–532. 2015. View Article : Google Scholar : PubMed/NCBI
|
|
57
|
He S, Kato K, Jiang J, Wahl DR, Mineishi
S, Fisher EM, Murasko DM, Glick GD and Zhang Y: Characterization of
the metabolic phenotype of rapamycin-treated CD8+ T cells with
augmented ability to generate long-lasting memory cells. PLoS One.
6:e201072011. View Article : Google Scholar : PubMed/NCBI
|
|
58
|
Mills CD, Kincaid K, Alt JM, Heilman MJ
and Hill AM: M-1/M-2 macrophages and the Th1/Th2 paradigm. J
Immunol. 164:6166–6173. 2000. View Article : Google Scholar : PubMed/NCBI
|
|
59
|
Platten M, Bunse L, Wick A, Bunse T, Le
Cornet L, Harting I, Sahm F, Sanghvi K, Tan CL, Poschke I, et al: A
vaccine targeting mutant IDH1 in newly diagnosed glioma. Nature.
592:463–468. 2021. View Article : Google Scholar : PubMed/NCBI
|
|
60
|
Burger MC, Forster MT, Romanski A,
Straßheimer F, Macas J, Zeiner PS, Steidl E, Herkt S, Weber KJ,
Schupp J, et al: Intracranial injection of NK cells engineered with
a HER2-targeted chimeric antigen receptor in patients with
recurrent glioblastoma. Neuro Oncol. 25:2058–2071. 2023. View Article : Google Scholar : PubMed/NCBI
|
|
61
|
Omuro A, Brandes AA, Carpentier AF, Idbaih
A, Reardon DA, Cloughesy T, Sumrall A, Baehring J, van den Bent M,
Bähr O, et al: Radiotherapy combined with nivolumab or temozolomide
for newly diagnosed glioblastoma with unmethylated MGMT promoter:
An international randomized phase III trial. Neuro Oncol.
25:123–134. 2023. View Article : Google Scholar : PubMed/NCBI
|
|
62
|
Lim M, Weller M, Idbaih A, Steinbach J,
Finocchiaro G, Raval RR, Ansstas G, Baehring J, Taylor JW, Honnorat
J, et al: Phase III trial of chemoradiotherapy with temozolomide
plus nivolumab or placebo for newly diagnosed glioblastoma with
methylated MGMT promoter. Neuro Oncol. 24:1935–1949. 2022.
View Article : Google Scholar : PubMed/NCBI
|
|
63
|
Gunasegaran B, Krishnamurthy S, Chow SS,
Villanueva MD, Guller A, Ahn SB and Heng B: Comparative analysis of
HMC3 and C20 microglial cell lines reveals differential myeloid
characteristics and responses to immune stimuli. Immunology.
175:84–102. 2025. View Article : Google Scholar : PubMed/NCBI
|
|
64
|
Liu Q, Xu C, Kirubakaran S, Zhang X, Hur
W, Liu Y, Kwiatkowski NP, Wang J, Westover KD, Gao P, et al:
Characterization of Torin2, an ATP-competitive inhibitor of mTOR,
ATM, and ATR. Cancer Res. 73:2574–2586. 2013. View Article : Google Scholar : PubMed/NCBI
|
|
65
|
Wick W, Lanz LM, Wick A, Harting I,
Dettmer S, Suwala AK, Ketter R, Tabatabai G, Seliger-Behme C, Glas
M, et al: N2M2/NOA-20: Phase I/IIa umbrella trial of molecularly
matched targeted therapies plus radiotherapy in patients with newly
diagnosed glioblastoma without MGMT promoter hypermethylation. J
Clin Oncol. 42:20002024. View Article : Google Scholar
|
|
66
|
Strecker MI, Wlotzka K, Strassheimer F,
Roller B, Ludmirski G, König S, Röder J, Opitz C, Alekseeva T, Reul
J, et al: AAV-mediated gene transfer of a checkpoint inhibitor in
combination with HER2-targeted CAR-NK cells as experimental therapy
for glioblastoma. Oncoimmunology. 11:21275082022. View Article : Google Scholar : PubMed/NCBI
|