Introduction
Spinal cord injury (SCI) is a prevalent etiology of
central neuropathic pain (NP), with an estimated 40–70% of
individuals with SCI experiencing this condition (1,2). NP
represents a frequent and multifaceted secondary complication
associated with SCI (3). The
pathophysiological mechanisms underlying SCI-induced NP are
complex, encompassing neuroplastic changes within the central
nervous system, activation of immune cells, and the release of
inflammatory mediators and cytokines (4–6). The
manifestation of NP subsequent to SCI markedly influences patient
outcomes, imposing notable psychological and economic burdens
(2). Contemporary clinical
approaches for the management of NP resulting from SCI
predominantly encompass pharmacological interventions, including
antiepileptic drugs, antidepressants and opioids, alongside
neuromodulation techniques such as spinal cord stimulation,
transcranial magnetic stimulation (TMS) and transcranial
direct-current stimulation (tDCS) (7–9).
Nonetheless, the mechanisms underlying the initiation and
progression of NP post-SCI remain inadequately elucidated, and
therapeutic strategies to mitigate SCI-induced NP remain
insufficient.
Previous studies have shown that small molecules
from traditional Chinese medicine could positively impact various
diseases, with quercetin (Que) specifically exhibiting
pain-relieving effects in NP (10,11).
Animal models have demonstrated that Que can ease pain in a
dose-dependent manner (12–14).
Being a member of the flavonoid family, Que is found in fruits and
vegetables such as apples, grapes and onions, and possesses
antioxidant, anti-inflammatory, anti-aging and neuroprotective
qualities (15–18). Research has demonstrated that Que
can reduce oxidative stress and protect cells from
inflammation-related damage, thus enhancing its neuroprotective
properties (19,20). Although research on the impact of
Que on NP following SCI is limited, exploring its therapeutic
potential and understanding the mechanisms involved in the
interactions of Que with NP is important.
Consequently, an integrative analysis was performed
in the present study utilizing the largest available genome-wide
association study (GWAS) summary data on NP, employing the
summary-based Mendelian randomization (SMR) method. By conducting a
further examination of publicly accessible RNA sequencing datasets,
gene modules associated with SCI were identified. This methodology
enabled genes common to both SCI and NP to be identified.
Subsequently, by employing machine learning (ML) algorithms,
molecular biomarkers that were indicative of NP subsequent to SCI
were identified. In the present study, network pharmacology was
utilized to predict the potential targets of Que, followed by
molecular docking to assess the interaction between Que and these
target proteins. The resulting protein-ligand complexes were
further examined through molecular dynamics (MD) simulations to
identify viable therapeutic targets for SCI-induced NP. This
methodological approach offered novel insights and directions for
future research on the biological mechanisms of SCI-induced NP and
the development of targeted therapeutic strategies.
Materials and methods
Data acquisition and
preprocessing
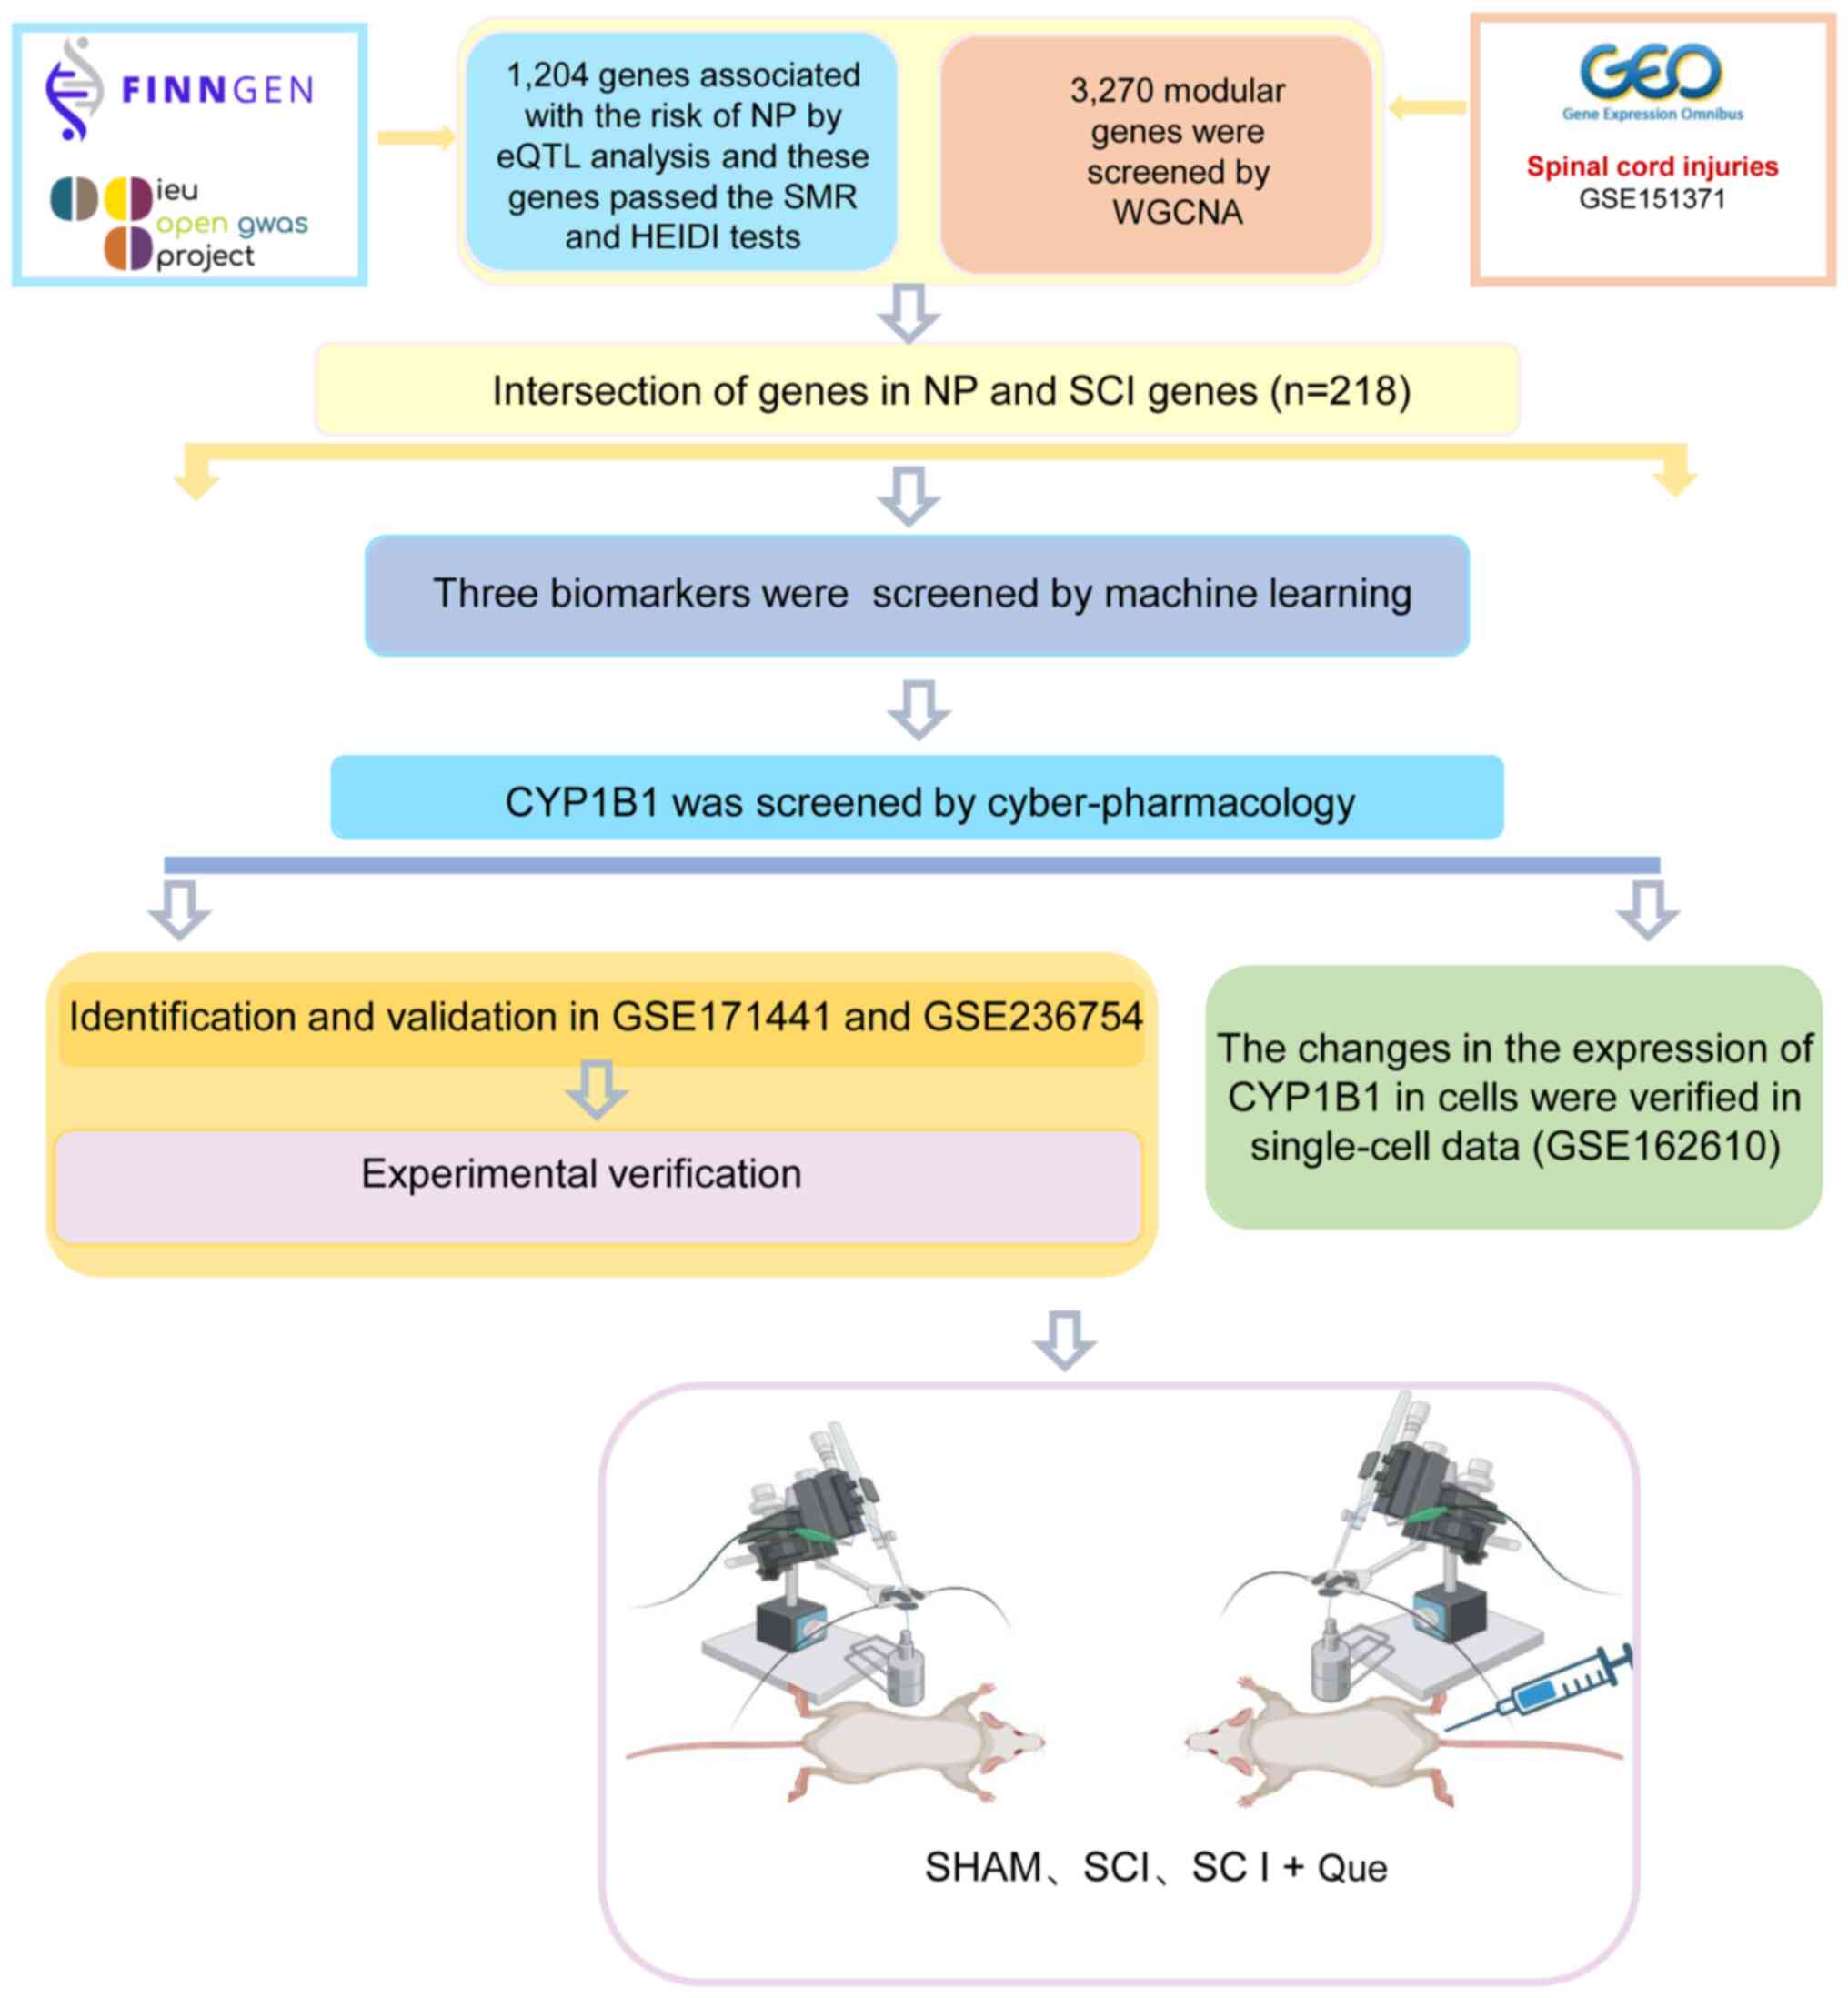
Fig. 1 illustrates
the design of the present study. The present study was centered on
trigeminal neuralgia (TN) and postherpetic neuralgia (PHN), two
conditions that exemplify NP (1).
The relevant datasets for these diseases were sourced from IEU
OPENGWAS and FINNGEN (21,22). The GWAS identifiers for these
datasets were finn-b-G6_POSTZOST and finn-b-G6_TRINEU, both of
which are accessible for public download. Pooled statistics of
blood expression quantitative trait locus (eQTL) were derived from
the EQTLGEN dataset, which predominantly comprised blood samples
from healthy European individuals. The EQTLGEN dataset included
expression data for 16,987 genes, with gene expression quantified
at the transcriptional level in peripheral blood (23).
A total of four publicly accessible transcriptome
datasets were procured from the Gene Expression Omnibus database
(https://www.ncbi.nlm.nih.gov/geo/).
These datasets included: i) A human SCI dataset (GSE151371), which
comprises blood samples from patients with SCI and healthy controls
(24); ii) a single-cell SCI
(ScSCI) dataset for mouse models (GSE162610) (25); iii) a mouse SCI model RNA dataset
(GSE171441) (26); and iv) an RNA
dataset from a mouse NP model using the spared nerve injury (SNI)
model (GSE236754) (27). The
downloaded raw RNA data were subjected to data quality control,
processing and normalization in R (version 4.2.1; R Foundation for
Statistical Computing; http://www.R-project.org/).
Screening of candidate genes
SMR and heterogeneity in dependent instruments
(HEIDI) tests detect polytropic associations
The SMR test was employed to examine the association
between exposure and outcome using instrumental variables (IVs),
typically SNPs, as previously described (28). In summary, the study utilized
cis-acting eQTL (cis-eQTL) genetic variation as an IV, with gene
expression serving as the exposure factor, and PHN and TN as the
outcomes. The Mendelian randomization (MR) approach was employed to
estimate the effect of gene expression on NP. This estimation was
derived by calculating the ratio of the estimated effect of
cis-eQTL genetic variation on NP to its estimated effect on gene
expression. This methodology was applied to integrate GWAS and eQTL
pooled statistics, thereby facilitating the examination of
pleiotropic associations between gene expression and NP. In the
present SMR analysis, the main SNP selection criteria were based on
the data processing procedures outlined on the official SMR website
(https://yanglab.westlake.edu.cn/software/smr/#Overview).
After downloading the data, the first step was to exclude SNPs with
missing values according to these procedures, and the filtered data
were then subjected to SMR analysis. The default settings in SMR
were utilized, which included selecting SNPs within a 2 Mb distance
from each individual probe as cis-eQTL, applying a PeQTL threshold
of <5×10⁻⁸ and excluding SNPs exhibiting very strong
linkage disequilibrium (r2>0.9) with the
top-associated eQTL. The heterogeneity in dependent instruments
(HEIDI) test was conducted to assess the presence of cascading
relationships within the associations (28). A PHEIDI-value >0.05
indicated that the original hypothesis was valid, suggesting the
existence of a single causal variant among the observed
associations. The F-statistic in the SMR analysis was computed
using the formula
(beQt1/seeQt1)2.
IVs exhibiting an F-statistic >10 were chosen for further
evaluation. The SMR results, encompassing trajectory plots and
effect plots, are accessible through the SMR webpage (https://yanglab.westlake.edu.cn/software/smr/#Overview).
Genes related to TN and PHN were screened by SMR, and genes related
to NP were identified by intersection.
Weighted gene co-expression network
analysis (WGCNA) and modular gene selection
WGCNA is a systems biology approach employed to
identify modules of highly correlated genes and to compute module
membership measures. Utilizing the R package ‘WGCNA’ (version
1.73), co-expression networks were constructed and filtered based
on an R2 value >0.85. The appropriate ‘soft’
thresholding power (β), ranging from 1 to 20, was selected to
ensure that the constructed co-expression networks conformed more
closely to the characteristics of scale-free networks. Finally,
utilizing Pearson's correlation coefficient and the P-value for
each module trait, the network of SCI co-expression modules was
derived and visualized to identify the shared genes within its key
modules (29). Additionally, an
online Venn diagram tool was employed to determine the intersecting
genes between SCI and NP (30).
Functional enrichment analysis
Both the Gene Ontology (GO) and Kyoto Encyclopedia
of Genes and Genomes (KEGG) databases are accessible for the
investigation of gene functions (31,32).
To further investigate the role of genes implicated in NP following
SCI, an online Venn diagram tool was utilized to identify
intersecting genes between NP-related candidate genes and key
module genes associated with SCI. Subsequently, GO and KEGG
functional enrichment analyses were conducted using the
‘clusterProfiler’ package (version 4.14.6), with a significance
threshold set at P<0.05. Both the visualization of enrichment
analysis results and the generation of the Upset plot were
performed using the Hiplot (ORG) (https://hiplot.org) (33).
Protein-protein interaction (PPI)
network construction and identification of hub genes
Based on the identified intersecting genes, a
minimum interaction score of 0.400 was established using the STRING
database (version 12.0) to investigate protein-coding gene
interactions (34). Subsequently,
the visualization of PPI networks was performed using Cytoscape
(version 3.9.1) (35). To evaluate
and identify hub genes, seven commonly used algorithms, ‘maximal
clique centrality’, ‘measurement coefficient network’, ‘degree’,
‘embedding pathway components’, ‘closeness’, ‘radiality’ and
‘stress’, were employed using the cytoHubba plug-in in
Cytoscape.
Immune infiltration analysis
The immune infiltration analysis utilized single
sample gene set enrichment analysis to assess the relative
abundance of specific immune cell types in each sample. Enrichment
scores for a reference set of 28 unique immune cell types were
calculated to reveal infiltration patterns across the samples
(36,37). The associations between genes and
immune cells were subsequently visualized utilizing the ‘ggplot2’
(version 3.5.1; http://ggplot2.tidyverse.org/) and ‘ggExtra’ (version
0.10.1; http://cran.r-project.org/package=ggExtra) R packages,
facilitating a comprehensive depiction of gene-immune cell
relationships.
Identification of disease marker genes
through ML
Gene screening for disease diagnosis can be enhanced
through the combined application of ML algorithms, including least
absolute shrinkage and selection operator (LASSO), support vector
machine recursive feature elimination (SVM-RFE) and random forest
(RF) algorithms, for feature selection. LASSO is a regression
technique that selects variables to enhance both the predictive
accuracy and interpretability of statistical models (38). In the current investigation, a
10-fold cross-validation approach was employed, guided by the
‘lambda.min’ criterion, to derive the final gene set utilizing the
‘lambda.min’ value. SVM-RFE, an ML algorithm, was employed for gene
selection by ordering features using a linear support vector
machine (SVM) (39). The RF
algorithm is classified under supervised learning models and
functions as an ensemble tree-based ML tool that enhances
prediction accuracy by averaging values from a subset of each tree
(40). In the RF algorithm, the
total ‘ntree’ value was configured to be 500. Additionally, the
Boruta feature selection significance threshold was established at
a P-value of 0.01, with a maximum of 300 iterations. Furthermore,
the proportion of training datasets for the purpose of database
segmentation was determined through the utilization of the
‘createDataPartition’ function. SVM-RFE, LASSO regression and RF
analyses were conducted utilizing the R function packages ‘glmnet’
(version 4.1–8) (41),
‘randomForest’ (version 4.7–1.2) (42) and ‘e1071’ (version 1.7–16)
(43). Genes identified through
SVM, LASSO and RF analyses were deemed to be potential key markers
for SCI diagnosis. To assess the association between candidate hub
genes implicated in SCI diagnosis and NP, the Comparative
Toxicogenomics Database (CTD) (https://ctdbase.org/) was utilized to extract genes
associated with NP importance scores. Consequently, the hub genes
most pertinent to NP in the context of SCI diagnosis were
identified.
Identification of SCI subtypes was performed by
non-negative matrix factorization (NMF) clustering of pain-related
genes. The NMF algorithm is an innovative ML algorithm that
identifies and clusters molecular function patterns from
high-throughput data (44). The
NMF approach was applied to samples using the ‘NMF’ R package
(version 0.26) (45) to identify
subtypes of SCI within various NP-related gene expression profiles
derived from SMR.
Column chart construction and
assessment of receiver operating characteristic (ROC) curve
The construction of column graphs is important in
the clinical diagnosis of SCI. In the present study, the ‘rms’ R
package (version 7.0–0; http://cran.r-project.org/package=rms) was utilized to
generate a column chart based on candidate genes. The ‘Points’
denote the scores assigned to each candidate gene, while the ‘Total
Points’ represent the aggregate score of all candidate genes.
Subsequently, the ‘pROC’ R package (version 1.18.5; http://github.com/xrobin/pROC) was employed to
construct a ROC curve (46), which
was used to evaluate the diagnostic efficacy of the candidate genes
in SCI diagnosis. The diagnostic value was quantified by
calculating the area under the curve (AUC) along with its 95% CI.
Typically, an AUC >0.7 is regarded as an acceptable diagnostic
threshold.
Network pharmacology
Screening for potential targets of Que
The Simplified Molecular Input Line Entry System
notation for Que constituents was obtained from the PubChem
database (https://pubchem.ncbi.nlm.nih.gov/) and entered into
the Swiss Target Prediction tool to identify potential targets with
a probability of ≥0.4 (http://www.swisstargetprediction.ch/) (47).
Molecular docking
CYP1B1 was selected as the receptor for Que. The
molecular structure and ‘MOL2’ format of Que were obtained from the
Chinese Traditional Medicine Systems Pharmacology database
(https://old.tcmsp-e.com/tcmsp.php),
while the protein structure and Protein Data Bank (PDB) format of
CYP1B1 were obtained from the PDB database (https://www.rcsb.org/). Finally,
ligand-receptor-related file formats were imported into the
AutoDock software (version 1.5.7) to perform docking, thereby
generating docking fractions and facilitating the analysis of
protein active sites (48,49). Subsequently, these results were
imported into the PYMOL software (version 2.6.0a0; http://pymol.org/) for the visualization, display and
detailed analysis of molecular structures (50).
MD simulation
MD simulations of the Que-CYP1B1 complex were
conducted utilizing the Groningen machine for chemical simulations
software version 2020.6 (https://www.gromacs.org/). The simulations employed
the ‘AMBER99SB’ force field in conjunction with the simple point
charge water model, maintaining the system at a temperature of 300
K over a duration of 40 nsec. Initially, energy minimization was
achieved through the application of the conjugate gradient method,
which was followed by a canonical ensemble equilibration step to
ensure system stabilization. The MD simulation was then executed to
completion. The resulting simulation data were analyzed and
visualized using Qtgrace software (version 0.2.6; http://sourceforge.net/projects/qtgrace/).
Validation
Validation of external datasets pertaining to
diagnostic hub genes and single-cell sequencing analysis
The mRNA expression of the identified NP-associated
key SCI diagnosis genes was validated using the GSE171441 and
GSE236754 datasets. The GSE171441 dataset comprised 3 control
samples and 3 SCI samples, while the GSE236754 dataset included 12
control samples and 12 SNI samples. An unpaired t-test-test was
used to compare control and trial group data, and P<0.05 was
considered to indicate a statistically significant difference.
Additionally, to identify potential targets of Que and assess the
relevance of NP-related hub genes and cells in the context of SCI,
the single-cell GSE162610 dataset was analyzed using the ‘Seurat’ R
package (version 5.2.1; http://satijalab.org/seurat/) (51). Initially, the
‘PercentageFeatureSet’ function was employed to calculate the
proportion of mitochondrial genes in each cell. The cells were then
filtered by creating separate objects for each sample, retaining
only those cells with <10% mitochondrial gene content and >50
gene expression counts. Subsequently, multiple samples were
integrated using canonical correlation analysis (52,53).
A total of 3,000 highly variable genes were selected for analysis,
and appropriate principal component values and resolution
parameters were chosen to obtain cell clusters, which were
subsequently visualized using the ‘uwot R package (version 0.2.3;
http://cran.r-project.org/package=uwot). Subsequently,
the analyzed clusters were annotated by integrating the results of
the corresponding marker genes from the PanglaoDB database
(54) and the CellMarker database
(55). Finally, the ‘ggplot2’ R
package (version 3.5.1; http://ggplot2.tidyverse.org/) was employed for the
subsequent visualization of the single-cell sequencing analysis
results.
Construction of the SCI model
The study was in compliance with the Guidelines for
the Care and Use of Experimental Animals (https://portal.smu.edu.cn/sydwzx/fgbz/3.htm) and
approved by the Ethics Committee of the Third Affiliated Hospital
of Southern Medical University and the Animal Experimental
Committee of the Daoke Pharmaceutical Technology (Guangdong) Co.,
Ltd. (approval no. IACUC-DK-2024-04-10-01). Male C57BL6J mice (6–8
weeks old; mean body weight, 25 g; Huaxia Cage Biotechnology Co.,
Ltd.), underwent standardized rearing in an SPF animal house
(temperature, 22±2°C; relative humidity, 55±5%; 12-h light-dark
cycle) with daily monitoring of environmental parameters,
replacement of litter and replenishment of food and water every
48–72 h. The mice were randomly allocated into three experimental
groups, each consisting of 20 subjects (n=20 per group): The
sham-operated (SHAM) control group, which underwent anesthesia,
laminectomy and all surgical procedures except for the induction of
SCI, the SCI group and the SCI combined with Que treatment group
(SCI + Que). In the present study, C57BL/6J strain mice were
anesthetized by intraperitoneal administration of a 1.25% solution
of tribromoethanol (commercially known as Avertin (cat. no.
75-80-9; Sigma-Aldrich; Merck KGaA) at a dose of 250 mg/kg. In the
present study, Avertin was used only prior to model construction
and euthanasia. The mice were anesthetized using Avertin™ and
subjected to a laminectomy at the T10 vertebral level to expose the
T9-T10 segment of the spinal cord. SCI was induced via a controlled
contusion at the T9 segment, utilizing a spinal impactor with the
following parameters: i) Impact velocity of 1.5 m/sec; ii) impact
depth of 0.2 mm; iii) dwell time of 0.5 sec; and iv) hammer
diameter of 1.3 mm. Post-surgical procedures involved suturing the
skin and muscle, followed by placing the mice on a heating pad to
promote recovery. Manual bladder expression was conducted twice
daily for a duration of 2 weeks to aid in urination. Furthermore,
all mice were administered intraperitoneal injections of the
antibiotic cefotaxime (cat. no. 64485-93-4; Sigma-Aldrich; Merck
KGaA) at a dosage of 16 mg/kg, administered twice daily over a
period of 7 days. Mice in the SCI + Que group received Que (cat.
no. hy-18085; MedChemExpress) injections twice daily at a dose of
7.5 mg/kg for 14 days. This dose was specifically selected based on
previous studies (56,57). Motor function was evaluated using
the Basso Mouse Scale (BMS) on postoperative days 1, 3, 7, 10 and
14. The BMS scoring system categorizes motor function as follows:
i) A score of 0 signifies total paralysis; ii) scores ranging
between 1 and 3 reflect mild movement capabilities; iii) scores of
4–5 denote the presence of a plantigrade gait; iv) scores from 6 to
8 indicate coordinated walking abilities; and v) a score of 9
represents normal motor function (58). Additionally, on postoperative day
14, the mechanical paw withdrawal threshold (MWT) and thermal paw
withdrawal latency (TWL) were assessed in the hind paws of mice
from each experimental group. MWT was determined using a set of
calibrated Von Frey aesthesiometers (KW-CT-1; KEW BASIS; Nanjing
Calvin Biotechnology Co., Ltd.), and the TWL was measured using the
Plantar Test (Hargreaves method) with heated glass (part no. 390G;
IITC, Inc.). The mice were anesthetized with 250 mg/kg of Avertin
and then euthanized by cervical dislocation. Death was confirmed by
the absence of cardiac or respiratory activity for at least 5 min
post-mortem, along with no response to painful stimuli.
Cell culture
Fibroblasts of the NRK-49F cell line (cat. no.
CL-0854; Procell Life Science & Technology Co., Ltd.) were
maintained in Dulbecco's modified Eagle's medium (DMEM; Invitrogen;
Thermo Fisher Scientific, Inc.) supplemented with 10% fetal bovine
serum (FBS; FSP500; Shanghai ExCell Biology, Inc.) and 1%
penicillin-streptomycin under standard conditions at 37°C with 5%
CO2. The fibroblasts were seeded at a density of
2×10⁵ cells/ml and allocated into three experimental
groups (n=4 per group): i) Control (Con) group; ii) group treated
with 10 ng/ml TGF-β; and iii) group treated with 10 ng/ml TGF-β in
combination with 10 µmol/ml Que (TGF-β + Que). Each group was
subjected to the respective treatments for a duration of 24 h.
Western blotting
NRK-49F cells and mouse spinal cord tissue samples
were lysed using a lysis buffer containing a protease inhibitor
cocktail (Beyotime Institute of Biotechnology). Protein
concentration was determined using the BCA protein assay kit (cat.
no. 23227; Thermo Fisher Scientific, Inc.). The protein samples
were then transferred to polyvinylidene fluoride membranes, which
were subsequently blocked for 1 h at room temperature., washed with
TBST solution and incubated with the following primary antibodies:
CYP1B1 (1:500; cat. no. 18505-1-AP; Proteintech Group, Inc.),
Fibronectin (Fn) (1:1,000; cat. no. ab2413; Abcam) and GAPDH
(1:50,000; cat. no. 1E6D9; Proteintech Group, Inc.). The membrane
was incubated with primary antibodies overnight at 4°C. The
following day, after washing, it was incubated with horseradish
peroxidase (HRP)-conjugated goat anti-rabbit IgG (1:5,000; cat. no.
ab205718; Abcam) and goat anti-mouse IgG (1:5,000; cat. no.
ab150113; Abcam) for 1 h at room temperature. Protein detection was
performed using the Biodlight™ ECL Chemiluminescent HRP Substrate
(High Sensitivity) (cat. no. BLH01S100; Bioworld Technology, Inc.)
and a TANON-5200 Chemiluminescent Imaging System (Tanon Science and
Technology Co., Ltd.). Results analysis was performed using ImageJ
software (version 1.54 g; National Institutes of Health) and Prism
(version 9.0.0; Dotmatics).
Reverse transcription-quantitative PCR
(RT-qPCR)
Total RNA was isolated from spinal cord tissue and
fibroblasts utilizing Trizol reagent (cat. no. bs258A; Biosharp
Life Sciences). After verifying RNA purity, complementary DNA
(cDNA) synthesis was performed using the HiScript II Q RT SuperMix
for qPCR kit (cat. no. R222-01; Vazyme Biotech Co., Ltd.) according
to the manufacturer's instructions. The reverse transcription
procedure was carried out under the following conditions: 50°C for
15 min, 85°C for 5 sec, followed by a hold at 4°C. qPCR was
subsequently performed with the ChamQ Universal SYBR qPCR Master
Mix kit (cat. no. Q711-02; Vazyme Biotech Co., Ltd.). The
amplification protocol consisted of an initial phase for 1 min at
95°C, followed by 50 cycles for 15 sec at 95°C and 30 sec at 50°C.
The relative mRNA expression levels of the target genes were
normalized to GAPDH expression levels and analyzed using the
2−ΔΔCq method (59).
Details of the primer sequences are shown in Table SI, and the rat primers included in
the table are for cell experiments only.
Immunofluorescence
After euthanasia, the spinal cords were removed and
washed in PBS. The spinal cords were immersed in a 4%
glutaraldehyde solution at 4°C for 24 h for fixation, followed by
cryoprotection in a sucrose solution for 48 h at 4°C. Using a
cryostat, the spinal cords were manually sectioned into 10-µm-thick
slices for immunofluorescence staining. The slides were allowed to
equilibrate at room temperature for 1 h. Subsequently, 0.5% Triton
X-100 permeabilization solution (cat. no. 9036-19-5; Sigma-Aldrich;
Merck KGaA) was applied to the sections and incubated at 4°C for 5
min. Ready-to-use goat serum blocking buffer (Beyotime Institute of
Biotechnology) was then applied, followed by incubation at room
temperature for 1 h. The sections were incubated overnight at 4°C
with the following primary antibodies: CYP1B1 (1:100 dilution; cat.
no. 18505-1-AP; Proteintech Group, Inc.) and PDGF-D (1:100
dilution; cat. no. 14075-1-AP; Proteintech Group, Inc.). Afterward,
the sections were stained for 1 h with the following secondary
antibodies: Goat anti-mouse IgG H&L (1:500; cat. no. ab150113;
Abcam) and goat anti-rabbit IgG H&L (1:500; cat. no. ab150080;
Abcam). Finally, cell nuclei in the tissue sections were labeled
using 4′,6-diamidino-2-phenylindole (cat. no. F6057; Sigma-Aldrich;
Merck KGaA). The stained samples were visualized under an upright
fluorescence microscope (Olympus Corporation), and images were
analyzed using ImageJ software. Three replicates were conducted for
the immunofluorescence experiments to ensure the reliability and
reproducibility of the results of the present study. Furthermore,
spinal cord tissues were collected from six independent mice per
group to account for inter-individual variability. Additionally,
serial sections from the same tissue block were stained separately
on different days to control for batch effects. Furthermore, ImageJ
(National Institutes of Health) was used to quantify fluorescence
intensity by measuring the mean pixel intensity of the regions of
interest. To ensure accuracy, the fluorescence intensity data were
normalized to sham group samples to account for variations in
imaging conditions.
Statistical analysis
In the present study, R (version 4.2.1, R Foundation
for Statistical Computing; http://www.R-project.org/) was used as the core
analysis tool, and Prism 9.0 was used for all data statistics. The
data presented are from three independent experiments. During
hypothesis testing, each value is presented as mean ± SEM. For
comparative analysis of different data structures, two groups were
compared using an independent samples t-test. Multiple groups were
compared using one-way ANOVA, followed by the Tukey's honest
significant difference post hoc test. The Kruskal-Wallis test was
applied for the BMS scores, followed by Dunn's post hoc test. The
resulting figure was visualized using Adobe Illustrator (version
24.0; http://www.adobe.com/products/illustrator.html).
P<0.05 was considered to indicate a statistically significant
difference.
Results
NP-related genes identified using SMR,
and the key module genes associated with SCI determined through
WGCNA
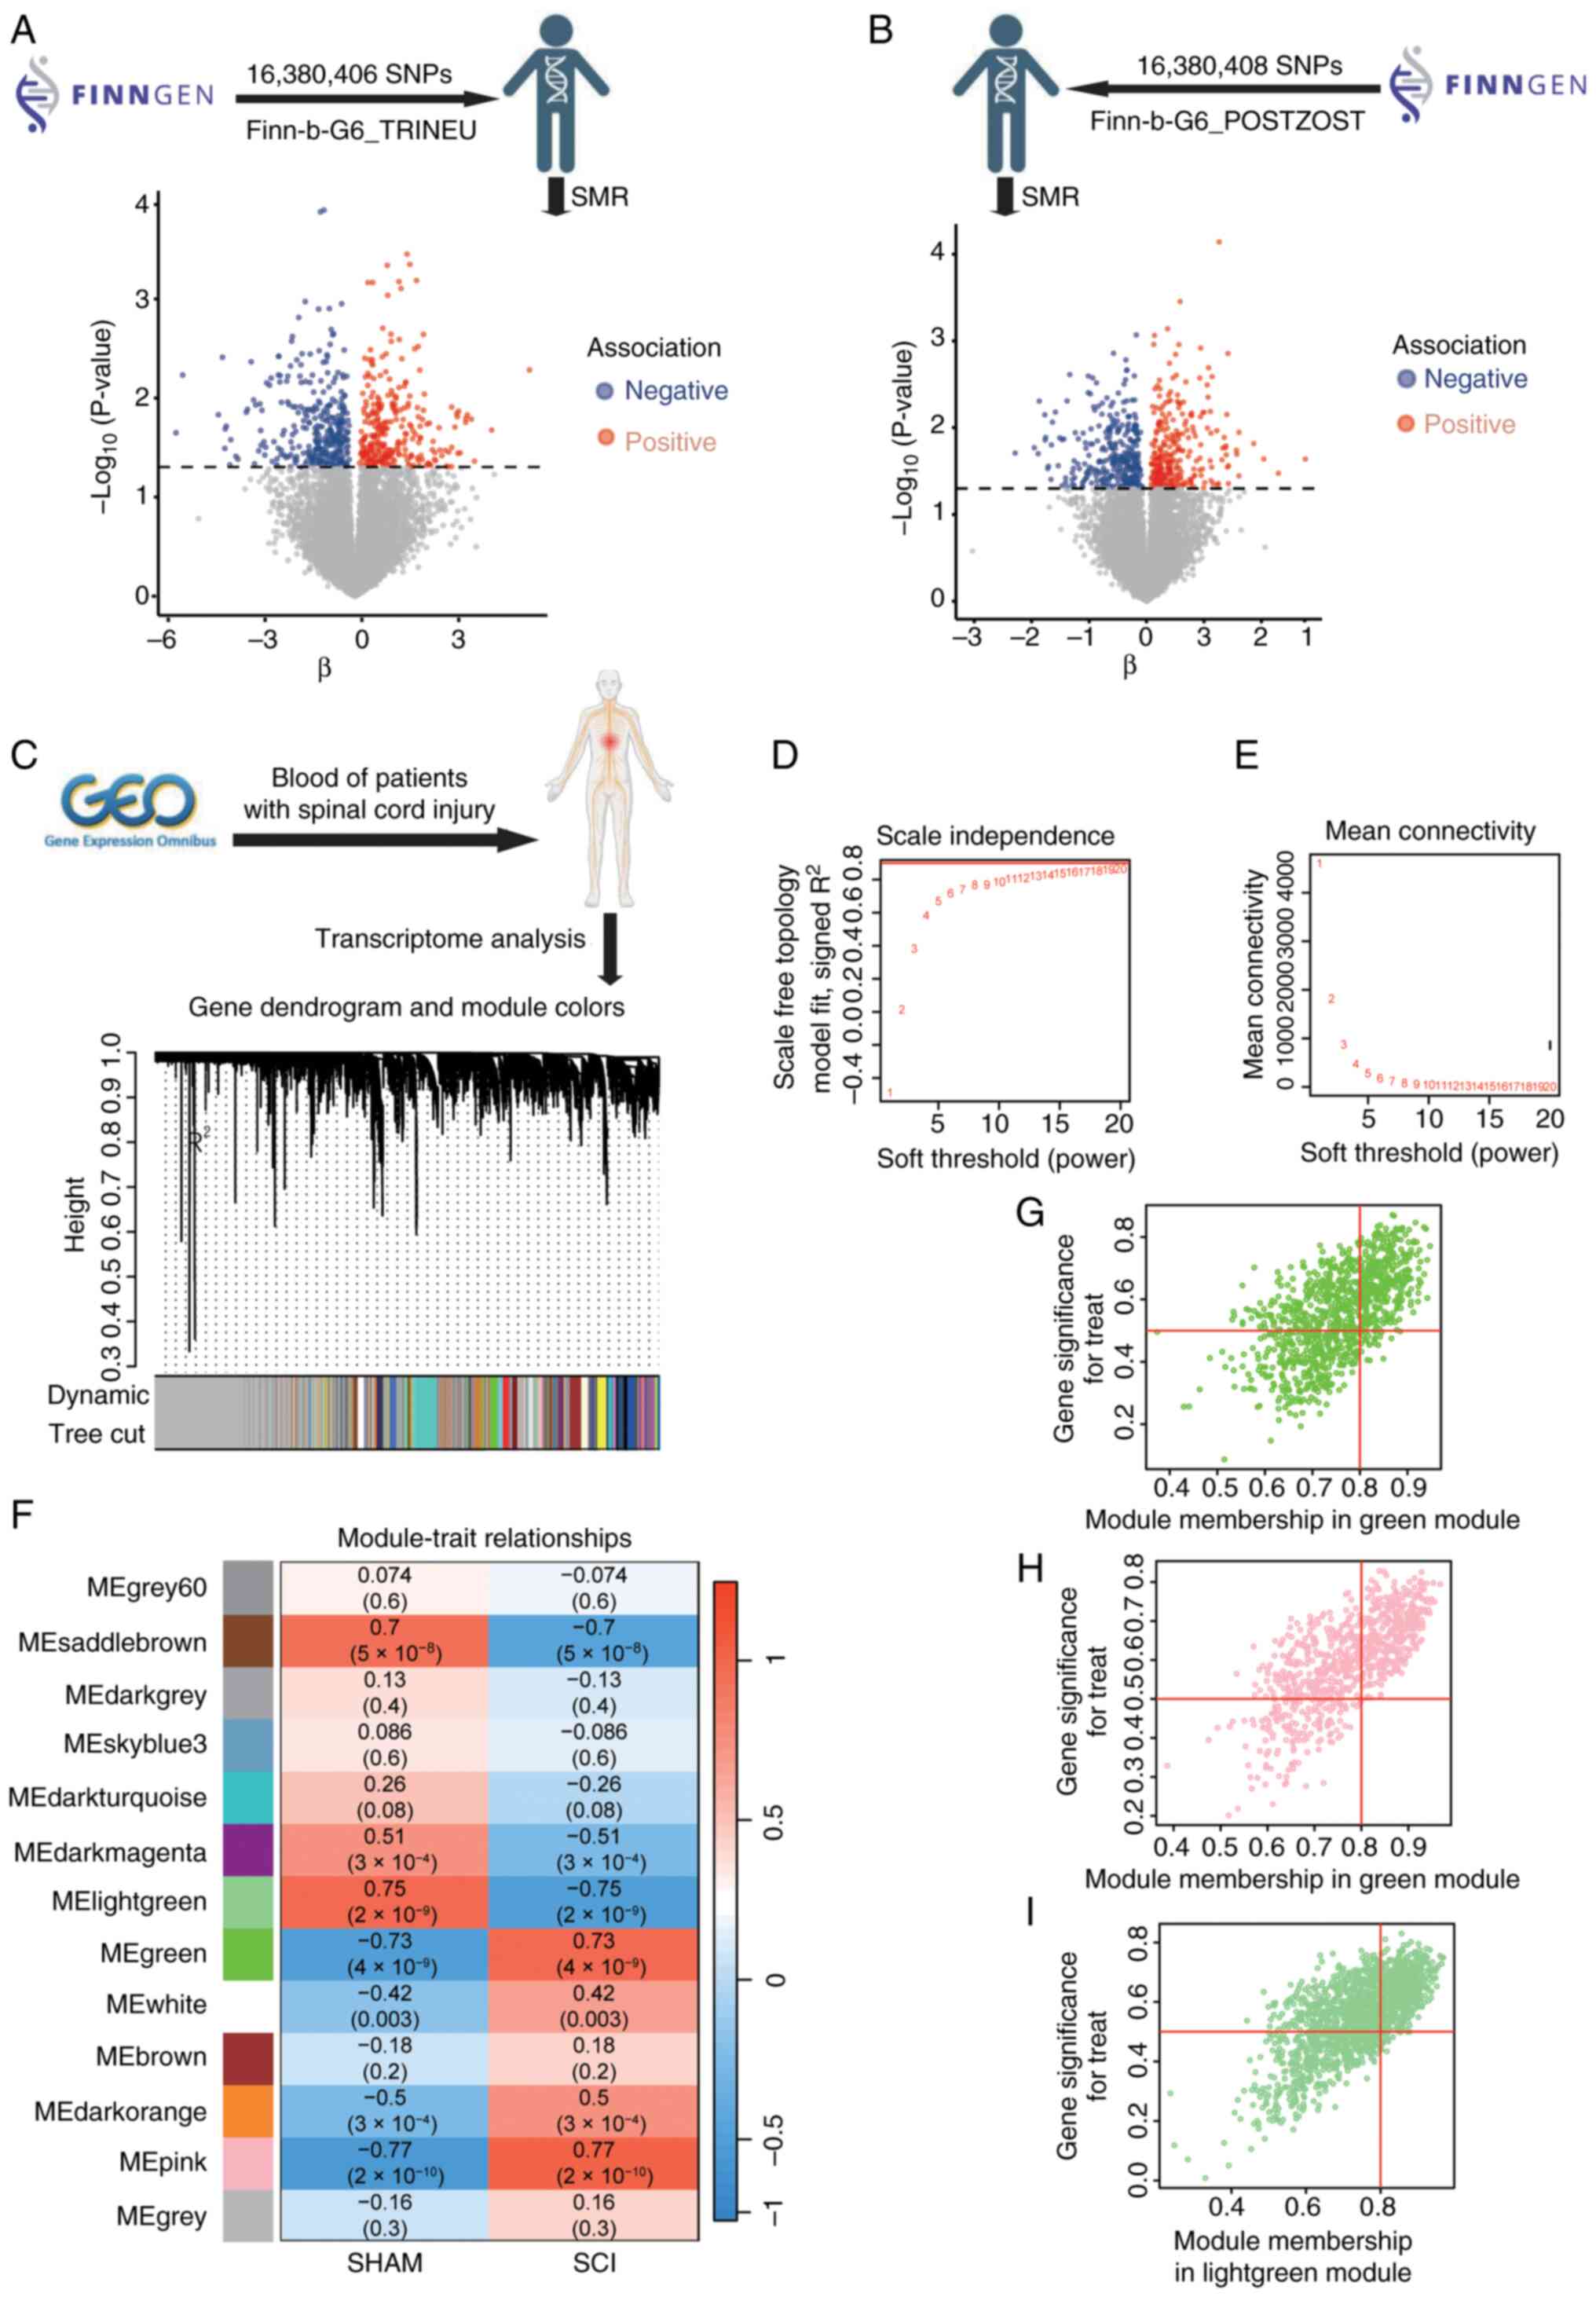
Prioritization was achieved through WGCNA, utilizing
the SMR and HEIDI methods to identify pleiotropic associations
between gene expression and both TN and PHN. To mitigate the
effects of pleiotropy and improve the precision of causal
inference, cis-eQTLs were exclusively used as genetic instruments.
The SMR results, following HEIDI testing, revealed associations
with 610 genes for TN (Fig. 2A)
and 619 genes for PHN (Fig. 2B).
In the present study, the most pertinent modules related to SCI
were analyzed using WGCNA. Based on this threshold, 13 distinct
gene co-expression modules were identified, with each module
represented by a different color (Fig.
2C). The analysis revealed that selecting a ‘soft’ thresholding
power β of 20 (scale-free R2, 0.85) resulted in gene
associations that most closely adhered to a scale-free distribution
(Fig. 2D and E). Pearson's
correlation analysis revealed that the MEpink module (correlation
coefficient r, 0.77), the MElightgreen module (correlation
coefficient r, −0.75) and the MEgreen module (correlation
coefficient r, 0.73) exhibited strong correlations with SCI
(Fig. 2F). Consequently, modules
with correlation coefficients >0.70 were identified as key
modules for subsequent SCI analyses. This selection process
resulted in a total of 3,243 genes identified across the three key
modules (Fig. 2G-I).
Core gene screening and immune
infiltration analysis
The aforementioned NP-related candidate genes were
cross-referenced with key module genes associated with SCI,
resulting in the identification of 218 intersecting genes (Fig. 3A). By applying seven different
algorithms implemented by the cytoHubba plug-in in Cytoscape, the
top 45 genes for each algorithm's respective score were identified.
Following the intersection analysis using a Upset plot, 21 hub
genes were identified (Fig. 3B).
These 218 genes subsequently underwent GO and KEGG enrichment
analyses (Fig. 3C). The GO
enrichment analysis revealed that the intersecting genes were
predominantly associated with biological processes such as
‘response to toxic substance’, ‘response to oxidative stress’ and
‘regulation of neuron apoptotic process’. In the context of
cellular component ontology, notable enrichment was observed in the
‘mitochondrial matrix’ and ‘ion channel complex’. Molecular
function analyses indicated that the intersecting genes were
predominantly enriched in ‘protein-disulfide reductase (NAD(P))
activity’, ‘SMAD binding’ and ‘calcium-dependent cysteine-type
endopeptidase activity’. Regarding the KEGG pathway analysis,
notable enrichment was found in ‘transcriptional misregulation in
cancer’, ‘polycomb repressive complex’ and ‘sphingolipid
metabolism’. The 218 intersecting genes were subsequently analyzed
to determine potential interactions among their encoded proteins
using the STRING database. In order to explore the protein-protein
interaction of these 21 genes, PPI interaction experiments were
carried out (Fig. 3D). The
observations of the analysis indicated that genes associated with
NP were implicated in the pathogenesis of SCI. Enrichment analysis
revealed notable involvement in immune system regulation.
Consequently, immune infiltration analysis may provide deeper
insights into the immune regulatory mechanisms underlying SCI. The
bar graph in Fig. 3E illustrates
the proportion of 28 immune cell types in each sample for both
patients with SCI and control subjects in the GSE151371 dataset.
According to the vioplot analysis, patients with SCI exhibited
elevated levels of activated dentritic cell, γδ T cells, immature
dendritic cells, macrophages, monocytes, neutrophils and regulatory
T cells compared with controls. Conversely, the levels of activated
B cells, activated CD8 T cells, effector memory CD8 T cells,
immature B cells, memory B cells, natural killer cells and type 1 T
helper cells were found to be lower in patients with SCI than in
controls (Fig. 3F).
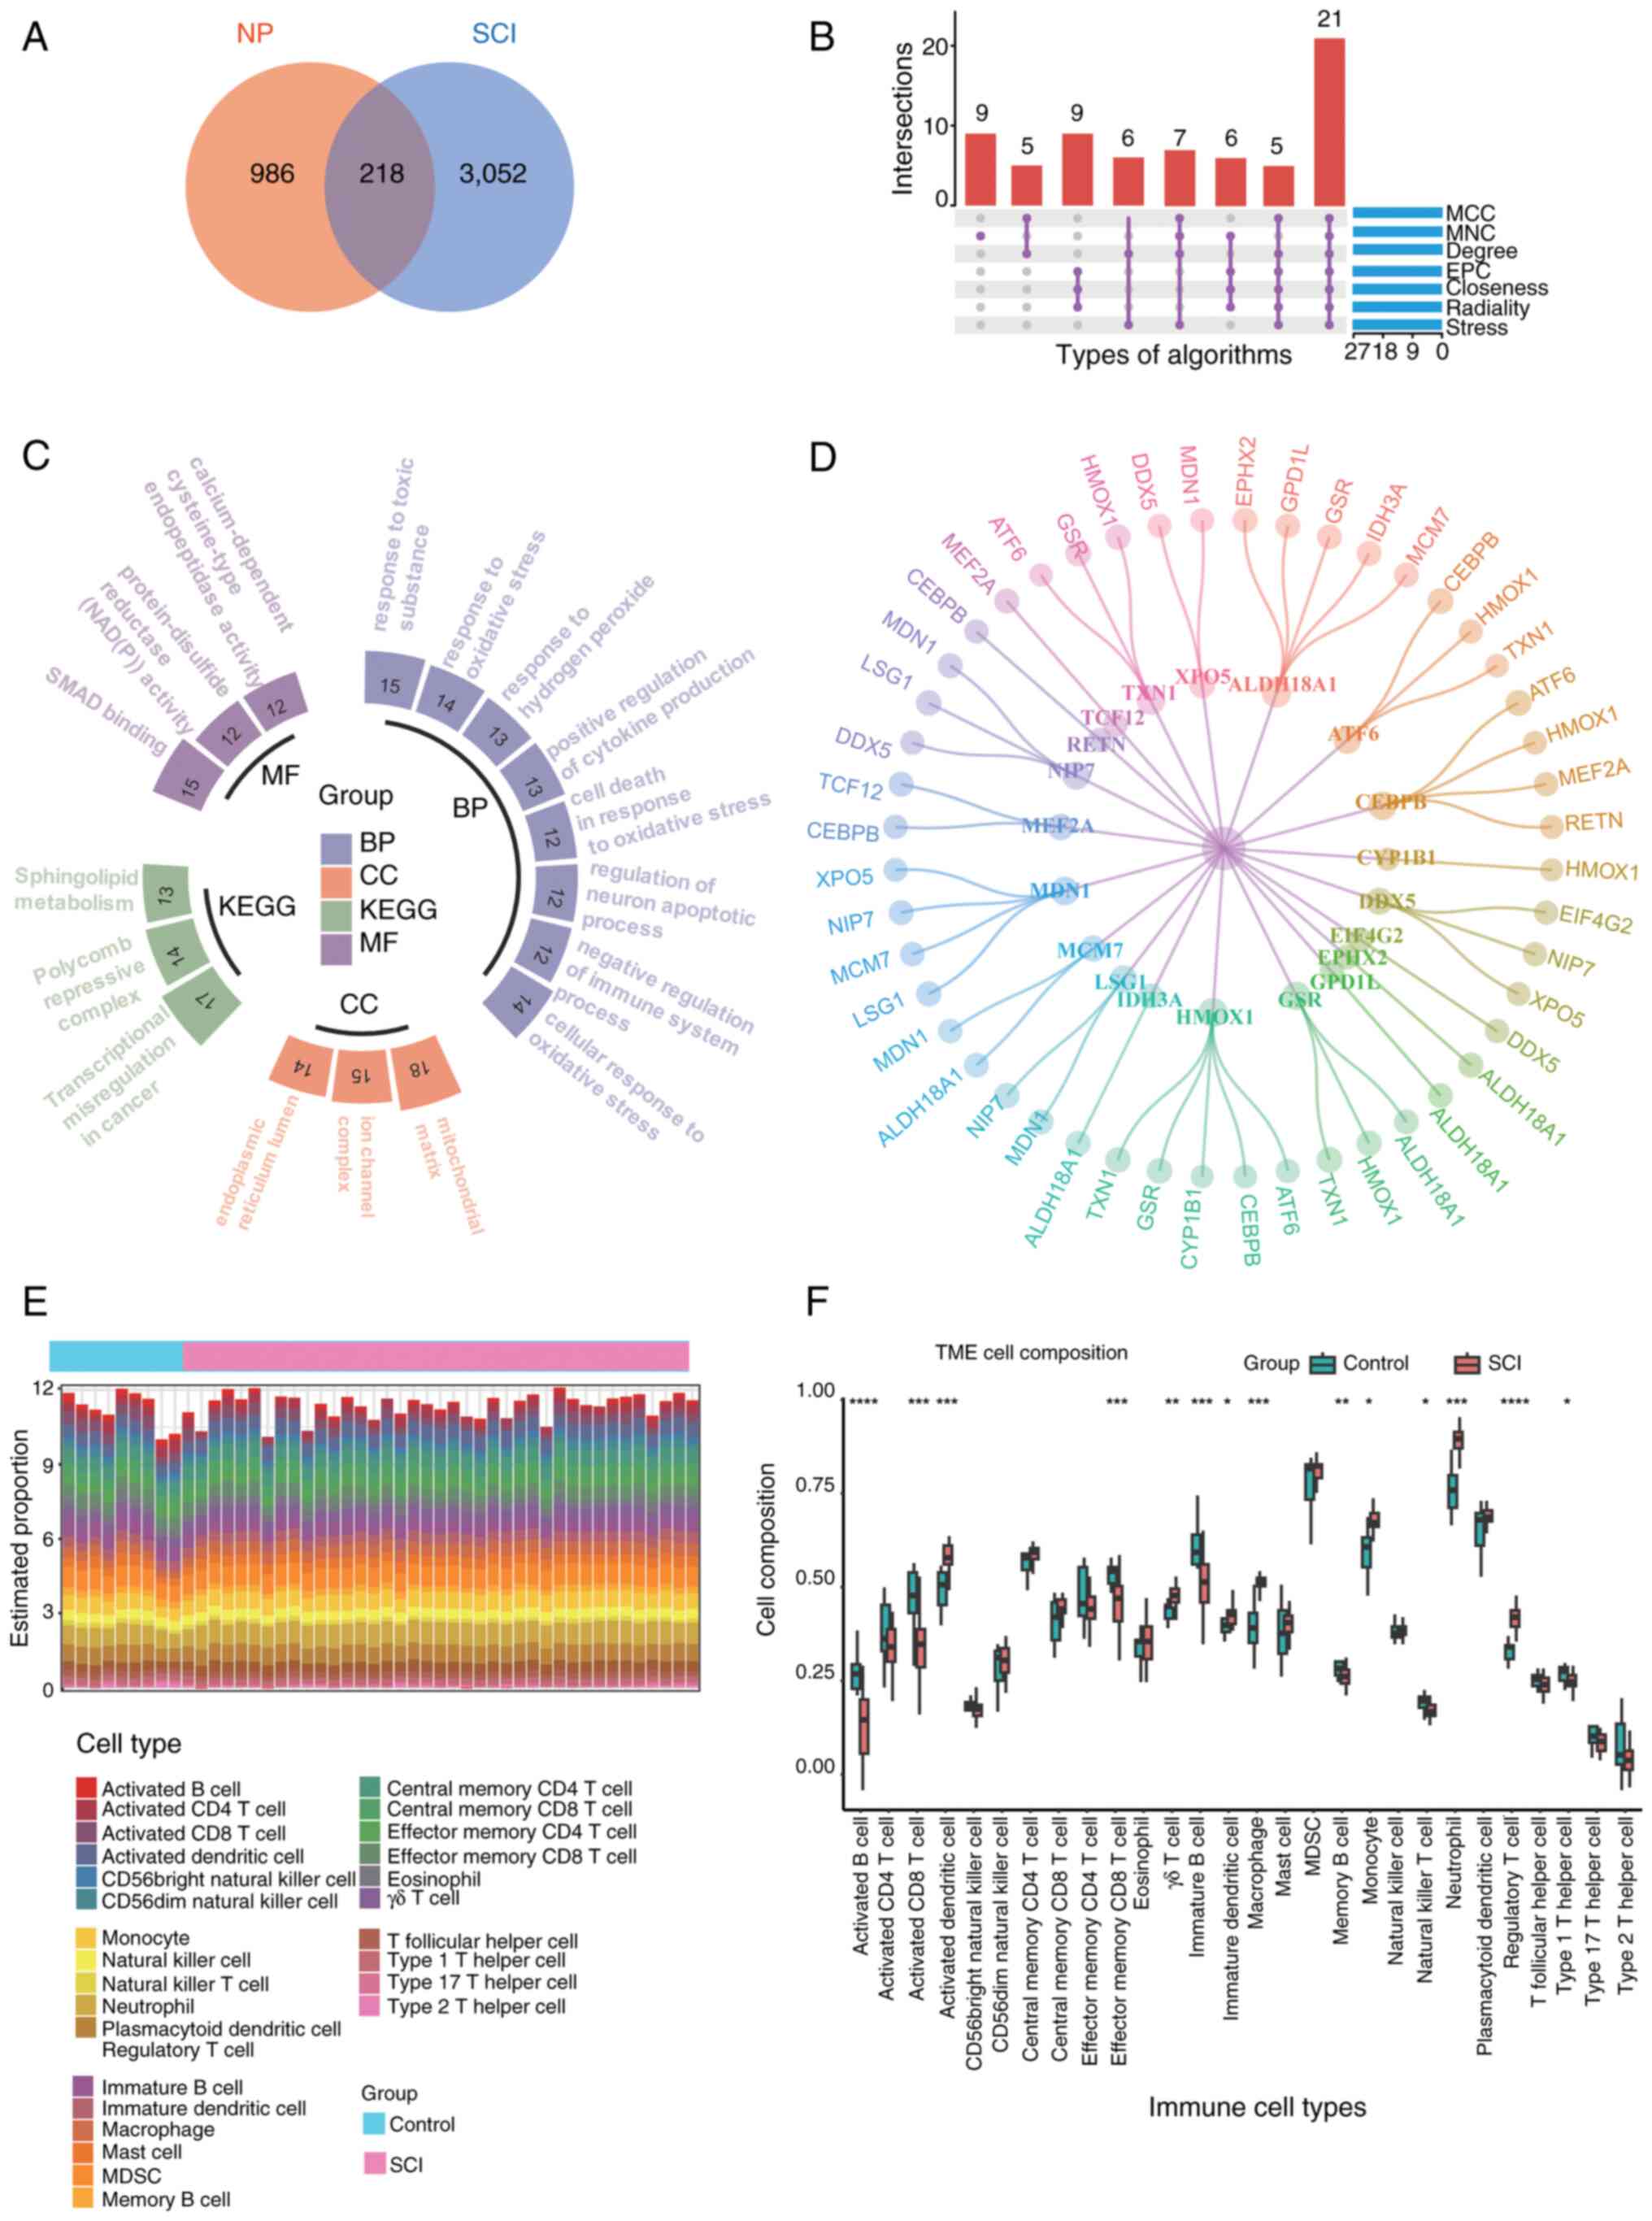 | Figure 3.(A) Venn diagram obtained by crossing
NP-related candidate genes with SCI key module genes, with a total
of 218 common genes. (B) Upset plot depicting the intersection of
the top 45 genes produced by each of the seven algorithms to get 21
genes. (C) Results of GO and KEGG enrichment analysis of 218 common
genes. Different colors represent the classification of different
enrichment pathways, including KEGG, and BP, CC and MF in GO, with
P<0.05 for all enriched pathways, and the number of each bar
cell represents the Count. (D) Protein-protein interaction network
diagram of the 21 core genes (there are only 20 gene interactions
in the image as the gene ALOX5AP cannot be identified by the SRING
database). (E) Proportions of 28 immune cell types in different
samples are shown in the bar graph. (F) Comparison of the
proportions of 28 immune cell types in SCI and control groups.
*P<0.05, **P<0.01, ***P<0.001 and ****P<0.0001 vs.
control. BP, biological processes; CC, cellular component; GO, Gene
Ontology; KEGG, Kyoto Encylopedia of Genes and Genomes; MF,
molecular function; NP, neuropathic pain; SCI, spinal cord injury;
TME, tumor microenvironment; MCC, maximal clique centrality; MNC,
measurement coefficient network; EPC, embedding pathway
components. |
Identification of the diagnostic
marker gene CYP1B1
The pivotal genes were identified through the
application of LASSO regression, SVM-RFE and RF ML algorithms,
which facilitated the construction of column-line diagrams and the
assessment of diagnostic value. LASSO regression identified 10
potential diagnostic candidate genes (Fig. 4A and B), while the SVM-RFE
algorithm identified 11 potential diagnostic candidate genes
(Fig. 4C). The RF algorithm ranked
the 21 genes identified at the intersection of seven algorithms.
From this ranking, the top 15 most diagnostic candidate genes were
selected. (Fig. 4D). The potential
diagnostic candidate genes identified through three ML algorithms
were visualized using a Venn diagram (Fig. 4E), leading to the selection of
three genes, CYP1B1, EPHX2 and GPD1L, for further investigation.
Subsequently, a nomogram was developed (Fig. 4F) utilizing these three diagnostic
candidate genes. ROC curves were constructed for the aforementioned
genes to evaluate their diagnostic specificity and sensitivity. The
AUC of CYP1B1 was 0.953 with a CI of 0.876–1.000 and an optimal
cut-off of 3.615 (Fig. 4G), the
AUC of EPHX2 was 0.989 with a CI of 0.961–1.000 and an optimal
cut-off of 1.167 (Fig. 4H), and
the AUC of GPD1L was 0.957 with a CI of 0.862–1.000 and an optimal
cut-off of 2.292 (Fig. 4I). These
findings suggest that CYP1B1, EPHX2 and GPD1L possess significant
diagnostic value for SCI. The association between three identified
candidate genes for SCI diagnosis and neuralgia disease was
investigated by using the inference score of neuralgia disease with
CTD (https://ctdbase.org/). Among them, CYP1B1
exhibited the highest inference score, suggesting a stronger
association with pain (Fig. 4J).
As a result, CYP1B1 was selected as a target gene in the blood for
further investigation of its association with NP risk through MR
analysis. Additionally, the gene CDC42 effector protein 3, located
within a 2 Mb window of CYP1B1, was identified to be associated
with NP risk (Fig. 5A and B).
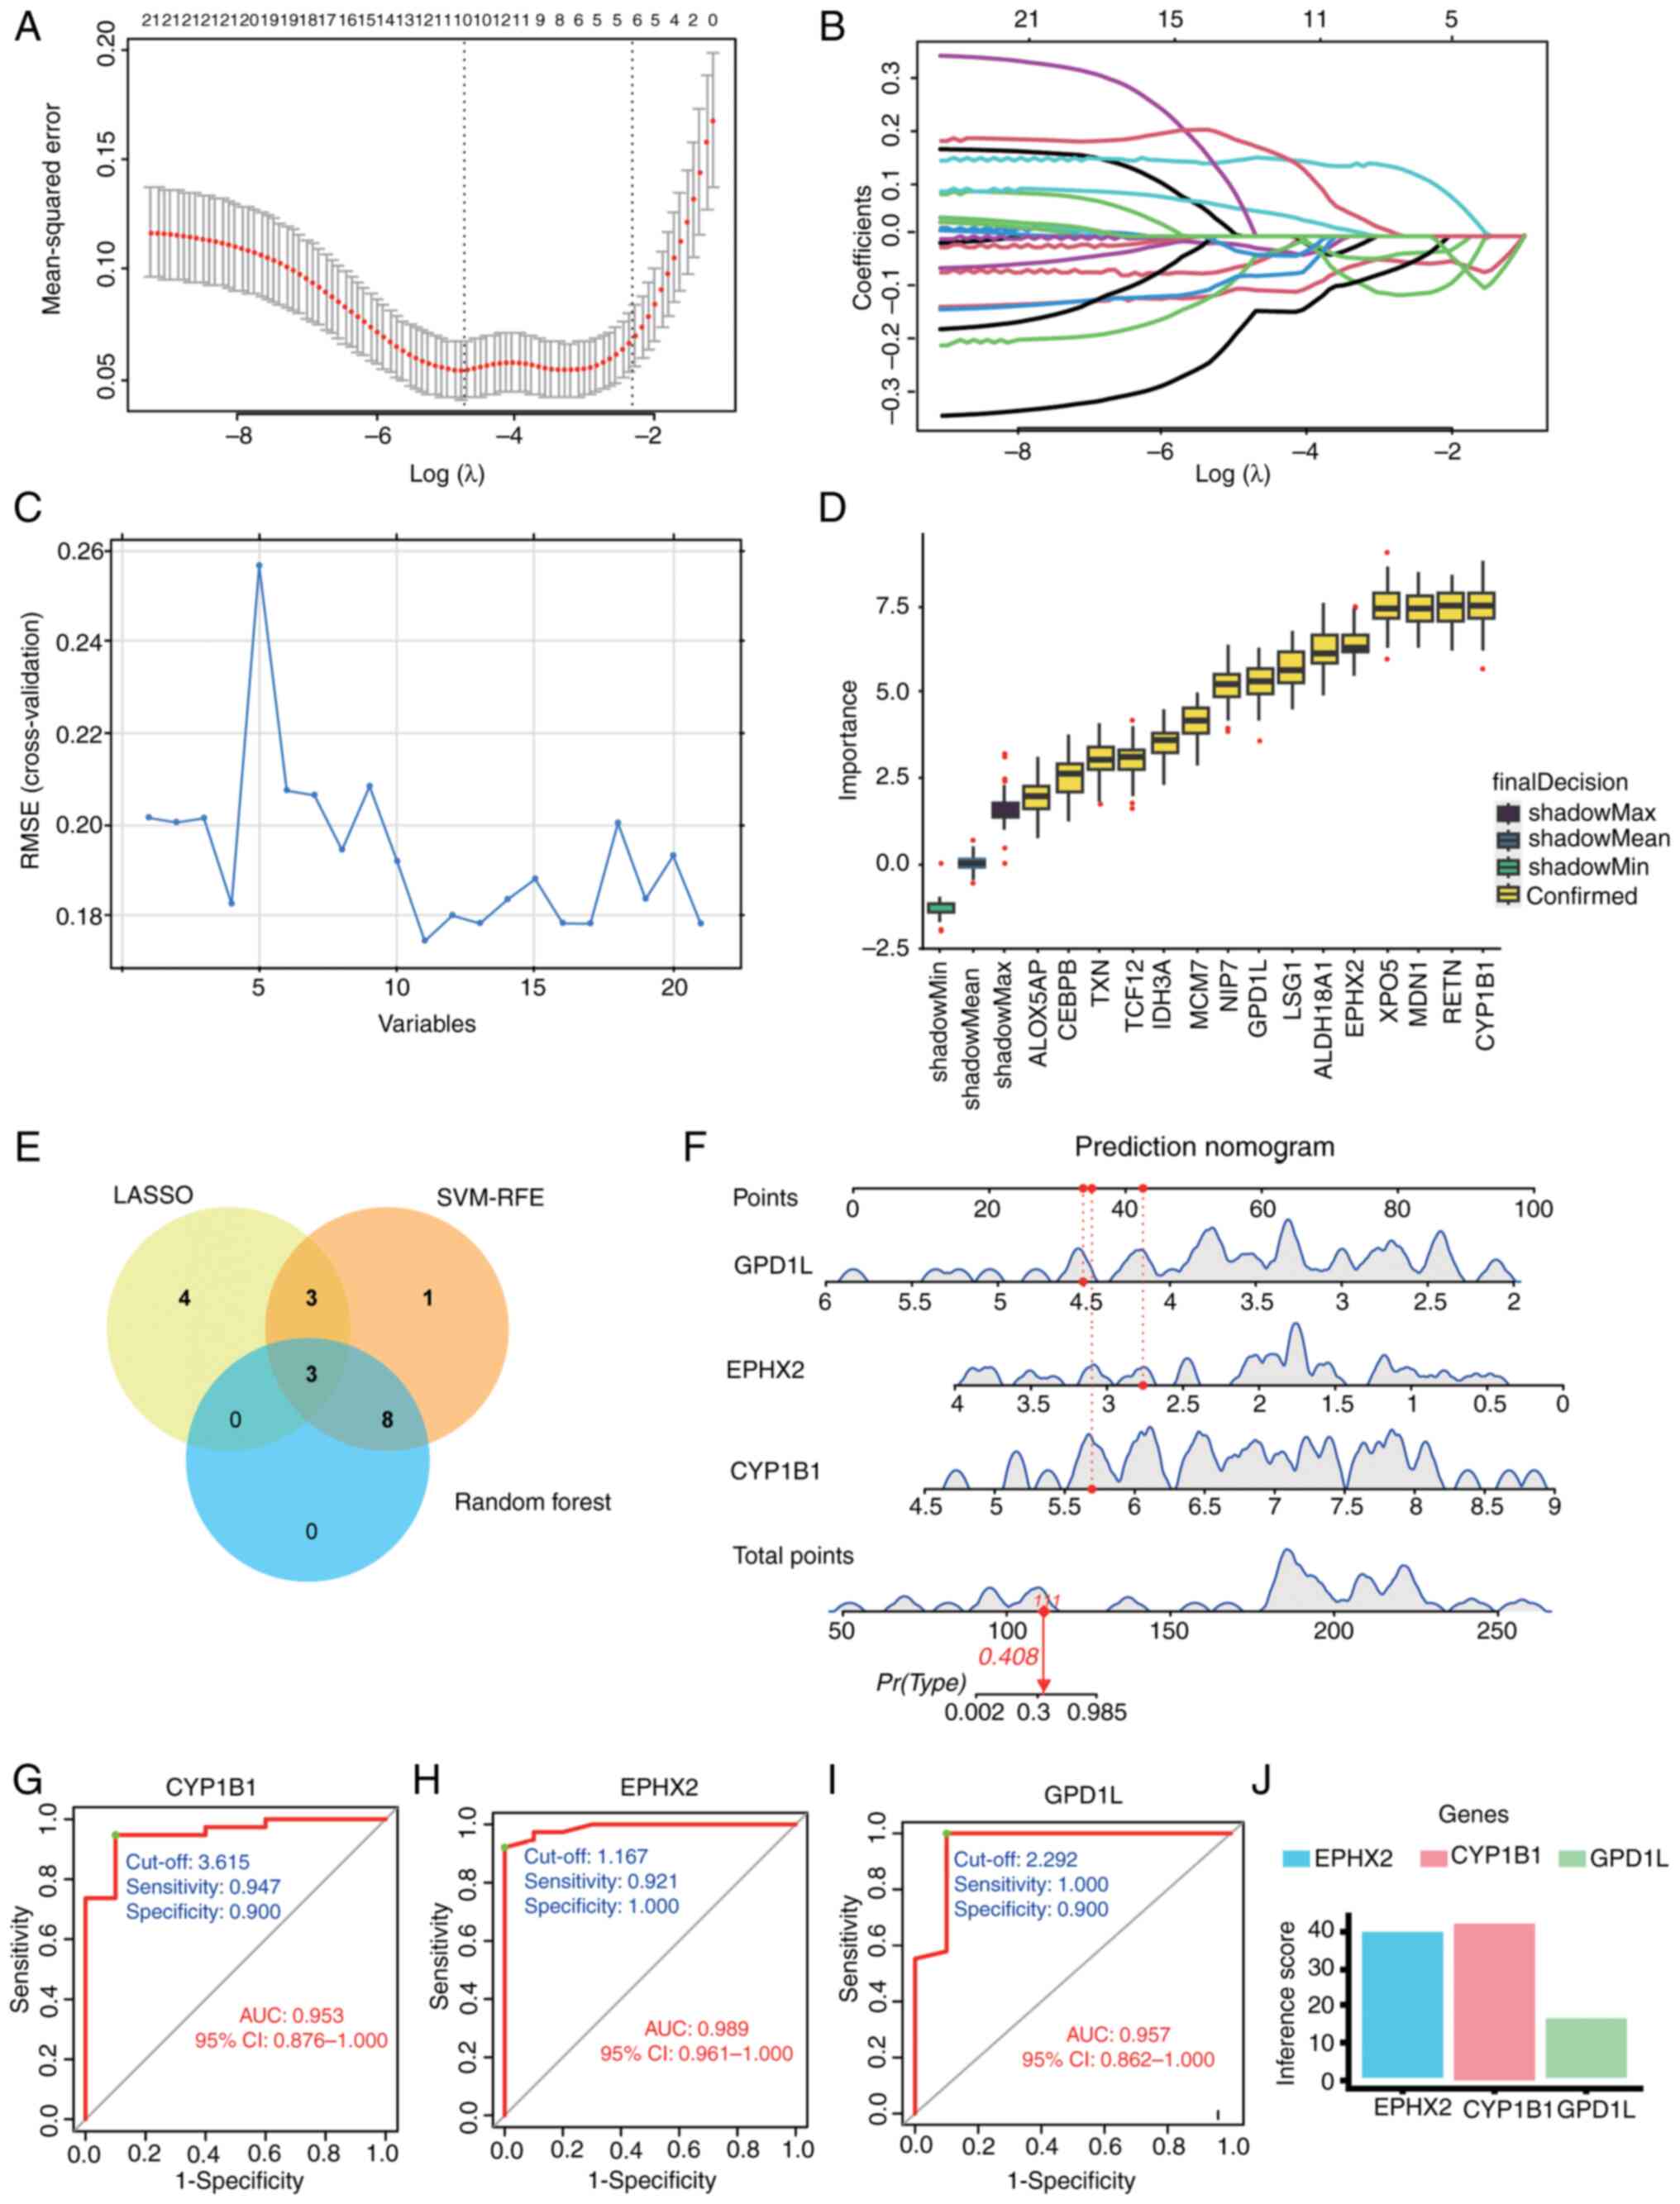 | Figure 4.(A) Screening of diagnostic marker
genes in the LASSO model. This panel shows the cross-validated
mean-squared error plotted against Log(λ). The number of genes
corresponding to the lowest point of the curve (n=10) was most
suitable for the diagnosis of SCI. (B) This panel displays the
number of features (variables) retained in the model at different
values of Log(λ). (C) Characteristic gene selection using the
SVM-RFE technique. A total of 11 characteristic genes were
identified from the 21 core genes. (D) The 15 trait genes were
ranked according to the importance score. (E) Venn diagram of
diagnostic candidate genes identified by three machine algorithms.
(F) Predicted nomograms of candidate genes for SCI diagnosis. To
use it, locate the value for each biomarker (GPD1L, EPHX2, CYP1B1)
on its respective scale and draw a line upward to the ‘Points’ axis
to determine the score for each variable. Sum all the points to get
the ‘Total points’. (G) ROC curve of CYP1B1 in GSE151371 with an
AUC value of 0.953. (H) ROC curve of EPHX2 in GSE151371 with an AUC
value of 0.989. (I) ROC curve of GPD1L in GSE151371 with an AUC
value of 0.957. (J) Visualization of SCI diagnostic candidate genes
based on CTD pain inference scores. AUC, area under the curve; CTD,
Comparative Toxicogenomics Database; CYP1B1, cytochrome P450 family
1 subfamily B member 1; EPHX2, epoxide hydrolase 2; GPD1L,
glycerol-3-phosphate dehydrogenase 1-like; LASSO, least absolute
shrinkage and selection operator; RMSE, root mean square error;
ROC, receiver operating characteristic; SCI, spinal cord injury;
SVM-RFE, support vector machine recursive feature elimination. |
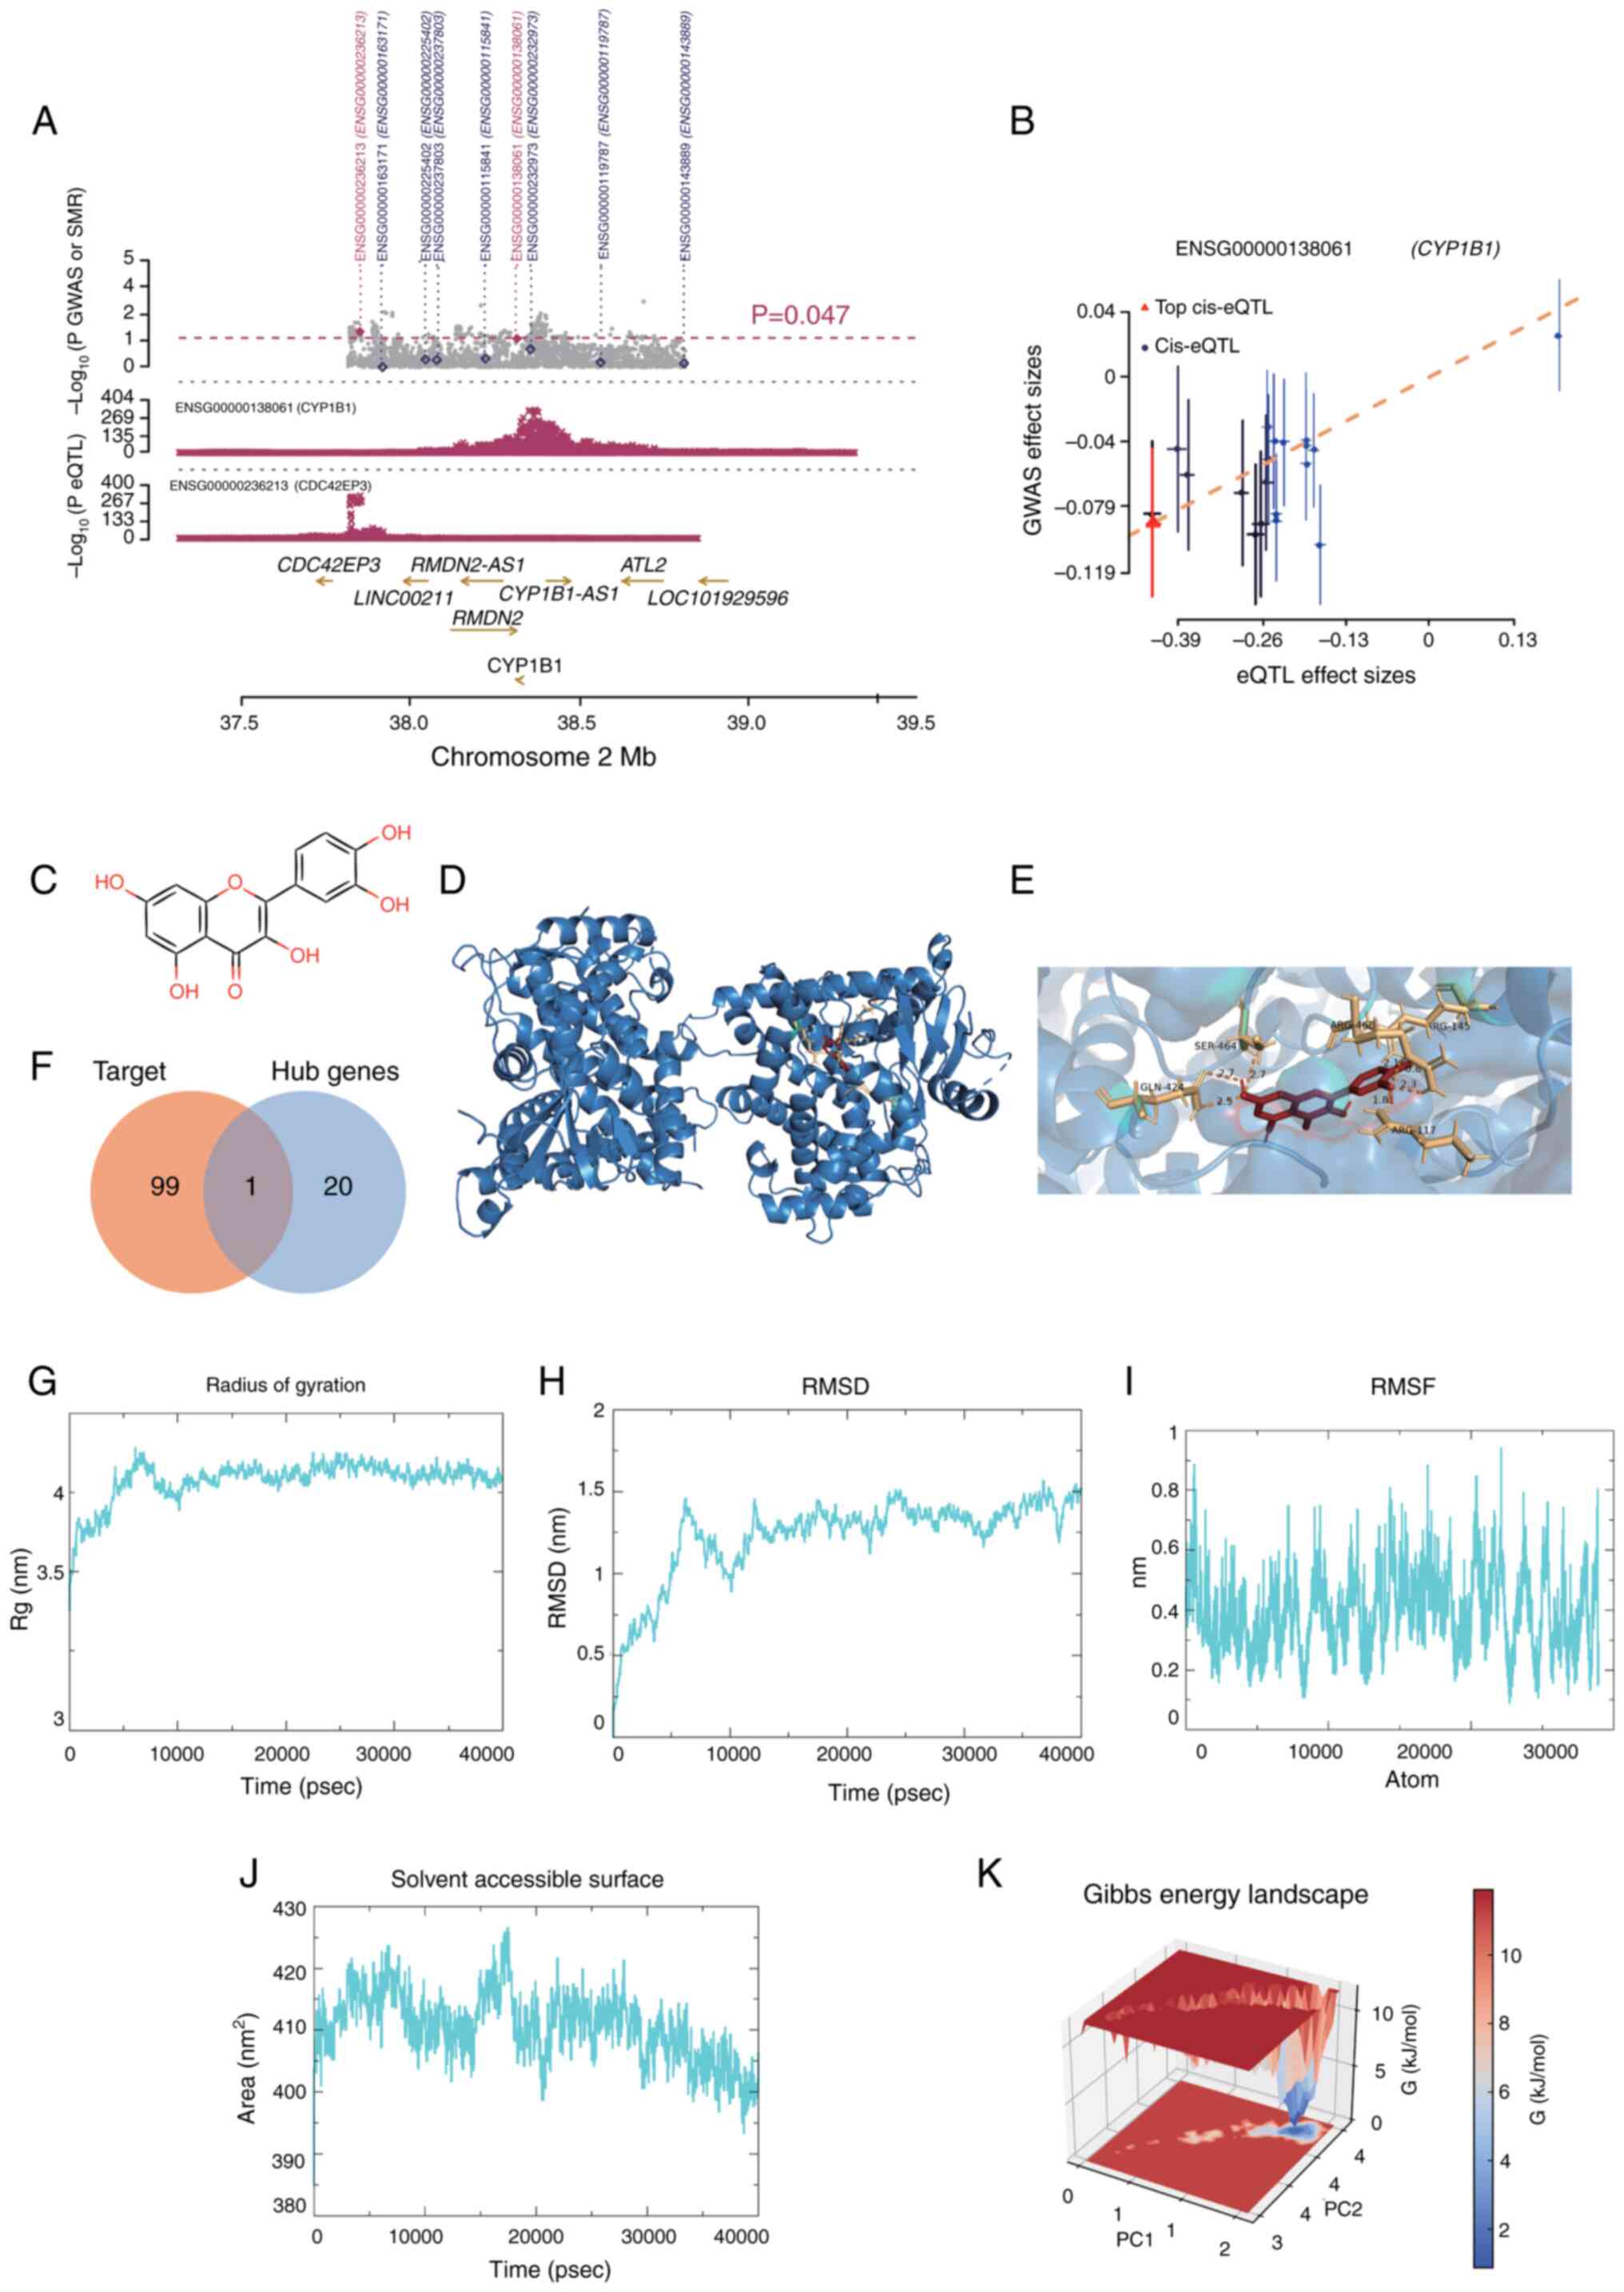 | Figure 5.(A) MR association between CYP1B1
gene expression and trigeminal neuralgia in blood. All SNPs
available in GWAS and eQTL data are shown in. (A) Grey dots
represent the P-values of SNPs for GWAS, and diamonds represent
P-values of probes for SMR tests. (B) P-values for eQTL analyses of
CYP1B1 SNPs from GWAS (used in the heterogeneity in dependent
instruments test) are plotted against effect sizes of SNPs from
eQTL studies. The orange dashed line indicates the effect size
estimate for the MR association at the top cis-eQTL. The error line
is the standard error of the SNP effect. (C) Chemical structure of
Que. (D) Interaction of the CYP1B1 receptor with Que ligands. The
protein is depicted as a blue cartoon (α-helices and β-sheets) with
its molecular surface shown in transparent gray. Que is shown as
red sticks. (E) Detailed view of the local interactions within the
Que-CYP1B1 binding pocket Protein residues are shown as blue
sticks. The ligand, Que, is shown as red sticks. (F) Venn diagram
of potential targets of Que and 21 core genes. (G) Rg of the
Que-CYP1B1 complex. (H) RMSD of the Que-CYP1B1 complex. (I) RMSF of
CYP1B1 protein residues. (J) Solvent accessible surface of the
Que-CYP1B1 complex. (K) Free energy landscape of the Que-CYP1B1
complex. CYP1B1, cytochrome P450 family 1 subfamily B member 1;
eQTL, expression-quantitative trait loci; GWAS, genome wide
association study; MR, Mendelian randomization; PC, principal
component; Que, quercetin; Rg, radius of gyration; RMSD, root mean
square deviation; RMSF, root mean square fluctuation; SMR,
summary-based Mendelian randomization. |
Screening and identification of target
genes for Que
Fig. 5C depicts the
chemical structure of Que. Employing a network pharmacology
methodology, 100 potential gene targets of Que were identified.
This analysis revealed that CYP1B1 was implicated not only in the
pathogenesis of NP following SCI but also as a potential
therapeutic target for Que.
Molecular docking of Que and
CYP1B1
Molecular docking experiments were conducted to
further investigate the interaction between CYP1B1 and Que,
revealing a binding energy of −8.9 kcal/mol for Que with CYP1B1
(Fig. 5D and E). The intersections
of these potential targets with 21 core genes were analyzed using a
Venn diagram (Fig. 5F). The
binding affinity of both entities was determined to be <-5
kcal/mol, indicating a notable affinity of Que for CYP1B1. The
interaction bond between Que and CYP1B1 is represented in Fig. S1A. Furthermore, negative control
substances that exhibit anti-inflammatory properties and possess a
comparable molecular weight to Que, specifically paracetamol,
aspirin and caffeine, were incorporated. In the present
investigation, The aforementioned negative control reagents were
docked with CYP1B1. Although the binding energies of the control
reagents with CYP1B1 were <-5 kcal/mol, Que exhibited the
strongest binding affinity, as indicated by the most negative
binding energy. This is one of the reasons why Que was chosen for
follow-up. The detailed molecular docking results are shown in
Fig. S1B.
MD simulation study of the Que-CYP1B1
complex
To further validate the binding affinity and
stability of Que with CYP1B1, a 40 nsec MD simulation was conducted
to assess the docking results. The root mean square deviation
(RMSD) is a dependable measure for assessing the stability of
protein-ligand conformations, as it indicates changes in atomic
positions compared with the original structure. Greater stability
is indicated by a lower RMSD value. As depicted in Fig. 5G and H, the Que-CYP1B1 complex
achieved equilibrium after 15,000 psec, with RMSD fluctuations
stabilizing at ~1.25 Å, and the radius of gyration (Rg) exhibited
only slight variations during the simulation, suggesting that the
interaction between Que and CYP1B1 is highly stable. The
flexibility of the amino acid residues of the protein was assessed
using the root mean square fluctuation (RMSF). As illustrated in
Fig. 5I, the RMSF values were
relatively low (predominantly <1 Å), indicating high stability.
Additional analysis revealed that the solvent-accessible surface
area fluctuated between 395 and 425 Å2 during the
simulation (Fig. 5J), suggesting
that the structure of the protein remained relatively stable after
ligand attachment. Using RMSD and Rg values, the Gibbs relative
free energy was used to create a free energy landscape, with RMSD,
Rg and Gibbs free energy plotted on the X, Y and Z axes. The free
energy landscape outlines the lowest energy conformations seen
during the MD simulation of the complex, as shown in Fig. 5K. The blue points represent the
lowest energy values, which correspond to the most stable
structural shapes. The Que-CYP1B1 complex demonstrated a nearly
singular and smooth minimum energy cluster. In summary, the
Que-CYP1B1 complex exhibited substantial binding stability,
suggesting that Que effectively binds to CYP1B1.
CYP1B1 genotype identification and
external validation
The NMF algorithm was utilized to cluster 38 SCI
samples according to the expression profiles of genes associated
with NP, as identified through the SMR approach. The clustering
analysis exhibited optimal stability when the number of clusters,
K, was designated as 2 (Fig. 6A).
The cumulative distribution function curve exhibits fluctuations
from 0.3 to 1.0 across the minimum range of the consensus index for
varying values of K (Fig. 6B).
Finally, the 38 SCI samples were classified into two subtypes:
Cluster 1 (n=18) and cluster 2 (n=20). Principal component analysis
demonstrated notable differences between cluster 1 and cluster 2 in
the expression levels of NP-related genes (Fig. 6C). Furthermore, it was observed
that the core gene CYP1B1 was highly expressed in the cluster 1
subtype (Fig. 6D). Validation
using the GSE171441 and GSE236754 datasets demonstrated significant
upregulation of CYP1B1 in both SCI and NP conditions compared with
SHAM (Fig. 6E and F).
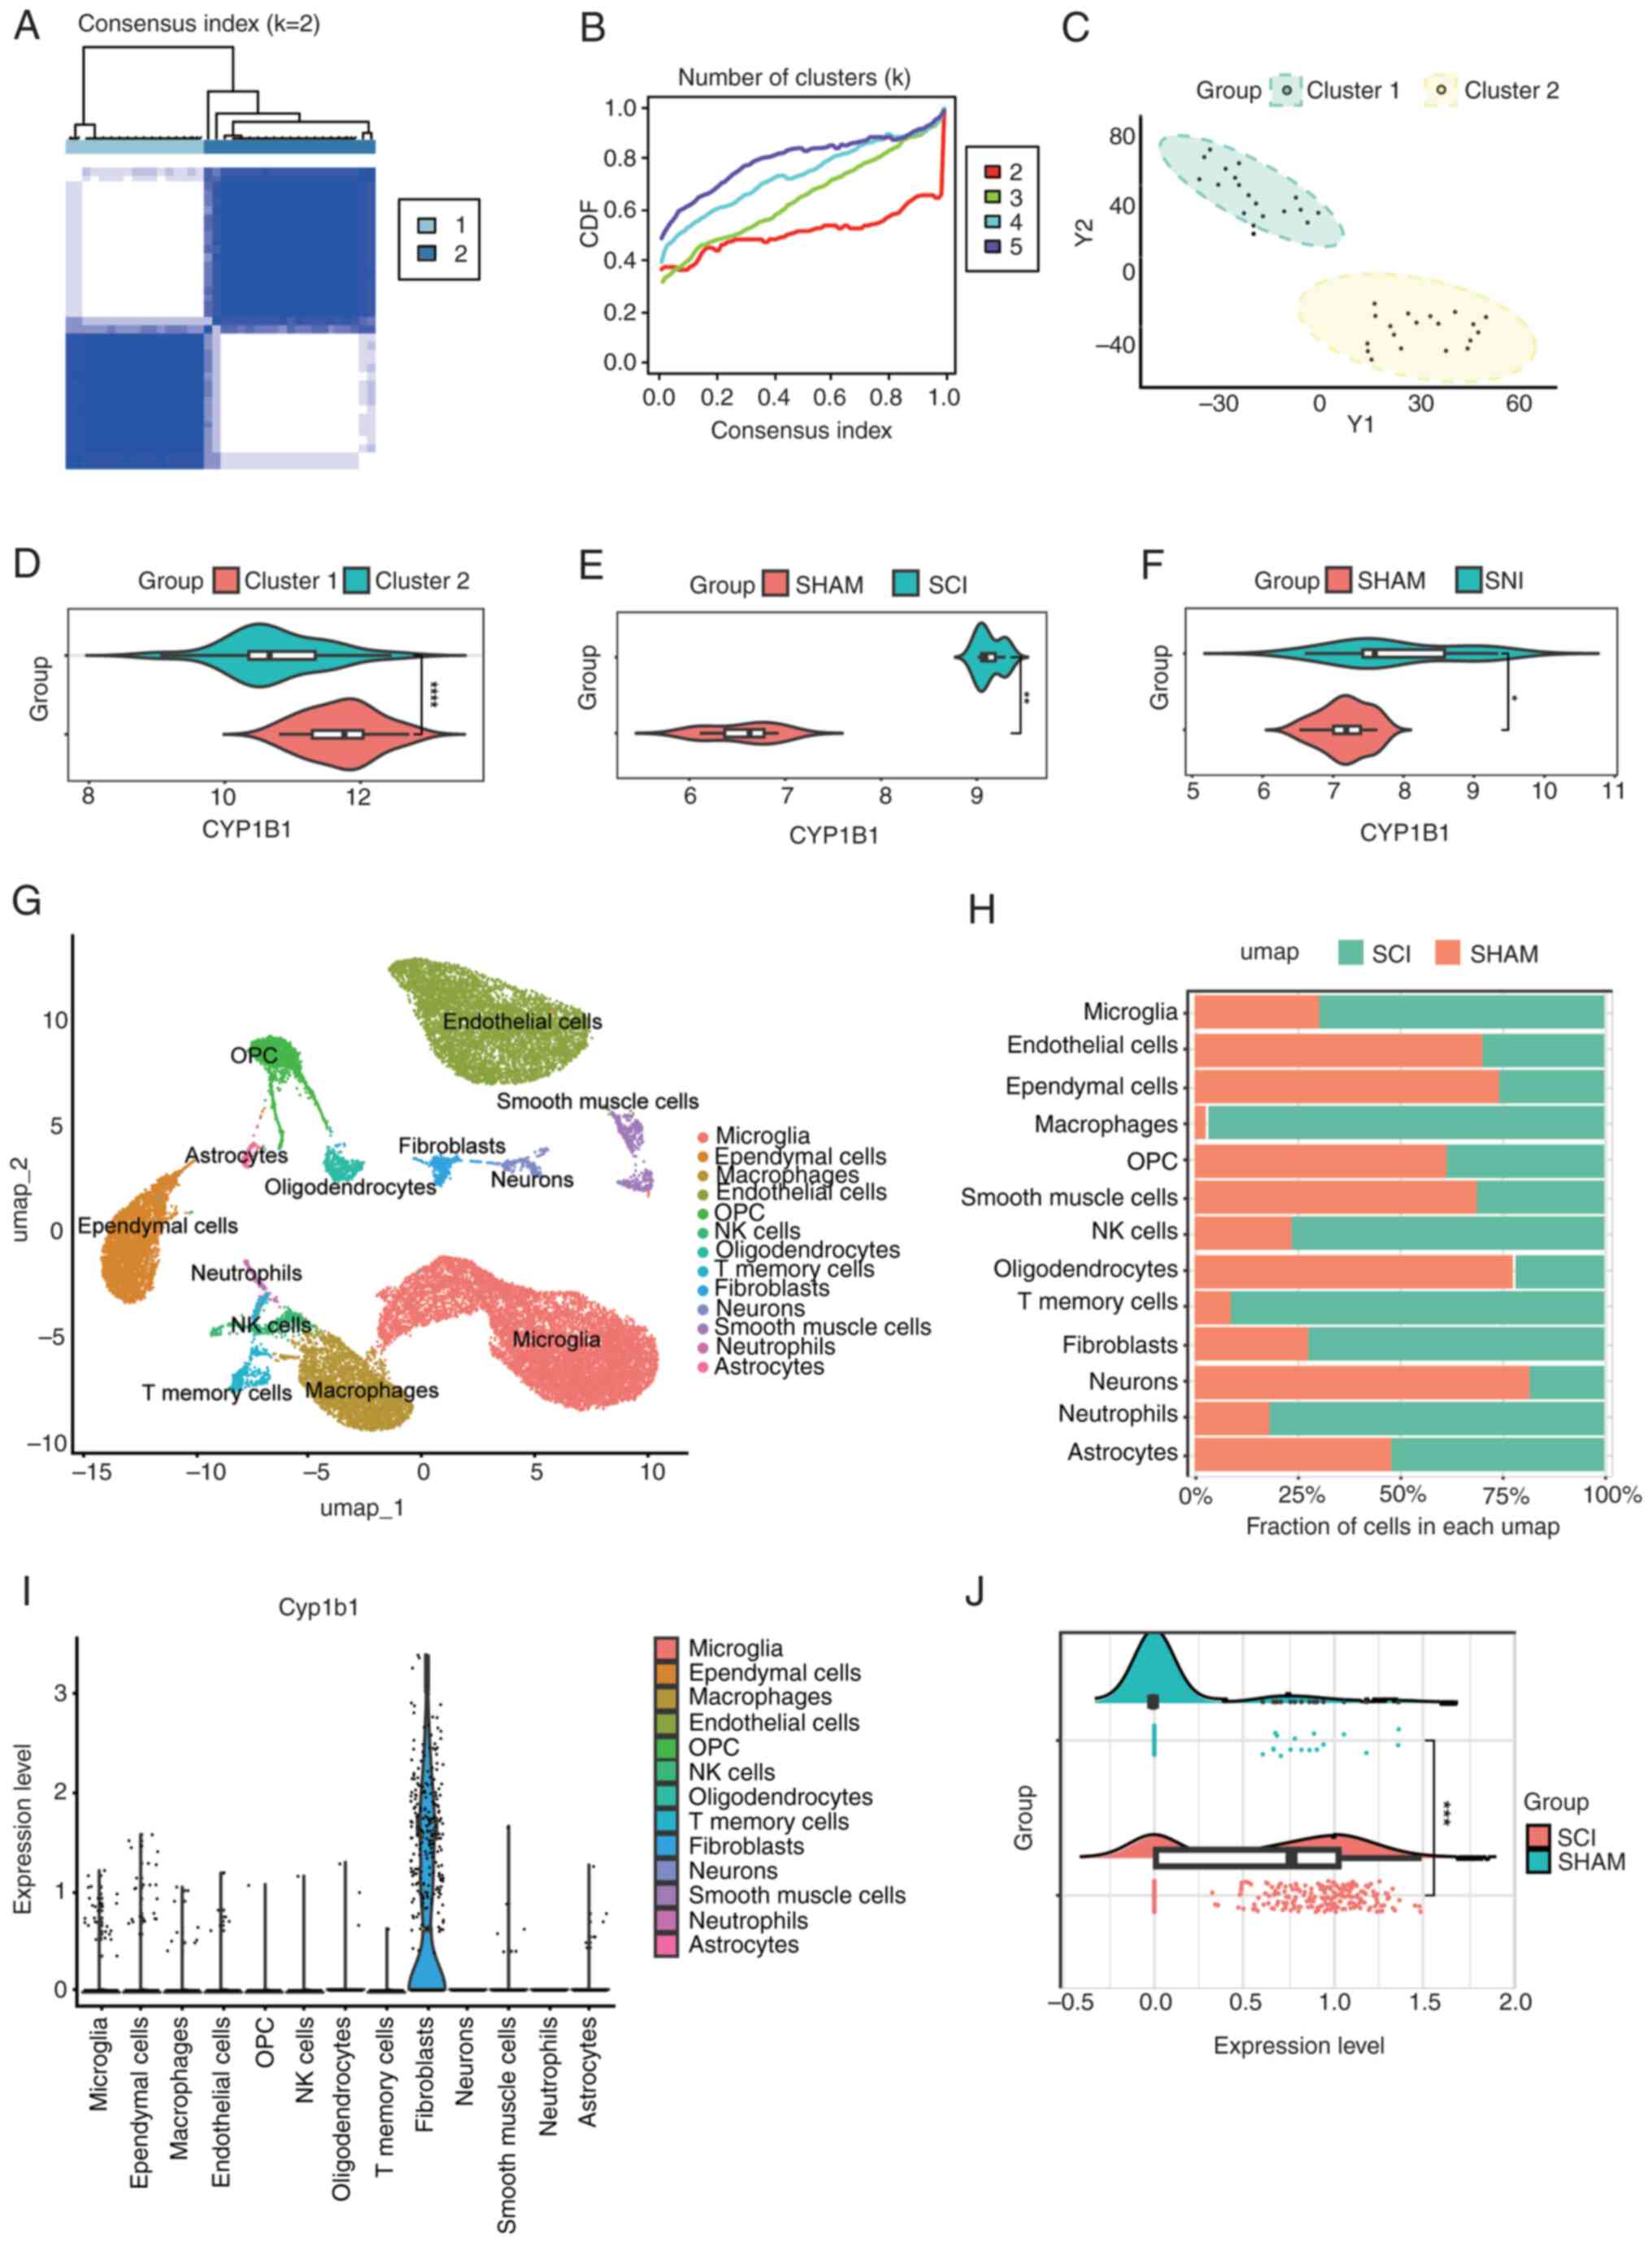 | Figure 6.(A) A clustering heat map of the
samples with the optimal clustering number set to k=2. (B) CDF
curve for various values of k, constrained within the minimum range
of the consensus index. (C) Principal component analysis graphs
with the optimal clustering number set to k=2. (D) Differential
expression of CYP1B1 across two distinct clusters. (E) CYP1B1
expression in the GSE171441 dataset. (F) CYP1B1 expression in the
GSE236754 dataset. (G) A total of 13 cell populations were
identified in the single-cell sequencing data from the GSE162610
dataset. (H) Proportion of the 13 cell populations in the two
groups. (I) CYP1B1 expression in 13 cell populations. (J)
Comparison of changes in CYP1B1 levels in fibroblasts of two
groups. *P<0.05, **P<0.01, ***P<0.001 and ****P<0.0001.
CDF, cumulative distribution function; CYP1B1, cytochrome P450
family 1 subfamily B member 1; NK, natural killer; OPC,
oligodendrocyte precursor cells; SCI, spinal cord injury; SHAM,
sham surgery group; umap, uniform manifold approximation and
projection; Y1, Principal Component 1; Y2, Principal Component
2. |
Single-cell sequencing analysis
In order to further study cellular infiltration
following SCI and the expression of CYP1B1 in the affected cells,
the single-cell GSE162610 dataset was analyzed, ensuring rigorous
quality control and comprehensive analysis. In the processed ScSCI
dataset, the cell populations were categorized into 13 distinct
clusters (Fig. 6G). The
alterations in the proportions of cells in the SCI group relative
to the Con group were quantified (Fig.
6H). In this analysis, there was an observed increase in
microglia, macrophages, natural killer cells, memory T cells,
fibroblasts, neutrophils and astrocytes in the SCI group compared
with that in the SHAM group. Conversely, there was a relative
decrease in endothelial cells, ependymal cells, oligodendrocyte
precursor cells, oligodendrocytes, smooth muscle cells and neurons.
CYP1B1 exhibited elevated expression levels in fibroblasts compared
with other cell types (Fig. 6I).
Furthermore, compared with that in the SHAM group, the expression
level of fibroblasts in the SCI group was significantly increased
(Fig. 6J).
CYP1B1 expression is elevated in SCI
and activated fibroblasts, with Que effectively inhibiting its
expression
CYP1B1, identified as a prognostic biomarker through
bioinformatics, MR and network pharmacology, and recognized as a
therapeutic target for Que, requires further validation. Upon
successful establishment of the SCI, SCI + Que and SHAM
experimental models, spinal cord tissues were harvested on day 14
post-modeling. The detailed surgical protocol and tissue processing
workflow are schematically illustrated in Fig. 7A. In comparison with the SHAM
group, the SCI and SCI + Que group exhibited decreased MWT and TWLs
on day 14 following surgery. Notably, the MWT and TWL values were
significantly elevated in the SCI + Que group relative to the SCI
group (Fig. 7B and C). The BMS
scores of the Que-treated mice were superior to those of the
SCI-treated mice by day 3 post-SCI surgery, with a statistically
significant difference observed in BMS scores between the two
groups at day 14 (Fig. 7D). These
results suggest that Que may alleviate NP by increasing mechanical
and thermal pain thresholds.
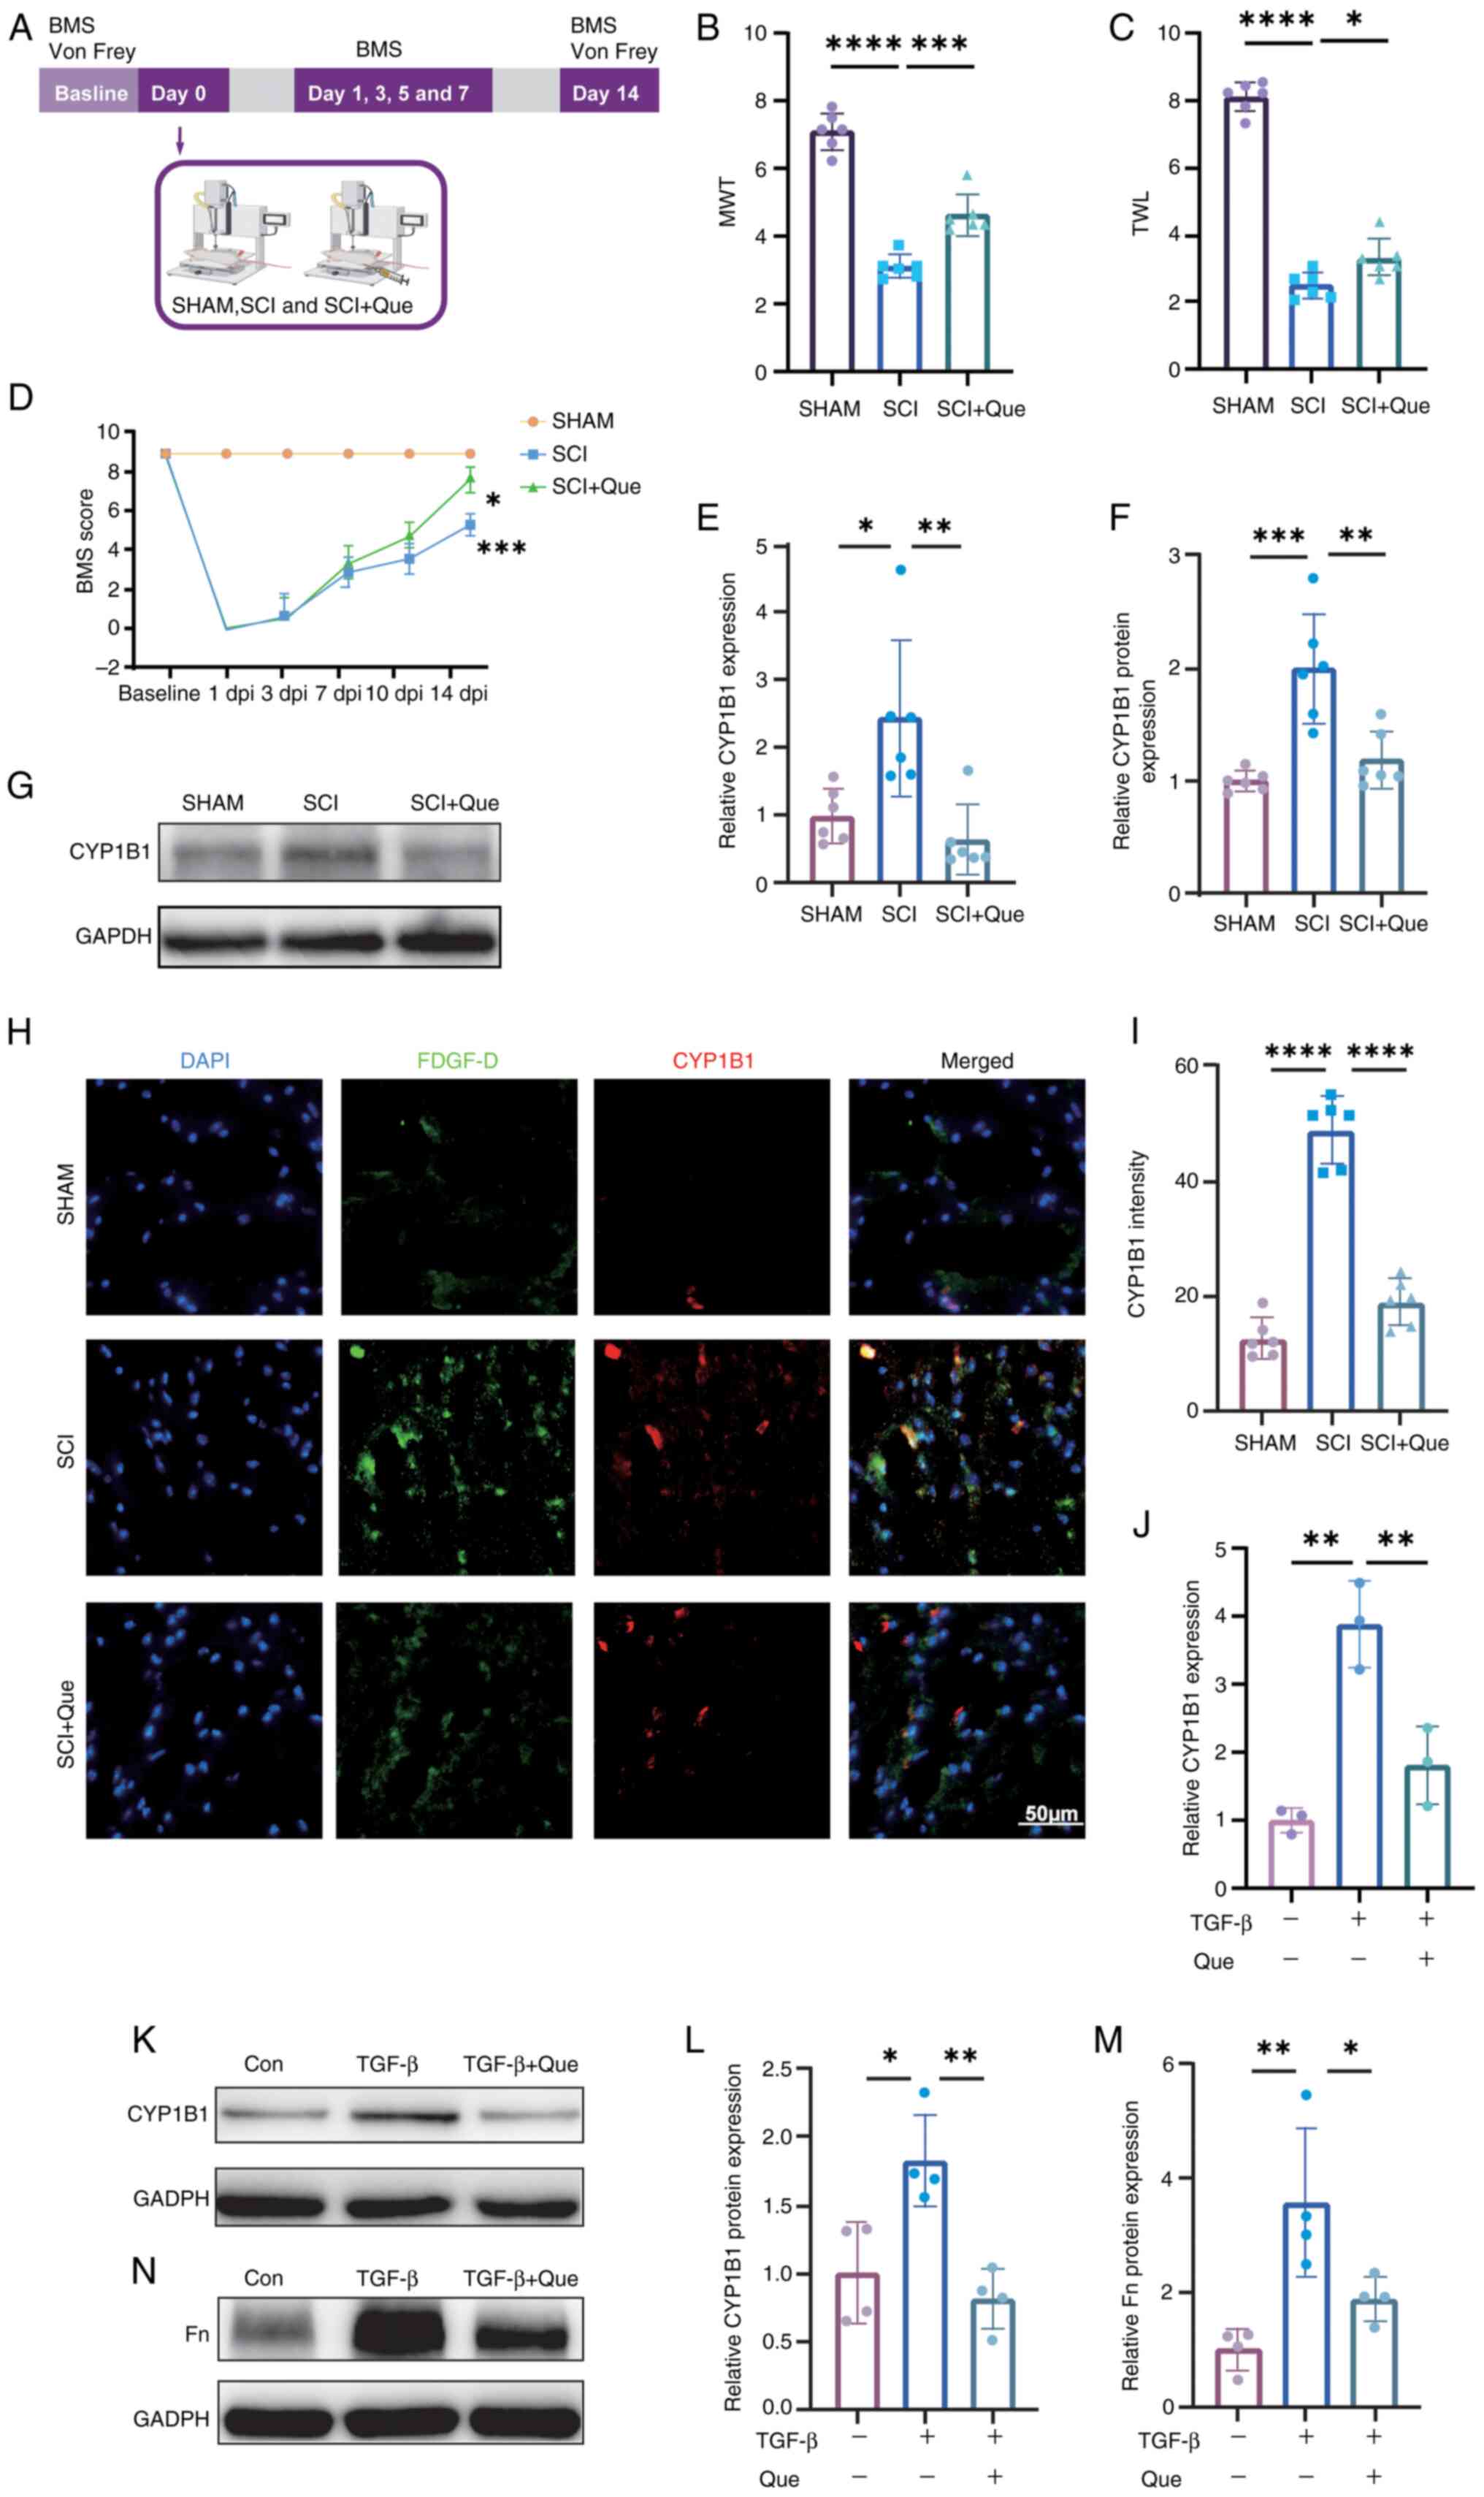 | Figure 7.(A) Flow chart of the animal
experiment. (B) MWT measurements for the SHAM, SCI and SCI + Que
groups were recorded on day 14. (C) TWL for the SHAM, SCI and SCI +
Que groups was also measured on day 14. (D) BMS scores for the
SHAM, SCI and SCI + Que groups were assessed at baseline and on
postoperative days 1, 3, 5, 7, 10 and 14. A statistically
significant difference was observed (***P<0.001) between the SCI
and SHAM groups of mice (n=6 each). Additionally, a significant
difference was noted between the SCI and SCI + Que groups
(*P<0.05), with n=6. (E) RT-qPCR assessment of CYP1B1 mRNA
levels in spinal cord tissues from SHAM, SCI and SCI + Que groups,
with expression levels normalized to GAPDH. (F) Semi-quantitative
analysis of CYP1B1 protein levels in spinal cord tissues from the
SHAM, SCI and SCI + Que groups, with fold-changes normalized to
GAPDH. (G) Western blot analysis was conducted to assess CYP1B1
expression in spinal cord tissues from the SHAM, SCI and SCI + Que
groups on day 14 post-modeling. (H) Immunofluorescence analysis was
performed to assess the expression levels of CYP1B1 and the
fibroblast marker PDGF-D in spinal cord tissues from the SHAM, SCI
and SCI + Que groups, with n=6. Scale bar, 50 µm. (I) Quantitative
fluorescence analysis of CYP1B1 expression was conducted on spinal
cord tissues from the SHAM, SCI and SCI + Que groups. (J) RT-qPCR
evaluation of CYP1B1 mRNA expression in fibroblasts treated under
control conditions, with 10 ng/ml TGF-β and with 10 ng/ml TGF-β +
10 µmol/ml Que, with mRNA levels normalized to GAPDH. (K) Western
blot analysis was performed to evaluate CYP1B1 expression in
fibroblasts subjected to control conditions, 10 ng/ml TGF-β
stimulation or co-treatment with 10 ng/ml TGF-β and 10 µmol/ml Que.
(L) Semi-quantitative evaluation of CYP1B1 protein expression in
fibroblasts subjected to control conditions, treated with 10 ng/ml
TGF-β or treated with 10 ng/ml TGF-β combined with 10 µmol/ml Que,
with protein levels normalized to GAPDH. (M) A semi-quantitative
analysis was conducted on the Fn protein levels in fibroblasts
subjected to control conditions, 10 ng/ml TGF-β treatment or
treatment with a combination of 10 ng/ml TGF-β and 10 µmol/ml Que,
with the resulting fold-changes normalized against GAPDH. (N)
Western blot analysis was utilized to investigate Fn expression in
fibroblasts under control conditions, after treatment with 10 ng/ml
TGF-β or after co-treatment with 10 ng/ml TGF-β and 10 µmol/ml Que.
The data are presented as the mean ± SEM, with sample sizes of n=6
per group for (B, C, D, E, F, G, H and I), n=3 per group for (J)
and n=4 per group for (K, L, M and N). *P<0.05, **P<0.01,
***P<0.001 and ****P<0.0001. BMS, Basso Mouse Scale; Con,
control; CYP1B1, cytochrome P450 family 1 subfamily B member 1;
PDGF-D, platelet-derived growth factor D; dpi, days post-injury;
Fn, Fibronectin; MWT, mechanical withdrawal threshold; Que,
quercetin; RT-qPCR, reverse transcription-quantitative PCR; SCI,
spinal cord injury; SHAM, sham surgery group; TWL, thermal
withdrawal latency. |
In the spinal cord tissues of the SCI group, both
the protein and mRNA levels of CYP1B1 were markedly elevated
compared with those in the SHAM group; however, treatment with Que
significantly attenuated this expression (Fig. 7E-G). Furthermore,
immunofluorescence analysis revealed a substantial increase in
CYP1B1 expression within fibroblasts in the SCI group relative to
the SHAM group, which was effectively reduced by Que treatment
(Fig. 7H and I). In vitro
experiments revealed a substantial elevation in CYP1B1 protein and
mRNA levels in activated fibroblasts, which was subsequently
attenuated by Que (Fig. 7J-L).
Furthermore, fibroblasts exhibiting elevated CYP1B1 expression
exhibited significant upregulation of Fn, and this expression was
likewise inhibited by Que (Fig. 7M and
N).
Discussion
In the present study, the SMR approach was utilized
for the integrated analysis of GWAS summaries pertaining to NP, in
conjunction with transcriptome sequencing data from public
databases. The present multiomics investigation facilitated the
synthesis of genomic and transcriptomic analyses. Specifically,
genes associated with NP risk were identified by employing cis-eQTL
gene variants as IVs and gene expression levels as exposure
factors. Subsequently, transcriptome sequencing analysis was
utilized to identify key modular genes associated with SCI, with
the objective of elucidating the molecular mechanisms common to
both SCI and NP. Furthermore, considering previous research that
has demonstrated the beneficial effects of Que in the context of
SCI and NP (60,61), network pharmacology approaches were
incorporated to explore potential targets of Que among the core
genes implicated in both conditions. The present study offers novel
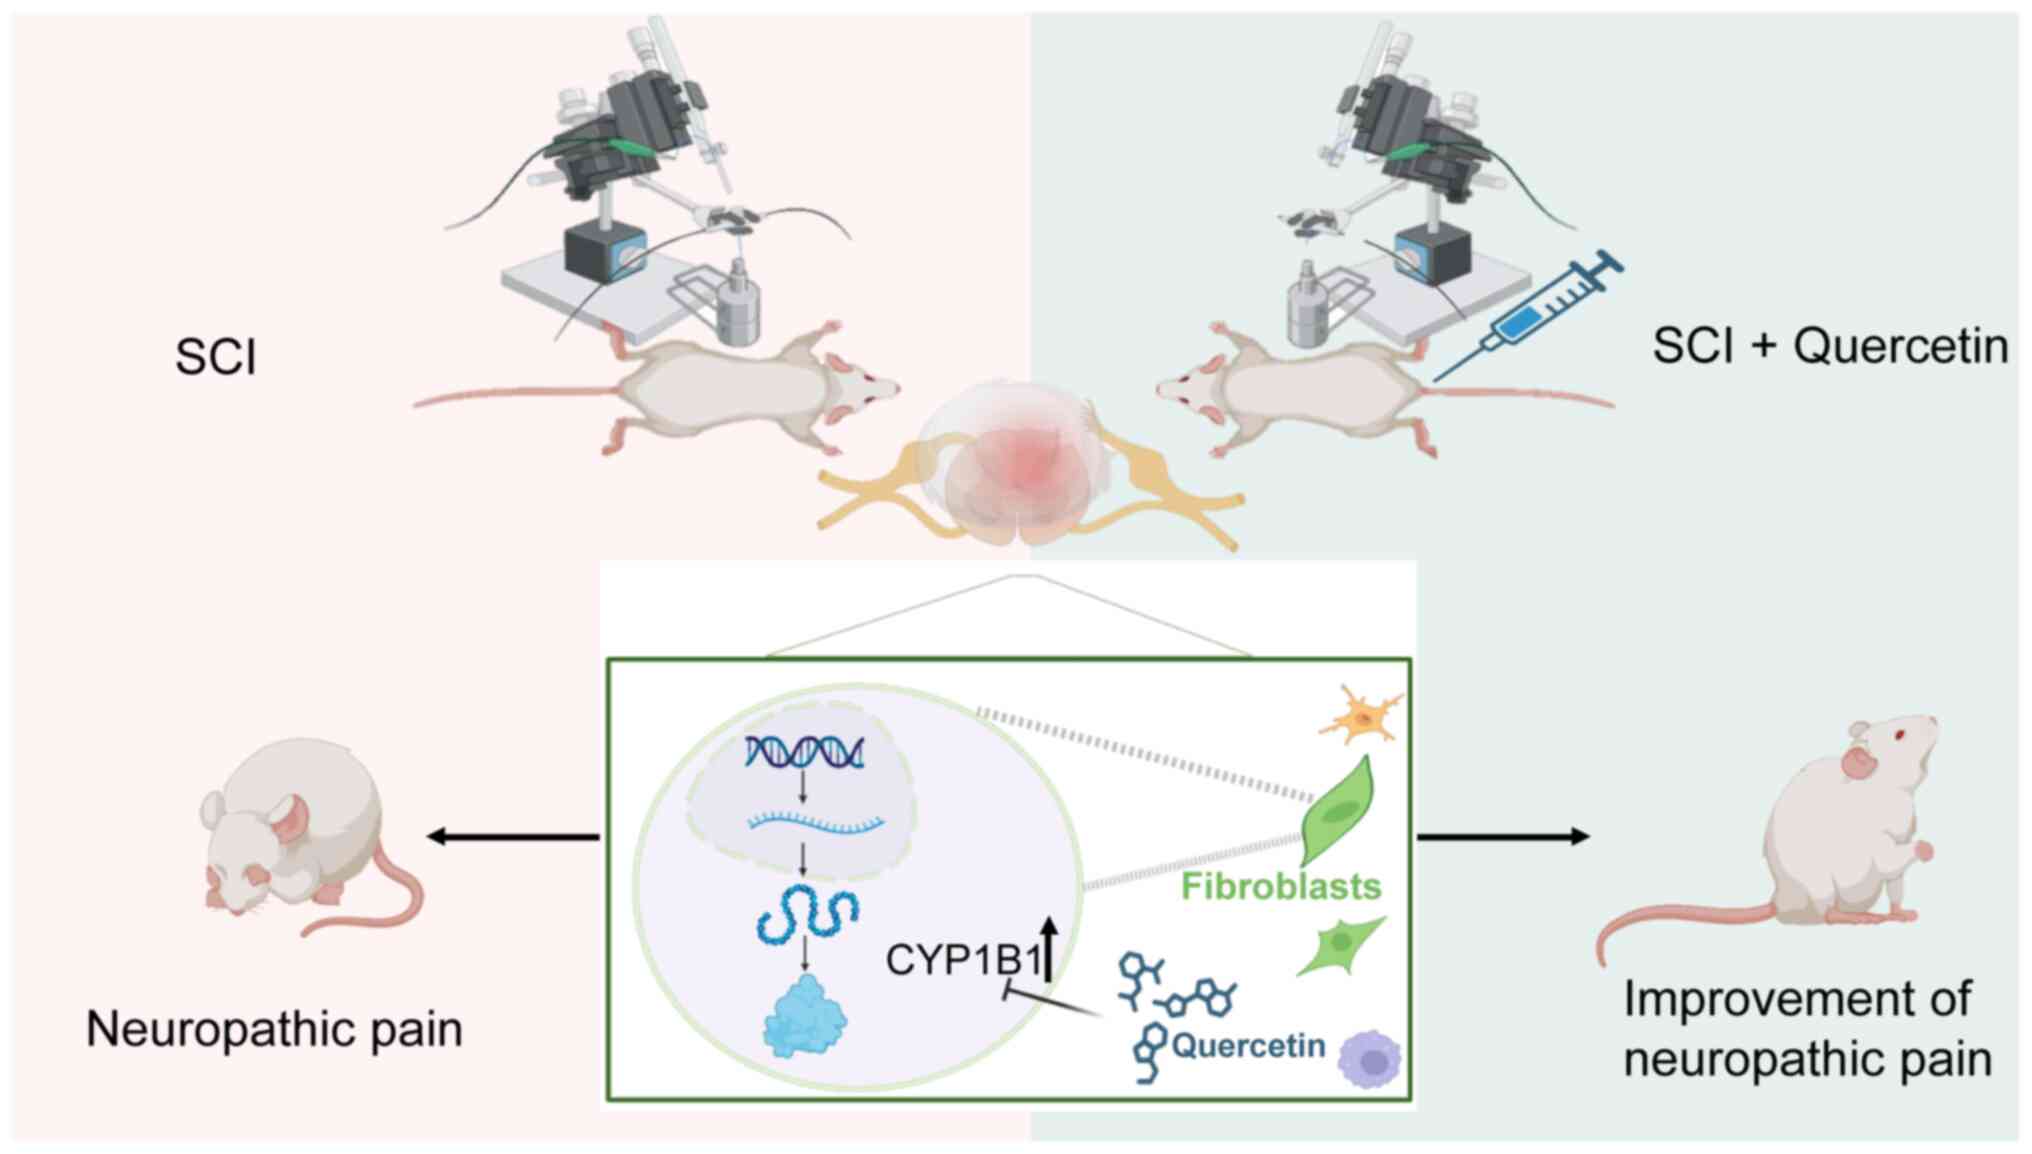
perspectives and identifies potential pathways for improving the
diagnosis and treatment of NP associated with SCI. The mechanism
investigated in this study is that when SCI occurs, neuropathic
pain is associated with an increase in CYP1B1 expression in
fibroblasts. Que alleviates neuropathic pain by inhibiting this
upregulation of CYP1B1 (Fig.
8).
The management of NP poses a considerable clinical
challenge. Despite previous advancements in elucidating the
underlying mechanisms, such as disruptions in afferent pathways due
to alterations in ion channels, elevated levels of spinal
dynorphin, increased glutamate release from spinal primary afferent
endings and the generation of ectopic action potentials, patients
frequently do not receive sufficient analgesia in clinical practice
(62,63). One etiological factor contributing
to NP is SCI, which poses substantial challenges to clinical
management when these conditions occur sequentially. The emergence
of NP in individuals with SCI markedly exacerbates the
deterioration of their quality of life (1,2). The
present study primarily focused on NP following SCI. By comparison,
conditions such as PHN and TN are classified as peripheral
neuropathic pain. Although both PHN and TN are types of NP
(1), the present research
specifically aimed to investigate genes associated with NP in the
context of SCI. Despite differences in etiology between peripheral
and central neuropathic pain, both share common clinical features,
including hyperalgesia and allodynia (63). An SCI mouse model was employed in
the present study. The principal goals were to elucidate the
mechanisms underlying NP after SCI and to identify effective
therapeutic strategies, particularly to determine whether the
specific intervention alleviated NP-related symptoms such as
hyperalgesia and allodynia. Furthermore, both peripheral NP and
central NP share a variety of interconnected cellular and molecular
mechanisms, particularly through interactions among neuroglial
cells and the involvement of neuroinflammatory signaling. While
peripheral NP, exemplified by PHN or TN, and central neuropathic
pain, such as that resulting from SCI, originate from distinct
injury sites, they ultimately engage similar pathways that
culminate in hyperexcitability, sensitization and the chronicity of
pain. A significant mechanism underlying these processes is the
activation of neuroglial cells. Following peripheral nerve damage,
satellite glial cells within the dorsal root ganglia become
activated. These glial cells secrete pro-inflammatory cytokines,
including tumor necrosis factor-α, interleukin-1β (IL-1β) and
adenosine triphosphate, which enhance neuronal excitability and
promote peripheral sensitization. In parallel, SCI induces the
activation of microglia and astrocytes in the central nervous
system. Activated microglia release brain-derived neurotrophic
factor and various cytokines, which disrupt inhibitory mechanisms
and facilitate excitatory signaling. Meanwhile, astrocytes play a
crucial role in sustaining a neuroinflammatory response, thereby
contributing to the ongoing central sensitization (64,65).
TN and PHN represent classical models of NP characterized by
distinct clinical phenotypes. A key aim of the present study was to
investigate the shared molecular networks associated with NP,
rather than narrowing the focus to specific etiological subtypes.
Previous studies have infrequently explored the molecular
mechanisms and pathways within the context of these two
interrelated diseases concurrently. By treating these conditions as
distinct yet interconnected entities and analyzing them
collectively, a deeper and more holistic understanding of the
underlying molecular mechanisms and pathways can be achieved. The
simultaneous consideration of these conditions enables a more
profound insight into the progression of NP, from its initial onset
to its manifestation following SCI.
The onset of NP following SCI is markedly associated
with the recruitment and activation of a substantial number of
immune cells, predominantly from the innate immune system. The
inflammation accompanying NP and SCI constitutes a complex process
involving various cell types and a diverse array of inflammatory
cytokines that interact synergistically (66,67).
While the immune response possesses the ability to modulate
inflammation and mitigate its persistence, it may also facilitate
the transition from acute to chronic pain. Empirical evidence
suggests that the immune response serves a notable role in
sustaining persistent pain, with considerable infiltration of
immune cells acting as a primary catalyst for neurodegeneration
subsequent to SCI (68,69).
Inflammation is an adaptive physiological process
that facilitates tissue healing and regeneration. However, if
neuroinflammatory responses persist after the resolution of the
initial inflammatory event, this may lead to the development of
chronic pain (70). The
involvement of fibroblasts in NP following SCI has been
investigated, with a focus on their roles in scar formation,
extracellular matrix remodeling and the secretion of
pro-inflammatory cytokines and chemokines. Fibrotic scars are also
observed following SCI (71,72).
Research indicates that TGF-β serves a crucial role in promoting
the expression of collagen (73),
a recognized marker of fibroblast activation (74). Consequently, in order to replicate
the unique environment associated with SCI in vivo, the
present study employed TGF-β to conduct a functional validation
analysis aimed at assessing fibroblast activation. Furthermore, the
interactions among fibroblasts, immune cells and neurons have been
acknowledged as potential factors influencing the development and
progression of NP post-SCI (75,76).
Research indicates that Fn is predominantly synthesized and
secreted by fibroblasts, serving a crucial function as an
extracellular matrix protein. The presence of Fn within neurons has
the potential to modify neuronal growth and signal transmission.
Furthermore, Fn engages with cell surface receptors, including
integrins, to modulate the expression of genes associated with
pain. This interaction may facilitate inflammation and enhance the
sensitivity of nerve endings, thereby amplifying pain responses
(77,78).
CYP1B1 is an important enzyme involved in the
metabolism of a wide range of endogenous and exogenous substances
(79). Its role in NP following
SCI includes modulating the inflammatory response and regulating
oxidative stress levels. CYP1B1 functions as a regulator of
reactive oxygen species (ROS) (80), facilitating the in vitro
metabolism of arachidonic acid into various metabolites, including
20-hydroxy-eicosatetraenoic acid, which subsequently stimulates
nicotinamide-adenine dinucleotide phosphate oxidase activity and
promotes ROS generation (81). In
the context of brain tissue, testosterone can induce hypertension
and neuroinflammation through its CYP1B1-derived metabolite,
6β-hydroxytestosterone (82). The
present investigation revealed altered expression levels of CYP1B1
following SCI, with single-cell analysis pinpointing its
localization within fibroblasts, thereby indicating a potential
involvement of CYP1B1 in SCI mechanisms. Nevertheless, the specific
role of CYP1B1 in fibroblasts concerning the onset and progression
of NP following SCI remains to be elucidated. In light of these
observations, the present study suggested that the abnormal
activation of fibroblasts and CYP1B1 subsequent to SCI markedly
contributes to the progression of NP, primarily through the
activation of ROS and inflammation, which are key contributors to
neuronal cell injury and death post-SCI (83).
Current clinical strategies for managing NP
post-SCI encompass pharmacological options such as antiepileptic,
antidepressant and opioid medications, alongside
non-pharmacological conditioning techniques, including spinal cord
electrical stimulation, TMS and tDCS (7,8).
However, the mechanisms driving the onset and progression of NP
following SCI remain inadequately elucidated. The majority of
available drugs primarily address symptomatic relief, with limited
capacity for targeting specific underlying mechanisms;
consequently, there exists a considerable gap in effective
treatments aimed at ameliorating NP following SCI (84). Studies suggest that inhibiting
CYP1B1 activity can reduce the production of ROS, subsequently
decreasing oxidative stress-induced neuronal damage and alleviating
NP following SCI (85,86).
Numerous natural compounds exhibit neuroprotective
and anti-inflammatory properties, with notable examples including
resveratrol, curcumin and Que (19,87,88).
In molecular docking experiments, paracetamol, aspirin and caffeine
served as negative control agents. Beyond its neuroprotective and
anti-inflammatory capabilities, Que is also acknowledged for its
antioxidant properties. Research indicates that Que can markedly
enhance the total antioxidant status in both plasma and spinal cord
tissue following SCI, thereby highlighting its potential
therapeutic role for this ailment (89). Que is recognized for its
anti-inflammatory and antioxidant properties, with research
suggesting its therapeutic potential for both general inflammation
and SCI. Que also modulates neuronal receptors, including T-type
calcium channels and cyclooxygenase-2, thereby contributing to the
reduction of central sensitization and the alleviation of
hyperalgesia (90). Furthermore,
it inhibits the expression of inflammatory cytokines such as tumor
necrosis factor-α and IL-1β, thereby mitigating
inflammation-associated neuronal damage (91). Its antioxidative properties
facilitate the clearance of free radicals, consequently reducing
oxidative stress levels (92).
Consequently, the present research revealed that CYP1B1 not only
serves as a biomarker for NP following SCI, but it was also
recognized as a potential target of Que in receptor prediction
analysis. This observation implies that Que might mitigate
oxidative stress through the inhibition of CYP1B1, thereby
providing a theoretical foundation for further exploration of the
role of CYP1B1 in NP following SCI and enhancing the understanding
of the underlying mechanisms involved in NP management after SCI.
Nevertheless, the precise molecular pathways through which Que
inhibits CYP1B1-mediated NP necessitate additional research.
The analysis in the present study predominantly
focused on the mouse SCI dataset (GSE171441) during the subacute
phase, specifically at 14 days post-injury. Correspondingly, animal
experiments were performed utilizing a 14-day SCI model for both
model establishment and experimental validation. This emphasis on
the subacute phase is justified, as oxidative stress is intricately
linked to disease progression, and CYP1B1, recognized as a
biomarker for post-SCI NP, functions as a regulator of ROS
(80). Furthermore, oxidative
stress is acknowledged as a distinguishing feature of the subacute
phase following SCI. Thus, the results of the present study
suggested that oxidative stress is an important factor in the
pathogenesis of post-SCI NP and that attenuation of oxidative
stress during this subacute phase could serve as an effective
therapeutic approach (93).
Building on this premise, the 14-day SCI animal model was employed
to investigate the relevant mechanisms and assess the therapeutic
potential of Que intervention. Additional research is warranted to
explore the mechanisms and associated pharmacological interventions
throughout the chronic phase following the onset and progression of
NP subsequent to SCI.
The present study has a number of limitations.
First, the availability of high-quality human datasets pertaining
to NP after SCI is limited and displays considerable variability.
Drawing on the present findings related to conditions such as PHN
and TN, the shared characteristics of NP were examined and a novel
strategy for managing NP after SCI was introduced. Nonetheless,
additional efforts in accumulating datasets specific to NP after
SCI are required for a deeper understanding of the underlying
mechanisms driving the onset and progression of this condition.
Second, the present investigation primarily concentrated on
elucidating and validating the mechanisms and pharmacological
interventions for NP after SCI during the subacute phase. It is
important to further examine the molecular mechanisms and
therapeutic interventions relevant to other stages, including the
acute and chronic phases. Additionally, the significance of the
core biomarker CYP1B1 and the influence of Que during these
distinct phases warrant further inquiry and confirmation. Third,
the present study investigated the therapeutic effect of Que at a
dose of 7.5 mg/kg twice daily. However, the effects of other doses
were not examined. Future studies will evaluate multiple doses of
Que to determine the optimal therapeutic range, providing a
theoretical basis for its clinical application. Fourth, in
single-cell analysis, no further distinction was made between
myofibroblasts or resting fibroblasts, and in future studies, more
single-cell sequencing datasets should be obtained for
comprehensive analysis of fibroblast subsets. Fifth, in the in
vitro component of the present study, the established
fibroblast activator TGF-β was primarily utilized, and the role of
CYP1B1 in fibroblast responses to other NP-associated stimuli, such
as lipopolysaccharide and H2O2, requires
further investigation. In summary, this integrated multi-omics and
experimental study identifies CYP1B1 as a key mediator of
neuropathic pain (NP) following spinal cord injury, specifically
highlighting its role in fibroblast activation and associated
neuroinflammatory and oxidative pathways. We demonstrate that
quercetin exerts analgesic effects, at least in part, by inhibiting
CYP1B1, providing a mechanistic basis for its neuroprotective
properties. Moreover, these findings not only advance our
understanding of central NP pathogenesis but also support the
therapeutic targeting of CYP1B1, thereby opening new translational
avenues for developing treatments for neuropathic pain after
SCI.
Supplementary Material
Supporting Data
Supporting Data
Acknowledgements
Not applicable.
Funding
Funding was obtained from the Natural Science Foundation of
Guangdong Province (grant no. 2514050000156), the Research Project
of Guangdong Bureau of Traditional Chinese Medicine (grant no.
20251251), the Special Fund for Clinical Scientific Research of
Guangdong Medical Association (grant no. 2024HY-B4001), the Norman
Bethune Foundation Enzer Pain Management Medical Research Program
(grant no. ezmr2023-080), the Education, Teaching and Research
Project of The Third Affiliated Hospital of The Southern Medical
University (grant no. JXY202408), and the Youth Fund Program of
Hainan Provincial Natural Science Foundation of China (grant no.
822QN451).
Availability of data and materials
The data generated in the present study may be
requested from the corresponding author.
Authors' contributions
PZ contributed to the conceptualization,
methodology and data curation of the study. PZ, LL, YC, JiaC, CC,
XZ, JiuC, YD, PS and JZ were responsible for data analysis and
interpretation. PZ, LL, YC, JiaC, ZL, YL, SW, ST, WZ and CC were
responsible for the animal and cell experiments. XZ, JiuC and YD
were responsible for acquiring resources and validation. PZ, ZL and
YL provided administrative oversight. SW, ST and WZ acquired the
funding. PS and JZ supervised the project. PZ, PS and JZ
contributed to the writing, reviewing and editing of the final
manuscript. PZ, LL and YC confirm the authenticity of all the raw
data. All authors have read and approved the final version of the
manuscript.
Ethics approval and consent to
participate
All experimental procedures involving animals were
carried out in strict accordance with the guidelines for the care
and use of laboratory animals and were approved by the
Institutional Animal Care and Use Committee of Daoke Pharmaceutical
Technology (Guangdong) Co., Ltd. (Guangzhou, China; approval no.
IACUC-DK-2024-04-10-01).
Patient consent for publication
Not applicable.
Competing interests
The authors declare that they have no competing
interests.
References
|
1
|
Finnerup NB, Kuner R and Jensen TS:
Neuropathic Pain: From mechanisms to treatment. Physiol Rev.
101:259–301. 2021. View Article : Google Scholar : PubMed/NCBI
|
|
2
|
Burke D, Fullen BM, Stokes D and Lennon O:
Neuropathic pain prevalence following spinal cord injury: A
systematic review and meta-analysis. Eur J Pain. 21:29–44. 2017.
View Article : Google Scholar : PubMed/NCBI
|
|
3
|
Hergenroeder GW, Redell JB, Choi HA,
Schmitt L, Donovan W, Francisco GE, Schmitt K, Moore AN and Dash
PK: Increased levels of circulating glial fibrillary acidic protein
and collapsin response mediator Protein-2 autoantibodies in the
acute stage of spinal cord injury predict the subsequent
development of neuropathic pain. J Neurotraum. 35:2530–2539. 2018.
View Article : Google Scholar
|
|
4
|
Widerström-Noga E: Neuropathic pain and
spinal cord injury: Phenotypes and pharmacological management.
Drugs. 77:967–984. 2017. View Article : Google Scholar
|
|
5
|
Orr MB and Gensel JC: Spinal cord injury
scarring and inflammation: Therapies targeting glial and
inflammatory responses. Neurotherapeutics. 15:541–553. 2018.
View Article : Google Scholar : PubMed/NCBI
|
|
6
|
O'Shea TM, Burda JE and Sofroniew MV: Cell
biology of spinal cord injury and repair. J Clin Invest.
127:3259–3270. 2017. View Article : Google Scholar
|
|
7
|
Boldt I, Eriks-Hoogland I, Brinkhof MW, de
Bie R, Joggi D and von Elm E: Non-pharmacological interventions for
chronic pain in people with spinal cord injury. Cochrane Database
Syst Rev. 2014:CD0091772014. View Article : Google Scholar : PubMed/NCBI
|
|
8
|
Mehta S, McIntyre A, Janzen S, Loh E and
Teasell R; Spinal Cord Injury Rehabilitation Evidence Team, :
Systematic review of pharmacologic treatments of pain after spinal
cord injury: An update. Arch Phys Med Rehabil. 97:1381–1391.e1.
2016. View Article : Google Scholar
|
|
9
|
Loh E, Mirkowski M, Agudelo AR, Allison
DJ, Benton B, Bryce TN, Guilcher S, Jeji T, Kras-Dupuis A,
Kreutzwiser D, et al: The CanPain SCI clinical practice guidelines
for rehabilitation management of neuropathic pain after spinal cord
injury: 2021 update. Spinal Cord. 60:548–566. 2022. View Article : Google Scholar : PubMed/NCBI
|
|
10
|
Liu C, Liu DQ, Tian YK, Mei W, Tian XB, Xu
AJ and Zhou YQ: The emerging role of quercetin in the treatment of
chronic pain. Curr Neuropharmacol. 20:2346–2353. 2022. View Article : Google Scholar
|
|
11
|
Yang H, Yang T, Heng C, Zhou Y, Jiang Z,
Qian X, Du L, Mao S, Yin X and Lu Q: Quercetin improves
nonalcoholic fatty liver by ameliorating inflammation, oxidative
stress, and lipid metabolism in db/db mice. Phytother Res.
33:3140–3152. 2019. View Article : Google Scholar : PubMed/NCBI
|
|
12
|
Gao W, Zan Y, Wang ZJ, Hu XY and Huang F:
Quercetin ameliorates paclitaxel-induced neuropathic pain by
stabilizing mast cells, and subsequently blocking PKCε-dependent
activation of TRPV1. Acta Pharmacol Sin. 37:1166–1177. 2016.
View Article : Google Scholar : PubMed/NCBI
|
|
13
|
Wang R, Qiu Z, Wang G, Hu Q, Shi N, Zhang
Z, Wu Y and Zhou C: Quercetin attenuates diabetic neuropathic pain
by inhibiting mTOR/p70S6K pathway-mediated changes of synaptic
morphology and synaptic protein levels in spinal dorsal horn of
db/db mice. Eur J Pharmacol. 882:1732662020. View Article : Google Scholar
|
|
14
|
Abbey EL and Rankin JW: Effect of
quercetin supplementation on repeated-sprint performance, xanthine
oxidase activity, and inflammation. Int J Sport Nutr Exerc Metab.
21:91–96. 2011. View Article : Google Scholar : PubMed/NCBI
|
|
15
|
Zhao L, Wang H and Du X: The therapeutic
use of quercetin in ophthalmology: Recent applications. Biomed
Pharmacother. 137:1113712021. View Article : Google Scholar : PubMed/NCBI
|
|
16
|
Li Y, Yao J, Han C, Yang J, Chaudhry MT,
Wang S, Liu H and Yin Y: Quercetin, inflammation and immunity.
Nutrients. 8:1672016. View Article : Google Scholar : PubMed/NCBI
|
|
17
|
Costa LG, Garrick JM, Roquè PJ and
Pellacani C: Mechanisms of neuroprotection by Quercetin:
Counteracting oxidative stress and more. Oxid Med Cell Longev.
2016:29867962016. View Article : Google Scholar : PubMed/NCBI
|
|
18
|
Shao Z, Wang B, Shi Y, Xie C, Huang C,
Chen B, Zhang H, Zeng G, Liang H, Wu Y, et al: Senolytic agent
Quercetin ameliorates intervertebral disc degeneration via the
Nrf2/NF-κB axis. Osteoarthritis Cartilage. 29:413–422. 2021.
View Article : Google Scholar : PubMed/NCBI
|
|
19
|
Chiang MC, Tsai TY and Wang CJ: The
potential benefits of quercetin for brain health: A review of
Anti-inflammatory and neuroprotective mechanisms. Int J Mol Sci.
24:63282023. View Article : Google Scholar
|
|
20
|
Grewal AK, Singh TG, Sharma D, Sharma V,
Singh M, Rahman MH, Najda A, Walasek-Janusz M, Kamel M, Albadrani
GM, et al: Mechanistic insights and perspectives involved in
neuroprotective action of quercetin. Biomed Pharmacother.
140:1117292021. View Article : Google Scholar : PubMed/NCBI
|
|
21
|
Elsworth B, Lyon B, Alexander T, Liu Y,
Matthews P, Hallett J, Bates P, Palmer T, Haberland V, Smith GD, et
al: The MRC IEU OpenGWAS data infrastructure. bioRxiv. August
10–2020.doi: 10.1101/2020.08.10.244293. View Article : Google Scholar
|
|
22
|
Kurki MI, Karjalainen J, Palta P, Sipilä
TP, Kristiansson K, Donner KM, Reeve MP, Laivuori H, Aavikko M,
Kaunisto MA, et al: FinnGen provides genetic insights from a
well-phenotyped isolated population. Nature. 613:508–518. 2023.
View Article : Google Scholar : PubMed/NCBI
|
|
23
|
Võsa U, Claringbould A, Westra HJ, Bonder
MJ, Deelen P, Zeng B, Kirsten H, Saha A, Kreuzhuber R, Yazar S, et
al: Large-scale cis- and trans-eQTL analyses identify thousands of
genetic loci and polygenic scores that regulate blood gene
expression. Nat Genet. 53:1300–1310. 2021.
|
|
24
|
Kyritsis N, Torres-Espín A, Schupp PG,
Huie JR, Chou A, Duong-Fernandez X, Thomas LH, Tsolinas RE,
Hemmerle DD, Pascual LU, et al: Diagnostic blood RNA profiles for
human acute spinal cord injury. J Exp Med. 218:e202017952021.
View Article : Google Scholar : PubMed/NCBI
|
|
25
|
Milich LM, Choi JS, Ryan C, Cerqueira SR,
Benavides S, Yahn SL, Tsoulfas P and Lee JK: Single-cell analysis
of the cellular heterogeneity and interactions in the injured mouse
spinal cord. J Exp Med. 218:e202100402021. View Article : Google Scholar : PubMed/NCBI
|
|
26
|
Patel M, Li Y, Anderson J, Castro-Pedrido
S, Skinner R, Lei S, Finkel Z, Rodriguez B, Esteban F, Lee KB, et
al: Gsx1 promotes locomotor functional recovery after spinal cord
injury. Mol Ther. 29:2469–2482. 2021. View Article : Google Scholar : PubMed/NCBI
|
|
27
|
Ghazisaeidi S, Muley MM, Tu Y, Finn DP,
Kolahdouzan M, Pitcher GM, Kim D, Sengar AS, Ramani AK, Brudno M
and Salter MW: Conserved transcriptional programming across sex and
species after peripheral nerve injury predicts treatments for
neuropathic pain. Br J Pharmacol. 180:2822–2836. 2023. View Article : Google Scholar
|
|
28
|
Zhu Z, Zhang F, Hu H, Bakshi A, Robinson
MR, Powell JE, Montgomery GW, Goddard ME, Wray NR, Visscher PM and
Yang J: Integration of summary data from GWAS and eQTL studies
predicts complex trait gene targets. Nat Genet May. 48:481–487.
2016. View Article : Google Scholar
|
|
29
|
Langfelder P and Horvath S: WGCNA: An R
package for weighted correlation network analysis. BMC
Bioinformatics. 9:5592008. View Article : Google Scholar : PubMed/NCBI
|
|
30
|
Bardou P, Mariette J, Escudié F, Djemiel C
and Klopp C: Jvenn: An interactive Venn diagram viewer. BMC
Bioinformatics. 15:2932014. View Article : Google Scholar : PubMed/NCBI
|
|
31
|
The Gene Ontology Consortium, . The Gene
Ontology Resource: 20 years and still GOing strong. Nucleic Acids
Res. 47:D330–D338. 2019. View Article : Google Scholar : PubMed/NCBI
|
|
32
|
Ogata H, Goto S, Sato K, Fujibuchi W, Bono
H and Kanehisa M: KEGG: Kyoto encyclopedia of genes and genomes.
Nucleic Acids Res. 27:29–34. 1999. View Article : Google Scholar : PubMed/NCBI
|
|
33
|
Li J, Miao B, Wang S, Dong W, Xu H, Si C,
Wang W, Duan S, Lou J, Bao Z, et al: Hiplot: A comprehensive and
easy-to-use web service for boosting publication-ready biomedical
data visualization. Brief Bioinform. 23:bbac2612022. View Article : Google Scholar : PubMed/NCBI
|
|
34
|
Szklarczyk D, Gable AL, Nastou KC, Lyon D,
Kirsch R, Pyysalo S, Doncheva NT, Legeay M, Fang T, Bork P, et al:
The STRING database in 2021: Customizable protein-protein Networks,
and functional characterization of user-uploaded gene/measurement
sets. Nucleic Acids Res. 49:D605–D601. 20212. View Article : Google Scholar
|
|
35
|
Shannon P, Markiel A, Ozier O, Baliga NS,
Wang JT, Ramage D, Amin N, Schwikowski B and Ideker T: Cytoscape: A
software environment for integrated models of biomolecular
interaction networks. Genome Res. 13:2498–2504. 2003. View Article : Google Scholar : PubMed/NCBI
|
|
36
|
Bindea G, Mlecnik B, Tosolini M,
Kirilovsky A, Waldner M, Obenauf AC, Angell H, Fredriksen T,
Lafontaine L, Berger A, et al: Spatiotemporal dynamics of
intratumoral immune cells reveal the immune landscape in human
cancer. Immunity. 39:782–795. 2013. View Article : Google Scholar : PubMed/NCBI
|
|
37
|
Barbie DA, Tamayo P, Boehm JS, Kim SY,
Moody SE, Dunn IF, Schinzel AC, Sandy P, Meylan E, Scholl C, et al:
Systematic RNA interference reveals that oncogenic KRAS-driven
cancers require TBK1. Nature. 462:108–112. 2009. View Article : Google Scholar : PubMed/NCBI
|
|
38
|
Yang C, Delcher C, Shenkman E and Ranka S:
Machine learning approaches for predicting high cost high need
patient expenditures in health care. Biomed Eng Online. 17 (Suppl
1):S1312018. View Article : Google Scholar
|
|
39
|
Sahran S, Albashish D, Abdullah A, Shukor
NA, Hayati Md and Pauzi S: Absolute cosine-based SVM-RFE feature
selection method for prostate histopathological grading. Artif
Intell Med. 87:78–90. 2018. View Article : Google Scholar : PubMed/NCBI
|
|
40
|
Degenhardt F, Seifert S and Szymczak S:
Evaluation of variable selection methods for random forests and
omics data sets. Brief Bioinform. 20:492–503. 2019. View Article : Google Scholar : PubMed/NCBI
|
|
41
|
Friedman J, Hastie T and Tibshirani R:
Regularization paths for generalized linear models via coordinate
descent. J Stat Softw. 33:1–22. 2010. View Article : Google Scholar : PubMed/NCBI
|
|
42
|
Alderden J, Pepper GA, Wilson A, Whitney
JD, Richardson S, Butcher R, Jo Y and Cummins MR: Predicting
pressure injury in critical care patients: A Machine-learning
model. Am J Crit Care. 27:461–468. 2018. View Article : Google Scholar : PubMed/NCBI
|
|
43
|
Yoon S and Kim S: AdaBoost-based multiple
SVM-RFE for classification of mammograms in DDSM. BMC Med Inform
Decis Mak. 9 (Suppl 1):S12009. View Article : Google Scholar : PubMed/NCBI
|
|
44
|
Ding X, Qin J, Huang F, Feng F and Luo L:
The combination of machine learning and untargeted metabolomics
identifies the lipid metabolism-related gene CH25H as a potential
biomarker in asthma. Inflamm Res. 72:1099–1119. 2023. View Article : Google Scholar : PubMed/NCBI
|
|
45
|
Li Y and Song M: Exact Model-free function
inference using uniform marginal counts for null population.
Bioinformatics. 41:btaf1212025. View Article : Google Scholar : PubMed/NCBI
|
|
46
|
Robin X, Turck N, Hainard A, Tiberti N,
Lisacek F, Sanchez JC and Müller M: pROC: An open-source package
for R and S+ to analyze and compare ROC curves. BMC Bioinformatics.
12:772011. View Article : Google Scholar : PubMed/NCBI
|
|
47
|
Daina A, Michielin O and Zoete V:
SwissTargetPrediction: Updated data and new features for efficient
prediction of protein targets of small molecules. Nucleic Acids
Res. 47:W357–W364. 2019. View Article : Google Scholar : PubMed/NCBI
|
|
48
|
Forli S, Huey R, Pique ME, Sanner MF,
Goodsell DS and Olson AJ: Computational Protein-ligand docking and
virtual drug screening with the AutoDock suite. Nat Protoc.
11:905–919. 2016. View Article : Google Scholar
|
|
49
|
Trott O and Olson AJ: AutoDock Vina:
Improving the speed and accuracy of docking with a new scoring
function, efficient optimization, and multithreading. J Comput
Chem. 31:455–461. 2010. View Article : Google Scholar : PubMed/NCBI
|
|
50
|
DeLano WL: Unraveling hot spots in binding
interfaces: Progress and challenges. Curr Opin Struct Biol.
12:14–20. 2002. View Article : Google Scholar
|
|
51
|
Hao Y, Hao S, Andersen-Nissen E, Mauck WM
III, Zheng S, Butler A, Lee MJ, Wilk AJ, Darby C, Zager M, et al:
Integrated analysis of multimodal single-cell data. Cell.
184:3573–3587.e29. 2021. View Article : Google Scholar
|
|
52
|
Butler A, Hoffman P, Smibert P, Papalexi E
and Satija R: Integrating single-cell transcriptomic data across
different conditions, technologies, and species. Nat Biotechnol.
36:411–420. 2018. View Article : Google Scholar
|
|
53
|
Valenzi E, Bulik M, Tabib T, Morse C,
Sembrat J, Trejo Bittar H, Rojas M and Lafyatis R: Single-cell
analysis reveals fibroblast heterogeneity and myofibroblasts in
systemic sclerosis-associated interstitial lung disease. Ann Rheum
Dis. 78:1379–1387. 2019. View Article : Google Scholar : PubMed/NCBI
|
|
54
|
Franzén O, Gan LM and Björkegren JLM:
PanglaoDB: A web server for exploration of mouse and human
single-cell RNA sequencing data. Database (Oxford).
2019:baz0462019.
|
|
55
|
Zhang X, Lan Y, Xu J, Quan F, Zhao E, Deng
C, Luo T, Xu L, Liao G, Yan M, et al: CellMarker: A manually
curated resource of cell markers in human and mouse. Nucleic Acids
Res. 47:D721–D728. 2019. View Article : Google Scholar : PubMed/NCBI
|
|
56
|
Anjaneyulu M and Chopra K: Quercetin, a
bioflavonoid, attenuates thermal hyperalgesia in a mouse model of
diabetic neuropathic pain. Prog Neuropsychopharmacol Biol
Psychiatry. 27:1001–1005. 2003. View Article : Google Scholar : PubMed/NCBI
|
|
57
|
Fan H, Tang HB, Shan LQ, Liu SC, Huang DG,
Chen X, Chen Z, Yang M, Yin XH, Yang H and Hao DJ: Quercetin
prevents necroptosis of oligodendrocytes by inhibiting
macrophages/microglia polarization to M1 phenotype after spinal
cord injury in rats. J Neuroinflammation. 16:2062019. View Article : Google Scholar : PubMed/NCBI
|
|
58
|
Basso DM, Fisher LC, Anderson AJ, Jakeman
LB, McTigue DM and Popovich PG: Basso mouse scale for locomotion
detects differences in recovery after spinal cord injury in five
common mouse strains. J Neurotrauma. 23:635–659. 2006. View Article : Google Scholar
|
|
59
|
Livak KJ and Schmittgen TD: Analysis of
relative gene expression data using Real-time quantitative PCR and
the 2(−Delta Delta C(T)) method. Methods. 25:402–408. 2001.
View Article : Google Scholar : PubMed/NCBI
|
|
60
|
Wang X, Fu Y, Botchway BOA, Zhang Y, Zhang
Y, Jin T and Liu X: Quercetin can improve spinal cord injury by
regulating the mTOR signaling pathway. Front Neurol. 13:9056402022.
View Article : Google Scholar
|
|
61
|
Bannister K, Sachau J, Baron R and
Dickenson AH: Neuropathic Pain: Mechanism-based therapeutics. Annu
Rev Pharmacol Toxicol. 60:257–274. 2020. View Article : Google Scholar
|
|
62
|
Torrance N, Ferguson JA, Afolabi E,
Bennett MI, Serpell MG, Dunn KM and Smith BH: Neuropathic pain in
the community: More under-treated than refractory? Pain.
154:690–699. 2013. View Article : Google Scholar : PubMed/NCBI
|
|
63
|
Jensen TS and Finnerup NB: Allodynia and
hyperalgesia in neuropathic pain: Clinical manifestations and
mechanisms. Lancet Neurol. 13:924–935. 2014. View Article : Google Scholar
|
|
64
|
Szok D, Tajti J, Nyári A and Vécsei L:
Therapeutic approaches for peripheral and central neuropathic pain.
Behav Neurol. 2019:86859542019.
|
|
65
|
McGinnis A and Ji RR: The similar and
distinct roles of satellite glial cells and spinal astrocytes in
neuropathic pain. Cells. 12:9652023. View Article : Google Scholar : PubMed/NCBI
|
|
66
|
Calvo M, Dawes JM and Bennett DL: The role
of the immune system in the generation of neuropathic pain. Lancet
Neurol. 11:629–642. 2012. View Article : Google Scholar
|
|
67
|
Hellenbrand DJ, Quinn CM, Piper ZJ,
Morehouse CN, Fixel JA and Hanna AS: Inflammation after spinal cord
injury: A review of the critical timeline of signaling cues and
cellular infiltration. J Neuroinflammation. 18:2842021. View Article : Google Scholar : PubMed/NCBI
|
|
68
|
Glaser J, Gonzalez R, Perreau VM, Cotman
CW and Keirstead HS: Neutralization of the chemokine CXCL10
enhances tissue sparing and angiogenesis following spinal cord
injury. J Neurosci Res. 77:701–708. 2004. View Article : Google Scholar : PubMed/NCBI
|
|
69
|
Garcia E, Aguilar-Cevallos J, Silva-Garcia
R and Ibarra A: Cytokine and growth factor activation in vivo and
in vitro after spinal cord injury. Mediators Inflamm.
2016:94760202016. View Article : Google Scholar : PubMed/NCBI
|
|
70
|
Sommer C, Leinders M and Üçeyler N:
Inflammation in the pathophysiology of neuropathic pain. Pain.
159:595–602. 2018. View Article : Google Scholar : PubMed/NCBI
|
|
71
|
Tang L, Song Z, Wang J, He S and Liu C:
Regulatory role of neuronal guidance proteins in spinal cord
injury. Neural Regen Res. May 6–2025.(Epub ahead of print). doi:
10.4103/NRR.NRR-D-24-00564. View Article : Google Scholar
|
|
72
|
Neshasteh-Riz A, Ramezani F, Kookli K,
Moghaddas Fazeli S, Motamed A, Nasirinezhad F, Janzadeh A, Hamblin
MR and Asadi M: Optimization of the duration and dose of
photobiomodulation therapy (660 nm Laser) for spinal cord injury in
rats. Photobiomodul Photomed Laser Surg. 40:488–498. 2022.
View Article : Google Scholar : PubMed/NCBI
|
|
73
|
Huang Y, Gao P, Qin T, Chu B, Xu T, Yi J,
Wang Q, Yang Z, Jiang T, Fan J, et al: Delayed inhibition of
collagen deposition by targeting bone morphogenetic protein 1
promotes recovery after spinal cord injury. Matrix Biol. 118:69–91.
2023. View Article : Google Scholar
|
|
74
|
Frangogiannis N: Transforming growth
factor-β in tissue fibrosis. J Exp Med. 217:e201901032020.
View Article : Google Scholar : PubMed/NCBI
|
|
75
|
Zhou X, He X and Ren Y: Function of
microglia and macrophages in secondary damage after spinal cord
injury. Neural Regen Res. 9:1787–1795. 2014. View Article : Google Scholar : PubMed/NCBI
|
|
76
|
Ji RR, Xu ZZ and Gao YJ: Emerging targets
in neuroinflammation-driven chronic pain. Nat Rev Drug Discov.
13:533–548. 2014. View Article : Google Scholar : PubMed/NCBI
|
|
77
|
Schoch HJ, Fischer S and Marti HH:
Hypoxia-induced vascular endothelial growth factor expression
causes vascular leakage in the brain. Brain. 125:2549–2557. 2002.
View Article : Google Scholar : PubMed/NCBI
|
|
78
|
Dina OA, Parada CA, Yeh J, Chen X,
McCarter GC and Levine JD: Integrin signaling in inflammatory and
neuropathic pain in the rat. Eur J Neurosci. 19:634–642. 2004.
View Article : Google Scholar
|
|
79
|
Murray GI, Melvin WT, Greenlee WF and
Burke MD: Regulation, function, and tissue-specific expression of
cytochrome P450 CYP1B1. Annu Rev Pharmacol Toxicol. 41:297–316.
2001. View Article : Google Scholar
|
|
80
|
Lu Y, Nanayakkara G, Sun Y, Liu L, Xu K,
Drummer CIV, Shao Y, Saaoud F, Choi ET, Jiang X, et al:
Procaspase-1 patrolled to the nucleus of proatherogenic lipid
LPC-activated human aortic endothelial cells induces ROS promoter
CYP1B1 and strong inflammation. Redox Biol. 47:1021422021.
View Article : Google Scholar
|
|
81
|
Malik KU, Jennings BL, Yaghini FA,
Sahan-Firat S, Song CY, Estes AM and Fang XR: Contribution of
cytochrome P450 1B1 to hypertension and associated pathophysiology:
A novel target for antihypertensive agents. Prostaglandins Other
Lipid Mediat. 98:69–74. 2012. View Article : Google Scholar
|
|
82
|
Singh P, Dutta SR, Song CY, Oh S, Gonzalez
FJ and Malik KU: Brain Testosterone-CYP1B1 (Cytochrome P450 1B1)
generated metabolite 6β-Hydroxytestosterone promotes neurogenic
hypertension and inflammation. Hypertension. 76:1006–1018. 2020.
View Article : Google Scholar : PubMed/NCBI
|
|
83
|
Yu M, Wang Z, Wang D, Aierxi M, Ma Z and
Wang Y: Oxidative stress following spinal cord injury: From
molecular mechanisms to therapeutic targets. J Neurosci Res.
101:1538–1554. 2023. View Article : Google Scholar : PubMed/NCBI
|
|
84
|
Fakhri S, Abbaszadeh F and Jorjani M: On
the therapeutic targets and pharmacological treatments for pain
relief following spinal cord injury: A mechanistic review. Biomed
Pharmacother. 139:1115632021. View Article : Google Scholar : PubMed/NCBI
|
|
85
|
Sun L, Zhang J, Niu C, Deering-Rice CE,
Hughen RW, Lamb JG, Rose K, Chase KM, Almestica-Roberts M, Walter
M, et al: CYP1B1-derived epoxides modulate the TRPA1 channel in
chronic pain. Acta Pharm Sin B. 13:68–81. 2023. View Article : Google Scholar : PubMed/NCBI
|
|
86
|
Falero-Perez J, Sorenson CM and Sheibani
N: Cyp1b1-deficient retinal astrocytes are more proliferative and
migratory and are protected from oxidative stress and inflammation.
Am J Physiol Cell Physiol. 316:C767–C781. 2019. View Article : Google Scholar
|
|
87
|
Lange KW and Li S: Resveratrol,
pterostilbene, and dementia. Biofactors. 44:83–90. 2018. View Article : Google Scholar : PubMed/NCBI
|
|
88
|
Azzini E, Peña-Corona SI, Hernández-Parra
H, Chandran D, Saleena LAK, Sawikr Y, Peluso I, Dhumal S, Kumar M,
Leyva-Gómez G, et al: Neuroprotective and anti-inflammatory effects
of curcumin in Alzheimer's disease: Targeting neuroinflammation
strategies. Phytother Res. 38:3169–3189. 2024. View Article : Google Scholar : PubMed/NCBI
|
|
89
|
Ocal O, Borcek AO, Pasaoglu O, Gundogdu
AC, Kaplanoglu GT and Baykaner MK: Can quercetin be an option for
treatment of spinal cord injury? An experimental study. Turk
Neurosurg. 29:247–253. 2019.PubMed/NCBI
|
|
90
|
Ye G, Lin C, Zhang Y, Ma Z, Chen Y, Kong
L, Yuan L and Ma T: Quercetin alleviates neuropathic pain in the
rat CCI model by mediating AMPK/MAPK pathway. J Pain Res.
14:1289–1301. 2021. View Article : Google Scholar : PubMed/NCBI
|
|
91
|
Fakhri S, Gravandi MM, Abdian S, Moradi SZ
and Echeverría J: Quercetin derivatives in combating spinal cord
injury: A mechanistic and systematic review. Life (Basel).
12:19602022. View Article : Google Scholar : PubMed/NCBI
|
|
92
|
Hou DD, Zhang W, Gao YL, Sun YZ, Wang HX,
Qi RQ, Chen HD and Gao XH: Anti-inflammatory effects of quercetin
in a mouse model of MC903-induced atopic dermatitis. Int
Immunopharmacol. 74:1056762019. View Article : Google Scholar
|
|
93
|
Gao Y, Wang Y, Wu Y and Liu S:
Biomaterials targeting the microenvironment for spinal cord injury
repair: Progression and perspectives. Front Cell Neurosci.
18:13624942024. View Article : Google Scholar
|