Introduction
Oral squamous cell carcinoma (OSCC) is the most
common malignant tumor in the maxillofacial region; globally, there
are 380,000 new cases of OSCC diagnosed and 180,000 OSCC-associated
deaths recorded in 2022 (1).
Although surgery, radiotherapy and chemotherapy have shown efficacy
in early-stage OSCC, the high invasiveness and metastatic tendency
of OSCC often lead to local recurrence and distant dissemination
(2). Therefore, identifying the
molecular mechanisms underlying the malignant progression of OSCC
and developing novel therapeutic strategies is required.
Recently, liquid-liquid phase separation (LLPS) has
emerged as a fundamental paradigm for regulating cellular
functions. Through weak interactions between intrinsically
disordered regions (IDRs), multivalent proteins or nucleic acid
scaffolds, biomacromolecules dynamically undergo LLPS to form
membraneless organelles, and precisely regulate key biological
processes such as transcription, epigenetic modification and signal
transduction (3,4). Accumulating evidence has suggested
that abnormal LLPS contributes to various oncogenic processes,
including the evasion of tumor cell senescence, stemness
maintenance and metastatic spread (5,6). For
example, cancer cells can evade senescence and death by activating
telomerase or via alternative lengthening of telomeres (ALT)
(7). After telomeric DNA damage in
cancer stem cells, ALT-associated proteins undergo LLPS through
interactions between small ubiquitin-like modifiers (SUMOs) and
SUMO-interacting motifs, forming ALT-associated promyelocytic
leukemia bodies that mediate telomere repair (8). Additionally, Lu et al
(9) reported that the
transcriptional coactivator TAZ forms nuclear condensates through
IDR-mediated LLPS, colocalizing with transcriptional complexes such
as TEAD4 and BRD4. Notably, the loss of the phase separation
ability of TAZ can inhibit target gene expression and tumor
metastasis. Beyond transcriptional regulation, LLPS also serves an
important role in post-transcriptional modification. In acute
myeloid leukemia, the m6A reader protein YTHDC1 interacts with
m6A-modified mRNA through LLPS to form nuclear condensates,
regulating RNA splicing and transport (10). Furthermore, LLPS has reshaped the
understanding of signal transduction mechanisms. Tulpule et
al (11) demonstrated that
receptor tyrosine kinases can form membraneless protein granules
through LLPS, enriching the GRB2/SOS1 complex and activating the
RAS/MAPK pathway, challenging the traditional lipid
membrane-dependent signal transduction model.
Notably, LLPS drives biomolecular condensation in
cancer progression, with LLPS-related genes (LLPSRGs) establishing
prognostic value in ovarian (12),
breast (13) and bladder cancer
(14). However, OSCC, a tumor
shaped by unique etiological factors (use of tobacco and alcohol,
human papillomavirus infection) and frequent recurrence, lacks
systematic investigation into LLPS dysregulation. The following
critical gaps in the knowledge persist: i) No specific research has
been conducted to clarify the prognostic value of LLPSRGs in OSCC;
ii) mechanistic links between LLPSRG-mediated dysregulation and
aggressive OSCC phenotypes are undefined. These gaps hinder
therapeutic targeting of LLPS vulnerabilities in this molecularly
complex carcinoma.
The present study aimed to establish the first
dedicated investigation of LLPS in OSCC, with the following
objectives: i) To identify OSCC-specific LLPSRGs through
multi-omics integration; and ii) to elucidate the mechanistic role
of biomolecular condensates in driving OSCC invasion. Ultimately,
by connecting LLPS dynamics to the molecular landscape of OSCC, the
current study intended to discover novel phase separation-derived
biomarkers and therapeutic targets for precision oncology.
Materials and methods
Acquisition of public datasets
LLPSRGs (n=3,633) were retrieved from the Data
Resource of LLPS (DrLLPS; http://llps.biocuckoo.cn/). Transcriptomics profiles
and clinical records from an OSCC cohort (n=302), whose primary
lesion sites were the tongue, base of the tongue, buccal mucosa,
oral cavity, floor of the mouth and gingiva, were obtained from The
Cancer Genome Atlas (TCGA; http://www.cancer.gov/ccg/research/genome-sequencing/tcga).
The GSE213862 dataset from the Gene Expression Omnibus (GEO;
http://www.ncbi.nlm.nih.gov/geo/) was
also acquired, comprising transcriptomics data from 47 pairs of
OSCC tissues and normal mucosal tissues (15).
Identification of two distinct
LLPS-associated molecular clusters
Consensus clustering analysis was conducted using
the R package ‘ConsensusClusterPlus’ (16) to stratify TCGA-OSCC samples into
distinct molecular clusters (C1 and C2) based on the expression
profiles of LLPSRGs. Cluster stability was evaluated by analyzing
the cumulative distribution function (CDF) of the consensus matrix
across multiple k-values. Differentially expressed genes (DEGs)
between C1 and C2 were identified using the R package ‘DESeq2’
(17), based on the criteria of
|log2 fold change (FC)|>1 and P<0.05. Survival analysis
between C1 and C2 were conducted using the R package ‘survival’
(https://github.com/therneau/survival).
Construction of a prognostic
prediction model based on LLPSRGs for OSCC
TCGA-OSCC cohort was randomly divided into training
and validation subsets at a ratio of 7:3. Univariate Cox regression
and LASSO regression analyses (implemented via the R packages
‘survival’ and ‘glmnet’ (https://glmnet.stanford.edu) were applied to the
training cohort to screen seven LLPSRGs significantly associated
with OSCC prognosis. A risk score model was established using
LASSO-derived coefficients, and patients in both the training and
validation cohorts were stratified into high- or low-risk groups
based on the median risk score. Model performance was evaluated
through Kaplan-Meier curve analysis with Wilcoxon test,
time-dependent receiver operating characteristic (ROC) curves,
principal component analysis (PCA) and t-distributed stochastic
neighbor embedding (t-SNE) using ‘survival’, ‘timeROC’ (https://github.com/cran/timeROC), ‘Rtsne’
(https://github.com/jkrijthe/Rtsne)
and the related visualization tool ‘ggplot2’ (https://github.com/tidyverse/ggplot2).
The prognostic nomogram was constructed by integrating the
continuous risk score with established clinical variables:
Tumor-Node-Metastasis (TNM) stage, histological grade and age,
using R package ‘rms’ (https://github.com/harrelfe/rms).
Differential expression analysis and
gene set enrichment analysis (GSEA)
Differential expression analysis between the high-
and low-risk groups was conducted using the R package ‘DESeq2’
(16) and ‘limma’ (https://bioinf.wehi.edu.au/limma), based on the
criteria of P<0.05 and |log2FC|>1. The Minus-vs.-Add (MA)
plot visualizing differential expression patterns between risk
groups was generated using the R package ‘limma’. Gene Ontology
(GO), Kyoto Encyclopedia of Genes and Genomes (KEGG) enrichment
analyses and Hallmark GSEA based on the Molecular Signatures
Database (MsigDB; http://www.gsea-msigdb.org/gsea/msigdb) of DEGs was
conducted using R packages ‘enrichplot’ (https://github.com/YuLab-SMU/enrichplot) and
‘clusterProfiler’ (https://github.com/YuLab-SMU/clusterProfiler).
Public single-cell RNA sequencing
(scRNA-seq) data collection and analysis
The scRNA-seq data analyzed in the present study
were accessible via the GEO accession number, GSE234933 (18). Based on clinical metadata from
GSE234933, samples were categorized into the primary lesion (sample
count, 19; cell count, 123,094) and metastatic lesion (sample
count, 8; cell count, 38,987) groups. The R package ‘Seurat’
(https://github.com/satijalab/seurat;
version 4.3.0) was used for initial quality control removing cells
with <200 detected genes. Validated cell data were integrated
into a Seurat object for downstream analysis. Distinctly expressed
genes were detected with single-cell resolution using the
FindAllMarkers tool implemented in Seurat.
LLPS potential evaluation for model
genes
The GEPIA2 website (http://gepia2.cancer-pku.cn/) (19) was used to compare the relative
expression of model genes in TCGA-OSCC. The IDRs of model genes
were identified using IUPred2, while their disordered binding
regions were characterized via ANCHOR2 analysis through the
IUPred2A platform (https://iupred2a.elte.hu/) (20). LLPS propensity scoring of the model
genes was performed using PhaSePred (http://predict.phasep.pro/) (21), incorporating the following
computational algorithms: catGRANULE, PdPS-10fea, SaPS-10fea,
PdPS-8fea, SaPS-8fea, DeepPhase, Phos, Charged residue, SEG,
Hydropathy, ESpritz-DisProt, PScore and PLAAC.
In vitro droplet formation assay
PHLDB2 protein solutions (cat. no. Ag27331;
Proteintech Group, Inc.) was conjugated with Alexa Fluor 488 (cat.
no. ab236553; Abcam). Fluorescently labeled recombinant PHLDB2
protein was purified and reconstituted in NaCl solutions at
physiologically relevant concentration gradients, ranging from 50
to 500 mM. Subsequently, the preparations were immediately combined
with a phase separation buffer containing 10% glycerol, 50 mM
Tris-HCl (pH 7.4), 1 mM DTT and 10% PEG-8000, serving as a
molecular crowding agent. After incubation at room temperature for
5 min, the mixture was pipetted onto glass slides prepared with
coverslips secured by double-sided adhesive spacers. Imaging was
performed using a confocal microscope (LSM980; Zeiss AG) equipped
with a 63X objective lens.
Cell lines and culture conditions
The present study employed two human OSCC lines:
SCC1 and HSC3, obtained from the University of Michigan (Ann Arbor,
MI, USA). HSC3 cells were cultured in DMEM (cat. no. C11995500BT;
Gibco; Thermo Fisher Scientific, Inc.) and SCC1 cells were cultured
in DMEM/F-12 medium (cat. no. C11330500BT; Gibco; Thermo Fisher
Scientific, Inc.). Both media were supplemented with 10% FBS (cat.
no. 10099-141C; Gibco; Thermo Fisher Scientific, Inc.) and 1%
penicillin-streptomycin (cat. no. 15140122; Gibco; Thermo Fisher
Scientific, Inc.). Cells were maintained at 37°C in a humidified
incubator containing 5% CO2.
Transient small interfering RNA
(siRNA) and PHLDB2-EGFP plasmid transfection
The oligonucleotide sequences for siRNA and the
PHLDB2-EGFP plasmid are provided in Table SI. SCC1 and HSC3 OSCC cells at
60–80% confluence were transfected with PHLDB2-targeting siRNAs or
control siRNAs (50 nM) and the PHLDB2-EGFP plasmid (1 µg/ml) using
Lipofectamine® RNAiMAX (cat. no. 13778150; Invitrogen;
Thermo Fisher Scientific, Inc.) according to the manufacturer's
protocol. Transfection was performed at 37°C for 48 h and
subsequent experiments were conducted 24 h post-transfection.
Fluorescence recovery after
photobleaching (FRAP) analysis
FRAP analysis was performed using an LSM980 confocal
microscope (Zeiss AG). SCC1 cells expressing EGFP-tagged PHLDB2
were visualized with a 63X oil-immersion objective. Phase-separated
condensates were selectively bleached using a 488-nm laser at 98%
intensity. Post-bleaching recovery was tracked by capturing
sequential images at 1-sec intervals for 100 sec. Droplet
fluorescence intensities were analyzed using ZEN Microscopy
Software (version 3.0; Carl Zeiss AG), and recovery kinetics were
plotted with GraphPad Prism 9.0 (Dotmatics).
Reverse transcription-quantitative PCR
(RT-qPCR)
Total RNA isolation was carried out using
TRIzol® reagent (cat. no. 15596018; Invitrogen; Thermo
Fisher Scientific, Inc.), followed by cDNA synthesis using the
PrimeScript RT Reagent Kit (cat. no. RR047A; Takara Bio, Inc.)
according to the manufacturer's protocol. qPCR was conducted on a
Roche LightCycler 96 platform (Roche Diagnostics) employing SYBR
Green PCR Master Mix (cat. no. 11201ES08; Shanghai Yeasen
Biotechnology, Co., Ltd.). The qPCR amplification protocol
consisted of an initial denaturation step at 95°C for 5 min,
followed by 40 cycles of denaturation at 95°C for 10 sec, annealing
at 60°C for 20 sec and extension at 72°C for 20 sec. GAPDH was used
as the reference gene for normalization. Relative gene expression
was calculated using the 2−ΔΔCq method (22). Primer sequences, designed against
GenBank (https://www.ncbi.nlm.nih.gov/genbank) reference data,
are compiled in Table SII.
Western blotting
Protein extraction was performed with ice-cold RIPA
lysis buffer (cat. no. CW2333S; Jiangsu CoWin Biotech Co., Ltd.)
containing protease inhibitor cocktail. Protein concentrations were
determined using a BCA quantification kit (cat. no. CW0014S;
Jiangsu CoWin Biotech Co., Ltd.) according to standardized
protocols. The lysates (control-si 5.26 mg/ml; PHLDB2si-1 4.94
mg/ml; PHLDB2si-2 5.04 mg/ml) were electrophoretically separated by
SDS-PAGE on 10% gels, followed by semi-dry transfer to PVDF
membranes (cat. no. ISEQ00010; MilliporeSigma). The membranes were
then subjected to blocking with 5% milk in TBS with 0.05% Tween at
room temperature for 1 h, and incubated with primary antibodies at
4°C for 16 h. After washing and incubation with HRP-conjugated
secondary antibodies at 25°C for 1 h, immunoreactive bands were
detected using ECL substrate (cat. no. WBKLS0500; MilliporeSigma)
and semi-quantified with a GeneGnome XRQ imaging system (Syngene;
software version, GeneSys 2023). The following primary antibodies
were used: Rabbit polyclonal anti-PHLDB2 (cat. no. ab234885;
1:1,000; Abcam), E-cadherin (cat. no. ab231303; 1:2,000; Abcam),
N-cadherin (cat. no. ab76011; 1:5,000; Abcam), vimentin (cat. no.
ab92547; 1:1,000; Abcam) and mouse monoclonal anti-GAPDH (cat. no.
ab8245; 1:5,000; Abcam). The following secondary antibodies were
used: Goat Anti-Rabbit IgG H&L (HRP) (cat. no. ab205718;
1:10,000; Abcam) and Goat Anti-Mouse IgG H&L (HRP) (cat. no.
ab205719; 1:10,000; Abcam).
Cell Counting Kit-8 (CCK-8) cell
proliferation assay and colony formation assay
Cell proliferation was assessed using the CCK-8
assay. HSC3 and SCC1 cells (2×10³ cells/well) were
plated and treated with 10% CCK-8 reagent (Sigma-Aldrich; Merck
KGaA) in DMEM. Absorbance was measured after a 2 h-incubation to
determine cell viability. For colony formation analysis, after 1
week of culturing cells seeded at an initial density of 1,000 cells
per well in 6-well plates, colonies were fixed with 4%
paraformaldehyde for 20 min and stained with 0.5% crystal violet
(cat. no. C3886; Sigma-Aldrich; Merck KGaA) for 20 min at room
temperature, and images were then captured. Colonies defined as
cell aggregates containing ≥50 cells within a 0.3–1.0 mm diameter
were quantified using ImageJ software (version 1.54p; National
Institutes of Health).
Spheroid formation assay and limiting
dilution assay
Cells were plated in ultra-low attachment 96-well
plates at graded densities (1×10³, 5×10²,
2×10², 1×10² and 5×10¹ per well) using
serum-free DMEM/F-12 containing 2% B27 (cat. no. 17504044; Gibco;
Thermo Fisher Scientific, Inc.), 20 ng/ml hEGF (cat. no. 105-04;
PrimeGene) and 10 ng/ml hFGF (cat. no. 104-02; PrimeGene). Cultures
were maintained under 5% CO2 at 37°C with quintuplicate
wells/density. After a 10-day incubation, images of spheroids were
captured using an inverted light microscope (Zeiss Axio Observer;
Carl Zeiss AG), and quantified using ImageJ software (version
1.54p; National Institutes of Health). Cancer stem cell frequency
was determined using ELDA computational analysis (http://bioinf.wehi.edu.au/software/elda/).
Wound healing assay and invasion
assay
For wound healing evaluation, OSCC cells were
cultured to 90% confluence in 6-well plates, and a linear wound was
introduced to monolayers using a 200-µl pipette tip. Migration
progression was documented at 0, 12, 16 and 24 h intervals through
phase-contrast light microscope (Zeiss Axio Observer; Carl Zeiss
AG), with wound closure quantified using ImageJ software (version
1.54p; National Institutes of Health). For Transwell invasion
assays, the upper chambers were precoated with Matrigel (cat. no.
354234; Corning, Inc.) at 4°C and incubated at 37°C for 30 min.
Subsequently, 2×10⁴ cells/well were loaded into
Matrigel-precoated upper chambers (cat. no. 354234; Corning, Inc.)
in serum-free medium. The lower chambers contained 10% FBS as a
chemoattractant. After a 48-h incubation at 37°C, cells on the
membrane were fixed with 4% paraformaldehyde at room temperature
for 20 min and stained with 0.1% crystal violet for 20 min at room
temperature. Invasive cells were counted under bright-field
microscopy.
RNA-seq
RNA was extracted from SCC1 cells, with RNA purity
quantified by Nanodrop (Thermo Fisher Scientific, Inc.) and
integrity assessed using an Agilent 4200 TapeStation (Agilent
Technologies, Inc.). Libraries were constructed from 1 µg RNA using
the TruSeq Stranded mRNA Library Prep Kit (cat. no. 20020594;
Illumina, Inc.) according to the manufacturer's protocol. Briefly,
mRNA underwent fragmentation using divalent cations, followed by
first-strand cDNA synthesis with reverse transcriptase and
second-strand synthesis using DNA polymerase I/dNTPs.
Double-stranded cDNA was processed through end repair, A-tailing
and adapter ligation (200–300 bp size selection). Libraries were
size-selected (200–300 bp) using AMPure XP beads. After 12 cycles
of PCR amplification, final libraries were purified and
quality-controlled using an Agilent 2100 Bioanalyzer High
Sensitivity DNA Assay (cat. no. 5067-4626; Agilent Technologies,
Inc.). The loading concentration of the final library was 14 nM for
control-si group and 15 nM for PHLDB2-si group. Quality-controlled
libraries were pooled and diluted to 1.8 nM in 10 mM Tris-HCl (pH
8.5) based on Qubit dsDNA HS Assay measurements (cat. no. Q32854;
Thermo Fisher Scientific, Inc.). Paired-end sequencing (2×150 bp)
was performed on an Illumina NovaSeq 6000 system using the NovaSeq
6000 SP Reagent Kit v1.5 (100 cycles; cat. no. 20027464) (both from
Illumina, Inc.). Bioinformatics analysis identified DEGs between
the control group and the PHLDB2-knockdown group using DESeq2
(|log2FC|>1; P<0.05), followed by functional enrichment
analysis to characterize biological pathways using the R package
‘clusterProfiler’ (https://github.com/YuLab-SMU/clusterProfiler). Core
PI3K-Akt signaling components were retrieved from the KEGG PI3K-Akt
signaling pathway gene set. Differential expression of these
components between control and PHLDB2 knockdown groups was analyzed
with the R package ‘limma’, followed by visualization as a heatmap
using the R package ‘ggplot2’.
Patients and specimens
The Sun Yat-sen University (SYSU)-OSCC cohort
retrospectively analyzed clinicopathological data from 51
treatment-naïve patients treated between June 2016 and June 2018.
The cohort comprised 35 men and 16 women, with a mean age of 52
years (range: 26–77 years). These data were used for validation in
the present study. All participants underwent surgical resection of
primary tumors with cervical lymph node dissection at the Hospital
of Stomatology, SYSU (Guangzhou, China) with no presurgical
adjuvant therapy. Clinicopathological parameters and survival data
were retrieved through clinical documentation and structured
telephone follow-ups. Tumor staging followed the Union for
International Cancer Control 8th edition TNM guidelines (23). The present study received approval
from the ethics committee of the Hospital of Stomatology, SYSU
(approval no. KQEC202013) and all participants provided written
informed consent.
Immunohistochemical (IHC)
staining
IHC staining was performed on 4-µm-thick
paraffin-embedded tissue sections. Sections were blocked with 10%
goat serum (cat. no. SL038; Beijing Solarbio Science &
Technology Co., Ltd.) in PBS for 30 min at room temperature.
Primary antibodies were diluted as follows: Anti-PHLDB2 (1:50; cat.
no. ab234885; Abcam) and IgG isotype control antibody (1:100; cat.
no. ab172730; Abcam), and incubated overnight at 4°C. Following
primary antibody incubation, sections were incubated with the
appropriate secondary antibody (1:100 dilution) for 30 min at room
temperature. IHC staining was then conducted with anti-rabbit/mouse
HRP/DAB (ABC) detection kits (cat. nos. ab64261 and ab64259; Abcam)
according to the manufacturer's protocol. Secondary antibodies were
diluted as follows: Goat Anti-Rabbit IgG H&L (1:5,000; cat. no.
ab205718; Abcam) and Goat Anti-Mouse IgG H&L (1:5,000; cat. no.
ab205719; Abcam). Tissue section images were acquired using an
Aperio AT2 scanner (Leica Biosystems) with its integrated
microscope and analyzed with ImageJ software (version 1.54p;
National Institutes of Health). IHC scoring followed a four-tier
system based on the staining intensity: 0, Negative; 1, weakly
positive; 2, positive; and 3, strongly positive.
Statistical analysis
Data were processed and analyzed with R (v4.2.2;
http://www.r-project.org) and GraphPad Prism 9.0.
Statistical significance was evaluated via two-tailed tests.
Comparisons between two groups were performed using unpaired
Student's t-test for normally distributed data or Mann-Whitney U
tests for non-normally distributed data. Paired comparisons between
two groups employed paired Student's t-test for normally
distributed data or Wilcoxon signed-rank tests for non-normally
distributed data. Multi-group comparisons were analyzed by one-way
ANOVA with Tukey's post-hoc testing for normally distributed data
with equal variance or Kruskal-Wallis test with Dunn's post-hoc
correction for non-normally distributed data. Normality was
assessed by the Shapiro-Wilk test and homogeneity of variance was
verified using Levene's test. Continuous variables were examined by
Pearson's correlation, and categorical variables were evaluated by
Spearman's correlation. Analysis of paired tumor-normal tissues in
TCGA-OSCC was conducted using the R package ‘TCGAplot’ (https://github.com/tjhwangxiong/TCGAplot). P<0.05
was considered to indicate a statistically significant
difference.
Results
Establishment of two LLPS-related
molecular clusters and construction of a novel prognostic
prediction model based on LLPSRGs for OSCC
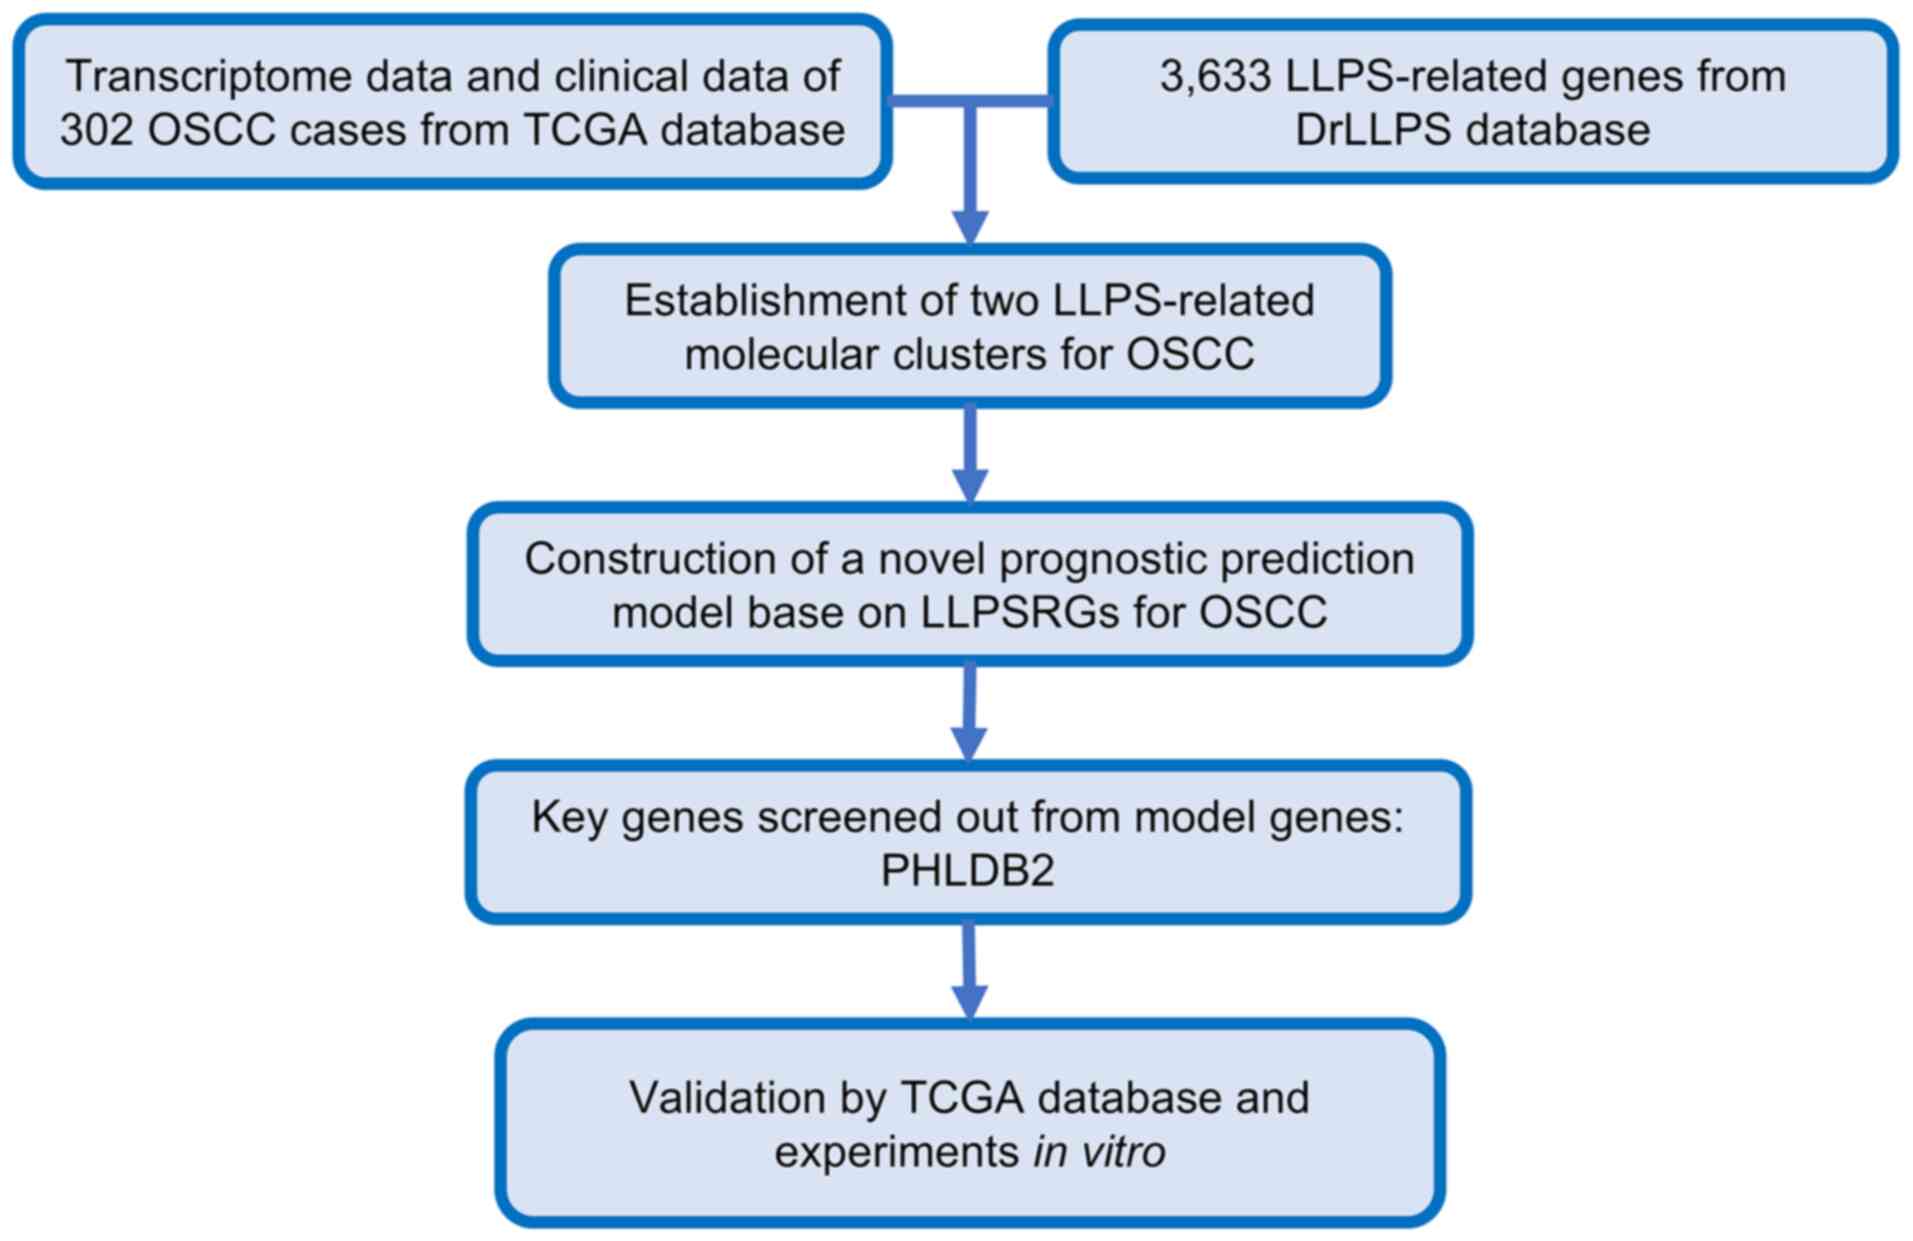
The workflow of the present study is illustrated in
Fig. 1. Through consensus
clustering analysis of 3,633 LLPSRGs from the DrLLPS database of
transcriptomics data from 302 OSCC cases in TCGA, the samples were
successfully stratified into two biologically distinct molecular
clusters, C1 and C2 (Fig. 2A).
Evaluation of the CDF curve confirmed optimal consistency and
cluster stability at k=2 (Fig.
S1A). Further analysis revealed that LLPSRGs were significantly
upregulated in C1 compared with in C2 (Fig. 2B), and C1 patients exhibited
significantly shorter overall survival (OS; Fig. 2C). GO and KEGG enrichment analyses
demonstrated that DEGs in the C1 cluster were predominantly
enriched in biological processes associated with tumor progression,
including ‘cell junction assembly’, ‘PI3K-Akt signaling pathway’
and ‘Wnt signaling pathway’ (Fig. S1B
and C). These findings suggested that dysregulated LLPSRGs may
influence OSCC prognosis by modulating key oncogenic pathways.
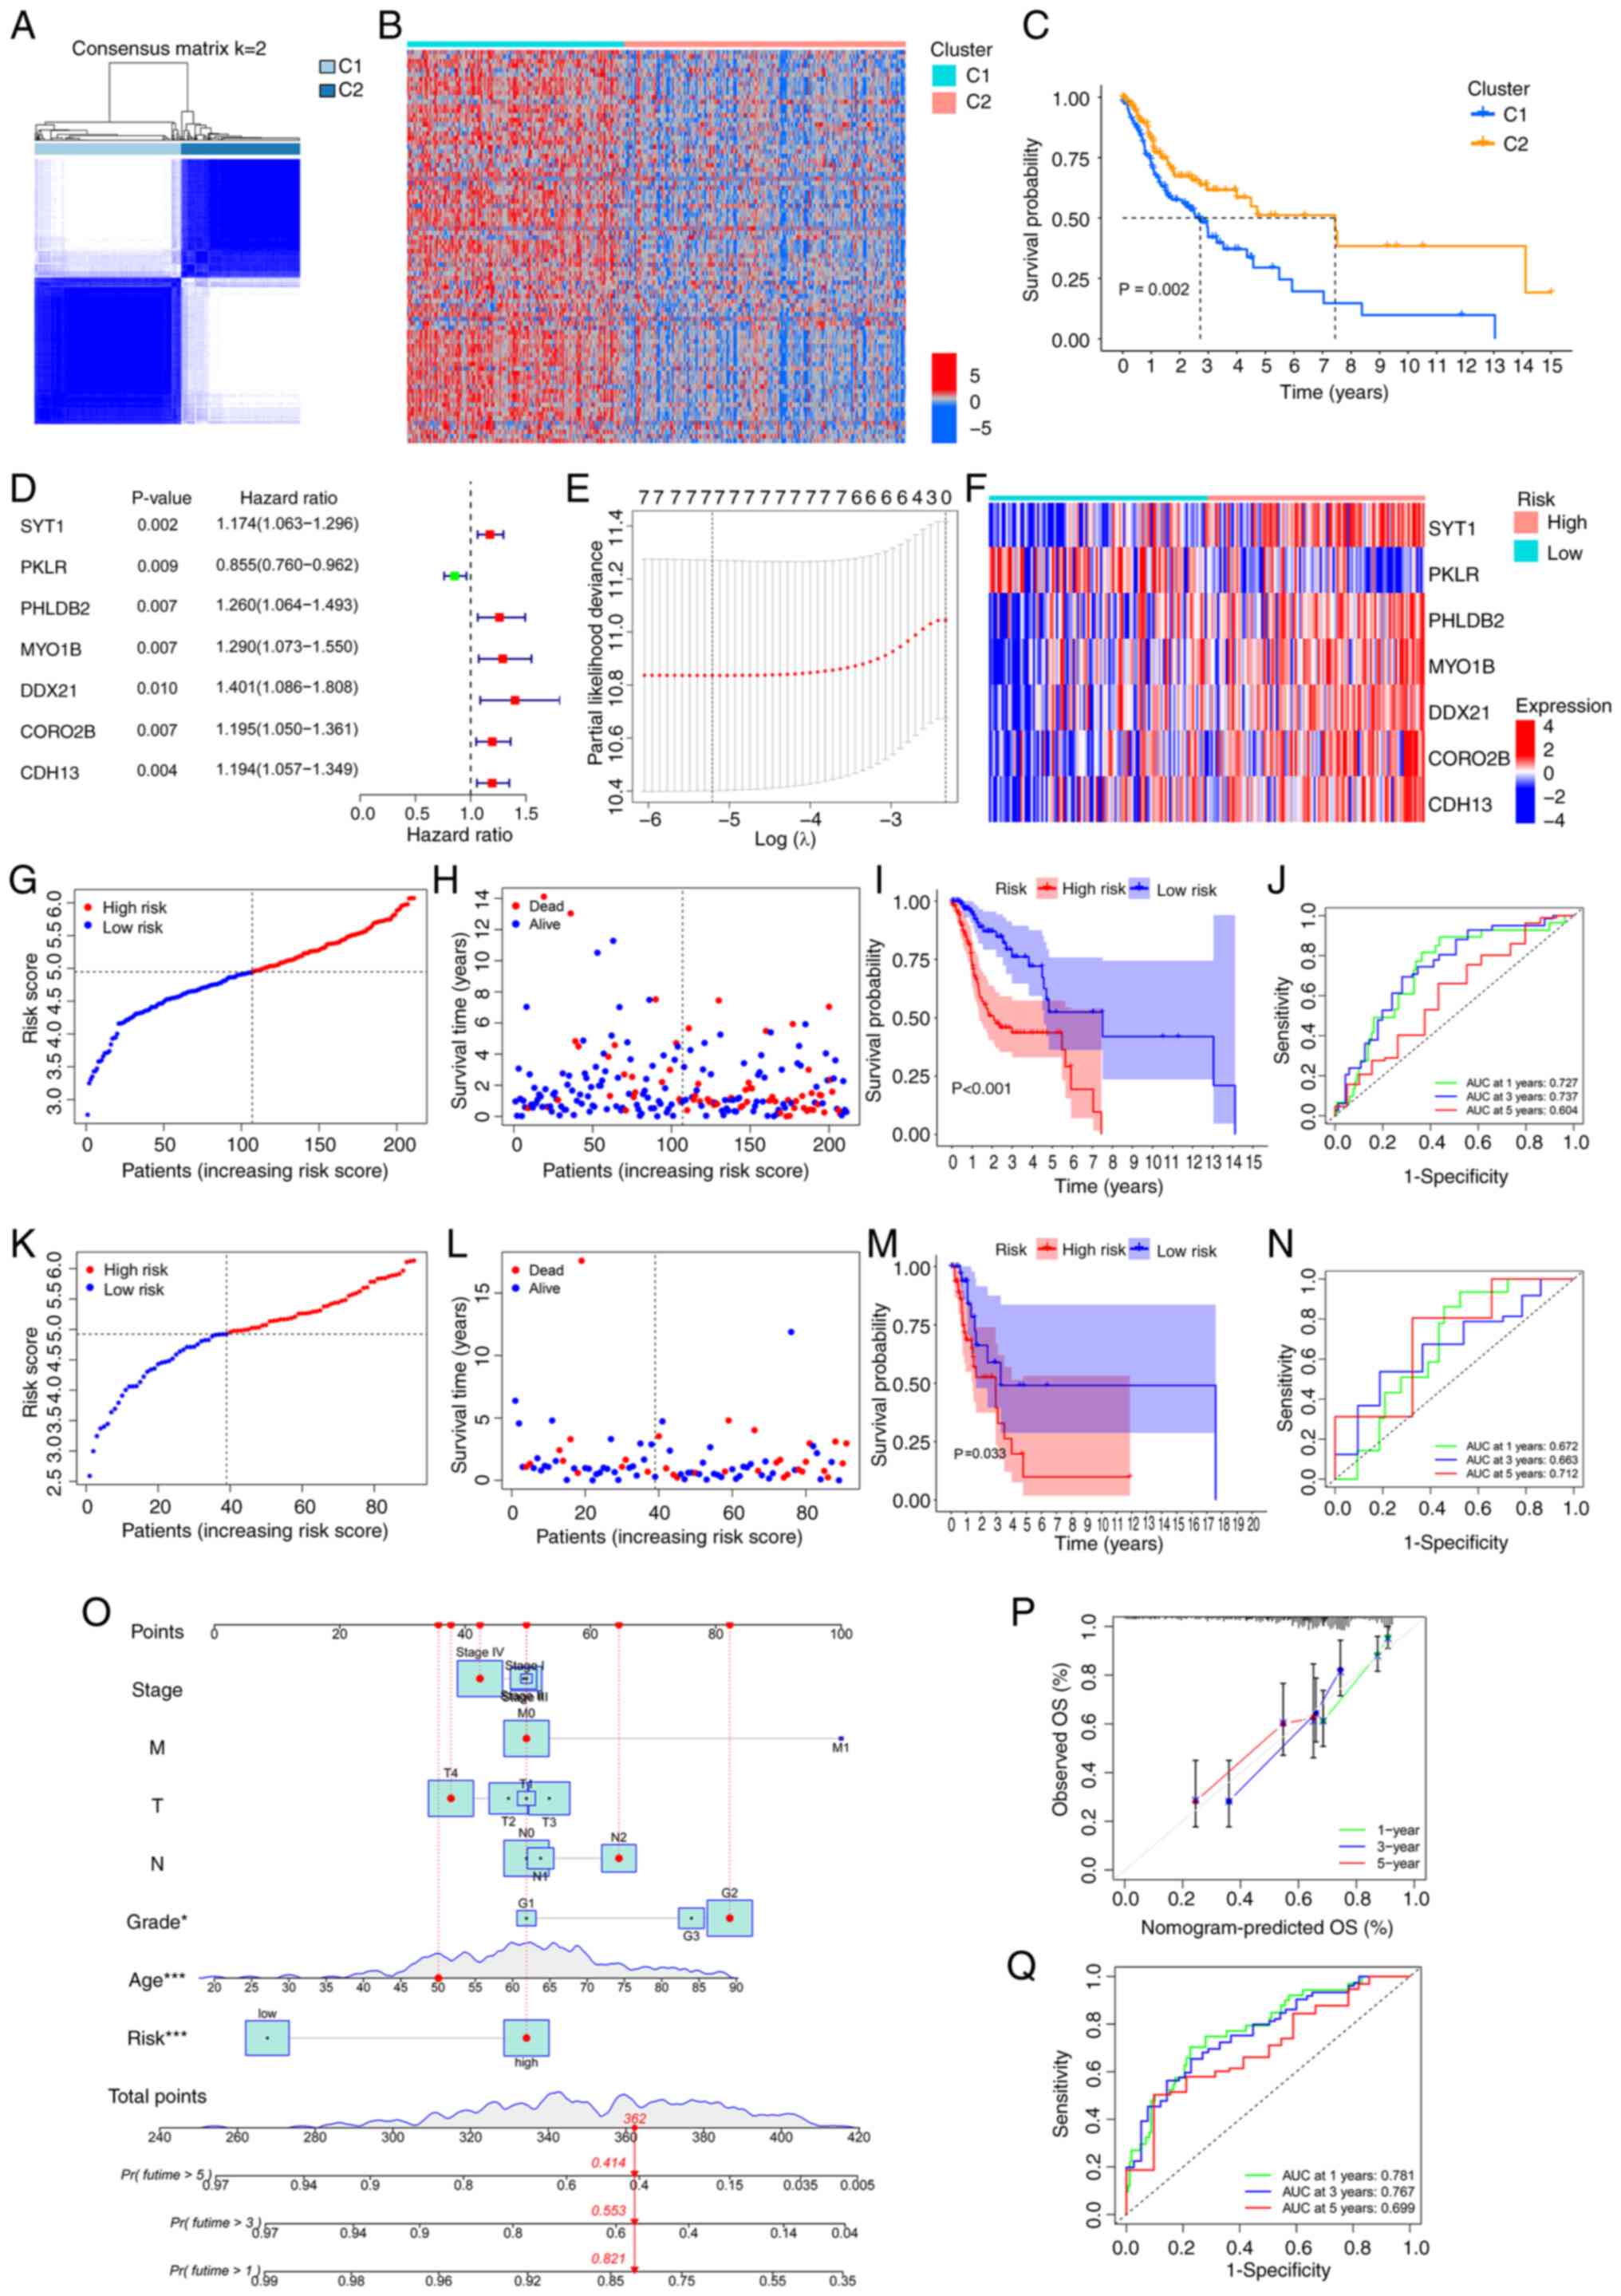 | Figure 2.Establishment of two LLPS-related
molecular clusters and construction of a novel prognostic
prediction model based on LLPSRGs for OSCC. (A) Consensus
clustering matrix heatmap illustrating optimal partitioning (k=2)
of TCGA-OSCC samples based on LLPSRG expression patterns. (B)
Expression profile heatmap of differential genes between C1 and C2
clusters. (C) Kaplan-Meier curves for OS of C1 and C2 clusters. (D)
Univariate Cox regression screening identifying seven
prognostically significant LLPSRGs. (E) Construction of a
prognostic prediction model through LASSO coefficient trajectories
with a vertical line indicating optimal λ selection through 10-fold
cross-validation. (F) Expression profile heatmap of the seven model
genes. Training cohort validation including (G) risk stratification
by median cut-off, (H) survival distribution mapping, (I)
Kaplan-Meier curves for OS of the high- and low-risk groups, and
(J) time-dependent ROC analysis demonstrating predictive accuracy
(AUC values for 1, 3 and 5-year survival). Testing cohort
validation including (K) risk stratification by median cutoff, (L)
survival distribution mapping, (M) Kaplan-Meier curves for OS of
the high- and low-risk groups, and (N) time-dependent ROC analysis
demonstrating predictive accuracy (AUC values for 1, 3 and 5-year
survival). (O) Construction of a prognostic nomogram model
integrating risk score with clinical parameters
(Tumor-Node-Metastasis stage, histological grade and age). (P)
Calibration plots showing concordance between predicted and
observed survival probabilities at 1, 3 and 5-year intervals. (Q)
Time-dependent ROC analysis demonstrating predictive accuracy (AUC
values for 1, 3 and 5-year survival). *P<0.05 and ***P<0.001
by multivariate Cox regression analysis. AUC, area under the curve;
LLPS, liquid-liquid phase separation; LLPSRG, LLPS-related gene;
OS, overall survival; OSCC, oral squamous cell carcinoma; ROC,
receiver operating characteristic; TCGA, The Cancer Genome
Atlas. |
Based on these insights, seven LLPSRGs significantly
associated with OSCC prognosis were identified using Cox
proportional hazards regression (Fig.
2D) and their predictive efficacy was further validated via
LASSO regression (Fig. 2E). To
establish a robust model, TCGA-OSCC cohort was randomly divided
into training (n=211) and validation (n=91) groups at a 7:3 ratio.
A novel prognostic prediction model was developed through LASSO
regression analysis using the training set data, ultimately
yielding the following mathematical formula: RiskScore=Exp(SYT1) ×
0.126671488410991 + Exp(MYO1B) × 0.116232649674581 + Exp(PHLDB2) ×
0.111345681109828 + Exp(CORO2B) × 0.0992669799054353 + Exp(CDH13) ×
0.0701283734822018 + Exp(DDX21) × 0.0342177920472229 + Exp(PKLR) ×
−0.202003545600354. After stratifying TCGA-OSCC patients into high-
and low-risk groups, the gene expression heatmap reveals distinct
expression patterns of model genes demonstrating clear distinctions
between the two subgroups (Fig.
2F).
To validate the predictive performance of the
developed model, risk scores were calculated for all patients, with
samples stratified into high- and low-risk groups based on median
values (Fig. 2G and K). PCA and
t-SNE revealed distinct spatial separation between the two groups
in gene expression profiles (Fig.
S2A-D), confirming the biological discriminative power of the
model. Survival analysis demonstrated markedly higher mortality in
the high-risk group (Fig. 2H and
L) and significantly reduced OS rates compared with those in
the low-risk group (Fig. 2I and
M). Time-dependent ROC curves showed area under the curve (AUC)
values of 0.727, 0.737 and 0.604 for 1-, 3- and 5-year survival
predictions in the training set, and 0.672, 0.663 and 0.712 in the
validation set, indicating high sensitivity and specificity
(Fig. 2J and N).
To enhance clinical applicability, the risk score
was integrated with traditional clinicopathological parameters (TNM
stage, histological grade and age) to construct a nomogram model
(Fig. 2O). Calibration curves
demonstrated strong concordance between predicted and observed
survival probabilities at 1, 3 and 5 years (Fig. 2P). The nomogram model exhibited
significantly improved AUC values compared with the risk score
alone (Fig. 2Q), highlighting its
superior accuracy in individualized prognosis prediction. These
results underscore the potential of the LLPSRG-based prognostic
model to refine clinical risk stratification and inform targeted
therapeutic strategies for OSCC.
Functional enrichment analysis of DEGs
between high- and low-risk groups
To investigate the mechanistic basis of survival
disparities between the high- and low-risk cohorts, comparative
expression profiling of LLPSRGs across both groups was conducted.
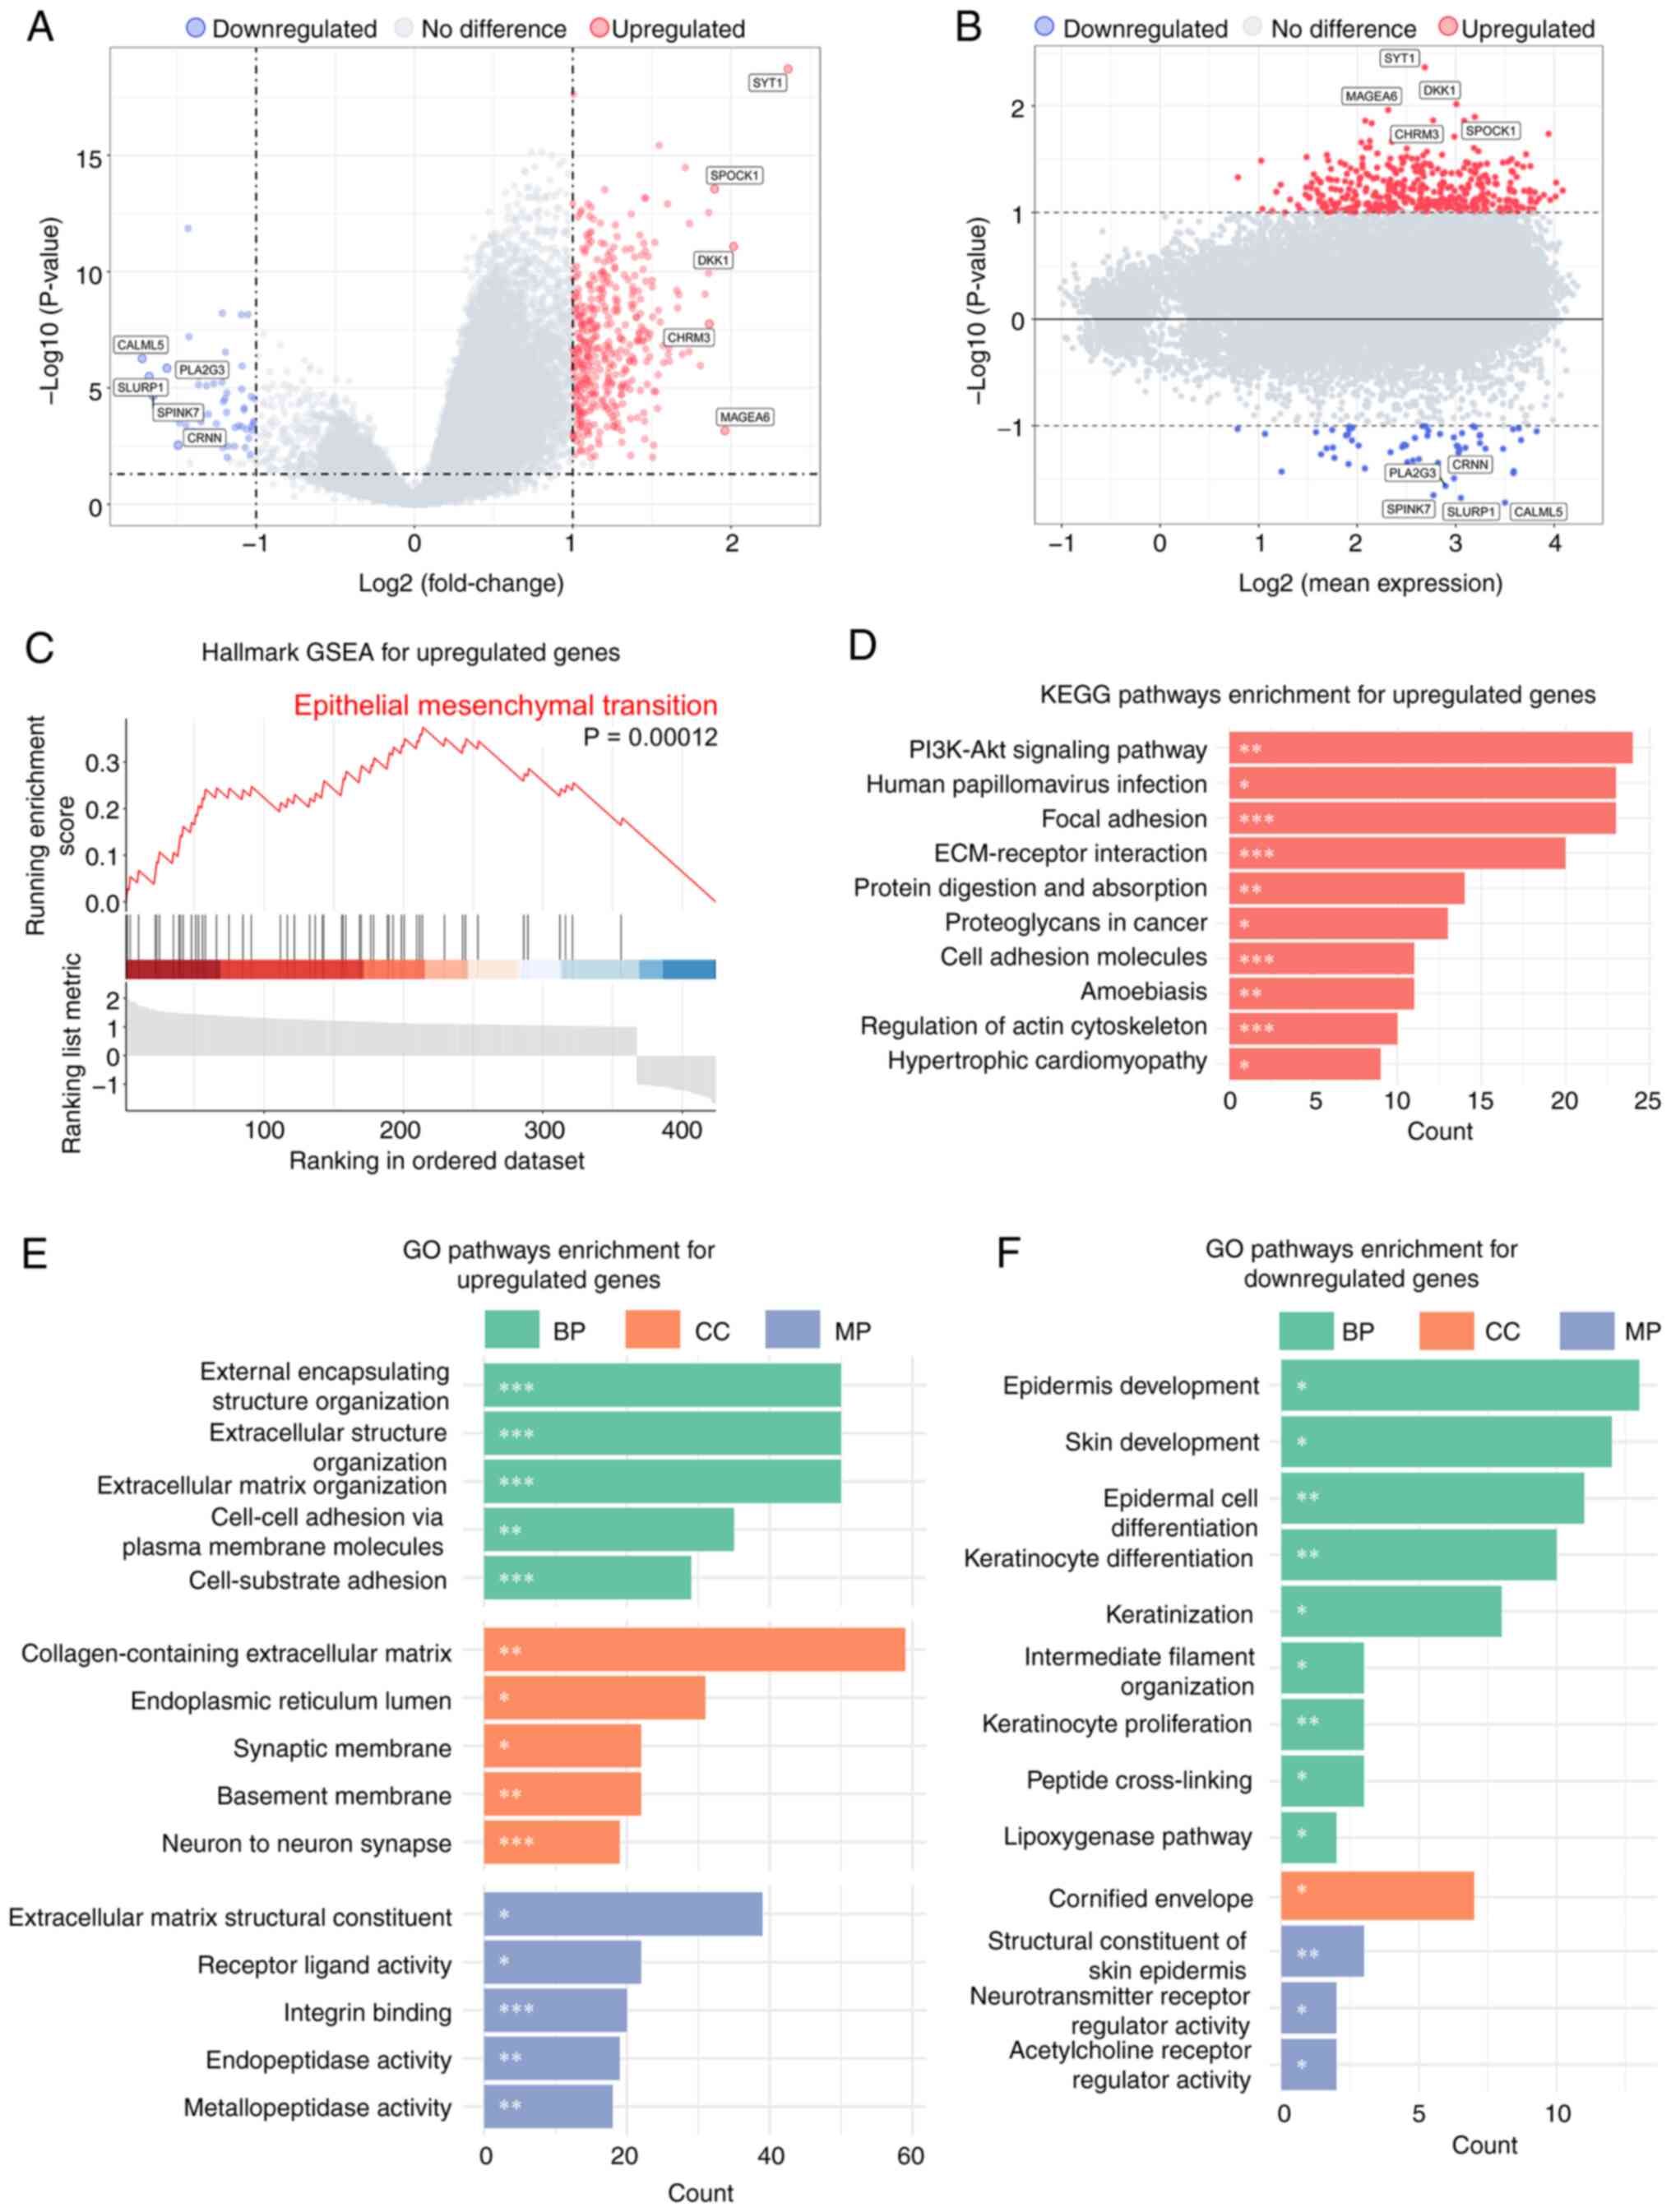
The results revealed 401 significantly upregulated genes and 60
downregulated genes in the high-risk group (P<0.05;
|log2FC|>1; Fig. 3A). The MA
plot demonstrated no significant association between gene
expression levels and fold changes (Fig. 3B), ruling out technical bias as a
cause of false-positive results for highly expressed genes.
According to the core characteristics of LLPS, proteins capable of
phase separation require local critical concentrations and rely on
IDRs to promote droplet-like condensate formation. Therefore, the
functional properties of upregulated genes were focused on.
Hallmark GSEA based on the MsigDB confirmed that EMT
was significantly enriched [normalized enrichment score (NES),
2.45; Fig. 3C]. KEGG pathway
analysis further demonstrated significant enrichment of these genes
in the ‘PI3K-Akt signaling pathway’, ‘ECM-receptor interaction’ and
‘focal adhesion’ (Fig. 3D),
suggesting their potential role in promoting cell migration and
invasion through ECM remodeling.
Consistent with the aforementioned findings, GO
analysis revealed significant enrichment of upregulated genes in
biological processes involving ECM remodeling and cell adhesion
regulation (Fig. 3E). Notably, GO
enrichment analysis of downregulated genes revealed pronounced
enrichment in pathways governing epithelial differentiation and
keratinization processes (Fig.
3F), underscoring the suppression of epithelial lineage
commitment, which corroborates the previously observed EMT pathway
activation.
Expression profile of prognostic model
genes in OSCC at a single cell level
To investigate the impact of the seven LLPSRGs in
the prognostic model on the malignant progression of OSCC at a
single cell level, systematic analyses were conducted using the
public scRNA-seq dataset, GSE234933. Primary tumor samples (n=19,
total cells=123,094) and metastatic tumor samples (n=8, total
cells=38,987) were selected based on clinical information. Risk
scores for all cells were calculated using the established
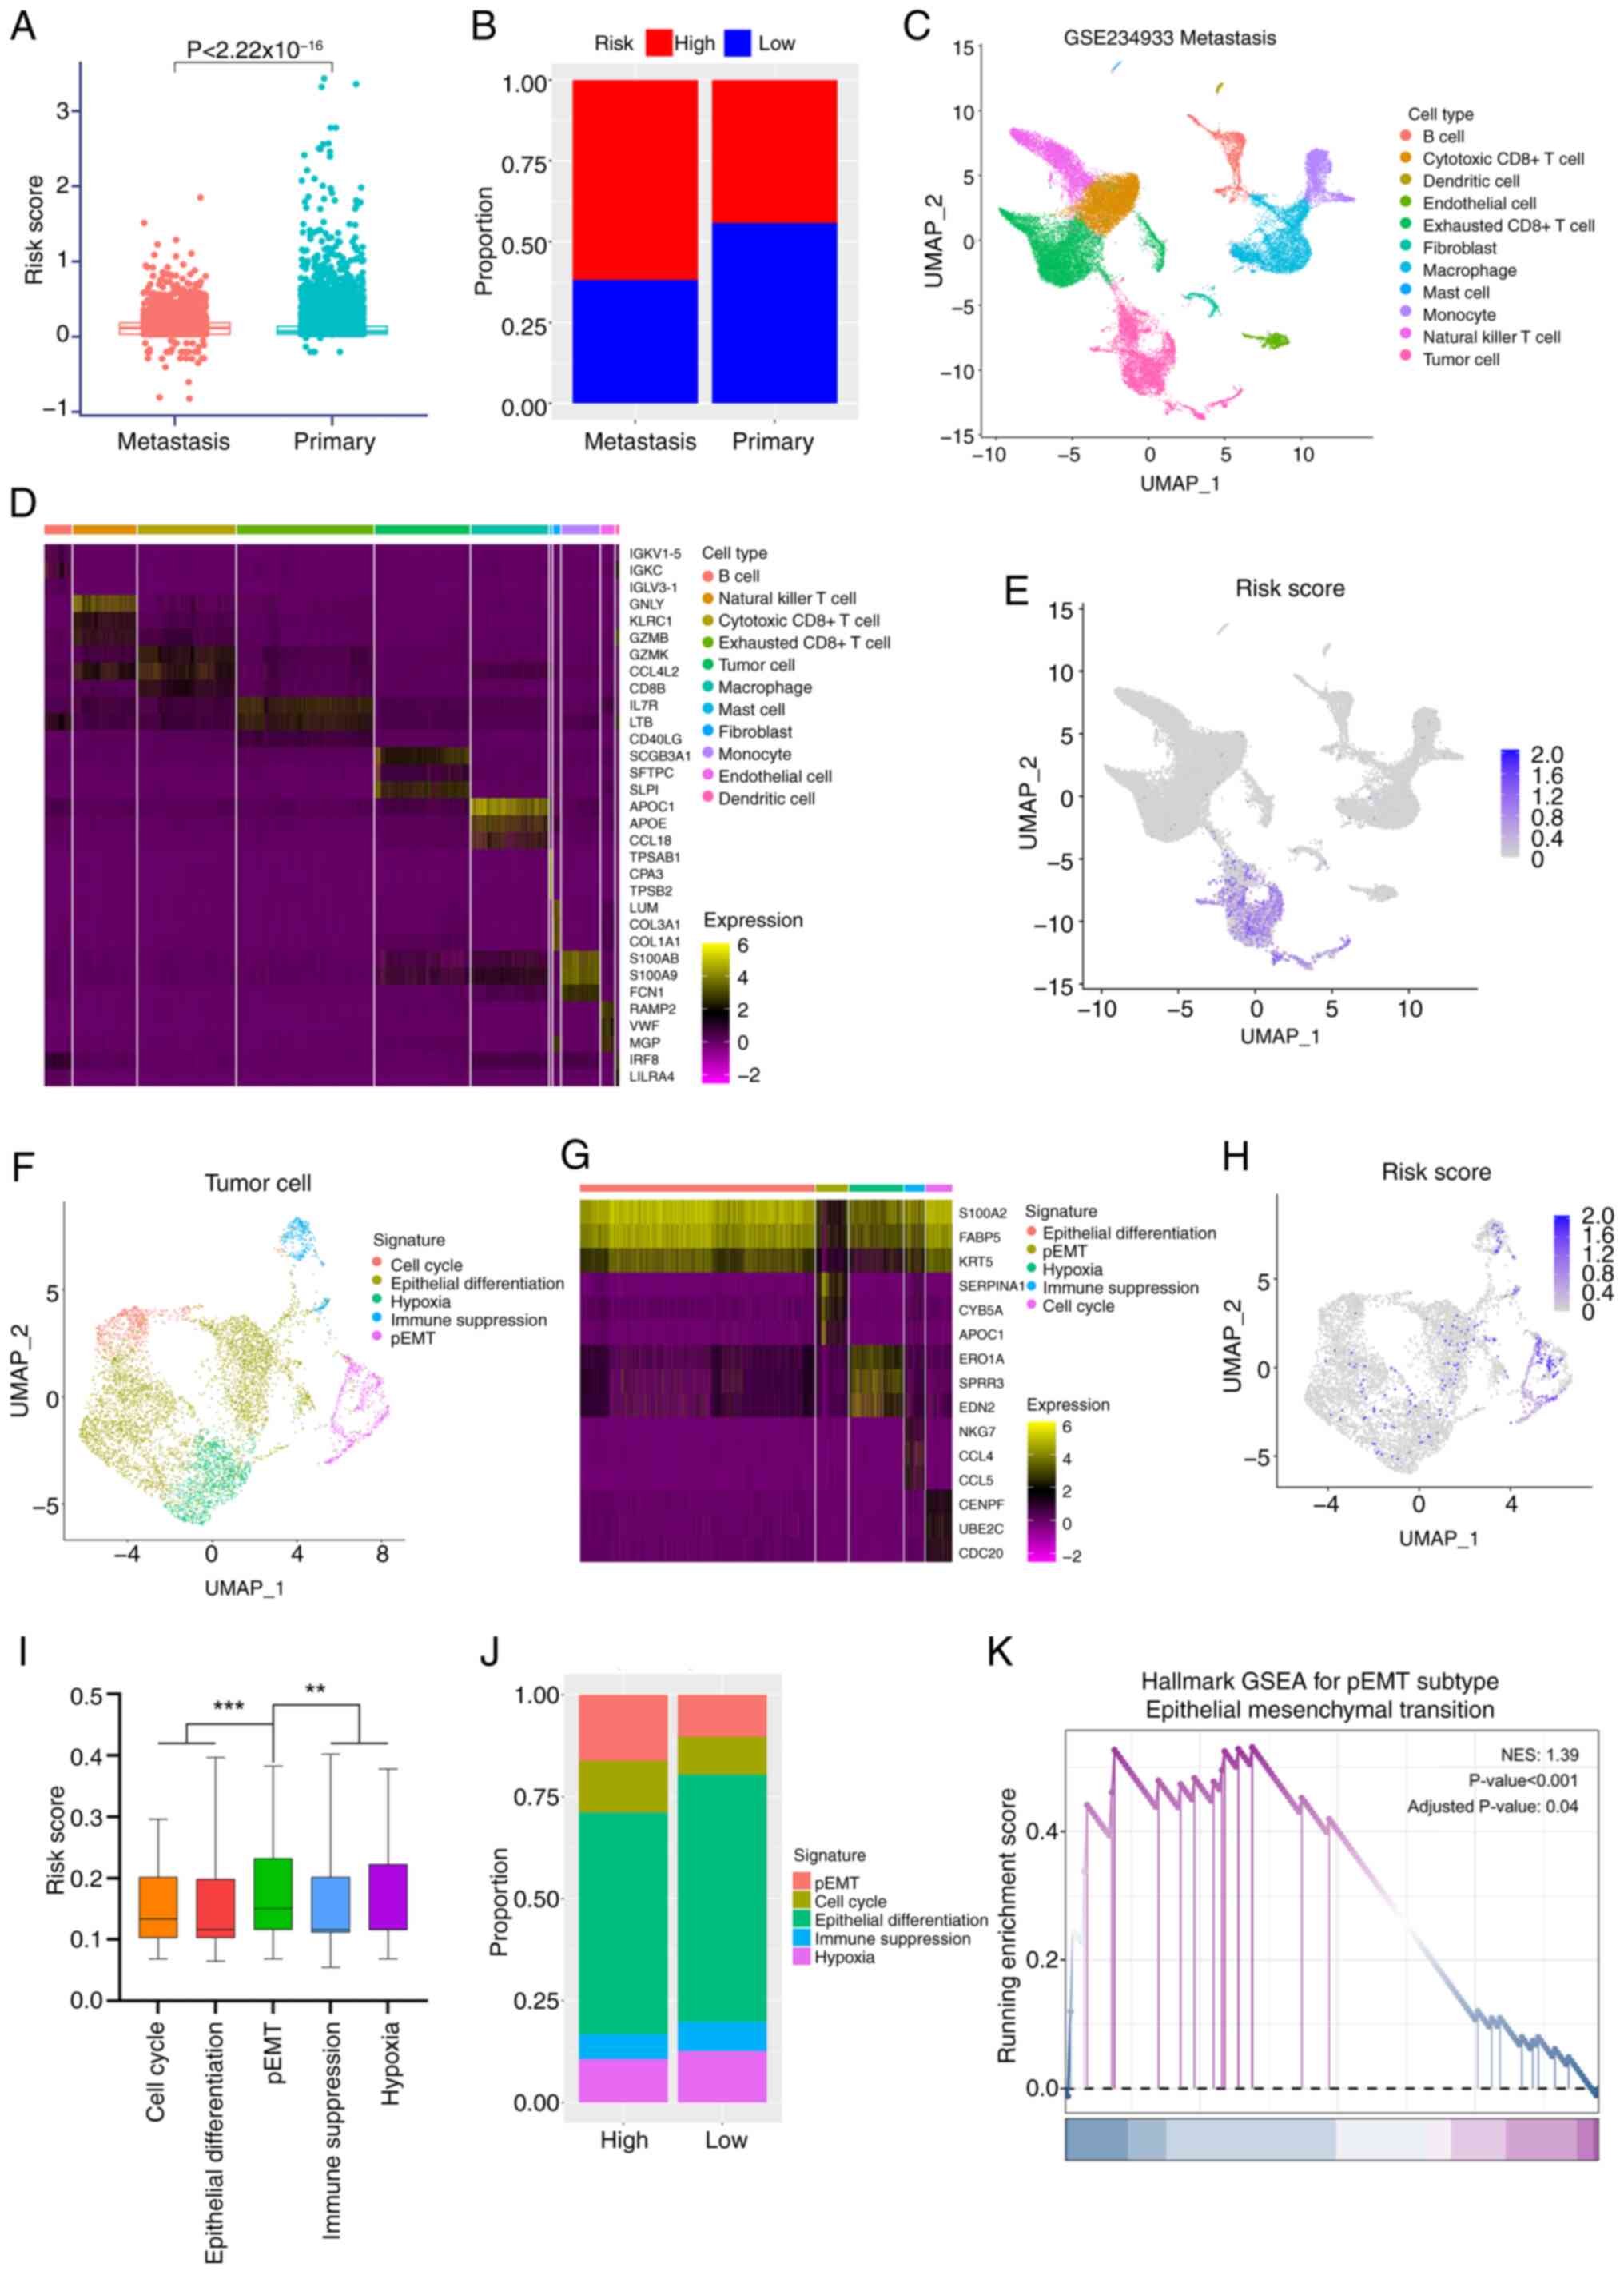
prognostic model formula. Results revealed significantly higher
risk scores in metastatic tumor cells compared with primary tumor
cells (Fig. 4A). When stratifying
cells into high- and low-risk groups based on the median risk
score, the metastatic tumor group exhibited a significantly higher
proportion of high-risk cells (Fig.
4B; 61.9 vs. 44.2% in primary tumors).
Given the aggressive phenotype and elevated risk
scores of metastatic cells, subsequent analyses focused on the
metastatic cell population. Unsupervised clustering and canonical
marker genes were used to annotate major cell types (Fig. 4C), with marker gene expression
heatmaps (such as fibroblast marker COL1A1 and cytotoxic T cell
marker CD8B) confirming accurate classification (Fig. 4D). Risk profiling across all cell
clusters through computing risk model algorithms revealed
pronounced risk score enrichment within Uniform Manifold
Approximation and Projection (UMAP)-defined tumor cell niches
(Fig. 4E), guiding subsequent
investigations to focus on tumor cell subpopulations.
Tumor cells were subdivided into the following five
functional subtypes: i) Cell cycle; ii) epithelial differentiation;
iii) hypoxia; iv) immune suppression; and v) partial (p)EMT, based
on canonical markers (Fig. 4F).
Heatmaps of subtype marker genes (such as CDC20 marking the cell
cycle subtype and KRT5 marking epithelial differentiation)
validated classification accuracy (Fig. 4G). Risk scores were calculated
across tumor cell subpopulations (Fig.
4H), revealing a pronounced risk elevation in the pEMT
subpopulation (Fig. 4I).
Consistently, when tumor cells were stratified by median risk
score, high-risk tumor cells exhibited a higher proportion of the
pEMT subtype (Fig. 4J; 16.2 vs.
10.3% in low-risk), a subtype strongly associated with tumor
invasion and metastatic potential (19). Mechanistically aligning with prior
pathway enrichment findings, specific activation of the EMT
signature pathway was also observed in the pEMT subpopulation
(Fig. 4K; NES, 1.39), indicating
that the EMT activation detected in bulk transcriptomics analyses
predominantly originates from the pEMT subpopulation within tumor
cells.
In summary, single-cell analyses demonstrated that
high-risk cell populations foster a pro-metastatic environment in
OSCC through activation of pEMT tumor cell subpopulations.
LLPS phenomenon of PHLDB2 in OSCC
To delineate core oncogenic drivers among the seven
prognostic model genes that drive the malignant progression of
OSCC, the GEPIA2 website (20) was
used to compare the relative expression of the seven LLPSRGs in
TCGA-OSCC (Fig. S3A),
prioritizing four highly expressed candidates, MYO1B, DDX21, CDH13
and PHLDB2. RT-qPCR of the seven genes in the OSCC cell lines
verified the aforementioned results (Fig. S3B and C). Subsequently,
integrative prognostic mapping for TCGA-OSCC by GEPIA2 (Fig. S3D) further refined the key
regulator candidates to MYO1B, CDH13 and PHLDB2.
To evaluate their phase separation potential, the
amino acid sequences of these proteins were obtained from the
UniProt database (https://www.uniprot.org/) and uploaded to the IUPred2A
platform (17) to analyze their
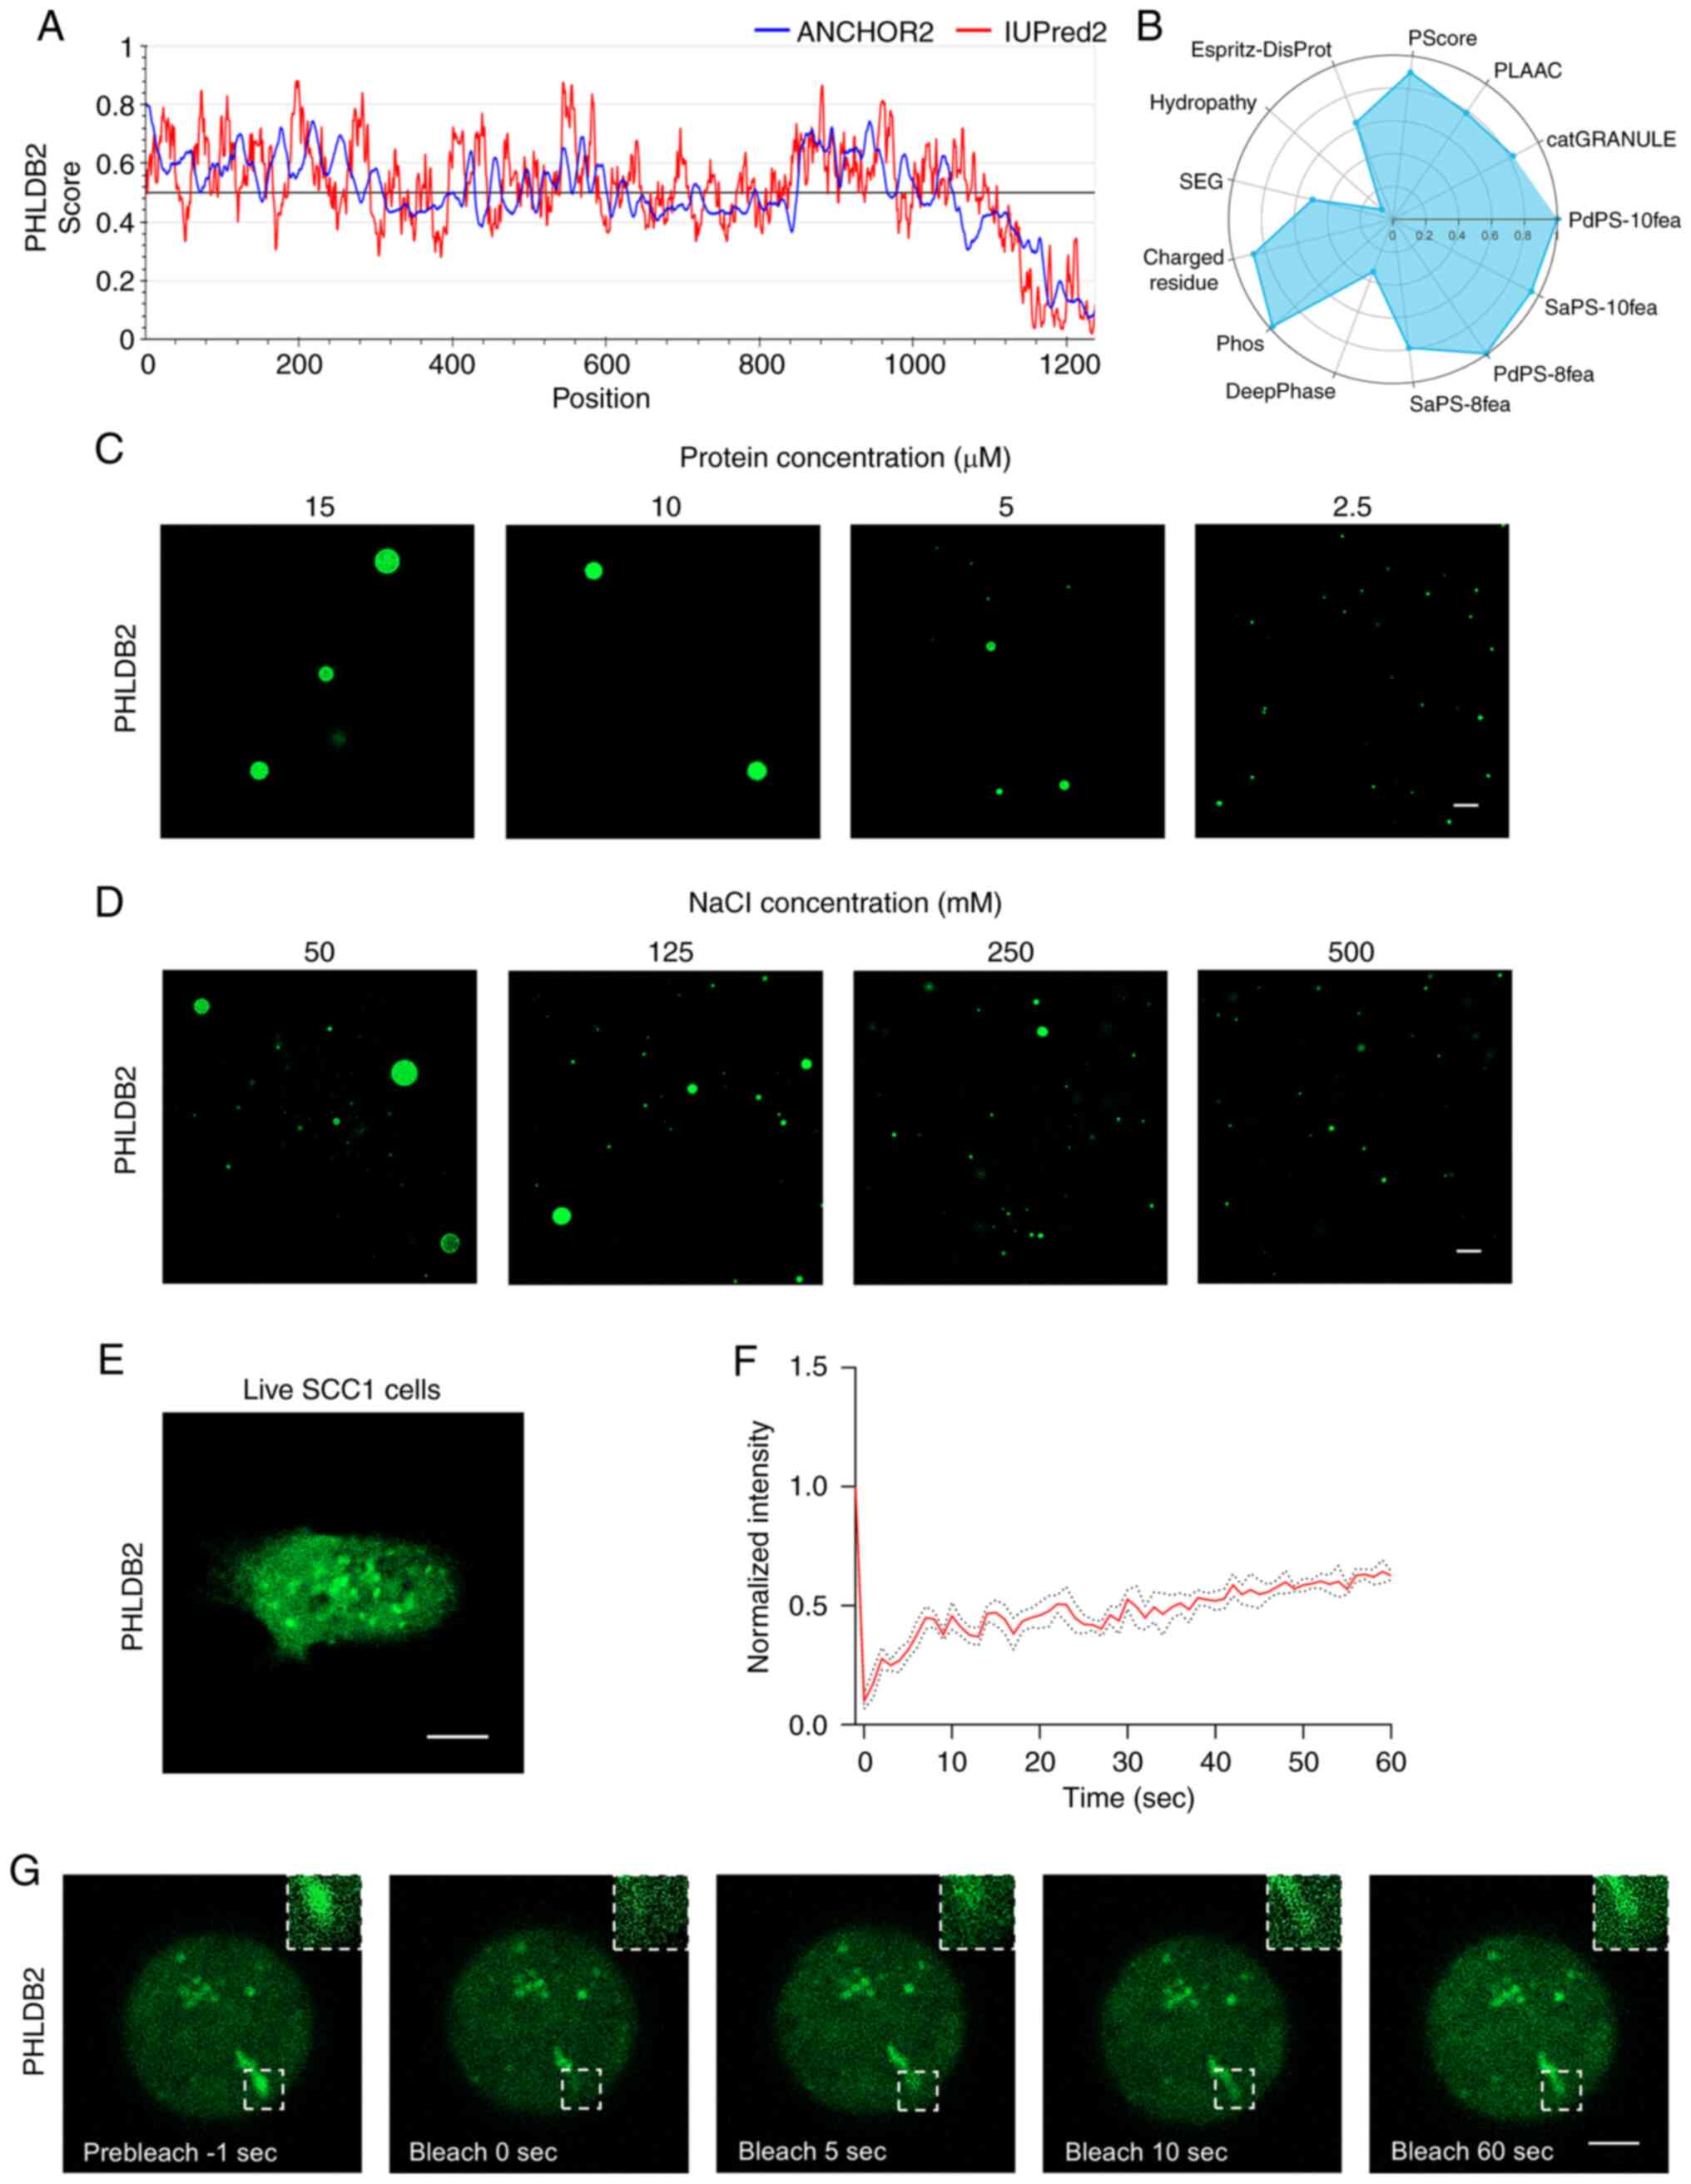
IDR propensity. The prediction revealed markedly higher phase
separation potential for PHLDB2 compared with MYO1B and CDH13
(Figs. 5A, S3E and S3F). In addition, LLPS scoring for
PHLDB2, MYO1B and CDH13 by PhaSePred (18) supported the aforementioned results
(Figs. 5B, S3G and S3H), prompting further in-depth
investigation of PHLDB2.
To validate whether PHLDB2 undergoes LLPS, its
ability to form condensates in vitro was first examined. In
LLPS buffer containing 50 mM NaCl, Alexa Fluor 488-labeled PHLDB2
protein formed phase-separated droplets ranging 2.5–15 µm in
diameter, with droplet size positively associated with protein
concentration (2.5–15 µM; Fig. 5C)
and inversely associated with NaCl concentration (50–500 mM;
Fig. 5D). Notably, live-cell
imaging of the SCC1 OSCC cell line transfected with PHLDB2-EGFP
plasmids demonstrated the formation of cytoplasmic droplets
(Fig. 5E). FRAP assays further
confirmed the liquid-like properties of these condensates, with
fluorescence recovering to 31.4% at 5 sec, 52.6% at 30 sec and
62.7% at 60 sec post-bleaching (Fig.
5F and G). These results conclusively demonstrated that PHLDB2
forms LLPS condensates in OSCC cells.
Promoting effects of PHLDB2 on
proliferation, stemness and invasion in OSCC cell lines
To investigate the regulatory role of PHLDB2 in the
biological behavior of OSCC cells, two sequence-specific siRNAs
were designed to knockdown PHLDB2 expression in SCC1 and HSC3 cell
lines via transient transfection. RT-qPCR and western blotting
results demonstrated that both siRNAs significantly reduced PHLDB2
mRNA and protein levels (Fig. 6A and
B), confirming the high efficiency and specificity of the
knockdown system.
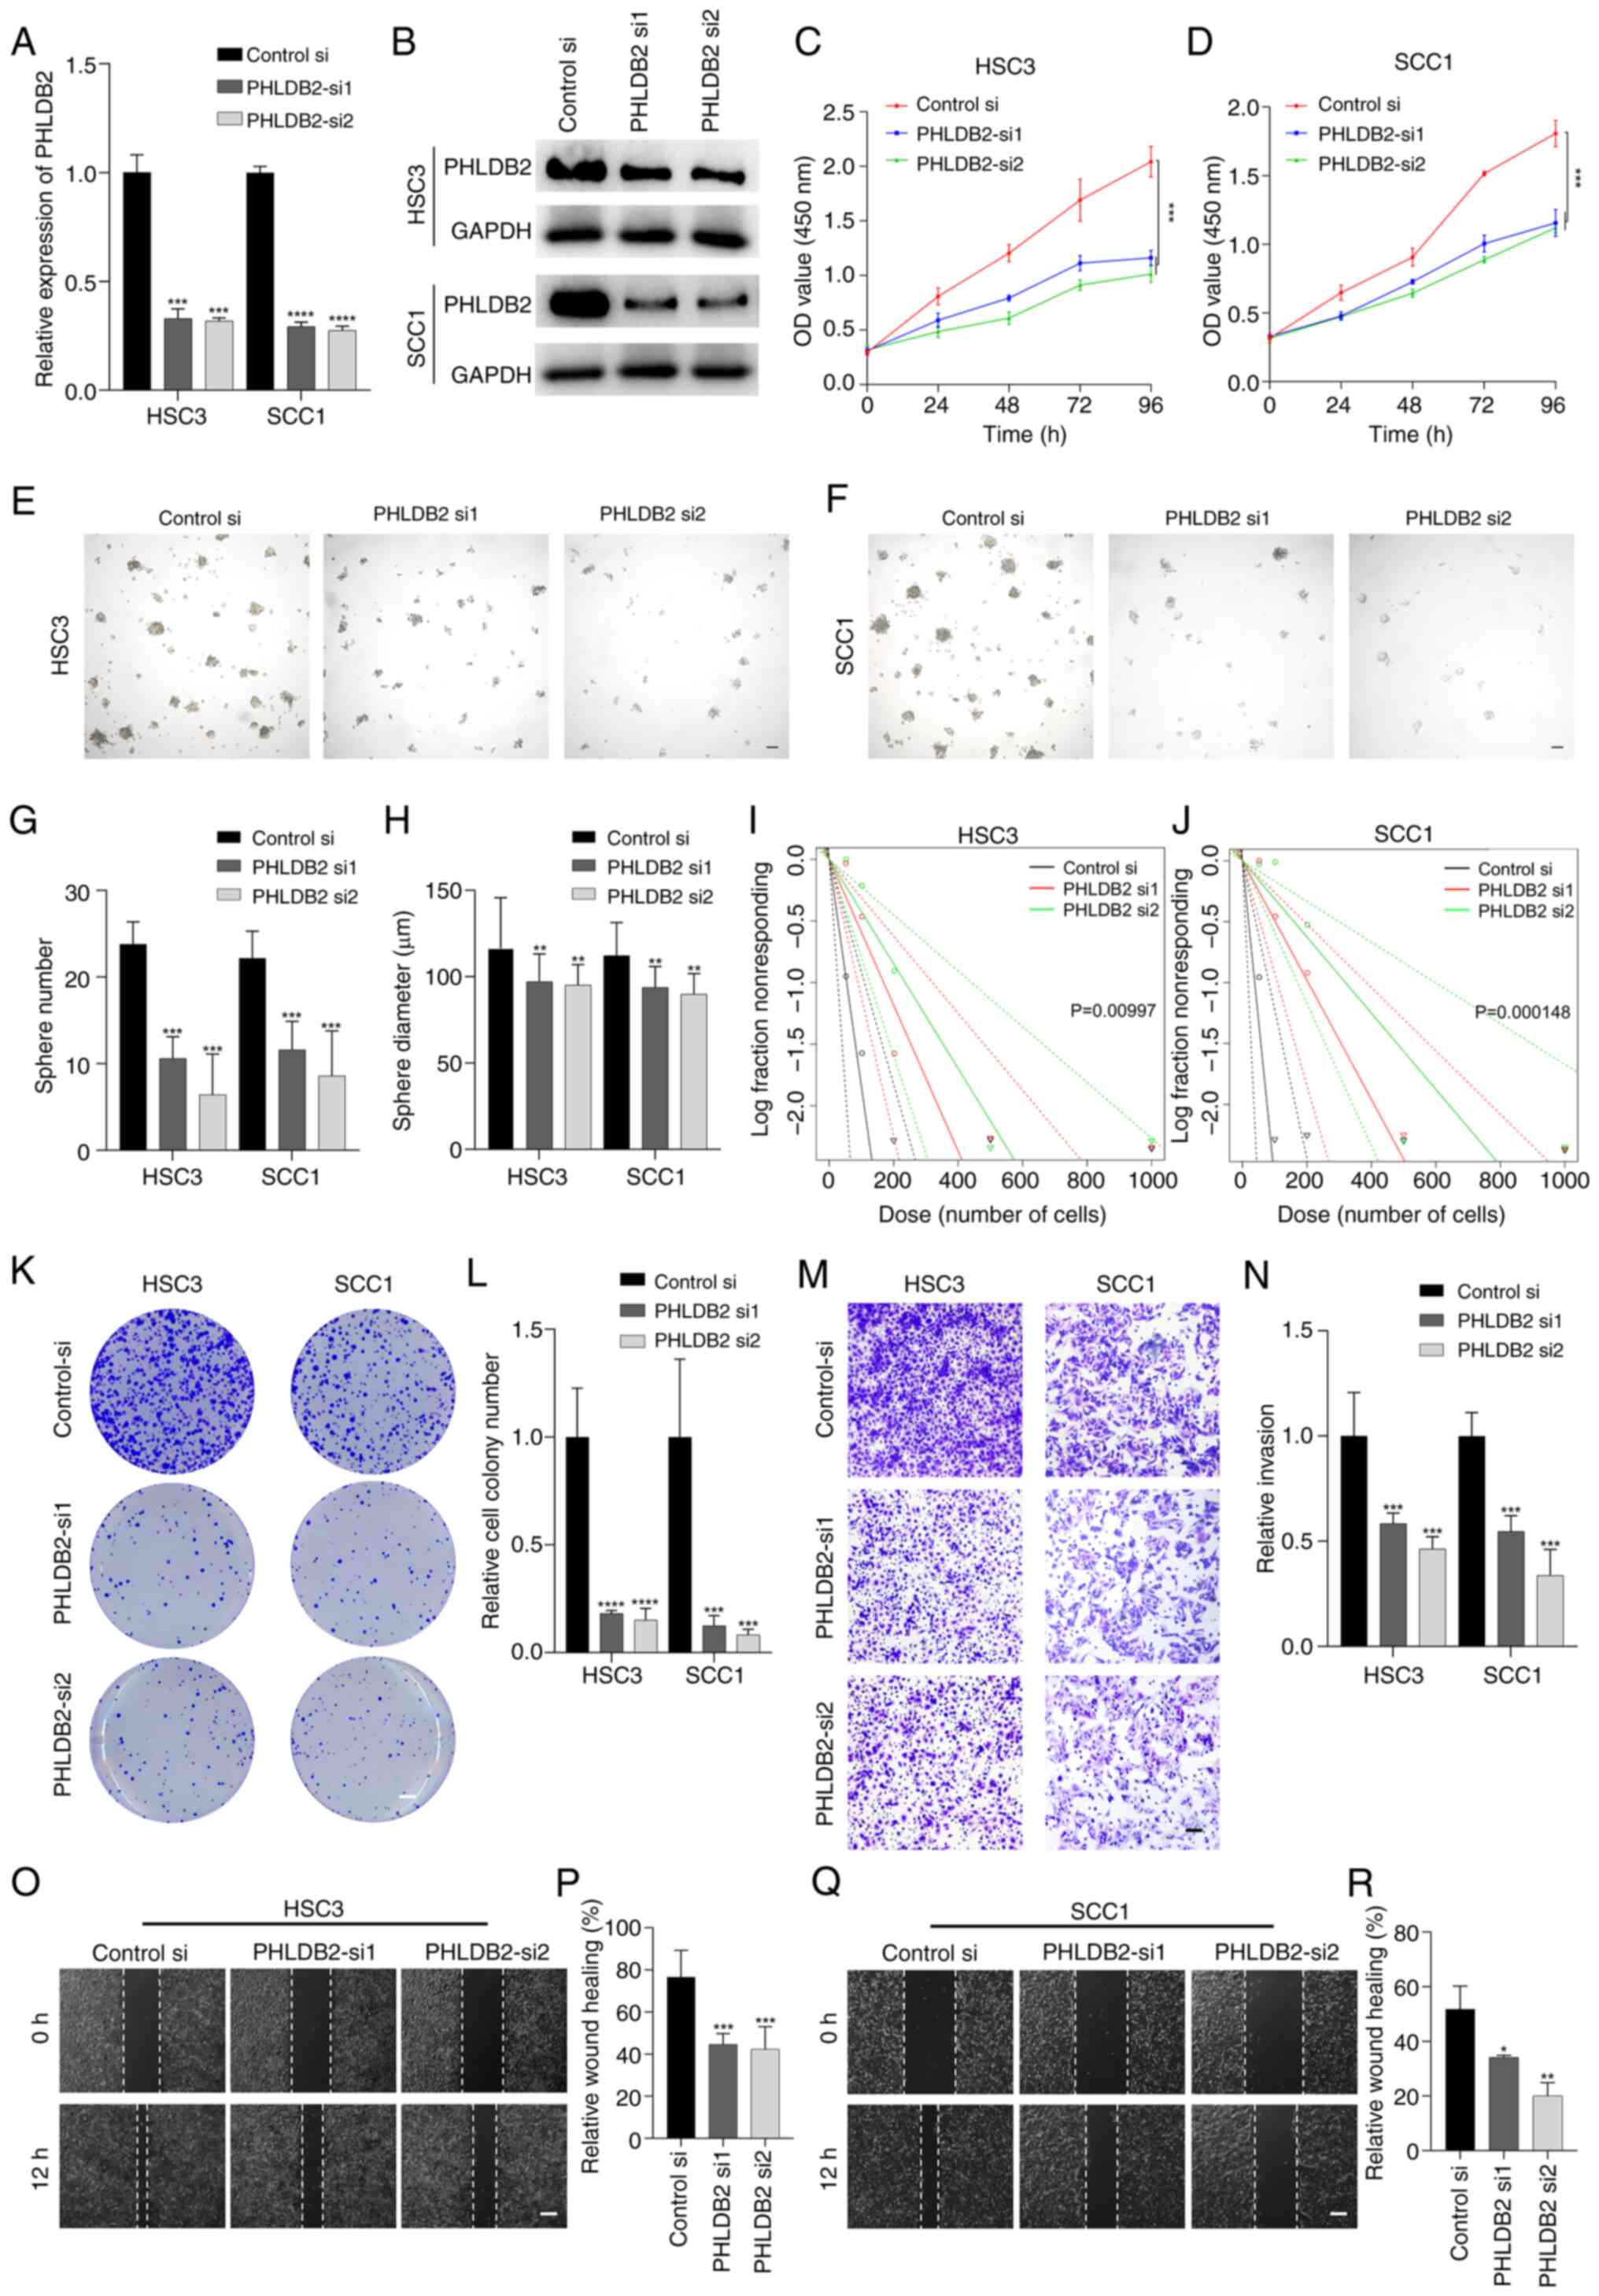 | Figure 6.Promoting effects of PHLDB2 on
proliferation, stemness, invasion and metastasis in OSCC cell
lines. (A) PHLDB2 mRNA levels were decreased in OSCC cells
transfected with PHLDB2-targeting siRNAs (si1/si2). ***P<0.001,
****P<0.0001 vs. control-si. (B) Western blotting confirmed
PHLDB2 protein knockdown following siRNA transfection. OD values
demonstrated changes in (C) HSC3 cells and (D) SCC1 cells upon
PHLDB2 depletion. ***P<0.001. Tumor spheres formed in (E) HSC3
cells and (F) SCC1 cells. Scale bar, 100 µm. (G) Sphere number
decreased in PHLDB2-knockdown HSC3/SCC1 cells. ***P<0.001 vs.
control-si. (H) Sphere diameter decreased in PHLDB2-knockdown
HSC3/SCC1 cells. **P<0.01 vs. control-si. Sphere-forming
capacity decreased in (I) HSC3 cells and (J) SCC1 cells with PHLDB2
knockdown. (K) Representative image of colony formation assays
showed reduction in PHLDB2-knockdown HSC3/SCC1 cells vs. control.
Scale bar, 3 mm. (L) Quantification of colony formation assays
showed reduction in PHLDB2-knockdown HSC3/SCC1 cells.
***P<0.001, ****P<0.0001 vs. control-si. (M) Representative
image of invasion assays indicated suppression in PHLDB2-knockdown
HSC3/SCC1 cells. Scale bar, 50 µm. (N) Quantification of invasion
assays indicated suppression in PHLDB2-knockdown HSC3/SCC1 cells.
***P<0.001 vs. control-si. (O) Representative image of wound
healing assays indicated depletion of migratory capacity in
PHLDB2-knockdown HSC3 cells vs. control. Scale bar, 100 µm. (P)
Wound healing assays indicated depletion of migratory capacity in
PHLDB2-knockdown HSC3 cells. ***P<0.001 vs. control-si. (Q)
Quantification of wound healing assays indicated depletion of
migratory capacity in PHLDB2-knockdown SCC1 cells vs. control.
Scale bar, 100 µm. (R) Wound healing assays indicated depletion of
migratory capacity in PHLDB2-knockdown SCC1 cells. *P<0.05,
**P<0.01 vs. control-si. OSCC, oral squamous cell carcinoma; si,
small interfering. |
CCK-8 assays revealed a significant decline in
proliferation rates over time in the PHLDB2 knockdown groups
(Fig. 6C and D). Tumor-sphere
formation assays further showed that the number of tumor-spheres
and their average diameter were significantly reduced in the
knockdown groups compared with those in the control groups
(Fig. 6E-H). Limiting dilution
assays confirmed impaired self-renewal capacity of tumor stem cells
following PHLDB2 knockdown (Fig. 6I
and J). Additionally, colony formation assays indicated a
significant decrease in colony numbers in the knockdown groups
(Fig. 6K and L), suggesting the
critical role of PHLDB2 in maintaining tumor stemness.
For tumor invasion, Transwell assays showed a
significant reduction in matrix gel-penetrating cells in the PHLDB2
knockdown groups (Fig. 6M and N).
Wound healing assays further revealed decreased wound closure rates
in knockdown cells (Fig. 6O-R).
These results systematically demonstrated that PHLDB2 promotes OSCC
malignant progression by enhancing cell proliferation, stemness
maintenance and invasive potential.
Exploration of the molecular
mechanisms of PHLDB2 promoting the malignant characteristics of
OSCC
To elucidate the molecular mechanisms by which
PHLDB2 promotes malignant phenotypes in OSCC cells, a
multi-dimensional data cross-validation strategy was employed that
systematically compared RNA-seq data from PHLDB2 knockdown
experiments with transcriptomics data from TCGA-OSCC cohort. For
TCGA-OSCC public data, patients were stratified into high- and
low-expression groups based on PHLDB2 levels, followed by
differential gene analysis identifying 3,147 distinctively
upregulated genes and 15,398 distinctively downregulated genes in
the PHLDB2 low-expression group (Fig.
7A). Subsequent Hallmark and GO GSEA based on MsigDB were
performed on these DEGs, collectively named the PHLDB2-TCGA pathway
enrichment results (Fig. 7C). SCC1
cells were transiently transfected with PHLDB2-si1 siRNA to
knockdown PHLDB2 expression, and three biological replicates were
conducted for both the experimental group (PHLDB2-si) and the
control group (control-si), followed by RNA-seq. Differential
expression analysis (thresholds, P<0.05 and |log2FC|>1)
confirmed reliable knockdown efficiency of PHLDB2-si, identifying
80 distinctively upregulated genes and 360 distinctively
downregulated genes in the PHLDB2 knockdown group (Fig. 7B). Subsequent Hallmark and GO GSEA
based on MsigDB were performed on these DEGs, collectively named
the PHLDB2-RNAseq pathway enrichment results (Fig. 7C).
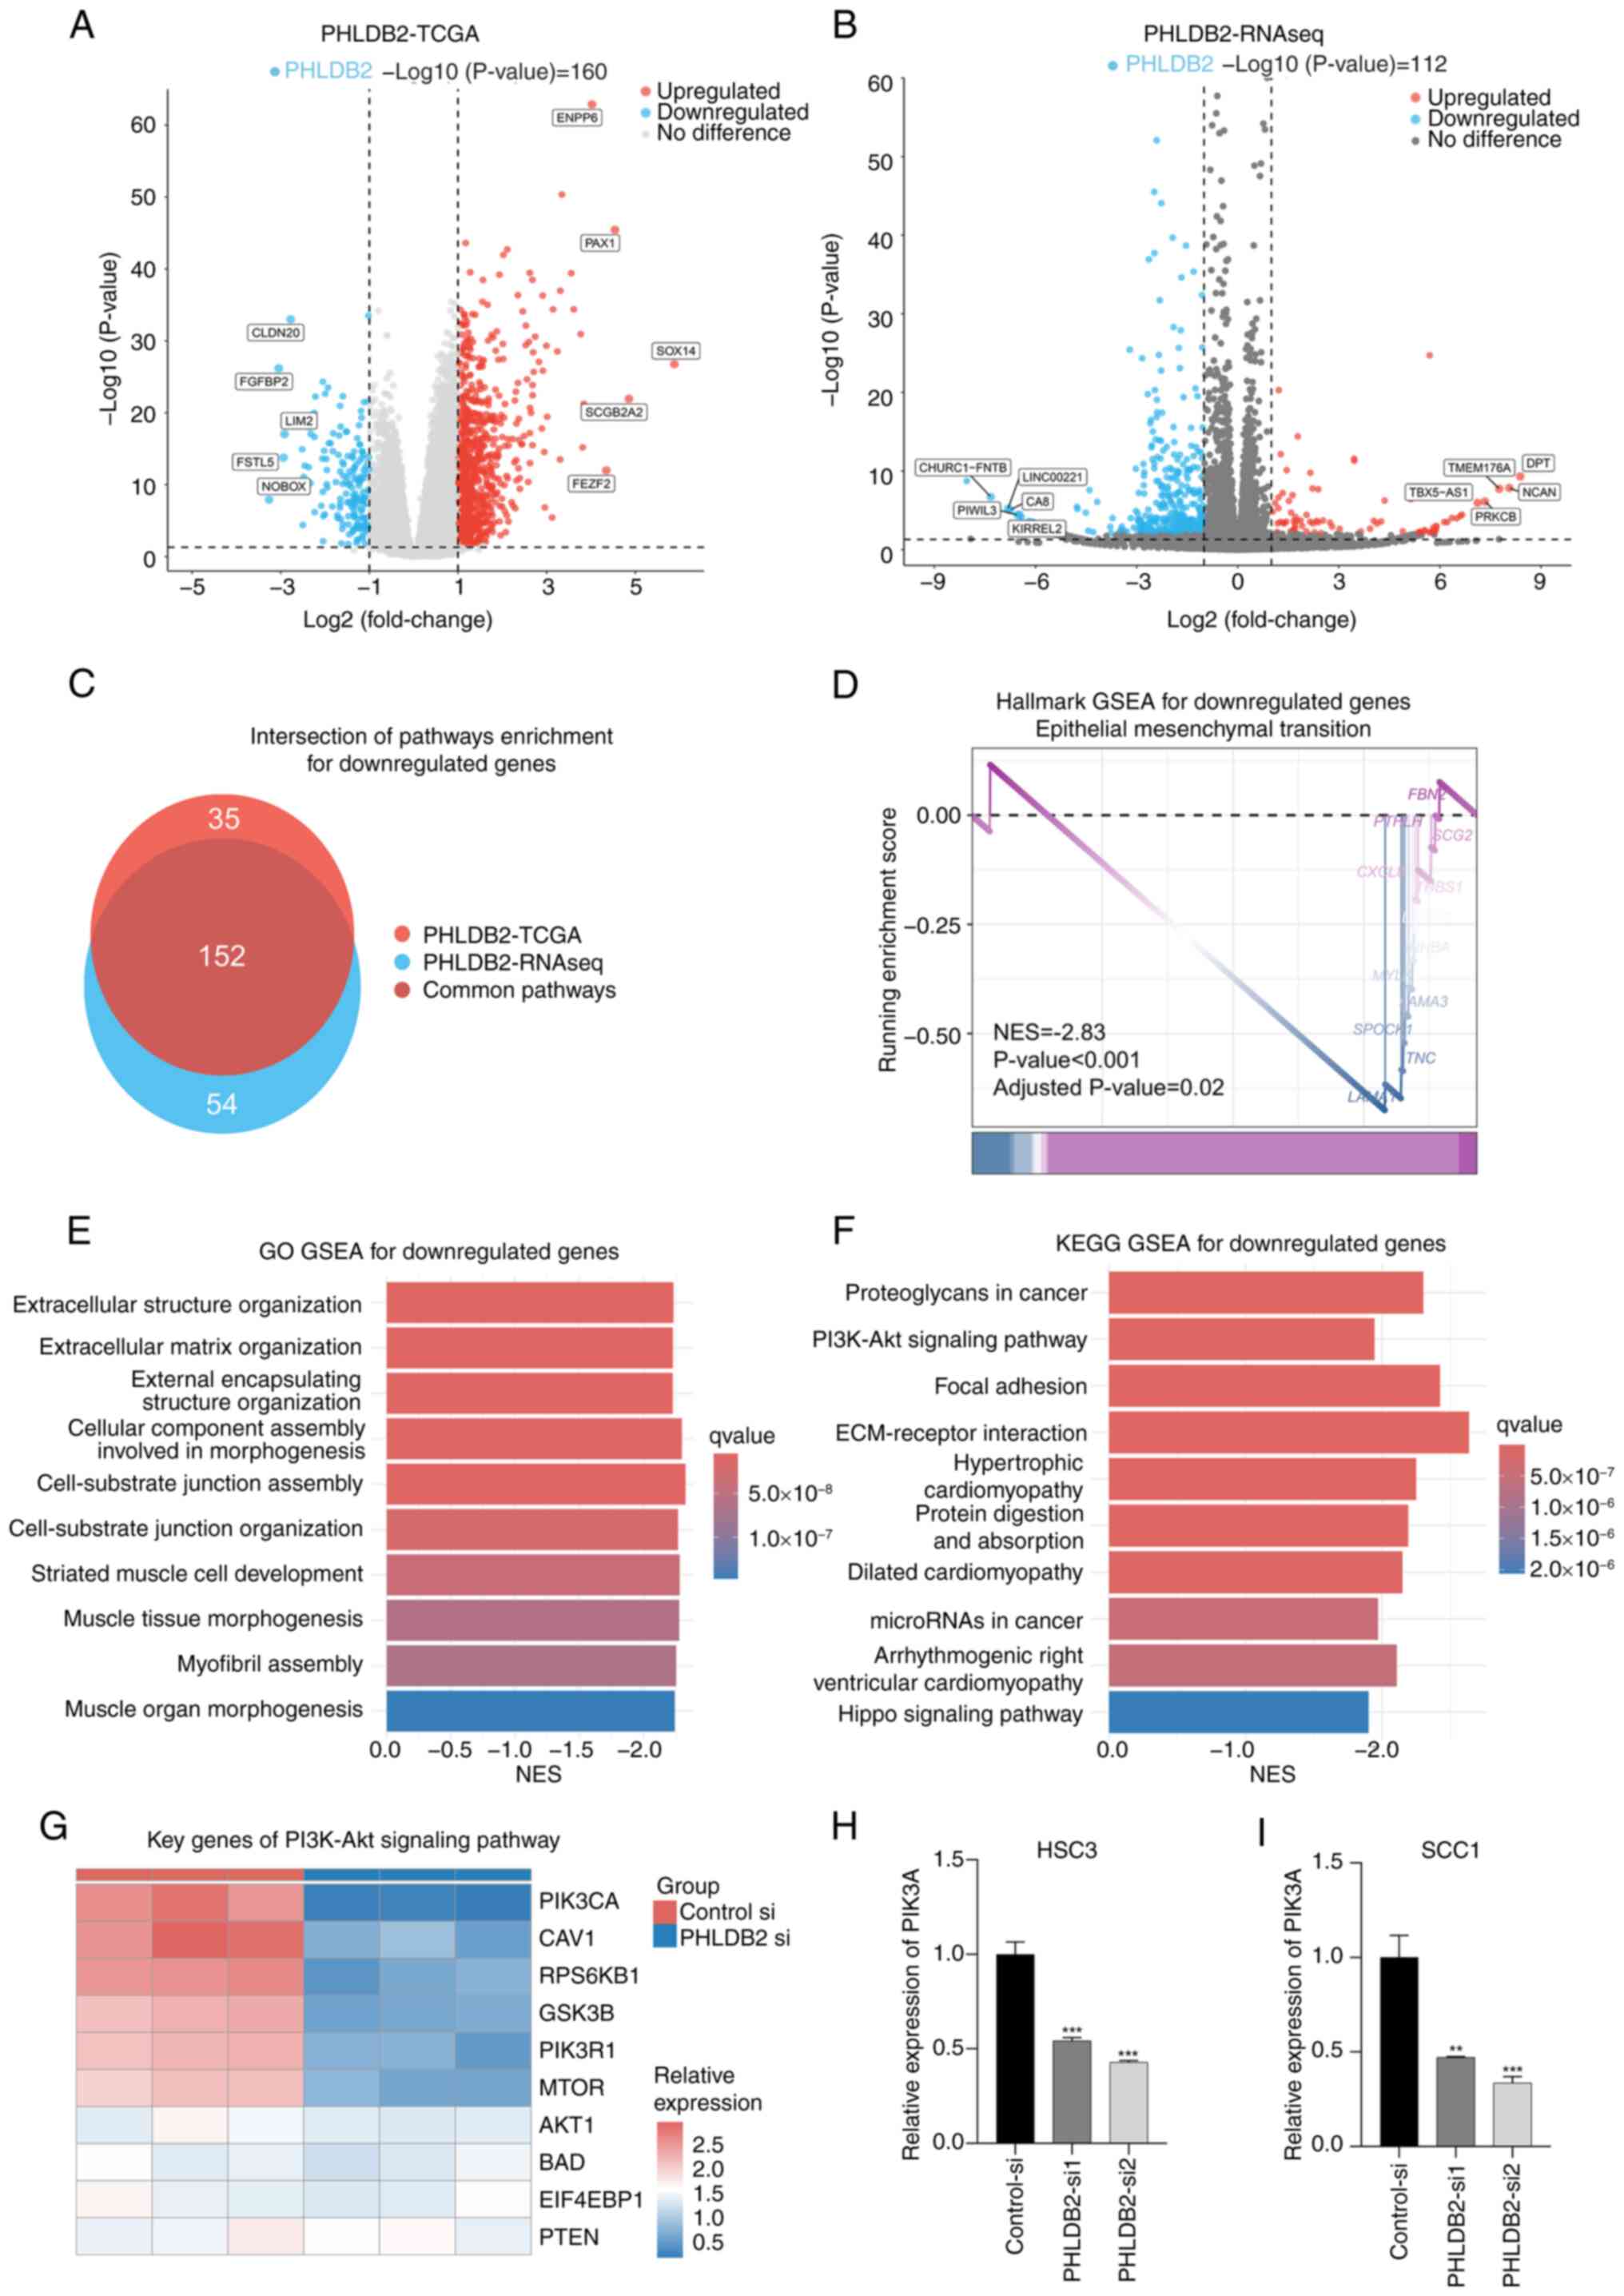 | Figure 7.Exploration of the molecular
mechanisms of PHLDB2 promoting the malignant characteristics of
OSCC. (A) Differential gene analysis identified differentially
expressed genes between PHLDB2 low- and high-expression groups in
TCGA-OSCC cohort. Threshold: P<0.05 and |log2FC|>1. (B)
Differential gene analysis identified differentially expressed
genes between the PHLDB2 knockdown group and the control group.
Thresholds: P<0.05 and |log2FC|>1. (C) Intersection analysis
revealed downregulated pathways shared between PHLDB2-RNAseq and
PHLDB2-TCGA enrichment profiles. (D) Integrated Hallmark pathway
analysis demonstrated enriched pathway for downregulated genes. (E)
Integrated GO pathway analysis identified enriched biological terms
for downregulated genes. (F) Integrated KEGG pathway analysis
showed enriched pathways for downregulated genes. (G) Heatmap
displayed expression patterns of PI3K-Akt signaling pathway genes
in PHLDB2-knockdown vs. control groups. Reverse
transcription-quantitative PCR indicated reduced PIK3CA expression
in PHLDB2-depleted (H) HSC3 and (I) SCC1 cells. **P<0.01,
***P<0.001 vs. control-si. GO, Gene Ontology; GSEA, gene set
enrichment analysis; KEGG, Kyoto Encyclopedia of Genes and Genomes;
NES, normalized enrichment score; OSCC, oral squamous cell
carcinoma; RNAseq, RNA sequencing; TCGA, The Cancer Genome Atlas;
MsigDB, Molecular Signatures Database; si, small interfering. |
To delineate core pathway convergence in
PHLDB2-deficient molecular contexts, a cross-dataset intersection
of the PHLDB2-RNAseq and PHLDB2-TCGA pathway enrichment results was
performed (Fig. 7C). Consensus
pathway analysis of the intersecting 152 molecular signatures
demonstrated significant suppression of the Hallmark EMT gene set
in PHLDB2-depleted samples (NES, −2.833; false discovery rate,
0.023; Fig. 7D), consistent with
the Hallmark enrichment results from prognostic model genes
(Fig. 3C). Western blot validation
of core EMT markers confirmed these findings (Fig. S4), showing decreased N-cadherin
and vimentin protein levels accompanied by increased E-cadherin
expression in the PHLDB2-si groups compared with those in the
control-si groups. GO enrichment analysis further demonstrated that
pathways related to ECM remodeling and the cell-substrate junction
including ‘extracellular structure organization’, ‘extracellular
matrix organization’, ‘cell-substrate junction assembly’ and
‘cell-substrate junction organization’, were markedly downregulated
(Fig. 7E), mechanistically
implicating that PHLDB2 depletion impaired EMT activation dynamics
in OSCC.
To elucidate the molecular mechanisms underlying
PHLDB2-mediated EMT regulation, KEGG GSEA was conducted for
downregulated genes in PHLDB2-depleted samples, which revealed
significant enrichment of the ‘PI3K-Akt signaling pathway’
(Fig. 7F), recapitulating the
pathway convergence pattern observed in prior prognostic model gene
signatures. Subsequent expression profiling of core PI3K-Akt
signaling components in PHLDB2-knockdown models demonstrated marked
downregulation of PIK3CA (Fig.
7G). Further validation through RT-qPCR in PHLDB2-knockdown
OSCC cell lines confirmed the transcriptional repression of PIK3CA
(Fig. 7H and I). Previous research
has identified PIK3CA as a critical molecular regulator of EMT
activation (24,25). Integrated analysis of the
multidimensional datasets in the present study revealed that
PHLDB2-mediated upregulation of PIK3CA may constitute a novel
mechanistic axis driving EMT progression in OSCC pathogenesis.
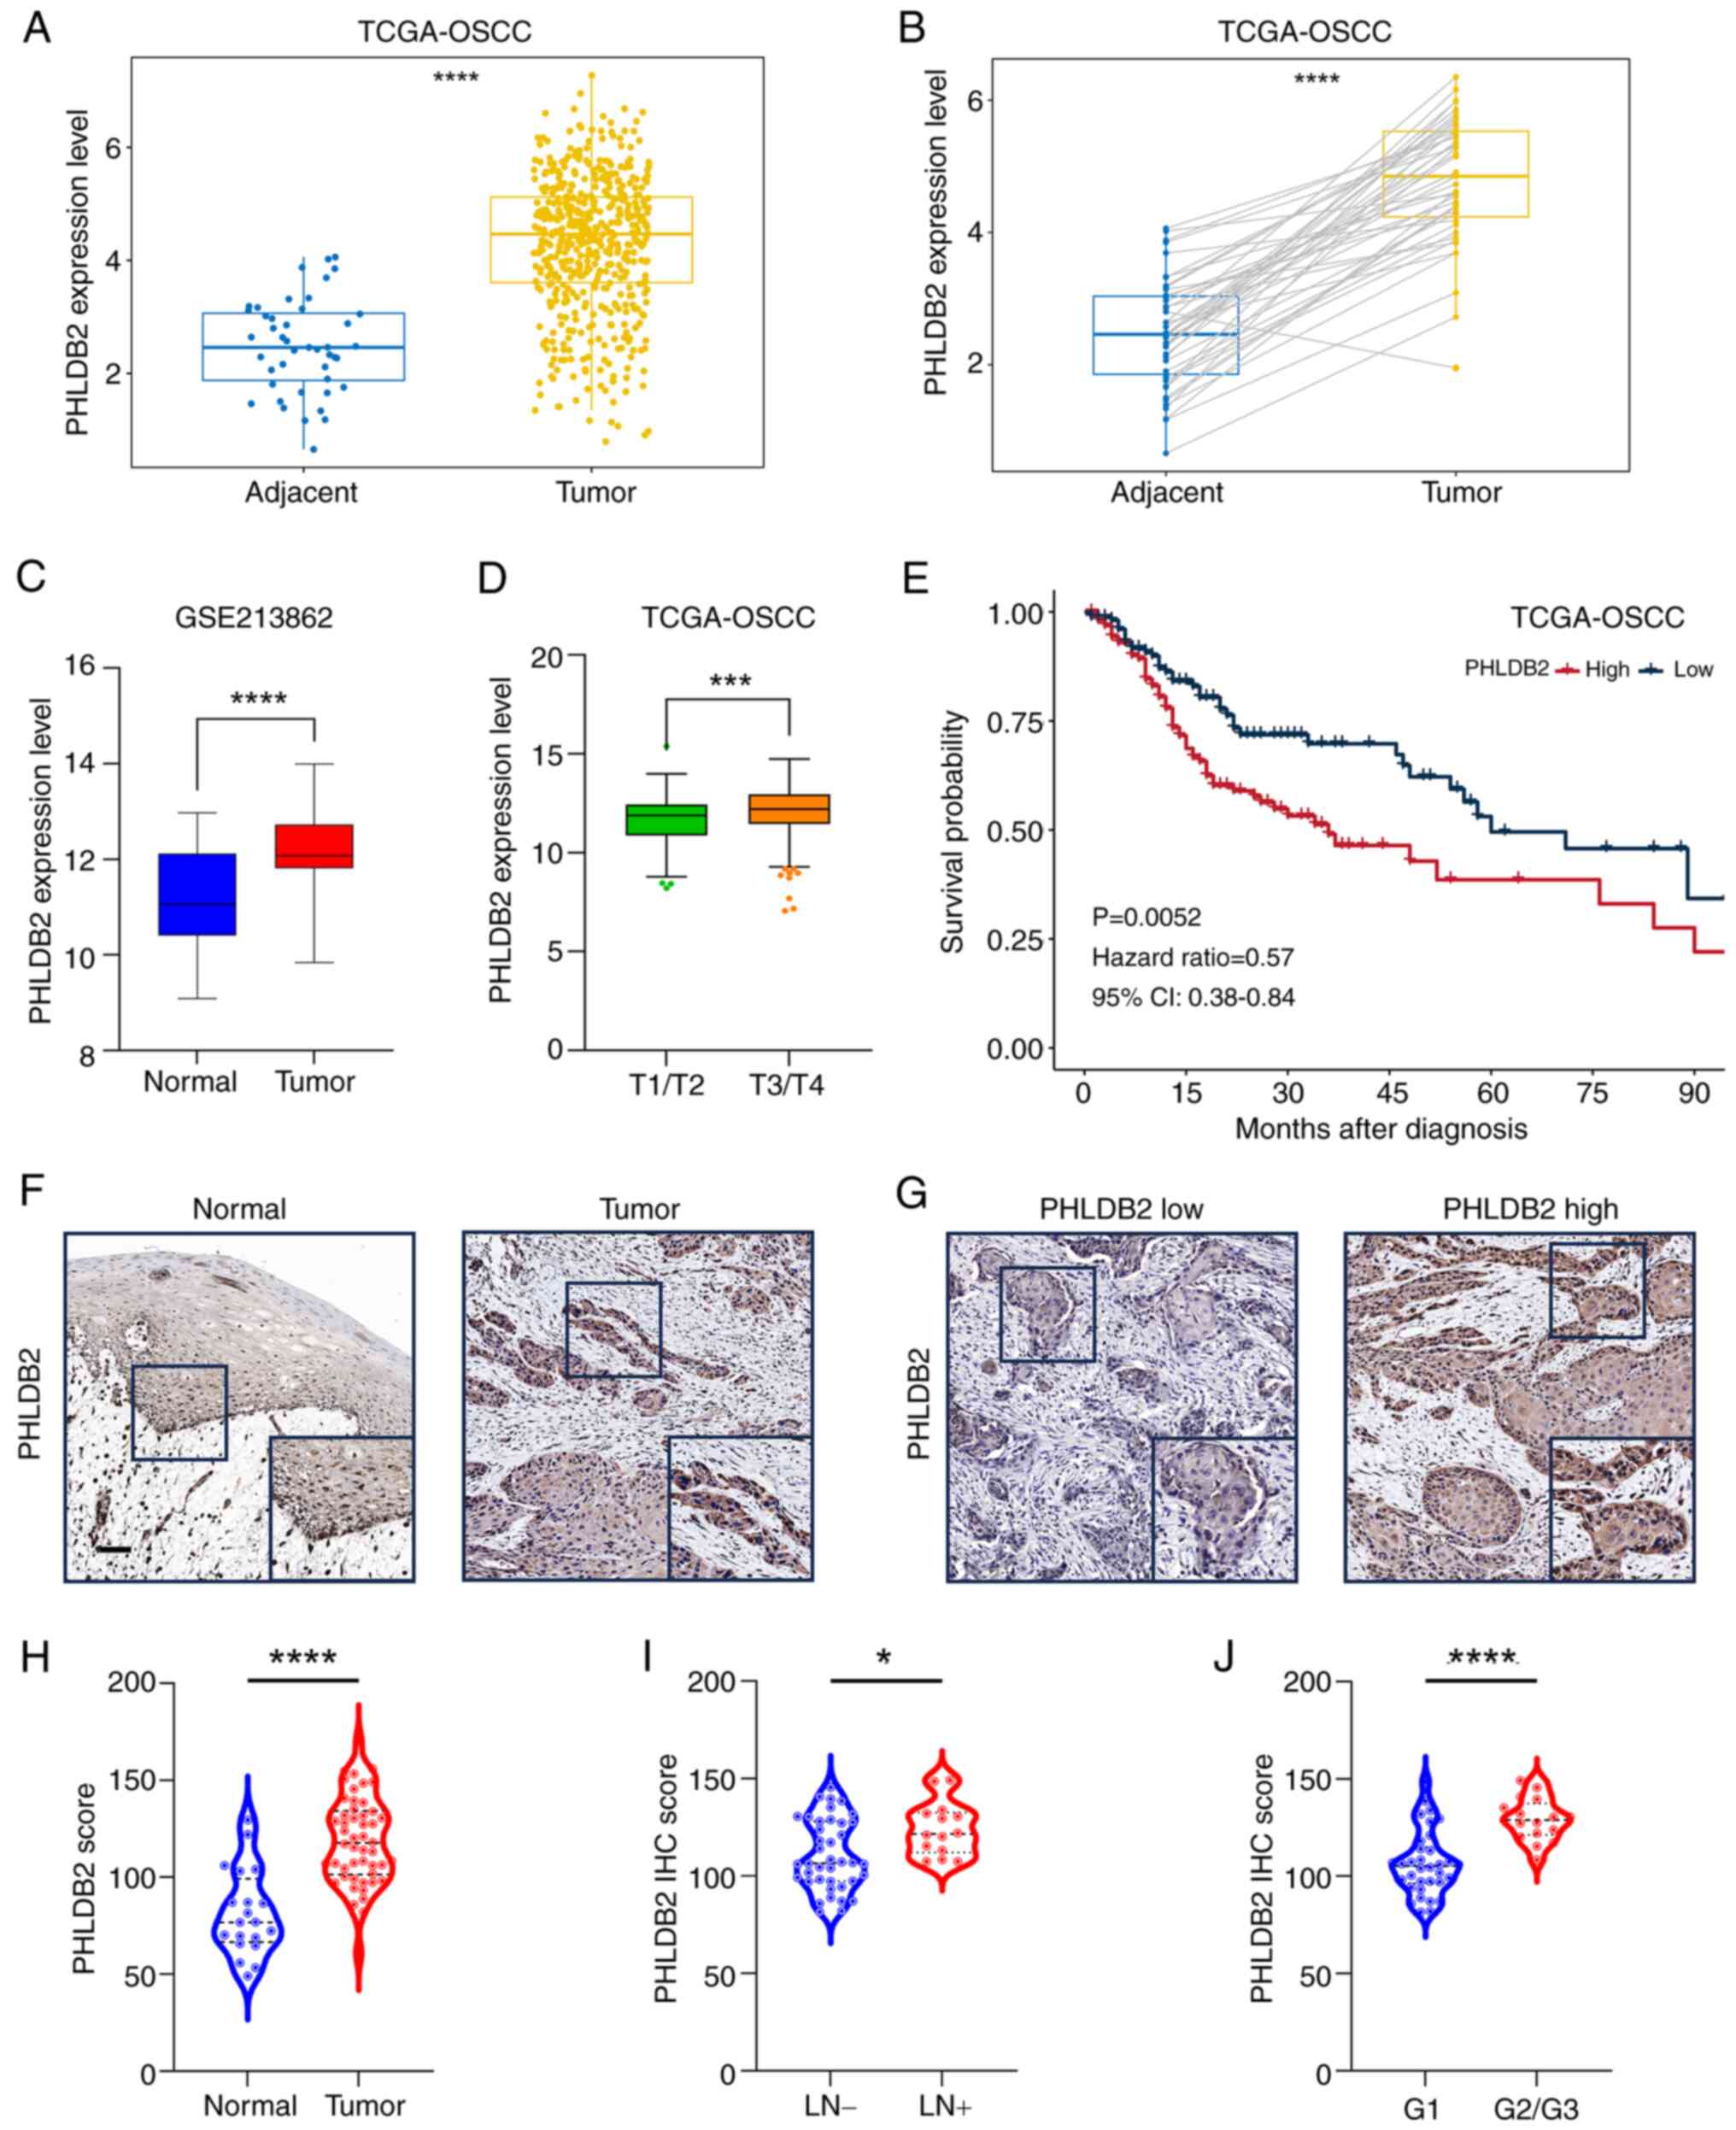
High expression of PHLDB2 is
associated with a poorer prognosis for patients with OSCC
To clarify the expression characteristics and
clinical significance of PHLDB2 in OSCC clinical samples,
multicenter data were systemically integrated. Analysis of TCGA
database revealed that PHLDB2 mRNA expression was significantly
higher in OSCC tumor tissues (n=302) compared with that in adjacent
tissues (n=67; Fig. 8A), with
consistent differences observed in paired tumor-adjacent samples
(Fig. 8B). This trend was further
validated in the independent cohort GSE213862 (n=43), where PHLDB2
expression in OSCC tissues was significantly elevated compared with
that in normal mucosal tissues from healthy individuals (Fig. 8C). Notably, analysis of TCGA-OSCC
cohort demonstrated that PHLDB2 expression was significantly higher
in advanced-stage tumors (T3/T4) compared with that in early-stage
tumors (T1/T2) (Fig. 8D), and
patients with high PHLDB2 expression had significantly shorter OS
compared with that in the patients with low PHLDB2 expression
(Fig. 8E).
To further validate protein-level expression
characteristics, IHC analysis was performed on an OSCC cohort
(n=51) from the Hospital of Stomatology, SYSU. Negative control
experiments using non-specific IgG demonstrated assay specificity
(Fig. S5). Results indicated
significantly higher PHLDB2 protein expression in tumor tissues
compared with those in adjacent normal tissues (Fig. 8F-H). Additionally, high PHLDB2
expression was significantly associated with lymph node metastasis
(Fig. 8I) and poor tumor
differentiation (G2/3 vs. G1; Fig.
8J). These data collectively suggested that elevated PHLDB2
expression may be closely linked to malignant progression and poor
prognosis in OSCC.
Discussion
Previous studies on LLPSRGs and OSCC have primarily
focused on characterizing phase separation phenomena of established
oncogenes (such as FOSL1 and DAZAP1) (26,27);
however, to the best of our knowledge, the systematic exploration
of their prognostic value remains unreported. Notably, prognostic
models based on LLPSRGs have demonstrated efficacy in stratifying
patient survival in ovarian (12),
breast (13) and bladder cancer
(14), yet this strategy remains
unexplored in OSCC. The present study innovatively integrated LLPS
mechanism exploration with prognostic model construction,
establishing the first OSCC-specific LLPSRG prognostic prediction
model, by conducting Cox and LASSO regression analyses on LLPSGs
and survival rate of TCGA-OSCC cohort. Through rigorous
bioinformatics screening and experimental validation, the
independent prognostic value of the key gene PHLDB2 was
investigated, and to the best of our knowledge, the first
experimental evidence that the PHLDB2 protein exhibits spontaneous
LLPS in OSCC cells was provided. This discovery addresses the
research gap regarding LLPSRGs in OSCC prognostic assessment
systems.
It is critical to emphasize the screening strategy
of the present study. Although the DrLLPS database provides 3,633
proteins predicted to have LLPS potential, these predictions
require experimental validation of their biological functions
(28). To enhance result
reliability, genes with high scores across multiple phase
separation prediction platforms [such as IUPred2A (19) and PhaSepDB (20)] were prioritized during the
selection of key model genes, ultimately identifying PHLDB2.
Notably, as well as PHLDB2, the other six core genes (SYT1, MYO1B,
CORO2B, CDH13, DDX21 and PKLR) included in the present prognostic
model have partial functional annotations in tumor biology, but
their LLPS-related mechanisms and roles in OSCC malignant
progression have not yet been elucidated.
Specifically, SYT1 was associated with poor
prognosis as a high-risk gene in the present model, contradicting
its tumor-suppressive role observed by Shi et al (29) in colorectal cancer. Considering the
canonical function of SYT1 in neurotransmitter release regulation
as a synaptotagmin family member, and previous findings that neural
pathways influence tumor progression through diverse mechanisms
(30–32), it was hypothesized that SYT1 may
activate pro-oncogenic signaling via phase-separated condensates at
neural synapse-related sites. This hypothesis requires validation
through co-localization experiments and neural co-culture models.
MYO1B has been linked to poor prognosis in head and neck squamous
cell carcinoma (HNSCC), glioma and colorectal cancer (33–36).
Its oncogenic role in HNSCC has been shown to involve regulation by
microRNA (miRNA)-145-3p (33), yet
whether miRNA-MYO1B interactions involve LLPS warrants further
investigation. While CORO2B and CDH13 exhibit oncogenic properties
in esophageal squamous cell carcinoma (37) and renal cancer (38), their molecular mechanisms remain
unconnected to LLPS, offering new research directions. Notably, the
high-risk association of DDX21 in the present model aligns with its
function in colorectal cancer. Specifically, Gao et al
(39) demonstrated that DDX21
activates EMT pathways through LLPS-dependent chromatin remodeling,
suggesting a conserved metastatic mechanism in OSCC. By contrast,
the negative association between the low expression and poor
prognosis (negative risk coefficient) of PKLR contradicts the
majority of reports (40–42), potentially attributable to the
unique metabolic microenvironment of OSCC or dynamic changes in the
phase-separated states of PKLR, necessitating further
investigation. While SYT1, CORO2B, CDH13, DDX21 and PKLR lack
extensive prior links to OSCC, their strong prognostic value in the
present analysis warrants further mechanistic exploration.
To the best of our knowledge, the present study is
the first to reveal the critical role of PHLDB2 as an LLPS driver
in OSCC, yet the molecular mechanisms by which it regulates
downstream signaling via LLPS require deeper exploration. Notably,
the findings of the present study do not directly establish a
causal relationship between PHLDB2-mediated LLPS and EMT/invasive
phenotypes, which requires validation, potentially through the
following mechanistic studies: i) Generation of LLPS-deficient
PHLDB2 mutants (targeting IDRs/key domains) and validation of the
loss of potential condensate formation outside and in cells,
followed by assessment of the effects of wild-type vs. mutant
PHLDB2 on EMT markers and biofunction in OSCC cells. ii)
Identification of proteins specifically recruited into PHLDB2
condensates using proximity labeling and co-immunoprecipitation
coupled with mass spectrometry, and assessment of the functional
roles of identified partners and oncogenic pathways activated by
LLPS. iii) Comparison of tumor growth/metastasis of cells
expressing wild-type vs. mutant PHLDB2 in mouse models.
As a pleckstrin homology domain protein family
member, PHLDB2 has been reported to participate in tumor metastasis
by regulating cytoskeletal rearrangement and focal adhesion
dynamics, with established links to EMT in OSCC (43,44),
colorectal cancer (45) and
gastric cancer (46). Building on
the discovery of the spontaneous LLPS condensate formation of
PHLDB2 in OSCC cells, the following novel hypothesis was proposed:
PHLDB2 may enhance EMT and metastatic efficacy through a phase
separation-dependent ‘molecular condensation’ mechanism, locally
enriching and activating cytoskeletal regulators and PI3K-Akt
signaling effectors in microenvironments, such as leading-edge
pseudopodia or invasive protrusions. This mechanism could explain
why traditional gene expression analysis inadequately captures the
oncogenic effects of PHLDB2, as its biological impact may depend
heavily on spatiotemporally specific protein interaction networks
mediated by LLPS. To address these scientific questions, subsequent
research should focus on the following: i) Interactome validation
whereby core interacting proteins within PHLDB2 condensates are
systematically screened using co-immunoprecipitation coupled with
mass spectrometry, emphasizing co-localization patterns of
cytoskeletal regulators and PI3K-Akt pathway components. ii) Phase
separation domain analysis whereby IDR deletion or phosphorylation
site mutants are constructed, combined with FRAP and in
vitro reconstitution experiments, to define the necessity of
the phase separation capability of PHLDB2 for its pro-metastatic
function and PI3K-Akt pathway activation. iii) Spatiotemporal
dynamics tracking whereby super-resolution live-cell imaging is
employed to observe real-time formation-dissolution kinetics of
PHLDB2 condensates at migration fronts and their co-evolution with
cytoskeletal regulators and PI3K-Akt pathway components. iv)
PI3K-Akt condensate crosstalk involving validation of whether
PHLDB2 scaffolds PI3K-Akt complexes via LLPS by assessing
co-condensation with PIP3-Akt using dual-color imaging, testing
functional rescue of EMT phenotypes upon PI3K-Akt inhibition in
PHLDB2-overexpressing cells, and mapping PIK3CA-binding capacity of
PH domain mutants with impaired phase separation. These
investigations could uncover the novel role of LLPS as a ‘molecular
accelerator’ in tumor cell plasticity regulation, providing a
theoretical foundation for developing anti-metastatic therapies
targeting phase separation processes.
In conclusion, the present study pioneered the
integration of LLPS mechanistic investigation with prognostic model
development, establishing the first LLPSRG prognostic prediction
model specifically for OSCC. By combining comprehensive
bioinformatics screening with experimental validation, the
independent prognostic significance of the key gene PHLDB2 was
confirmed and the first experimental evidence demonstrating the
spontaneous LLPS behavior of the PHLDB2 protein in OSCC cells was
provided. This discovery fills a critical knowledge gap regarding
LLPSRGs within OSCC prognostic evaluation frameworks.
Supplementary Material
Supporting Data
Supporting Data
Acknowledgements
Not applicable.
Funding
This work was funded by The National Natural Science Foundation
of China (grant nos. 82373015 and 82403204).
Availability of data and materials
The data generated in the present study may be
requested from the corresponding author. The RNA-seq generated in
the present study may be found in the NCBI SRA database, under
accession number PRJNA1274177 or at the following URL: https://www.ncbi.nlm.nih.gov/bioproject/PRJNA1274177,
with data of control-si group in SRX29112934 at the following URL:
https://www.ncbi.nlm.nih.gov/sra/SRX29112934[accn] and
data of PHLDB2-si group in SRX29112935 at the following URL:
https://www.ncbi.nlm.nih.gov/sra/SRX29112935[accn].
Authors' contributions
KC and YW conceptualized and validated the present
study, performed the study investigation and methodology, and wrote
the original draft of the manuscript. JC performed data acquisition
and validation, and performed the investigation. QL performed the
formal analysis and obtained the resources. XL performed data
acquisition and validation. WW conceptualized and supervised the
study, acquired the funding and reviewed and edited the manuscript.
JH conceptualized and supervised the study, acquired the funding,
performed project administration, and reviewed and edited the
manuscript. KC and YW confirm the authenticity of all the raw data.
All authors read and approved the final version of the
manuscript.
Ethics approval and consent to
participate
The present study received approval from the ethics
committee of the Hospital of Stomatology, Sun Yat-sen University
(Guangzhou, China; approval no. KQEC202013) and all participants
provided written informed consent.
Patient consent for publication
Not applicable.
Competing interests
The authors declare that they have no competing
interests.
References
|
1
|
Bray F, Laversanne M, Sung H, Ferlay J,
Siegel RL, Soerjomataram I and Jemal A: Global cancer statistics
2022: GLOBOCAN estimates of incidence and mortality worldwide for
36 cancers in 185 countries. CA Cancer J Clin. 74:229–263.
2024.PubMed/NCBI
|
|
2
|
Cramer JD, Burtness B, Le QT and Ferris
RL: The changing therapeutic landscape of head and neck cancer. Nat
Rev Clin Oncol. 16:669–683. 2019. View Article : Google Scholar : PubMed/NCBI
|
|
3
|
Alberti S, Gladfelter A and Mittag T:
Considerations and challenges in studying liquid-liquid phase
separation and biomolecular condensates. Cell. 176:419–434. 2019.
View Article : Google Scholar : PubMed/NCBI
|
|
4
|
Tong X, Tang R, Xu J, Wang W, Zhao Y, Yu X
and Shi S: Liquid-liquid phase separation in tumor biology. Signal
Transduct Target Ther. 7:2212022. View Article : Google Scholar : PubMed/NCBI
|
|
5
|
Mehta S and Zhang J: Liquid-liquid phase
separation drives cellular function and dysfunction in cancer. Nat
Rev Cancer. 22:239–252. 2022. View Article : Google Scholar : PubMed/NCBI
|
|
6
|
Zheng LW, Liu CC and Yu KD: Phase
separations in oncogenesis, tumor progressions and metastasis: A
glance from hallmarks of cancer. J Hematol Oncol. 16:1232023.
View Article : Google Scholar : PubMed/NCBI
|
|
7
|
Blackburn EH: Structure and function of
telomeres. Nature. 350:569–573. 1991. View Article : Google Scholar : PubMed/NCBI
|
|
8
|
Zhang H, Zhao R, Tones J, Liu M, Dilley
RL, Chenoweth DM, Greenberg RA and Lampson MA: Nuclear body phase
separation drives telomere clustering in ALT cancer cells. Mol Biol
Cell. 31:2048–2056. 2020. View Article : Google Scholar : PubMed/NCBI
|
|
9
|
Lu Y, Wu T, Gutman O, Lu H, Zhou Q, Henis
YI and Luo K: Phase separation of TAZ compartmentalizes the
transcription machinery to promote gene expression. Nat Cell Biol.
22:453–464. 2020. View Article : Google Scholar : PubMed/NCBI
|
|
10
|
Cheng Y, Xie W, Pickering BF, Chu KL,
Savino AM, Yang X, Luo H, Nguyen DT, Mo S, Barin E, et al:
N6-methyladenosine on mRNA facilitates a phase-separated
nuclear body that suppresses myeloid leukemic differentiation.
Cancer Cell. 39:958–972.e8. 2021. View Article : Google Scholar : PubMed/NCBI
|
|
11
|
Tulpule A, Guan J, Neel DS, Allegakoen HR,
Lin YP, Brown D, Chou YT, Heslin A, Chatterjee N, Perati S, et al:
Kinase-mediated RAS signaling via membraneless cytoplasmic protein
granules. Cell. 184:2649–2664.e18. 2021. View Article : Google Scholar : PubMed/NCBI
|
|
12
|
Qiu Y, Pan M and Chen X: A liquid-liquid
phase separation-related gene signature as prognostic biomarker for
epithelial ovarian cancer. Front Oncol. 11:6718922021. View Article : Google Scholar : PubMed/NCBI
|
|
13
|
Yu-Qing H, Peng-Ping L, Ke S, Ke-Xing Y,
Wei-Jun Z and Zhen-Yu W: Comprehensive analysis of liquid-liquid
phase separation-related genes in prediction of breast cancer
prognosis. Front Genet. 13:8344712022. View Article : Google Scholar : PubMed/NCBI
|
|
14
|
Sun L, Liu XP, Yan X, Wu S, Tang X, Chen
C, Li G, Hu H, Wang D and Li S: Identification of molecular
subtypes based on liquid-liquid phase separation and cross-talk
with immunological phenotype in bladder cancer. Front Immunol.
13:10595682022. View Article : Google Scholar : PubMed/NCBI
|
|
15
|
Chatterjee A, Chaudhary A, Ghosh A, Arun
P, Mukherjee G, Arun I, Maitra A, Biswas N and Majumder PP:
Overexpression of CD73 is associated with recurrence and poor
prognosis of gingivobuccal oral cancer as revealed by transcriptome
and deep immune profiling of paired tumor and margin tissues.
Cancer Med. 12:16774–16787. 2023. View Article : Google Scholar : PubMed/NCBI
|
|
16
|
Wilkerson MD and Hayes DN:
ConsensusClusterPlus: A class discovery tool with confidence
assessments and item tracking. Bioinformatics. 26:1572–1573. 2010.
View Article : Google Scholar : PubMed/NCBI
|
|
17
|
Love MI, Huber W and Anders S: Moderated
estimation of fold change and dispersion for RNA-seq data with
DESeq2. Genome Biol. 15:5502014. View Article : Google Scholar : PubMed/NCBI
|
|
18
|
Bill R, Wirapati P, Messemaker M, Roh W,
Zitti B, Duval F, Kiss M, Park JC, Saal TM, Hoelzl J, et al:
CXCL9:SPP1 macrophage polarity identifies a network of cellular
programs that control human cancers. Science. 381:515–524. 2023.
View Article : Google Scholar : PubMed/NCBI
|
|
19
|
Tang Z, Kang B, Li C, Chen T and Zhang Z:
GEPIA2: An enhanced web server for large-scale expression profiling
and interactive analysis. Nucleic Acids Res. 47:W556–W560. 2019.
View Article : Google Scholar : PubMed/NCBI
|
|
20
|
Mészáros B, Erdos G and Dosztányi Z:
IUPred2A: context-dependent prediction of protein disorder as a
function of redox state and protein binding. Nucleic Acids Res.
46:W329–W337. 2018. View Article : Google Scholar : PubMed/NCBI
|
|
21
|
Hou C, Wang X, Xie H, Chen T, Zhu P, Xu X,
You K and Li T: PhaSepDB in 2022: Annotating phase
separation-related proteins with droplet states, co-phase
separation partners and other experimental information. Nucleic
Acids Res. 51:D460–D465. 2023. View Article : Google Scholar : PubMed/NCBI
|
|
22
|
Livak KJ and Schmittgen TD: Analysis of
relative gene expression data using real-time quantitative PCR and
the 2(−Delta Delta C(T)) method. Methods. 25:402–408. 2001.
View Article : Google Scholar : PubMed/NCBI
|
|
23
|
Lydiatt WM, Patel SG, O'Sullivan B,
Brandwein MS, Ridge JA, Migliacci JC, Loomis AM and Shah JP: Head
and Neck cancers-major changes in the American Joint Committee on
cancer eighth edition cancer staging manual. CA Cancer J Clin.
67:122–137. 2017.PubMed/NCBI
|
|
24
|
Coussy F, El Botty R, Lavigne M, Gu C,
Fuhrmann L, Briaux A, de Koning L, Dahmani A, Montaudon E, Morisset
L, et al: Combination of PI3K and MEK inhibitors yields durable
remission in PDX models of PIK3CA-mutated metaplastic breast
cancers. J Hematol Oncol. 13:132020. View Article : Google Scholar : PubMed/NCBI
|
|
25
|
Jeong YG, Katuwal NB, Kang MS, Ghosh M,
Hong SD, Park SM, Kim SG, Kim TH and Moon YW: Combined PI3K
inhibitor and eribulin enhances anti-tumor activity in preclinical
models of paclitaxel-resistant, PIK3CA-mutated endometrial cancer.
Cancers (Basel). 15:48872023. View Article : Google Scholar : PubMed/NCBI
|
|
26
|
Zhang J, Ni Z, Zhang Y, Guo Y, Zhai R,
Wang M, Gong Z, Wang M, Zeng F, Gu Z, et al: DAZAP1 phase
separation regulates mitochondrial metabolism to facilitate
invasion and metastasis of oral squamous cell carcinoma. Cancer
Res. 84:3818–3833. 2024. View Article : Google Scholar : PubMed/NCBI
|
|
27
|
Wang W, Yun B, Hoyle RG, Ma Z, Zaman SU,
Xiong G, Yi C, Xie N, Zhang M, Liu X, et al: CYTOR facilitates
formation of FOSL1 phase separation and super enhancers to drive
metastasis of tumor budding cells in head and neck squamous cell
carcinoma. Adv Sci (Weinh). 11:e23050022024. View Article : Google Scholar : PubMed/NCBI
|
|
28
|
Ning W, Guo Y, Lin S, Mei B, Wu Y, Jiang
P, Tan X, Zhang W, Chen G, Peng D, et al: DrLLPS: A data resource
of liquid-liquid phase separation in eukaryotes. Nucleic Acids Res.
48(D1): D288–D295. 2020. View Article : Google Scholar : PubMed/NCBI
|
|
29
|
Shi J, Li W, Jia Z, Peng Y, Hou J, Li N,
Meng R, Fu W, Feng Y, Wu L, et al: Synaptotagmin 1 suppresses
colorectal cancer metastasis by inhibiting ERK/MAPK
signaling-mediated tumor cell pseudopodial formation and migration.
Cancers (Basel). 15:52822023. View Article : Google Scholar : PubMed/NCBI
|
|
30
|
Balood M, Ahmadi M, Eichwald T, Ahmadi A,
Majdoubi A, Roversi K, Roversi K, Lucido CT, Restaino AC, Huang S,
et al: Nociceptor neurons affect cancer immunosurveillance. Nature.
611:405–412. 2022. View Article : Google Scholar : PubMed/NCBI
|
|
31
|
Zhang Y, Lin C, Liu Z, Sun Y, Chen M, Guo
Y, Liu W, Zhang C, Chen W, Sun J, et al: Cancer cells co-opt
nociceptive nerves to thrive in nutrient-poor environments and upon
nutrient-starvation therapies. Cell Metab. 34:1999–2017.e10. 2022.
View Article : Google Scholar : PubMed/NCBI
|
|
32
|
Qiao N, Dai X, Chen J, Cao H, Hu G, Guo X,
Liu P, Xing C and Yang F: Single nucleus RNA sequencing reveals
cellular and molecular responses to vanadium exposure in duck
kidneys. J Hazard Mater. 480:1364922024. View Article : Google Scholar : PubMed/NCBI
|
|
33
|
Yamada Y, Koshizuka K, Hanazawa T, Kikkawa
N, Okato A, Idichi T, Arai T, Sugawara S, Katada K, Okamoto Y and
Seki N: Passenger strand of miR-145-3p acts as a tumor-suppressor
by targeting MYO1B in head and neck squamous cell carcinoma. Int J
Oncol. 52:166–178. 2018.PubMed/NCBI
|
|
34
|
Zhou X, Wang R, Li X, Yu L, Hua D, Sun C,
Shi C, Luo W, Rao C, Jiang Z, et al: Splicing factor SRSF1 promotes
gliomagenesis via oncogenic splice-switching of MYO1B. J Clin
Invest. 129:676–693. 2019. View Article : Google Scholar : PubMed/NCBI
|
|
35
|
Chen YH, Xu NZ, Hong C, Li WQ, Zhang YQ,
Yu XY, Huang YL and Zhou JY: Myo1b promotes tumor progression and
angiogenesis by inhibiting autophagic degradation of HIF-1α in
colorectal cancer. Cell Death Dis. 13:9392022. View Article : Google Scholar : PubMed/NCBI
|
|
36
|
Wang H, Yang F, Ye J, Dai X, Liao H, Xing
C, Jiang Z, Peng C, Gao F and Cao H: Ginkgo biloba extract
alleviates deltamethrin-induced testicular injury by upregulating
SKP2 and inhibiting Beclin1-independent autophagy. Phytomedicine.
135:1562452024. View Article : Google Scholar : PubMed/NCBI
|
|
37
|
Zhang D, Qian C, Wei H and Qian X:
Identification of the prognostic value of tumor
microenvironment-related genes in esophageal squamous cell
carcinoma. Front Mol Biosci. 7:5994752020. View Article : Google Scholar : PubMed/NCBI
|
|
38
|
Shao Y, Li W, Zhang L, Xue B, Chen Y,
Zhang Z, Wang D and Wu B: CDH13 is a prognostic biomarker and a
potential therapeutic target for patients with clear cell renal
cell carcinoma. Am J Cancer Res. 12:4520–4544. 2022.PubMed/NCBI
|
|
39
|
Gao H, Wei H, Yang Y, Li H, Liang J, Ye J,
Zhang F, Wang L, Shi H, Wang J and Han A: Phase separation of DDX21
promotes colorectal cancer metastasis via MCM5-dependent EMT
pathway. Oncogene. 42:1704–1715. 2023. View Article : Google Scholar : PubMed/NCBI
|
|
40
|
Wang S, Zhang Y, Cai Q, Ma M, Jin LY, Weng
M, Zhou D, Tang Z, Wang JD and Quan Z: Circular RNA FOXP1 promotes
tumor progression and Warburg effect in gallbladder cancer by
regulating PKLR expression. Mol Cancer. 18:1452019. View Article : Google Scholar : PubMed/NCBI
|
|
41
|
Chen WY, Thuy Dung PV, Yeh HL, Chen WH,
Jiang KC, Li HR, Chen ZQ, Hsiao M, Huang J, Wen YC and Liu YN:
Targeting PKLR/MYCN/ROMO1 signaling suppresses neuroendocrine
differentiation of castration-resistant prostate cancer. Redox
Biol. 62:1026862023. View Article : Google Scholar : PubMed/NCBI
|
|
42
|
Peng J, Dai X, Zhang T, Hu G, Cao H, Guo
X, Fan H, Chen J, Tang W and Yang F: Copper as the driver of the
lncRNA-TCONS-6251/miR-novel-100/TC2N axis: Unraveling ferroptosis
in duck kidney. Int J Biol Macromol. 282:1367972024. View Article : Google Scholar : PubMed/NCBI
|
|
43
|
Li H, Wang Z, Liang H, Liu X, Liu H,
Zhuang Z and Hou J: Depletion of PHLDB2 suppresses
epithelial-mesenchymal transition and enhances anti-tumor immunity
in head and neck squamous cell carcinoma. Biomolecules. 14:2322024.
View Article : Google Scholar : PubMed/NCBI
|
|
44
|
Chen J, Dai X, Xing C, Zhang Y, Cao H, Hu
G, Guo X, Gao X, Liu P and Yang F: Cooperative application of
transcriptomics and ceRNA hypothesis: lncRNA-00742/miR-116 targets
CD74 to mediate vanadium-induced mitochondrial apoptosis in duck
liver. J Hazard Mater. 480:1359042024. View Article : Google Scholar : PubMed/NCBI
|
|
45
|
Chen G, Zhou T, Ma T, Cao T and Yu Z:
Oncogenic effect of PHLDB2 is associated with
epithelial-mesenchymal transition and E-cadherin regulation in
colorectal cancer. Cancer Cell Int. 19:1842019. View Article : Google Scholar : PubMed/NCBI
|
|
46
|
Kang W, Zhang J, Huang T, Zhou Y, Wong CC,
Chan RCK, Dong Y, Wu F, Zhang B, Wu WKK, et al: NOTCH3, a crucial
target of miR-491-5p/miR-875-5p, promotes gastric carcinogenesis by
upregulating PHLDB2 expression and activating Akt pathway.
Oncogene. 40:1578–1594. 2021. View Article : Google Scholar : PubMed/NCBI
|