Introduction
Oral squamous cell carcinoma (OSCC), a prominent
subtype of head and neck squamous cell carcinoma (HNSCC),
originates in the oral cavity epithelium (1). Despite advancements in comprehensive
surgery-based therapeutic approaches, the 5-year overall survival
rate of patients with OSCC remains stagnant at ~50% worldwide
(1–3). Elucidating the molecular regulatory
mechanisms underlying OSCC progression is critical for the
development of effective targeted therapeutic strategies.
Hypoxia is a hallmark of solid tumors (4–6).
Patients with hypoxic primary tumors at diagnosis have an elevated
risk of local recurrence and distant metastasis (5). Hypoxia is associated with adverse
outcomes in various malignancies, including prostate cancer, liver
cancer, breast cancer and HNSCC (7–11).
The hypoxic microenvironment drives malignant phenotypes such as
proliferation and invasion by reprogramming the transcriptional
landscape of tumor cells (12,13).
Furthermore, hypoxia triggers metabolic reprogramming,
characterized by enhanced glucose uptake to fuel rapid tumor growth
(10,13). Concomitantly, hypoxia increases the
glycolytic flux within tumor cells, resulting in excessive lactate
production and secretion (10,13).
However, the key molecular mechanisms underlying hypoxia-driven
progression of OSCC require systematic delineation.
Enhancers are critical cis-regulatory DNA elements
that modulate target gene expression by recruiting specific
transcription factors (14,15).
Super-enhancers (SEs) are large clusters of multiple typical
enhancers (TEs) characterized by pronounced enrichment of histone
modifications, such as histone-3 lysine-27 acetylation (H3K27ac)
and master transcription factors, which collectively orchestrate
transcriptional programs that define cellular identity (16–18).
SEs exhibit notably enhanced transcriptional activation capacity
compared with TEs (17,19). However, the regulatory mechanisms
underlying the responsiveness of SEs to hypoxia in OSCC remain
poorly understood.
Machine learning-based artificial intelligence
technologies enable the construction of data-driven computational
frameworks to extract latent patterns from multidimensional data
(20,21). In oncology, machine learning is
improving cancer research by addressing tumor heterogeneity,
deciphering complex molecular regulatory networks and processing
massive multi-omics datasets (20–24).
However, the deep mining of transcriptomic data based on machine
learning faces numerous challenges, particularly in overcoming high
dimensionality and model overfitting. To address these challenges,
Liu et al (25) developed
Mime, an open-source integrated machine learning platform tailored
for transcriptomic analysis. By systematically evaluating the
performance of diverse algorithmic models, Mime optimizes workflows
for large-scale feature selection and candidate gene prioritization
(25). Application of the Mime
platform to transcriptomic datasets from OSCC provides a robust
computational support for mechanistic investigations and
therapeutic exploration.
The present study aimed to identify key regulators
of hypoxic adaptation in OSCC by integrating multi-omics analysis,
machine learning and experimental validation. The findings could
establish the FOSL2/DYNC1H1 axis as a critical driver of the
hypoxic adaptation in OSCC.
Materials and methods
Single-cell RNA sequencing (scRNA-seq)
data processing and analysis
Single-cell transcriptomic analysis was performed
using OSCC scRNA-seq data from the Gene Expression Omnibus (GEO)
database (https://www.ncbi.nlm.nih.gov/geo/) under accession
numbers GSE173468 (26), GSE188737
(27) and GSE234933 (28). To define a strict OSCC cohort,
sample selection was limited to primary tumors localized in the
oral cavity, specifically the tongue, buccal mucosa, floor of
mouth, hard palate, alveolar ridge and lip, as verified by clinical
metadata. Specimens from extraoral head and neck sites (such as the
larynx or pharynx) were discarded.
Data processing was performed using the Seurat R
package (v5.3.0; Posit Software, PBC). Seurat object was
constructed using the ‘CreateSeuratObject’ function. The
‘PercentageFeatureSet’ function was employed to calculate the
mitochondrial gene percentage per cell. Quality control thresholds
were applied to retain cells expressing between 300 and 6,000
detected genes while exhibiting a mitochondrial gene content of
<15%. Genes detected in <3 cells were excluded from
subsequent analyses. Batch effects were corrected using the Harmony
algorithm. Successful integration was confirmed by Uniform Manifold
Approximation and Projection (UMAP) visualization, in which cells
were clustered by biological cell type rather than by the dataset
of origin, and canonical marker expression patterns for major cell
lineages were preserved. The top 3,000 highly variable genes were
identified using the ‘FindVariableFeatures’ function. Principal
component analysis was executed with the ‘RunPCA’ function. Cell
clustering analysis was performed on the initial top 20 principal
components using the ‘FindClusters’ function, followed by
dimensionality reduction and visualization via UMAP implemented in
the ‘RunUMAP’ function. Marker genes defining cell clusters were
identified using the ‘FindAllMarkers’ function. Cell clusters were
annotated based on the expression profiles of canonical marker
genes.
High-dimensional weighted gene co-expression network
analysis (hdWGCNA) was performed on scRNA-seq data for epithelial
cells using the ‘hdWGCNA’ package. Genes expressed in ≥5% of total
epithelial cells were selected for metacell matrix construction via
the ‘MetacellsByGroups’ function. The optimal soft-thresholding
power was determined using the ‘TestSoftPowers’ function. Following
soft threshold selection, an unsigned topological overlap matrix
network was constructed via the ‘ConstructNetwork’ function. Module
eigengenes were extracted using the ‘ModuleEigengenes’ function.
Spearman's correlation coefficients were calculated to assess the
associations between module eigengenes and hypoxia/glycolysis
scores, with statistical significance defined as a false discovery
rate-corrected P<0.05.
Bulk RNA-seq data processing and
analysis
Bulk RNA-seq data were derived from The Cancer
Genome Atlas (TCGA) Head and Neck Squamous Cell Carcinoma dataset
(n=522; http://tcga-data.nci.nih.gov/tcga), in which data from
OSCC samples, including tongue, buccal mucosa and lip, were
extracted and assembled into the TCGA-OSCC cohort. A total of 50
cancer-related hallmark scores were quantified using single-sample
gene set enrichment analysis (ssGSEA) with curated gene sets from
the Molecular Signatures Database [accession number: H (hallmark
gene sets); https://www.gsea-msigdb.org/gsea/msigdb/index.jsp].
Hierarchical clustering analysis was performed based on the
hallmark ssGSEA scores using the gene set variation analysis
algorithm. Kaplan-Meier recurrence-free survival (RFS) curves were
generated using the ‘survminer’ R package. Differential gene
expression analysis between OSCC tissues and normal control tissues
was conducted using the ‘limma’ R package. Spearman's correlation
coefficients were computed between gene expression levels using R
(v4.3.1).
Comprehensive machine learning
analysis
The TCGA-OSCC cohort was used as the training
cohort, while the GSE65858 (HNSCC samples; n=270) (29) dataset served as the validation
cohort; only samples containing complete survival information were
included in either cohort. Hypoxia- and glycolysis-associated genes
identified by hdWGCNA were used as input features within the Mime
machine learning framework (25).
Prior to model construction, the expression profiles of the input
genes were independently extracted and subjected to Z-score
standardization in both training and validation cohorts. This
framework integrates 10 distinct algorithms: Random survival
forests, elastic network (Enet), stepwise Cox (StepCox), CoxBoost,
partial least squares regression for Cox, supervised principal
components, generalized boosted regression models, survival support
vector machine, Ridge and least absolute shrinkage and selection
operator.
Briefly, the ‘ML.Dev.Prog.Sig’ function was employed
to establish combined prognostic models based on the hypoxia- and
glycolysis-associated genes using the training cohort (TCGA-OSCC
cohort), and the resulting models were validated using the
independent validation cohort (GSE65858). The performance of the
combined models was evaluated based on the concordance index
(C-index) within the validation cohort, where a higher C-index
signified superior predictive accuracy and reliability. Patients
were stratified into high- and low-risk groups based on the median
risk score calculated using the combined model with the highest
validation C-index. Kaplan-Meier curves depicting RFS were
generated to analyze survival outcomes. Core feature genes were
identified from the candidate genes using the
‘ML.Corefeature.Prog.Screen’ function. Cox proportional hazards
regression was used to calculate hazard ratios and 95% confidence
intervals for the core feature genes.
Chromatin immunoprecipitation
sequencing (ChIP-seq) data processing
H3K27ac ChIP-seq data of OSCC cells (HSC3 and SAS)
were obtained from the GSE205455 dataset (30). Reads were aligned to the hg19
reference genome using Bowtie2 (v2.4.1; Ben Langmead, Johns Hopkins
University), followed by sorting and filtering using the Picard
tool to remove unmapped, multimapped and duplicate reads. H3K27ac
peaks were identified using the ‘findPeaks’ function in HOMER
(v5.1; http://homer.ucsd.edu/homer/) with
-style histone parameter, where adjacent peaks within 12.5 kb were
merged. SE and TE classification was performed via the SE tool in
the HOMER algorithm, defining points with a tangent slope >1 as
SEs, and those with a slope ≤1 as TEs. Visualization of the H3K27ac
enrichment profiles was conducted using the Integrative Genomics
Viewer (https://igv.org).
Transcription factor prediction
The Toolkit for Cistrome Data Browser (http://dbtoolkit.cistrome.org/) was used to
identify the putative transcription factors for DYNC1H1.
Cell culture and hypoxia
treatment
Human OSCC cells (HSC3 and SAS) were obtained from
the Japanese Collection of Research Bioresources Cell Bank. Cells
were cultured in Dulbecco's Modified Eagle Medium (DMEM; Gibco;
Thermo Fisher Scientific, Inc.) supplemented with 10% fetal bovine
serum (Gibco; Thermo Fisher Scientific, Inc.) and 1%
penicillin-streptomycin (100 U/ml penicillin; 100 µg/ml
streptomycin) at 37°C. Under normoxic conditions, cells were
maintained in 21% O2, 5% CO2 and 74%
N2. Under hypoxic conditions, cells were cultured in 1%
O2, 5% CO2 and 94% N2 for 24
h.
Gene knockdown (KD) and overexpression
(OE)
Lentiviral constructs mediating the KD of DYNC1H1
(KD-DYNC1H1), OE of DYNC1H1 (OE-DYNC1H1), KD of FOSL2 (KD-FOSL2),
OE of FOSL2 (OE-FOSL2) and corresponding negative control vectors
[KD-control (ctrl) and OE-ctrl] were purchased from Shanghai
GenePharma Co., Ltd. For OE, the full-length coding sequences of
DYNC1H1 and FOSL2 were cloned into the pLV-CMV-MCS-PGK-Puro
lentiviral vector backbone (Shanghai GenePharma Co., Ltd). The
corresponding OE control (OE-ctrl) was the pLV-CMV-MCS-PGK-Puro
backbone without insert. For KD, short hairpin RNA (shRNA)
sequences targeting DYNC1H1 or FOSL2 were inserted into the
pLV-U6-shRNA-PGK-Puro lentiviral vector (Shanghai GenePharma Co.,
Ltd). The KD control (KD-ctrl) was the pLV-U6-shRNA-PGK-Puro
backbone inserted with nontargeting shRNAs.
Recombinant lentiviruses were produced using a 3rd
generation system. Briefly, 293T cells (Cell Bank of the Chinese
Academy of Sciences) were co-transfected with 10 µg of transfer
plasmids (pLV-CMV-MCS-PGK-Puro for OE or pLV-U6-shRNA-PGK-Puro for
KD; Shanghai GenePharma), 7.5 µg psPAX2 and 2.5 µg pMD2.G using
Lipofectamine 3000 (Invitrogen; Thermo Fisher Scientific, Inc.)
according to the manufacturer's protocol. Transfection was
performed at 37°C for 8 h, after which the medium was replaced.
Lentiviral particles were harvested from the culture supernatant at
48 h post-transfection, filtered through 0.45-µm membranes, and
concentrated by ultracentrifugation.
HSC3 and SAS cells were transfected with lentiviral
particles at a multiplicity of infection of 10 for 24 h. Stable
polyclonal populations were selected using 2 µg/ml puromycin for 7
days and subsequently maintained in DMEM containing 1 µg/ml
puromycin. All downstream experiments were performed at least 48 h
after the selection process was completed. The efficiency of target
gene KD or OE was evaluated using quantitative PCR (qPCR) and
western blot analyses. The shRNA sequences were as follows:
KD-DYNC1H1, sense, 5′-GCAGAUAAACCCGUGUCUU-3′, and antisense,
5′-AAGACACGGGUUUAUCUGC-3′; KD-FOSL2, sense:
5′-GGAUUAUCCCGGGAACUUU-3′, and antisense,
5′-AAAGUUCCCGGGAUAAUCC-3′; KD-ctrl, sense,
5′-UUCUCCGAACGUGUCACGU-3′ and antisense,
5′-ACGUGACACGUUCGGAGAA-3′.
Reverse transcription (RT)-qPCR
Total RNA from HSC3 and SAS cells was isolated using
the TRIzol® reagent (Invitrogen; Thermo Fisher
Scientific, Inc.), followed by cDNA synthesis using the PrimeScript
RT Reagent Kit (Takara Bio, Inc.) according to the manufacturer's
protocol. qPCR amplification was performed on a 7,500 Real-Time PCR
System (Applied Biosystems; Thermo Fisher Scientific, Inc.) using
the SYBR Green qPCR Master Mix Kit (Thermo Fisher Scientific, Inc.)
with the following cycling conditions: Initial denaturation at 95°C
for 30 sec; 40 cycles of 95°C for 5 sec and 60°C for 34 sec, and
95°C for 15 sec. Relative gene expression was normalized to GAPDH
and calculated via the 2−ΔΔCq method (31). The primer sequences used for qPCR
were as follows: DYNC1H1, forward, 5′-TTGGGCACTAGGAAATTGATGC-3′,
and reverse, 5′-GCAGGGTTGATACGCCACA-3′; mediator of RNA polymerase
II transcription subunit 1 (MED1), forward,
5′-GAGGGCATCAACATTTGGTCA-3′, and reverse,
5′-AGATGAGAGCCCAGTCCATTC-3′; RNA polymerase II subunit A (POLR2A),
forward, 5′-GGGTGGCATCAAATACCCAGA-3′, and reverse,
5′-AGACACAGCGCAAAACTTTCA-3′; SMARCC2, forward,
5′-ACTGCCGATCAAATGTTTCCT-3′, and reverse,
5′-ACAGGCAATTATTCTGCACCAAG-3′; FOSL2, forward,
5′-CAGAAATTCCGGGTAGATATGCC-3′, and reverse,
5′-GGTATGGGTTGGACATGGAGG-3′; RNA polymerase II subunit B (POLR2B),
forward, 5′-AAAGGCTTGGTTAGACAACAGC-3′, and reverse,
5′-ATCGTGGCGGTTCTTCAACTT-3′; 5′-3′ exoribonuclease 2 (XRN2),
forward, 5′-CACACATGAACCGAACTTTACCA-3′, and reverse,
5′-GCACAAGGAAGACTATCGGCAA-3′; mRNA-decapping enzyme 1A (DCP1A),
forward, 5′-TCTGGACACAAGCATCTGACG-3′, and reverse,
5′-GGGTGGTGATTTCAGGCTGG-3′; ASXL1, forward,
5′-CGCGCCTGGTATTAGAAAACT-3′, and reverse,
5′-GCATCCTTCTTGAGCGTGAAAAG-3′; RING finger protein 2 (RNF2),
forward, 5′-CAAACGGAACTCAACCATTAAGC-3′, and reverse,
5′-CCACTTCTAAGGGCTGTGATG-3′; peroxisome proliferator-activated
receptor δ (PPARD), forward, 5′-AGGGCTGACTGCAAACGA-3′, and reverse,
5′-CTGCCACAATGTCTCGATGTC-3′; RBPJ, forward,
5′-CGGCCTCCACCTAAACGAC-3′, and reverse,
5′-TCCATCCACTGCCCATAAGAT-3′; Myc-associated factor X (MAX),
forward, 5′-CAATCTGCGGCTGACAAACG-3′, and reverse,
5′-GCACTTGACCTCGCCTTCT-3′; GAPDH, forward,
5′-GGAGCGAGATCCCTCCAAAAT-3′, and reverse,
5′-GGCTGTTGTCATACTTCTCATGG-3′.
Western blot analysis
HSC3 and SAS cells were lysed in RIPA buffer
(MilliporeSigma). Protein concentrations were quantified using the
BCA Protein Assay Kit (Beyotime Biotechnology). Lysates were
denatured at 95°C for 10 min. Denatured samples (40 µg per lane)
were resolved using 10% sodium dodecyl sulfate-polyacrylamide gel
electrophoresis and electrotransferred onto polyvinylidene fluoride
membranes (MilliporeSigma). Membranes were blocked with 5% skim
milk for 2 h at room temperature, followed by overnight incubation
at 4°C with primary antibodies. After washing with TBST (0.1%
Tween-20), the membranes were incubated with horseradish
peroxidase-conjugated goat anti-rabbit secondary antibody (1:5,000;
cat. no. ab205718; Abcam) for 1 h at room temperature. Protein
bands were visualized using an enhanced chemiluminescence reagent
(SuperSignal West Pico PLUS Chemiluminescent Substrate; Thermo
Fisher Scientific, Inc.). The following primary antibodies were
used: Anti-DYNC1H1 (1:2,000; cat. no. ab245554; Abcam), anti-FOSL2
(1:2,000; cat. no. 19967; Cell Signaling Technology, Inc.),
anti-ASXL1 (1:2,000; cat. no. ab50817; Abcam) and anti-GAPDH
(1:2,000; cat. no. ab8245; Abcam).
Chromatin immunoprecipitation followed
by qPCR (ChIP-qPCR)
HSC3 and SAS cells were crosslinked with 1%
formaldehyde for 15 min at room temperature and quenched with 125
mM glycine solution. After washing with phosphate-buffered saline,
cells were lysed in lysis buffer and sonicated on ice using a Q700
sonicator (Qsonica LLC) for 15 cycles (15 sec on, 45 sec off). The
sonicated lysates were immunoprecipitated with anti-H3K27ac (cat.
no. ab4729; Abcam) and anti-FOSL2 (cat. no. 19967, Cell Signaling
Technology, Inc.) overnight at 4°C. Antibody-chromatin complexes
were captured by incubation with Protein A/G magnetic beads (Thermo
Fisher Scientific, Inc) at 4°C for 2 h, followed by a series of
salt washes (including one wash with low-salt buffer, one wash with
high-salt buffer, one wash with LiCl buffer and two final washes
with TE buffer). Immunoprecipitated chromatin was eluted in elution
buffer at 65°C for 30 min, treated with RNase A and proteinase K,
and purified by phenol-chloroform-isoamyl alcohol extraction.
Purified DNA was analyzed using qPCR as aforementioned. The
following primer sequences were used (based on human genome
assembly hg38): TE (chr14: 101948350-101948574), forward,
5′-GTGTGACCCGTCTGGTGTAG-3′, and reverse,
5′-GTCCACGTCATTGGGAGAGG-3′; SE1 (chr14: 101964657-101964898),
forward, 5′-TCTCATCGCTCCTGGAAGGT-3′, and reverse,
5′-AAGGAACTTGCGCATCTGCT-3′; SE2 (chr14: 101972663-101972979),
forward, 5′-GGACTGCGCAATTTCTGTGT-3′, and reverse,
5′-AGCCACACACGATTACAACCT-3′; SE3 (chr14: 101979574-101979881),
forward, 5′-GAGGGTAACGCTAGTGAGCC-3′, and reverse,
5′-TGGCTTTTCTCCACGCTCAT-3′.
Cell Counting Kit-8 (CCK-8) assay
Cell proliferation was assessed using the CCK-8
(Beijing Solarbio Science & Technology Co., Ltd). Briefly, HSC3
and SAS cells were seeded into 96-well plates at a density of
5×10³ cells/well. At 0, 1, 2 and 3 days post-seeding, 10
µl of CCK-8 solution was added to each well and incubated for 2 h
at 37°C. Absorbance was measured at 450 nm using a microplate
reader (Thermo Fisher Scientific, Inc.).
Transwell assay
Transwell inserts with an 8 µm pore size (Corning,
Inc.) were pre-coated with Matrigel (BD Biosciences) and incubated
at 37°C for 1 h to allow polymerization. HSC3 and SAS cells were
resuspended in serum-free DMEM (Gibco; Thermo Fisher Scientific,
Inc.) and seeded in the upper chambers at 3×10⁵
cells/well in 200 µl. The lower chambers contained 600 µl of DMEM
supplemented with 10% fetal bovine serum (Gibco; Thermo Fisher
Scientific, Inc.). Following 12 h incubation at 37°C, non-invaded
cells were removed from the upper membrane surface. Invading cells
on the lower membrane surface were fixed with 4% paraformaldehyde
for 20 min and stained with 0.1% crystal violet for 30 min at room
temperature. The stained cells were quantified by counting five
randomly selected fields per membrane under an optical microscope
(Olympus Corporation) at ×200 magnification.
Glucose uptake and lactate production
assay
HSC3 and SAS cells were seeded into 6-well plates at
3×10⁶ cells/well and cultured for 48 h at 37°C. Glucose
uptake was quantified using a Glucose Uptake Assay Kit (cat. no.
ab136955; Abcam). Lactate production was measured using an
L-Lactate Assay Kit (cat. no. ab65331; Abcam).
Statistical analysis
Quantitative data are presented as mean ± standard
deviation from at least three biologically independent experiments.
Statistical analyses were performed using R (version 4.3.1; R
Foundation for Statistical Computing) and GraphPad Prism (version
10.4.0; Dotmatics). Comparisons between two groups were assessed
using unpaired Student's t-tests. Comparisons among ≥3 groups were
conducted using one-way analysis of variance followed by Tukey's
post hoc test. P<0.05 was considered to indicate a statistically
significant difference.
Results
Hypoxia as a risk factor for RFS in
OSCC
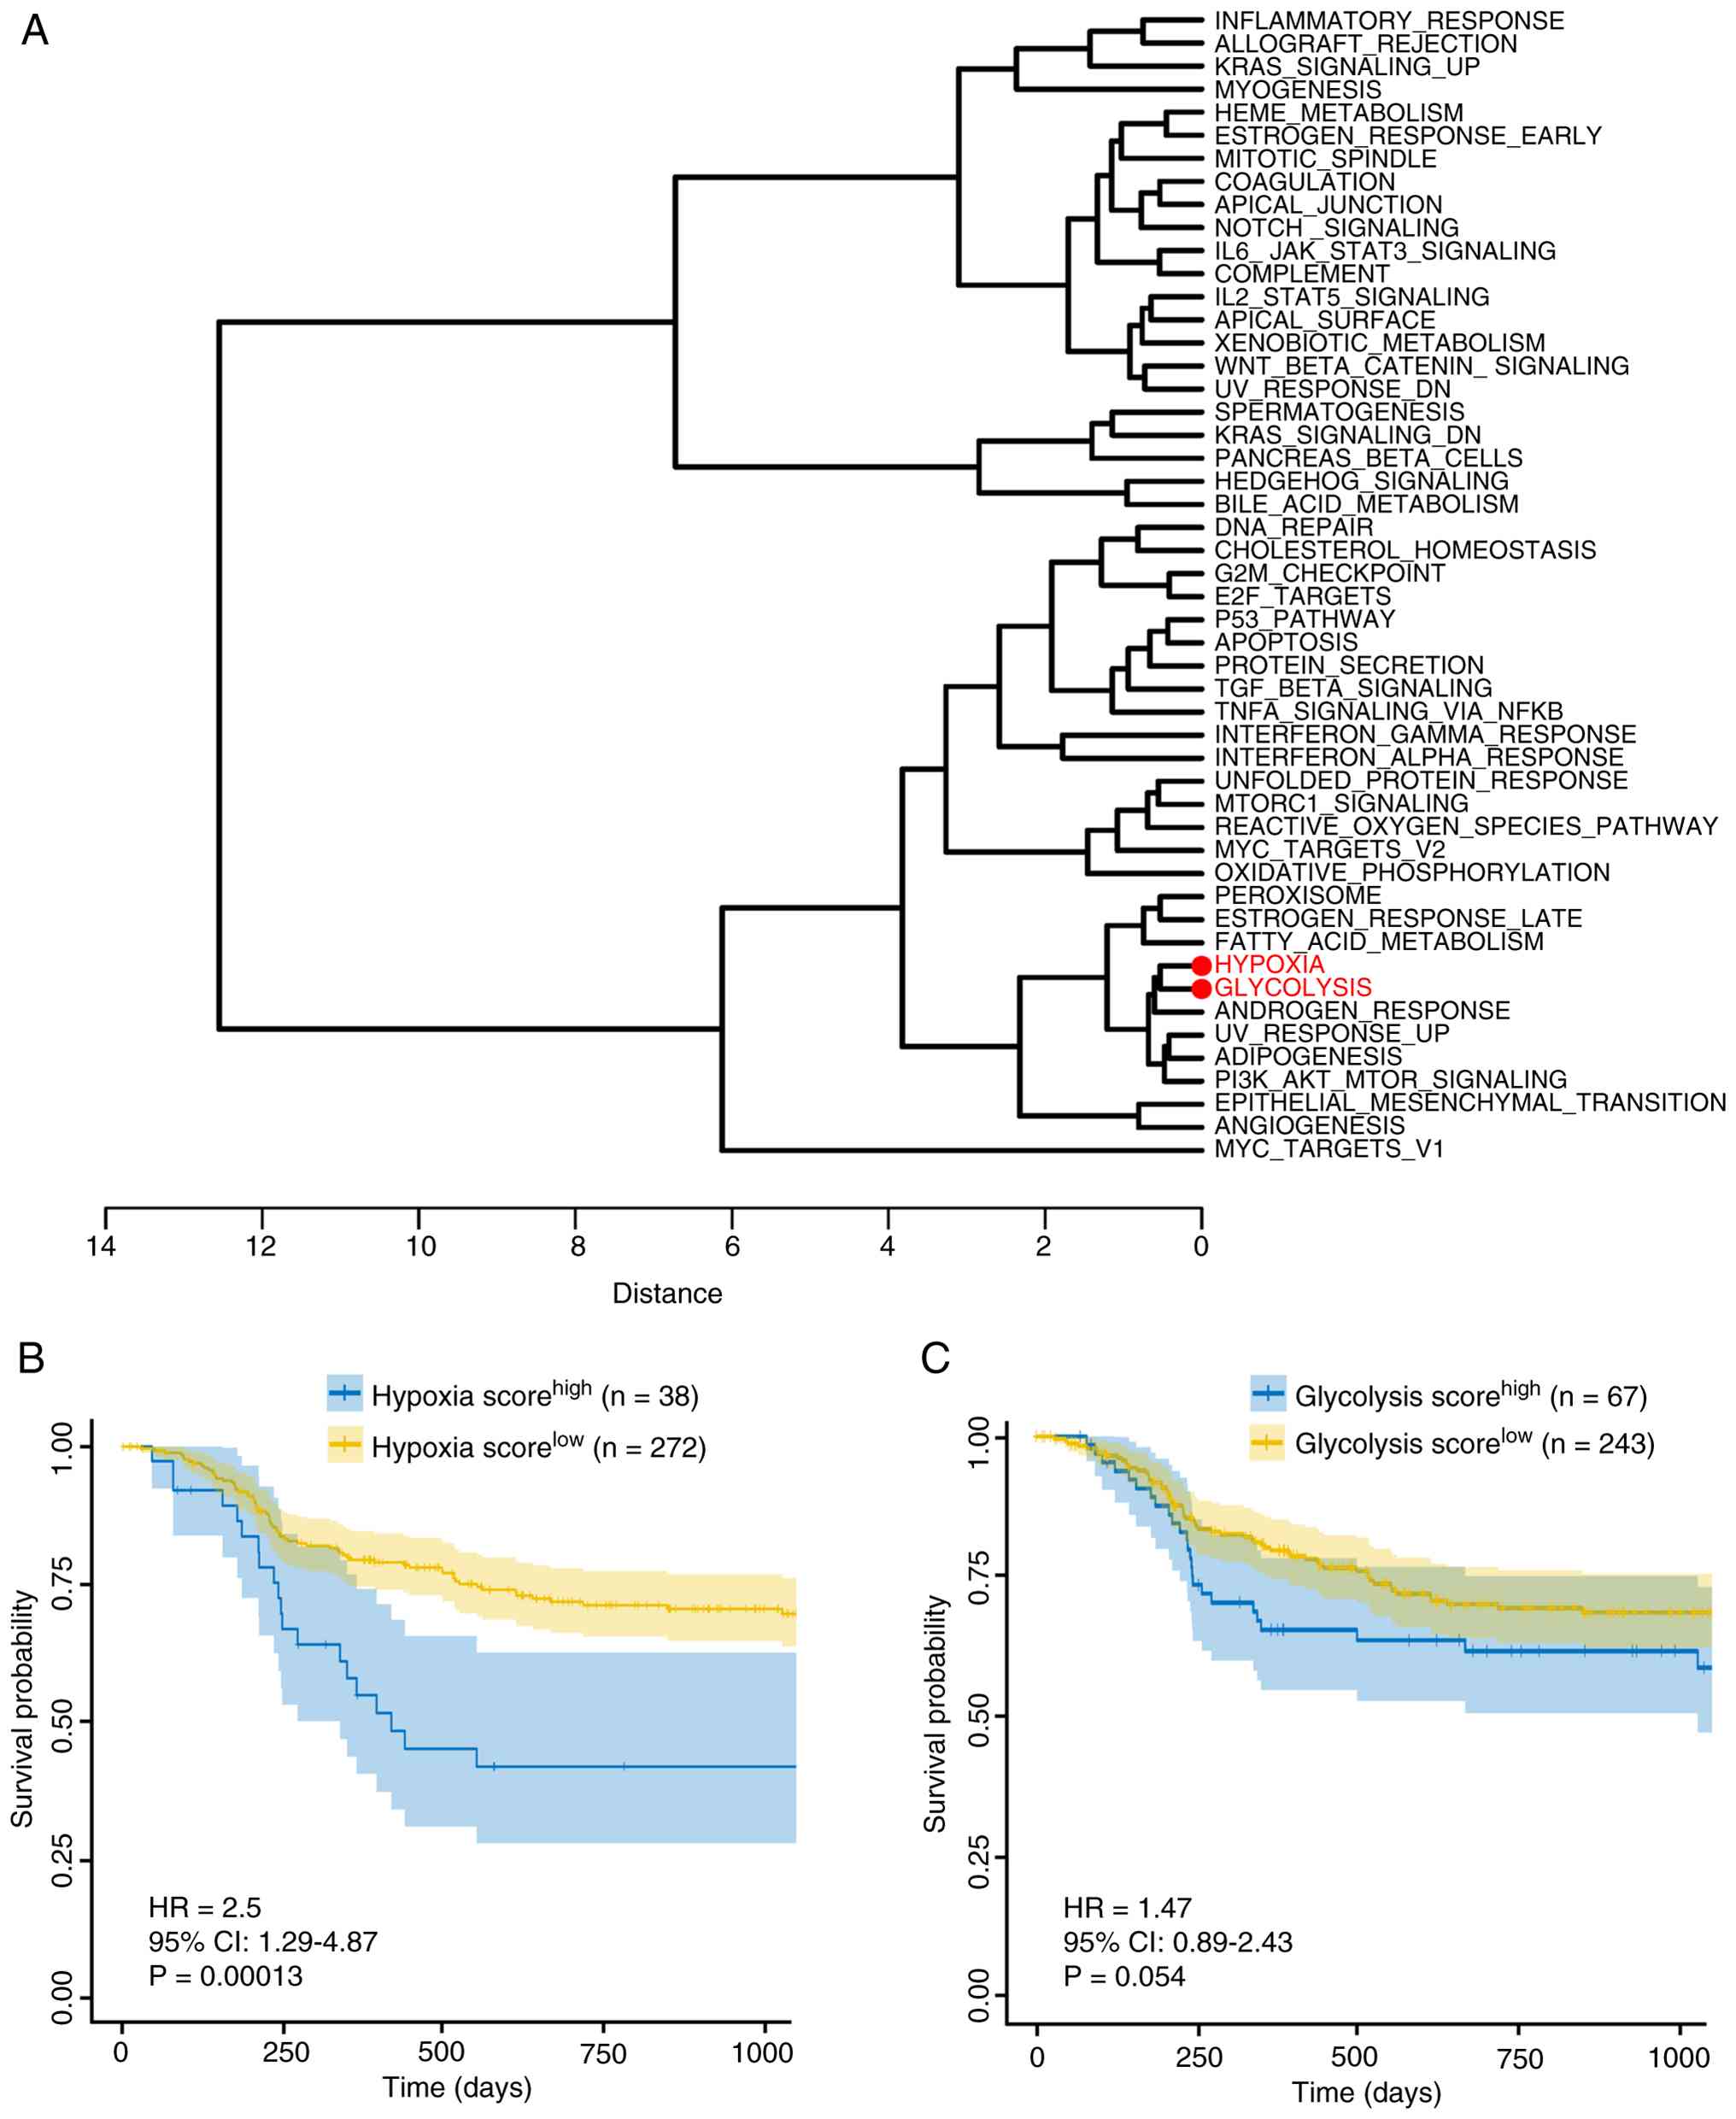
To delineate the relationships among cancer-related
hallmarks, a hierarchical clustering dendrogram of 50
cancer-related hallmark gene sets was generated based on the ssGSEA
score matrix. The ‘hypoxia’ and ‘glycolysis’ hallmark gene sets
clustered closely in the dendrogram while maintaining greater
distance from other hallmark gene sets such as ‘fatty acid
metabolism’, ‘oxidative phosphorylation’ and ‘bile acid metabolism’
(Fig. 1A). Patients were
stratified into high- and low-score groups based on the optimal
cutoff values derived from hypoxia or glycolysis scores.
Kaplan-Meier analysis revealed that patients with higher hypoxia
scores had significantly worse RFS (Fig. 1B). Although glycolysis scores
showed no significant association with RFS in OSCC, a trend toward
worse prognosis was observed in patients with high scores (Fig. 1C). Collectively, these results
indicate that hypoxia is a risk factor for worse RFS in OSCC.
Single-cell transcriptomic analysis
revealed OSCC heterogeneity
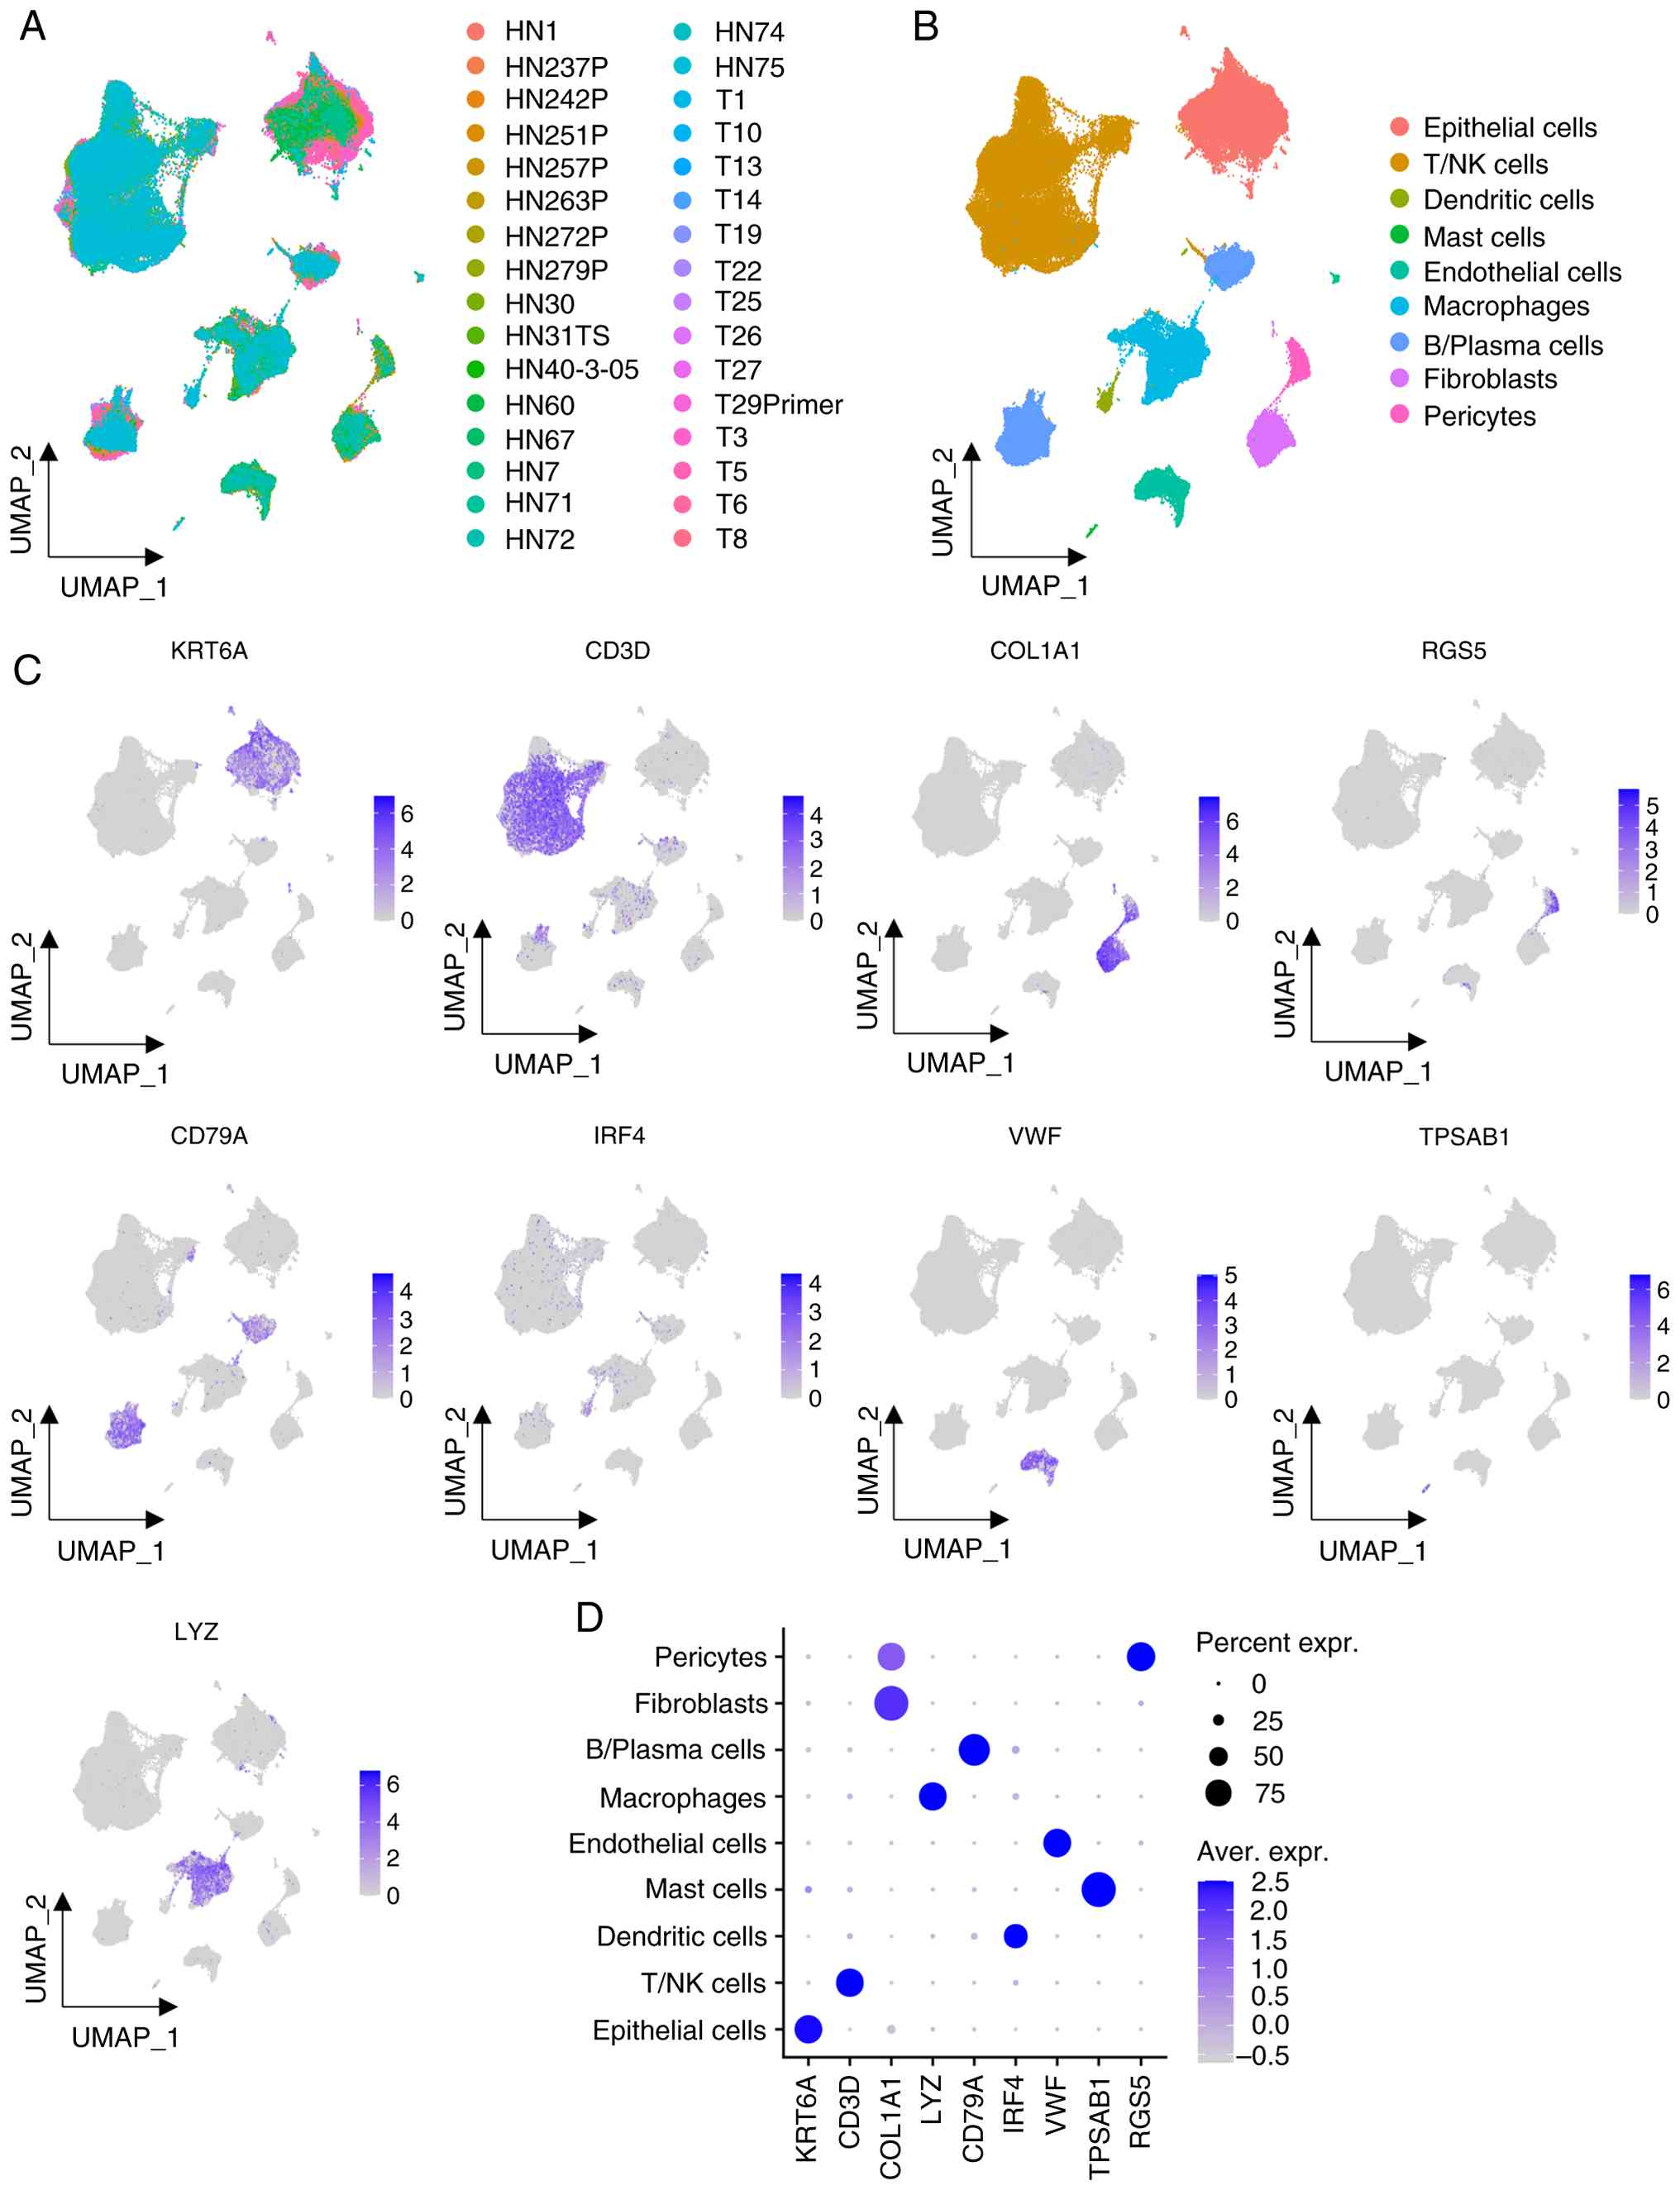
Unsupervised clustering was performed on single-cell
transcriptomic data from 32 OSCC tissues by integrating the
GSE173468, GSE188737 and GSE234933 datasets (Fig. 2A). A total of nine distinct cell
clusters were identified based on the expression of canonical cell
type markers (Fig. 2B). Cell
clusters were identified using the following marker genes:
KRT6A+ for epithelial cells, CD3D+ for
T/natural killer cells, COL1A1+RGS5− for
fibroblasts, RGS5+ for pericytes, LYZ+ for
macrophages, CD79A+ for B/plasma cells, IRF4+
for dendritic cells, VWF+ for endothelial cells, and
TPSAB1+ for mast cells (Fig. 2C and D). Given that OSCC originates
from the oral epithelium (32),
subsequent analyses on epithelial cells were focused on.
Heparan sulfate proteoglycan 2
(HSPG2), immunoglobulin superfamily member 3 (IGSF3),
dihydrouridine synthase 1 like (DUS1L) and DYNC1H1 emerge as the
critical hypoxia- and glycolysis-associated genes
To identify the genes associated with hypoxia and
glycolysis, hdWGCNA was performed on single-cell transcriptomic
data from epithelial cells. A co-expression network was constructed
using a soft threshold power of 12 (Fig. S1). A total of 18 non-gray modules
were identified (Fig. 3A).
Subsequently, the correlation between module eigengenes and hypoxia
and glycolysis scores was assessed. Modules M11 and M13 exhibited
significant associations with both the hypoxia and glycolysis
scores, with correlation coefficients higher than those of other
modules (Fig. 3B). Consequently,
M11 and M13 modules were selected as the hypoxia- and
glycolysis-associated modules. The 104 genes comprising these two
modules were defined as the hypoxia- and glycolysis-associated
genes (Table SI).
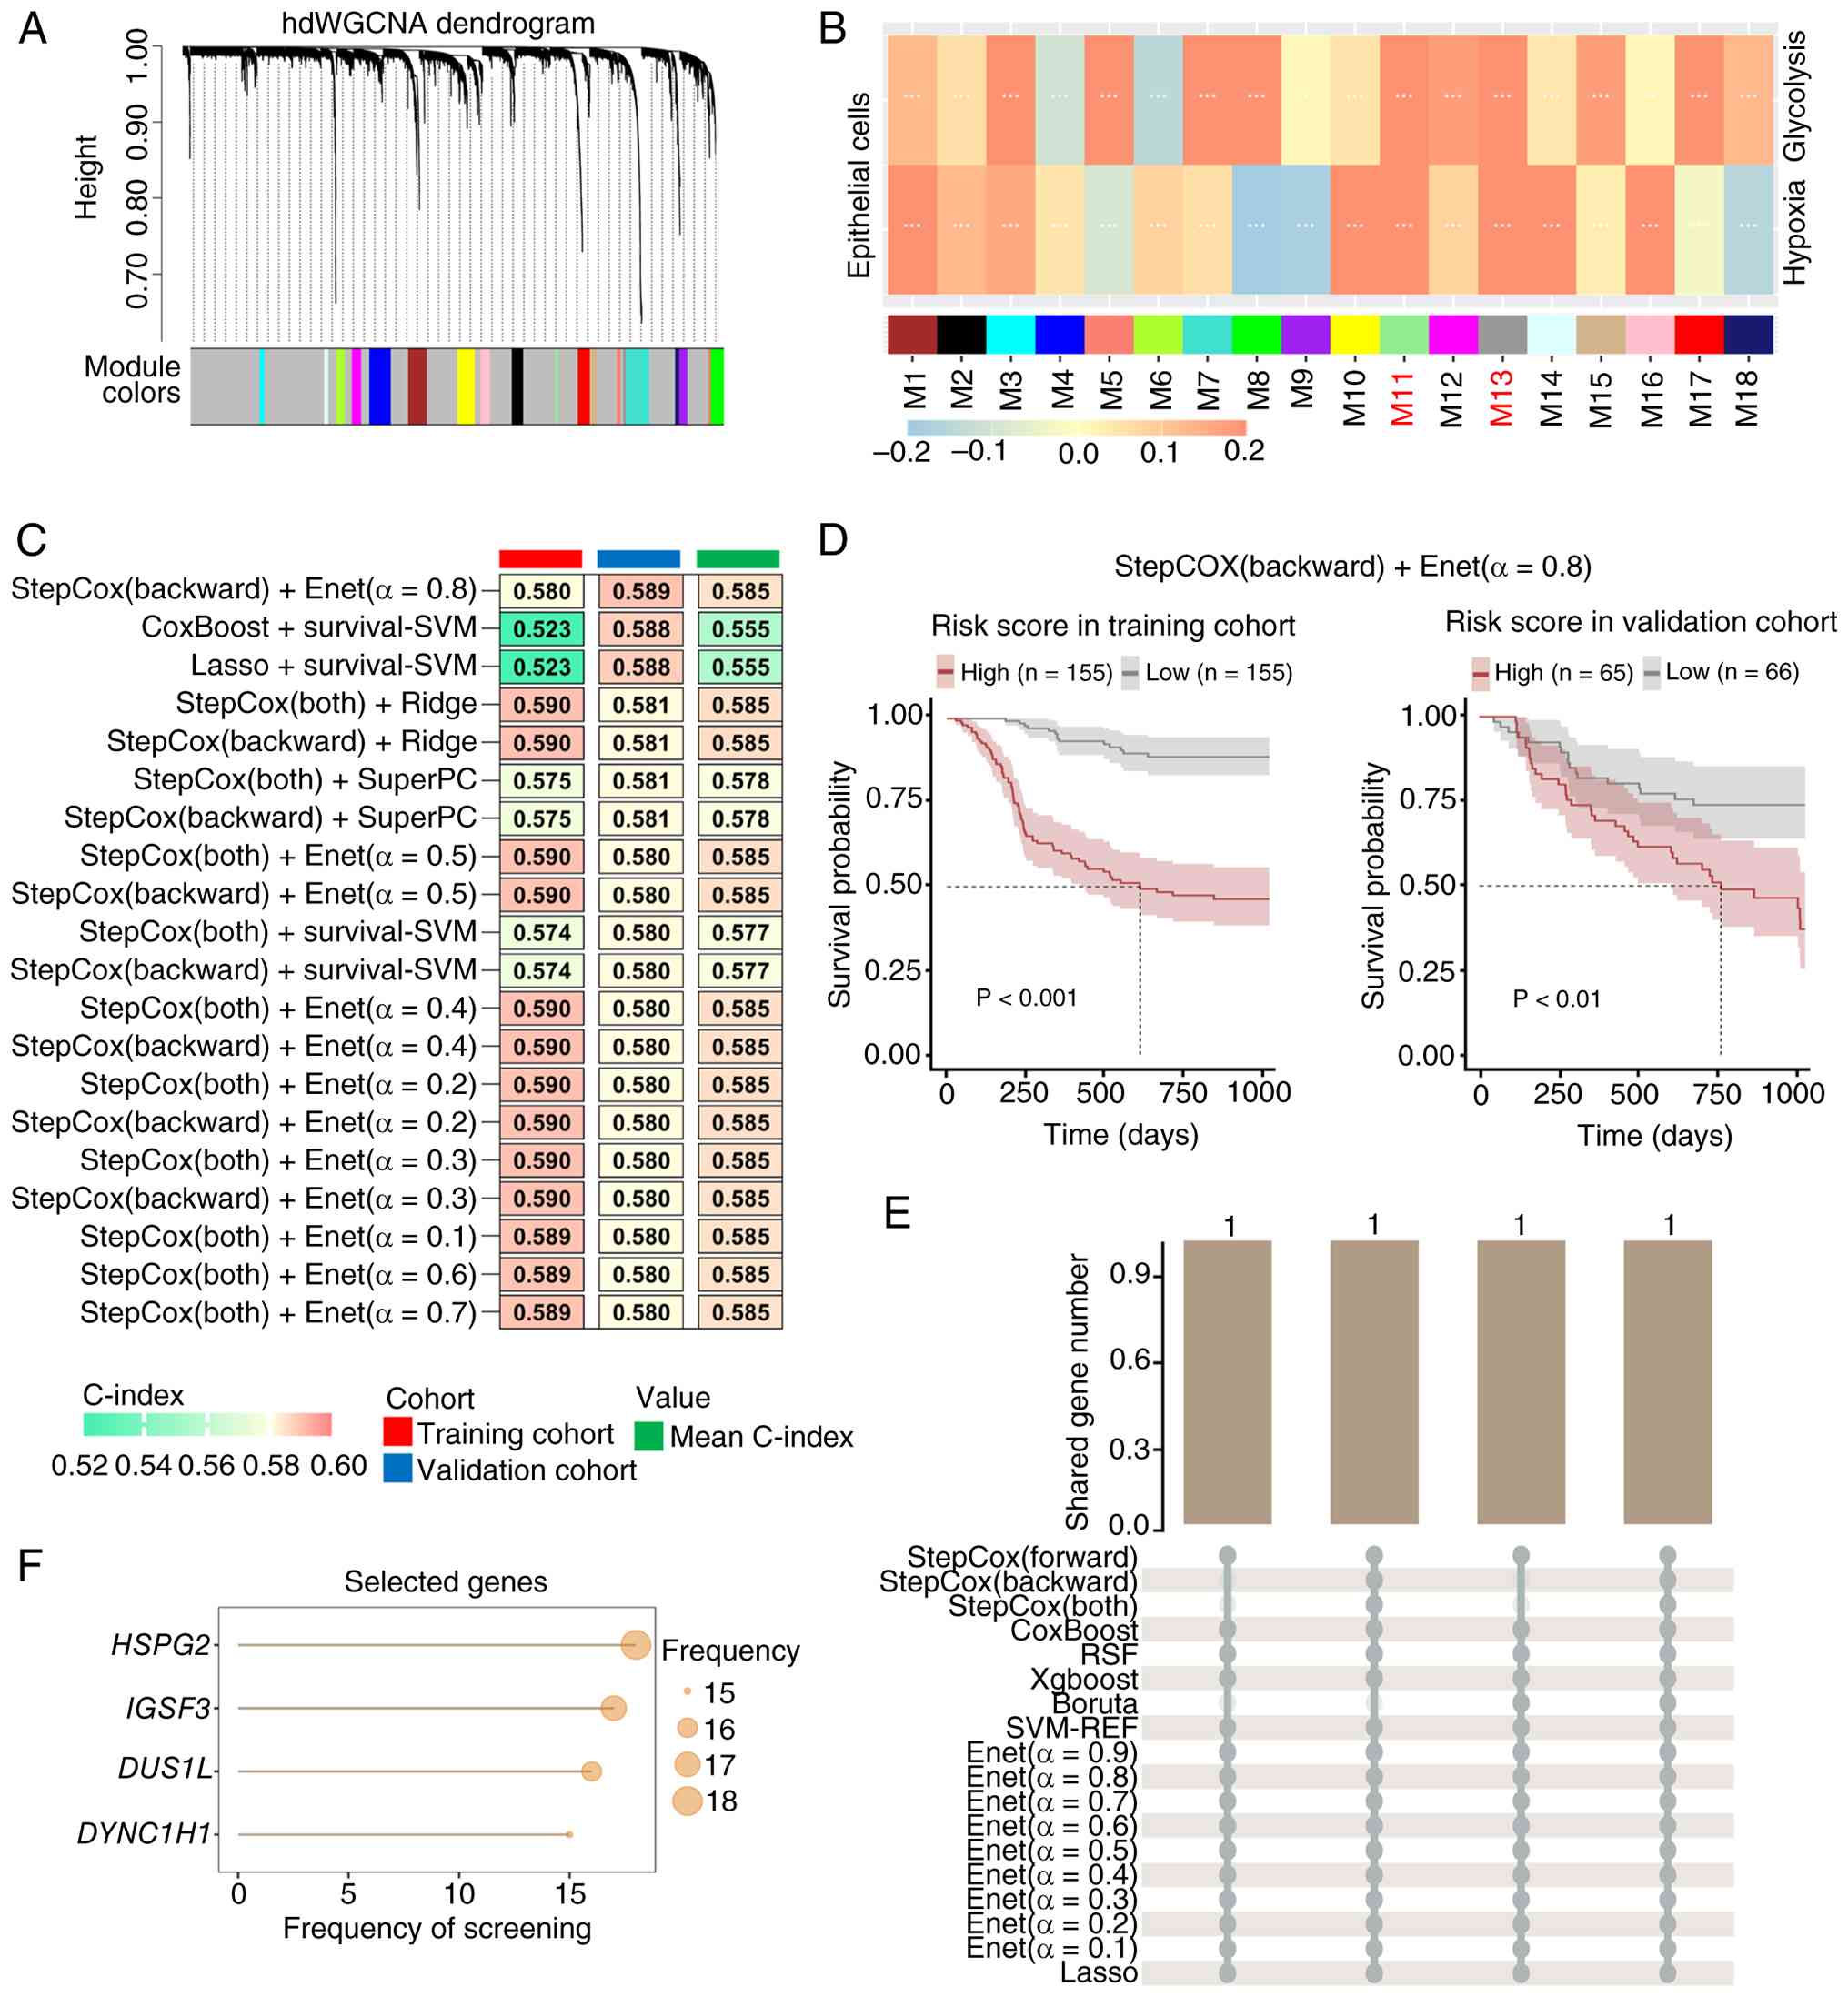 | Figure 3.HSPG2, IGSF3, DUS1L and
DYNC1H1 are identified as critical hypoxia- and
glycolysis-associated genes. (A) hdWGCNA for co-expression network
construction, with the soft threshold power set at 12. scRNA-seq
data from OSCC samples were integrated using publicly available GEO
datasets (GSE173468, GSE188737 and GSE234933). (B) Spearman's
correlation analysis between module eigengenes and
hypoxia/glycolysis scores, where ***P<0.001. scRNA-seq data from
OSCC samples were integrated using publicly available GEO datasets
(GSE173468, GSE188737 and GSE234933). (C) Heatmap displaying the
top 20 machine learning combined models ranked by descending
concordance index in the validation cohort. Training cohort:
TCGA-OSCC cohort (n=310); validation cohort: The GSE65858 dataset
(n=131). (D) Association between risk scores and recurrence-free
survival in patients with OSCC. Risk scores were calculated using
the ‘StepCox (backward) + Enet (α=0.8)’ combined model. Patients
were stratified into high- and low-risk groups according to the
median risk score. Training cohort: TCGA-OSCC cohort (n=310);
validation cohort: The GSE65858 dataset (n=131). (E) Number of
genes in the intersection of core genes screened by different
machine learning algorithms. (F) Selection frequency of core genes
across different machine learning algorithms. OSCC, oral squamous
cell carcinoma; hdWGCNA, high-dimensional weighted gene
co-expression network analysis; TCGA, The Cancer Genome Atlas;
StepCox, stepwise Cox; Enet, elastic network; RSF, random survival
forests; XgBoost, extreme gradient boosting; SVM-REF, support
vector machine recursive feature elimination; Lasso, least absolute
shrinkage and selection operator; scRNA-seq, single cell
RNA-sequencing; GEO, Gene Expression Omnibus; HSPG2, heparan
sulfate proteoglycan 2; IGSF3, immunoglobulin superfamily member 3;
DUS1L, dihydrouridine synthase 1 like; DYNC1H1, dynein cytoplasmic
1 heavy chain 1. |
To identify the critical hypoxia- and
glycolysis-associated genes, the Mime framework was employed to
construct prognostic models based on the 104 genes. The TCGA-OSCC
cohort served as the training cohort, and the GSE65858 dataset was
used as the validation cohort. A total of 117 combined models were
evaluated (Fig. S2). These
combined models were ranked according to the C-index in the
validation cohort, and the top 20 models are shown in Fig. 3C. The ‘StepCox(backward) + Enet
(α=0.8)’ combined model demonstrated superior performance,
achieving the highest C-index in the validation cohort (Fig. 3C). Risk scores were then calculated
based on this optimal combined model. In both the training and
validation cohorts, patients in the high-risk group exhibited
significantly worse RFS (Fig. 3D).
Subsequently, core signatures were selected using multiple
algorithms to identify four core genes: HSPG2, IGSF3, DUS1L
and DYNC1H1 (Fig. 3E and
F). To clarify their individual prognostic roles, a Cox
regression analysis was performed. The results indicated that HSPG2
and DYNC1H1 were risk factors, whereas IGSF3 and DUS1L were
associated with favorable outcomes (Table SII).
Collectively, HSPG2, IGSF3, DUS1L and
DYNC1H1 were identified as the critical hypoxia- and
glycolysis-associated genes.
DYNC1H1 is identified as a
hypoxia-responsive SE-regulated gene and its KD attenuates
hypoxia-induced oncogenic phenotypes in OSCC
To further elucidate the mechanisms regulating the
expression of critical hypoxia- and glycolysis-associated genes,
the H3K27ac signals at the HSPG2, IGSF3, DUS1L and
DYNC1H1 loci in HSC3 and SAS cells were analyzed using the
GSE205455 dataset. TEs were identified at the HSPG2, IGSF3
and DUS1L loci in both HSC3 and SAS cells (Fig. 4A). The DYNC1H1 locus
contained a TE and an SE in both cell lines (Fig. 4A). Thus, DYNC1H1 was
identified as a putative SE-regulated gene, based on the presence
of a broad H3K27ac domain.
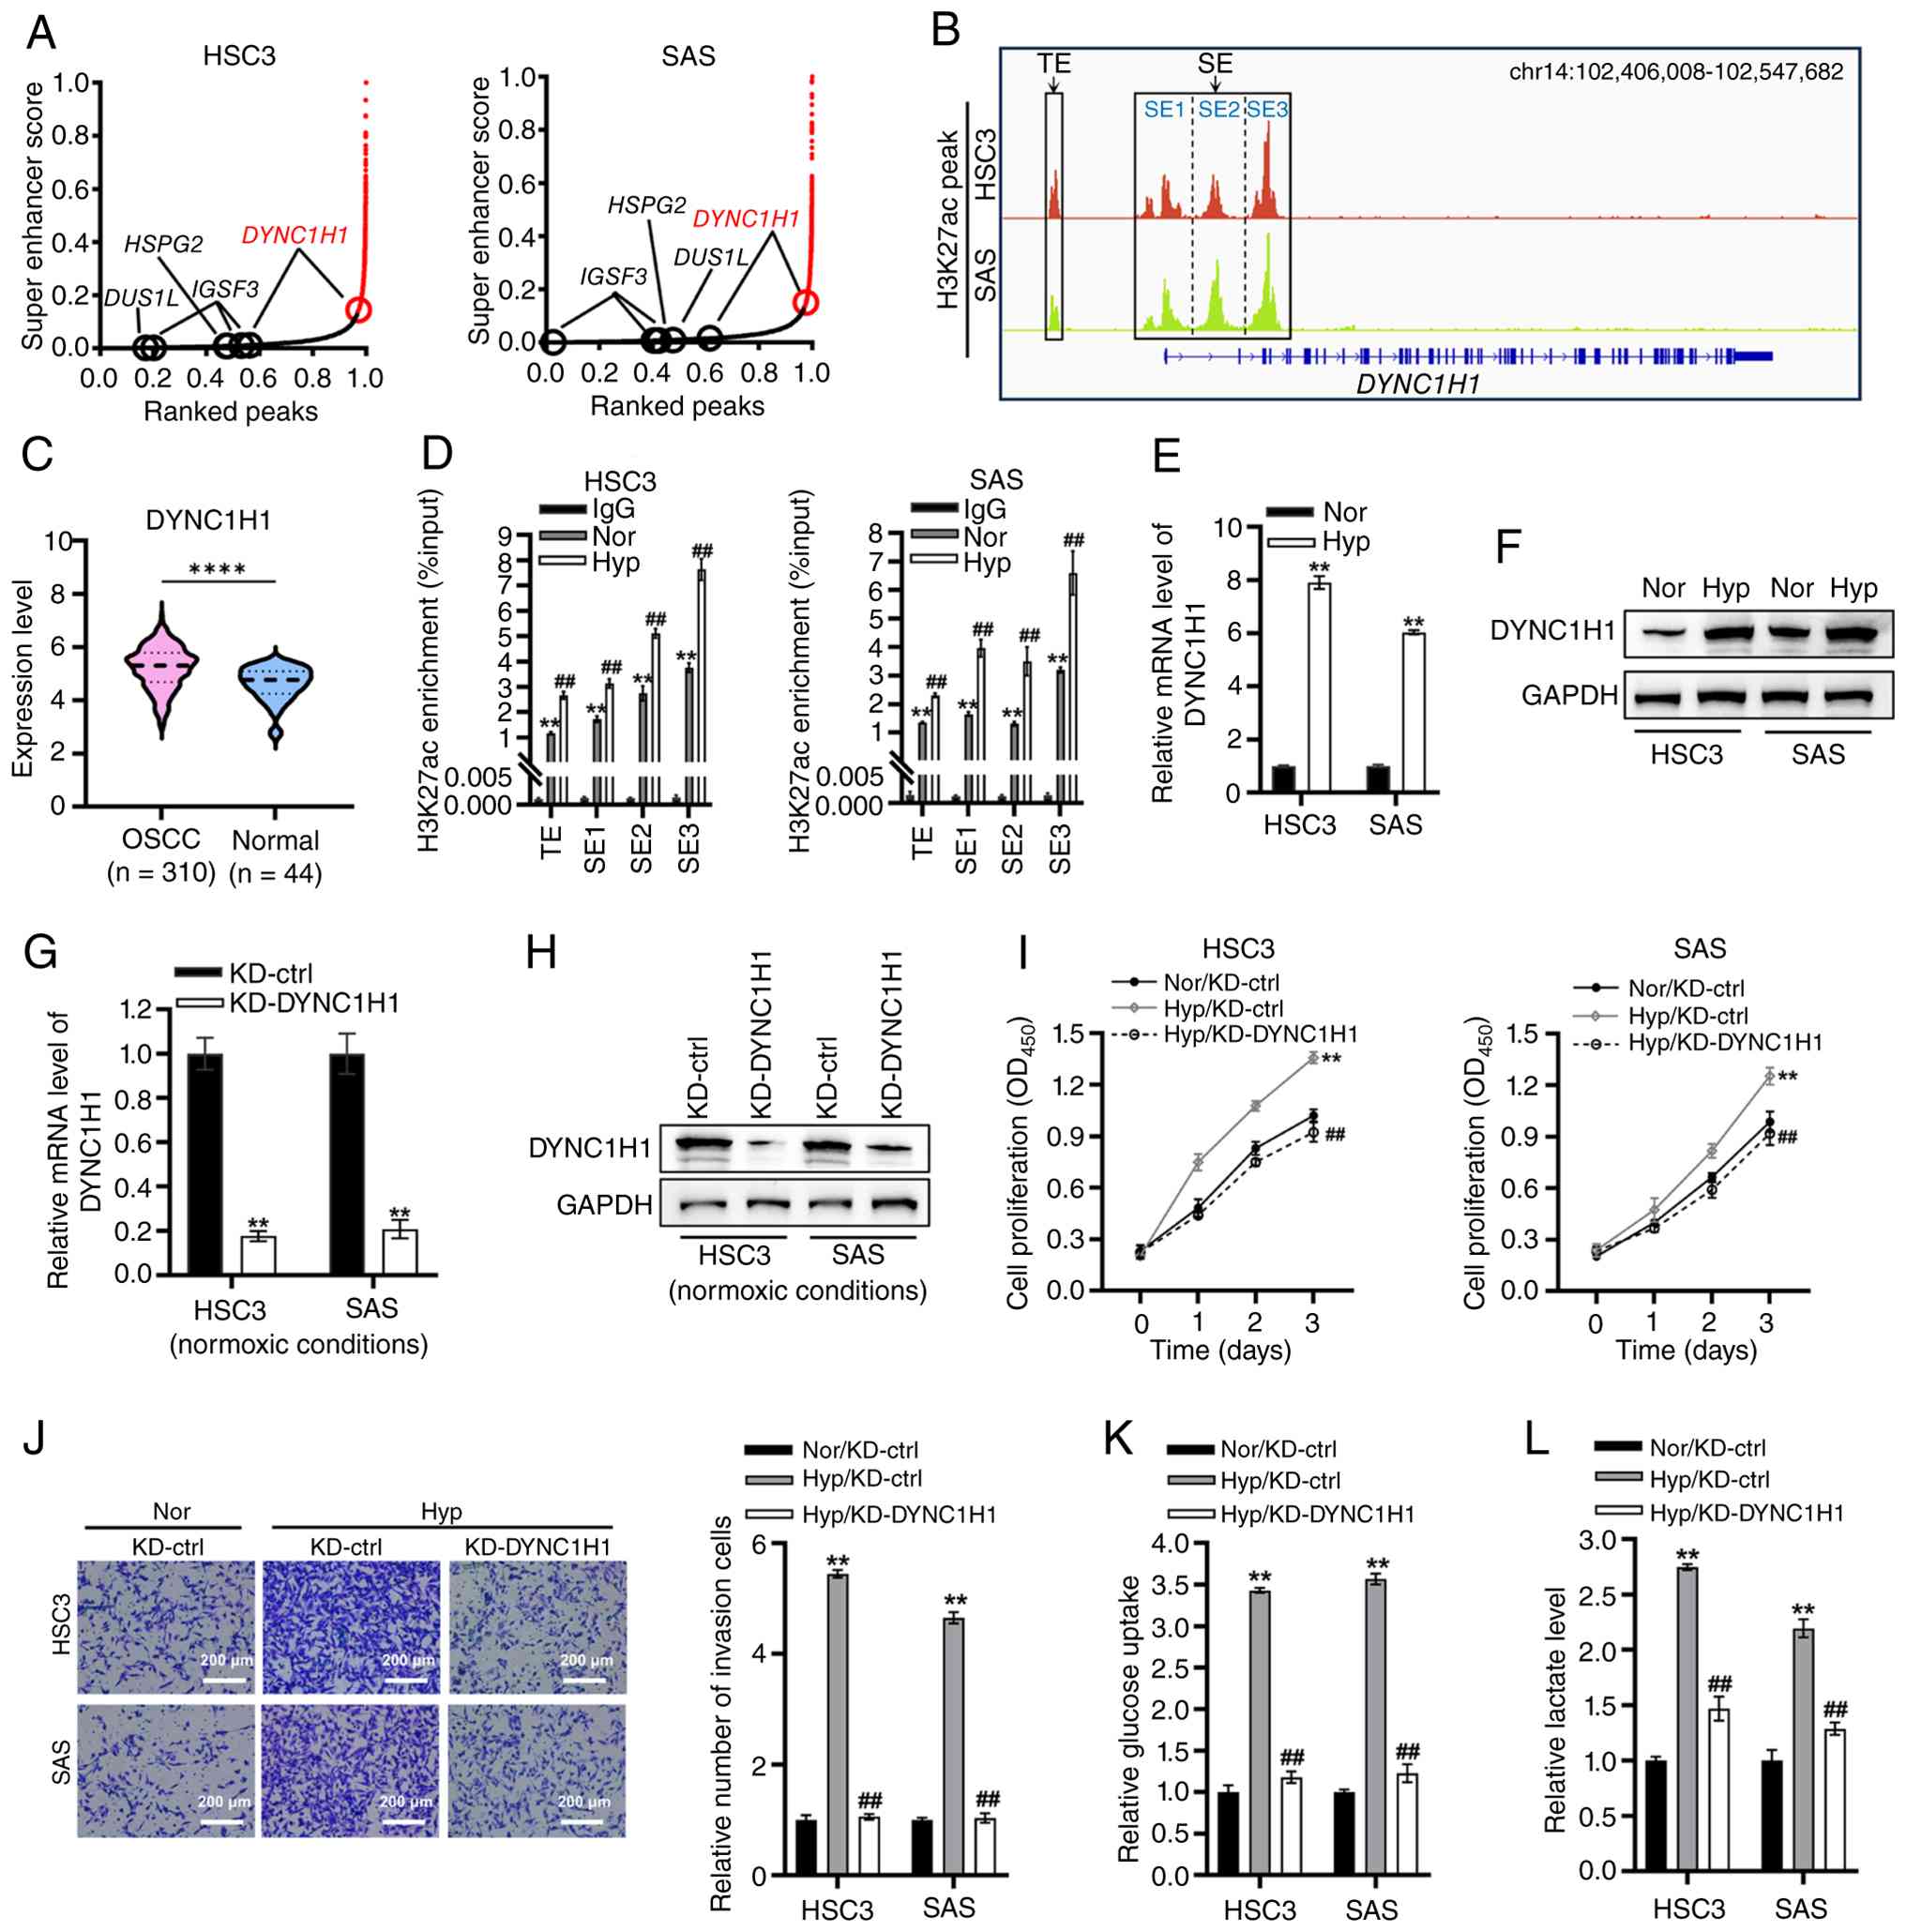 | Figure 4.DYNC1H1 is identified as a
hypoxia-responsive SE-regulated gene and its KD is attenuated in
hypoxia-induced oncogenic phenotypes in OSCC. (A) SE scores were
calculated based on H3K27ac ChIP-sequencing data for HSC3 and SAS
cells. Data were derived from the GSE205455 dataset. Points with
curve slopes >1 (red) represent SE; points with slopes ≥1
(black) represent TE. (B) Visualization of H3K27ac peaks at the
DYNC1H1 locus in HSC3 and SAS cells. Data were derived from
the GSE205455 dataset. (C) Differential expression analysis of
DYNC1H1 in OSCC tissues (n=310) vs. normal control tissues (n=44).
Data were downloaded from The Cancer Genome Atlas-OSCC cohort.
****P<0.0001. (D) H3K27ac enrichment at the TE and SE regions of
DYNC1H1 was quantified using ChIP-qPCR. **P<0.01 vs. IgG
and ##P<0.01 vs. Nor. (E) mRNA and (F) protein levels
of DYNC1H1 in HSC3 and SAS cells were measured using RT-qPCR and
western blot analysis, respectively. **P<0.01 vs. Nor. DYNC1H1
KD efficiency was assessed using (G) RT-qPCR and (H) western blot
analysis. **P<0.01 vs. KD-ctrl. (I) CCK-8 assay was conducted to
assess the proliferation of HSC3 and SAS cells. **P<0.01 vs.
Nor/KD-ctrl and ##P<0.01 vs. Hyp/KD-ctrl. (J)
Transwell assays were performed to assess the invasion of HSC3 and
SAS cells. Scale bar, 200 µm. **P<0.01 vs. Nor/KD-ctrl and
##P<0.01 vs. Hyp/KD-ctrl. Quantification of (K)
glucose uptake and (L) lactate production in HSC3 and SAS cells.
**P<0.01 vs. Nor/KD-ctrl and ##P<0.01 vs.
Hyp/KD-ctrl. DYNC1H1, dynein cytoplasmic 1 heavy chain 1; TE,
typical enhancer; SE, super-enhancer; OSCC, oral squamous cell
carcinoma; ChIP, chromatin immunoprecipitation; qPCR, quantitative
PCR; CCK-8, Cell Counting Kit-8; chr, chromosome; H3K27ac,
histone-3 lysine-27 acetylation; Nor, normoxic conditions; Hyp,
hypoxic conditions; KD, knockdown; KD-ctrl, knockdown control. |
Subsequently, the H3K27ac peaks were profiled
flanking the DYNC1H1 locus in HSC3 and SAS cells using the
GSE205455 dataset to annotate the TE and SE regions (Fig. 4B). DYNC1H1 expression was
significantly elevated in OSCC tissues compared with that in normal
controls (Fig. 4C). To further
demonstrate that DYNC1H1 is an SE-regulated gene responsive
to hypoxia, H3K27ac enrichment in the TE and SE regions of
DYNC1H1 in OSCC cells under normoxic and hypoxic conditions
was measured. Under normoxic conditions, significant H3K27ac
enrichment was observed in the TE and SE regions (SE1-3; Fig. 4D). Compared with normoxia, hypoxia
significantly increased H3K27ac enrichment in these enhancer
regions (Fig. 4D). Furthermore,
hypoxia upregulated DYNC1H1 mRNA and protein levels in HSC3 and SAS
cells compared with hypoxic cells (Fig. 4E and F).
To assess the functional role of DYNC1H1 in the
hypoxic response of OSCC cells, DYNC1H1 was knocked down in HSC3
and SAS cells (Fig. 4G and H;
Fig. S3A and B). CCK-8 assays
revealed that hypoxia significantly promoted the proliferation of
HSC3 and SAS cells, whereas this effect was counteracted by DYNC1H1
KD, with reversal rates of 129% in HSC3 cells and 125% in SAS cells
(Fig. 4I). Transwell assays
revealed that hypoxia markedly enhanced the invasive capacity of
OSCC cells (Fig. 4J). By contrast,
hypoxia failed to promote cell invasion upon DYNC1H1 KD (Fig. 4J). The rescue rate of DYNC1H1 KD in
hypoxia-induced invasion was 99% in both HSC3 and SAS cells
(Fig. 4J).
Glycolysis is a critical metabolic pathway in tumor
cells under hypoxia, characterized by increased glucose uptake and
lactate production (10,13). In the present study, glucose uptake
and lactate generation under normoxic and hypoxic conditions was
measured. Compared with normoxic conditions, hypoxia significantly
increased glucose uptake, an effect that was partially reversed by
DYNC1H1 KD, with reversal rates of 93% in HSC3 cells and 91% in SAS
cells (Fig. 4K). Consistently,
hypoxia significantly upregulated l-lactate production, which was
partially counteracted by DYNC1H1 KD, with reversal efficiencies of
73% in HSC3 cells and 76% in SAS cells (Fig. 4L).
Collectively, DYNC1H1 was identified as a
hypoxia-responsive SE-regulated gene, and its KD attenuated
hypoxia-induced oncogenic phenotypes in OSCC.
FOSL2 is a hypoxia-responsive
transcription factor that activates DYNC1H1 transcription by
binding to TE and SE regions
To identify hypoxia-responsive transcription factors
that potentially regulate DYNC1H1, potential transcription
factors binding to the enhancer regions of DYNC1H1 were
predicted, with the top 20 shown in Fig. 5A. The correlation between these
transcription factors and DYNC1H1 expression using bulk RNA-seq
data from the TCGA-OSCC dataset was then analyzed. Since FAIRE was
not included in the TCGA-OSCC dataset, the remaining 19
transcription factors were analyzed. Among these, 12 transcription
factors (MED1, POLR2A, SMARCC2, FOSL2, POLR2B, XRN2, DCP1A, ASXL1,
RNF2, PPARD, RBPJ and MAX) were significantly positively correlated
with DYNC1H1 expression (Fig. 5B).
Thus, these 12 transcription factors were prioritized for further
validation based on the strength of their correlation with DYNC1H1
expression.
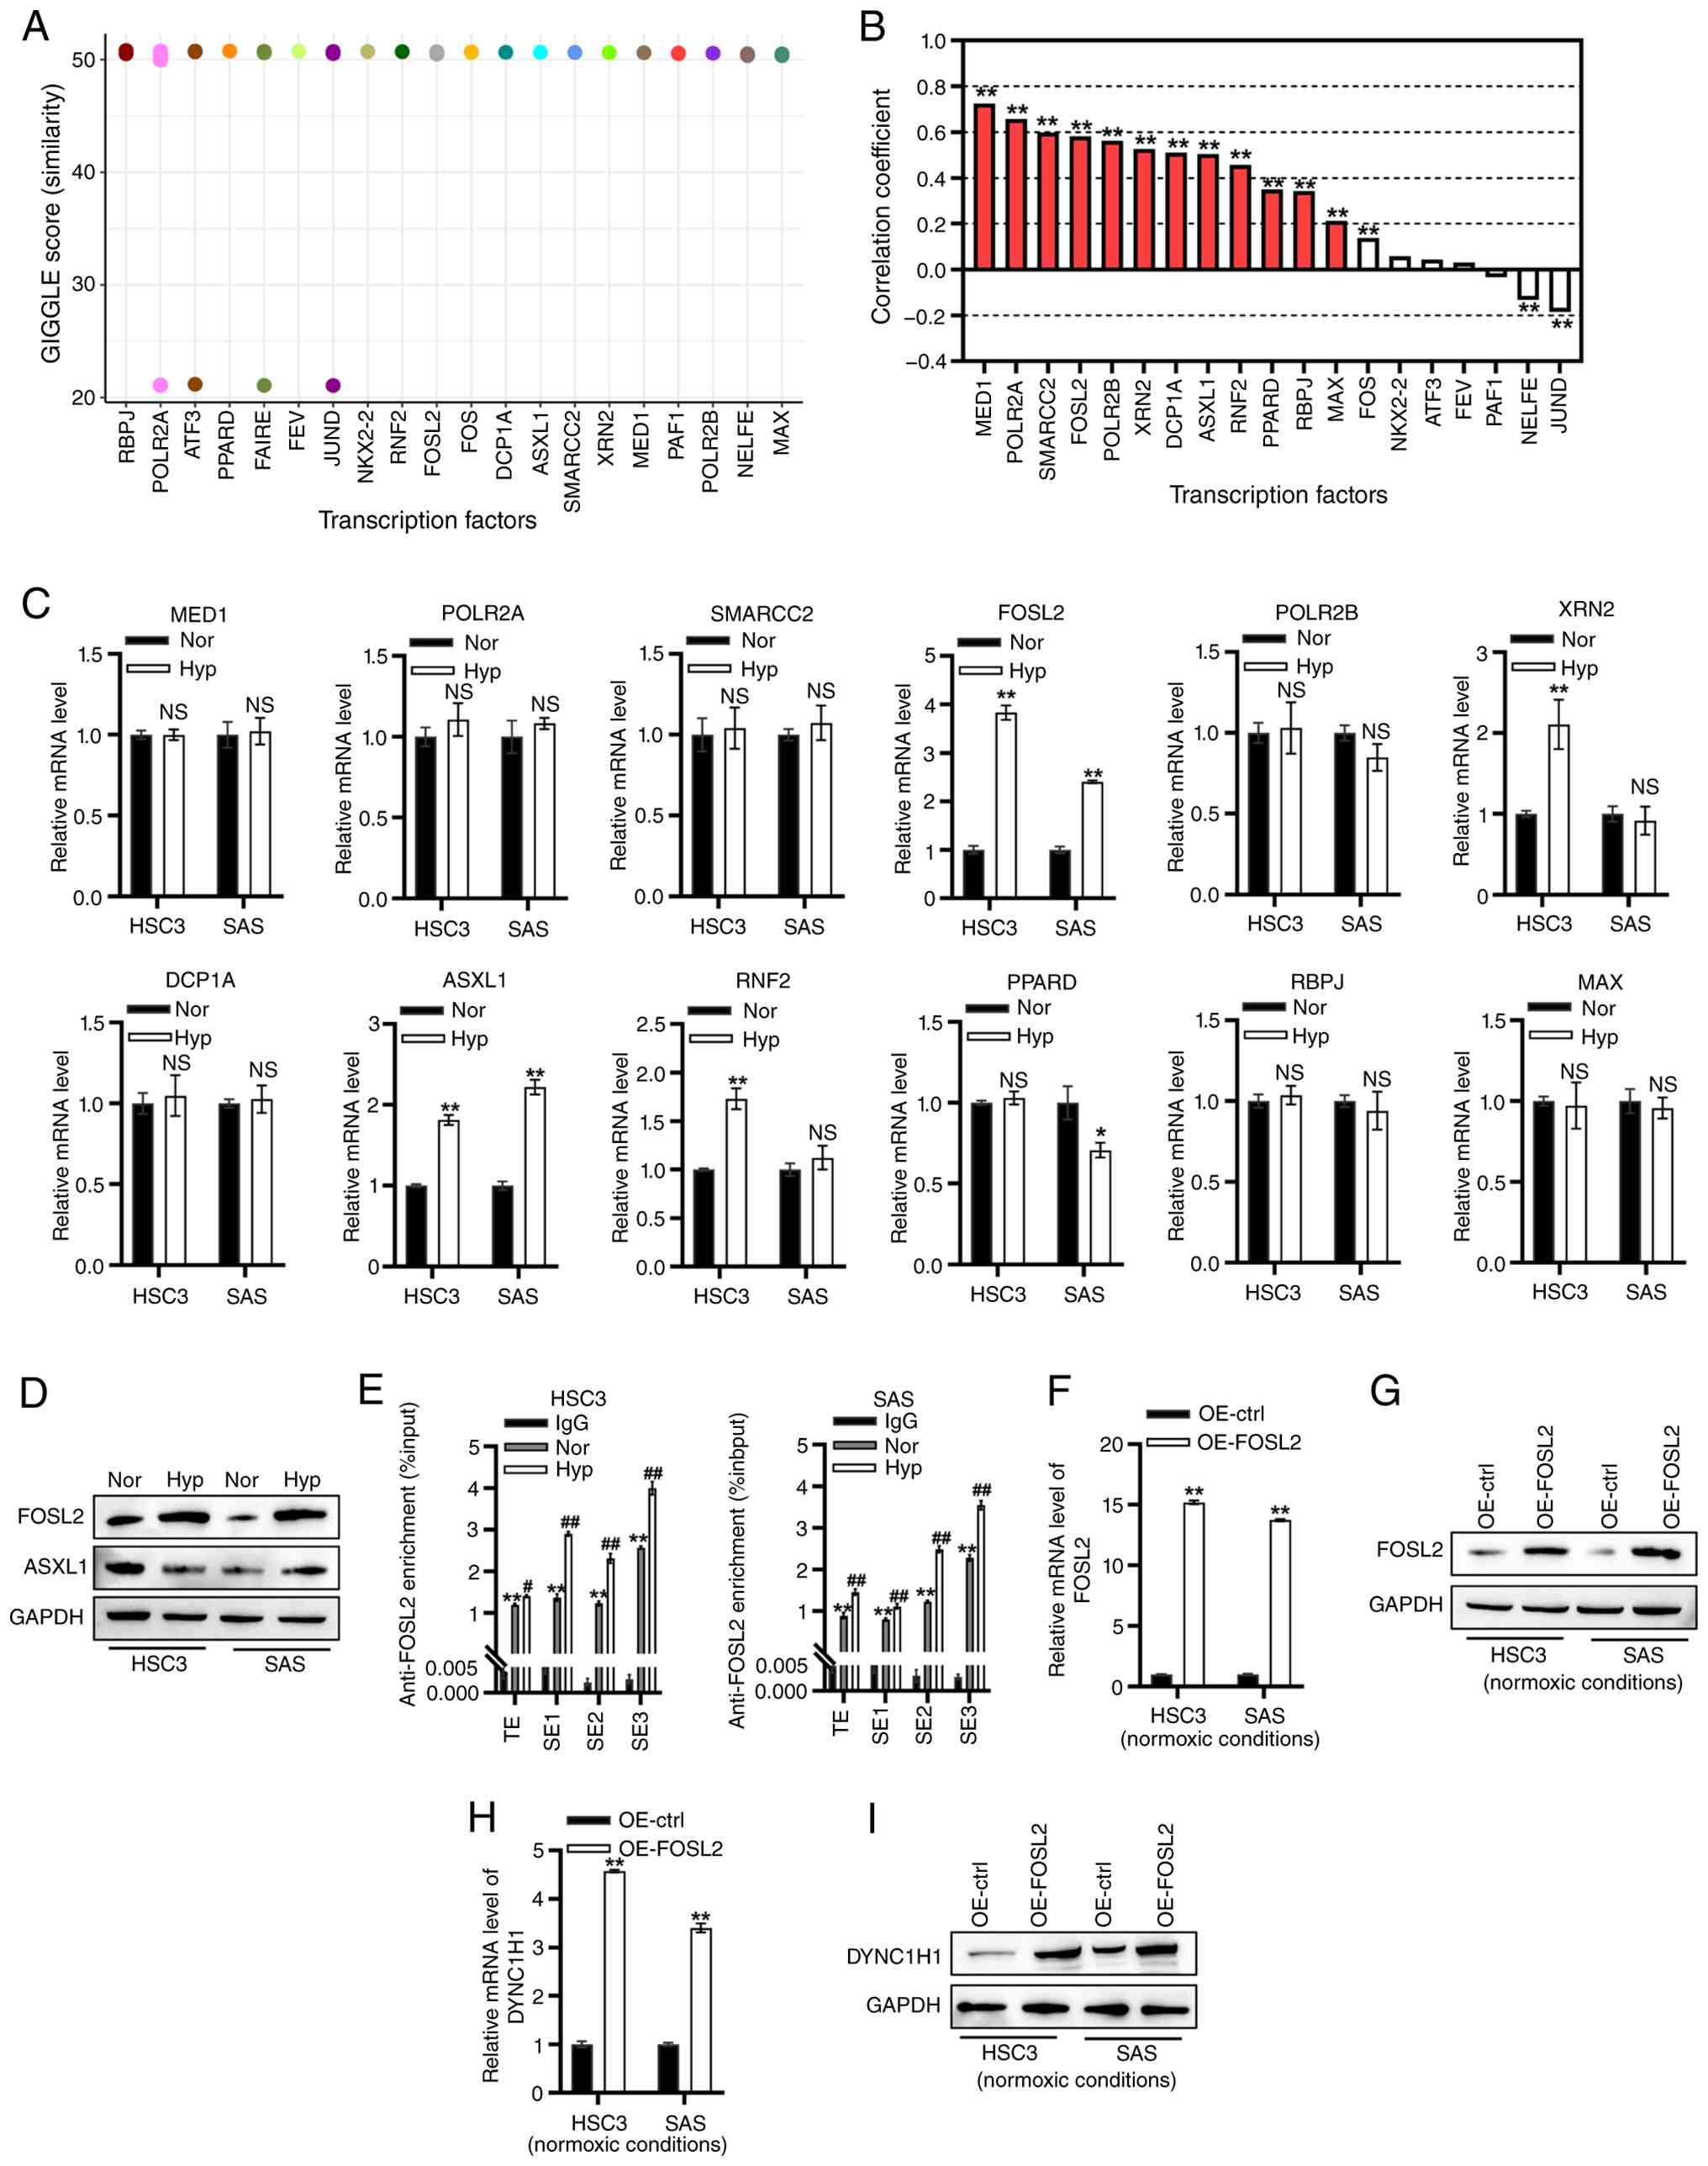 | Figure 5.FOSL2 was characterized as a
hypoxia-responsive transcription factor that activates
DYNC1H1 transcription through binding to TE and SE regions.
(A) Transcription factor prediction for DYNC1H1 using the
Toolkit for Cistrome Data Browser (http://dbtoolkit.cistrome.org). (B) Spearman's
correlation between predicted transcription factors and
DYNC1H1 expression. Data were derived from The Cancer Genome
Atlas-oral squamous cell carcinoma cohort. A significant positive
correlation was defined as a correlation coefficient r>0.2 and
P<0.05. **P<0.01 vs. DYNC1H1 expression. (C) qPCR analysis of
MED1, POLR2A, SMARCC2, FOSL2, POLR2B, XRN2, DCP1A, ASXL1, RNF2,
PPARD, RBPJ and MAX transcription in HSC3 and SAS cells. *P<0.05
and **P<0.01 vs. Nor. (D) Western blot analysis of FOSL2 and
ASXL1 protein levels in HSC3 and SAS cells. (E) Chromatin
Immunoprecipitation-qPCR quantification of anti-FOSL2 enrichment at
DYNC1H1 TE and SE regions in HSC3 and SAS cells. **P<0.01
vs. IgG, ##P<0.01 and #P<0.05 vs. Nor.
(F) FOSL2 OE efficiency was assessed using qPCR. **P<0.01 vs.
OE-ctrl. (G) FOSL2 OE efficiency was assessed using western blot.
(H) Effect of FOSL2 OE on DYNC1H1 mRNA and (I) DYNC1H1 protein
levels in HSC3 and SAS cells under normoxic conditions. **P<0.01
vs. OE-ctrl. DYNC1H1, dynein cytoplasmic 1 heavy chain 1; qPCR,
quantitative PCR; TE, typical enhancer; SE, super-enhancer; OE,
overexpression; Nor, normoxic conditions; Hyp, hypoxic conditions;
ctrl, control; FOSL2, FOS-like 2; NS, non-significant. |
The mRNA levels of 12 transcription factors in HSC3
and SAS cells were assessed under normoxic and hypoxic conditions.
The transcription of MED1, POLR2A, SMARCC2, POLR2B, DCP1A, RBPJ and
MAX remained hypoxia-insensitive in both cell lines (Fig. 5C). XRN2 and RNF2 transcription was
significantly elevated in HSC3 cells under hypoxia but exhibited no
significant changes in SAS cells (Fig.
5C). Hypoxia significantly downregulated PPARD transcription in
SAS cells but not in HSC3 cells (Fig.
5C). Hypoxia significantly upregulated FOSL2 and ASXL1
transcription in both cell lines (Fig.
5C). Furthermore, hypoxia increased the FOSL2 protein level in
both HSC3 and SAS cells (Fig. 5D).
Hypoxia elevated the ASXL1 protein level in SAS cells but
downregulated it in HSC3 cells (Fig.
5D).
To further validate FOSL2-driven transcriptional
activation of DYNC1H1, ChIP-qPCR was performed to assess
FOSL2 occupancy in the TE and SE regions of DYNC1H1 in OSCC
cells under normoxic and hypoxic conditions. Compared with
normoxia, hypoxia significantly increased FOSL2 enrichment in the
TE and SE regions of DYNC1H1 in both HSC3 and SAS cells
(Fig. 5E). Subsequently, FOSL2 was
overexpressed in HSC3 and SAS cells (Fig. 5F and G; Fig. S3G and H). FOSL2 OE upregulated
DYNC1H1 mRNA and protein levels under normoxic conditions (Fig. 5H and I).
Collectively, FOSL2 was characterized as a
hypoxia-responsive transcription factor that activates
DYNC1H1 transcription by binding to its TE and SE
regions.
FOSL2/DYNC1H1 axis drives
hypoxia-induced proliferation, invasion, glucose uptake and lactate
production in OSCC cells
To investigate the functional role of the
FOSL2/DYNC1H1 axis under hypoxic conditions, FOSL2 KD and DYNC1H1
OE in HSC3 and SAS cells was performed (Fig. S3C-F). Furthermore, it was
confirmed that under normoxic conditions, FOSL2 was effectively
downregulated in the FOSL2 KD cells, while DYNC1H1 expression was
upregulated in the DYNC1H1 OE group compared with their respective
controls (Fig. 6A-D). CCK-8 assay
demonstrated that the KD of FOSL2 completely abolished
hypoxia-induced proliferation, with an elimination efficiency of
128% in both cell lines (Fig. 6E).
The anti-proliferative effect of FOSL2 KD was partially rescued by
DYNC1H1 OE under hypoxia, with rescue rates of 75% in HSC3 cells
and 77% in SAS cells (Fig. 6E).
Transwell assays revealed that the KD of FOSL2 completely
suppressed hypoxia-induced invasion in both cell lines, with 100%
inhibition in both cell lines (Fig.
6F). DYNC1H1 OE under hypoxia led to a near-complete rescue of
this inhibitory effect, with rescue rates of 98% in HSC3 cells and
104% in SAS cells (Fig. 6F).
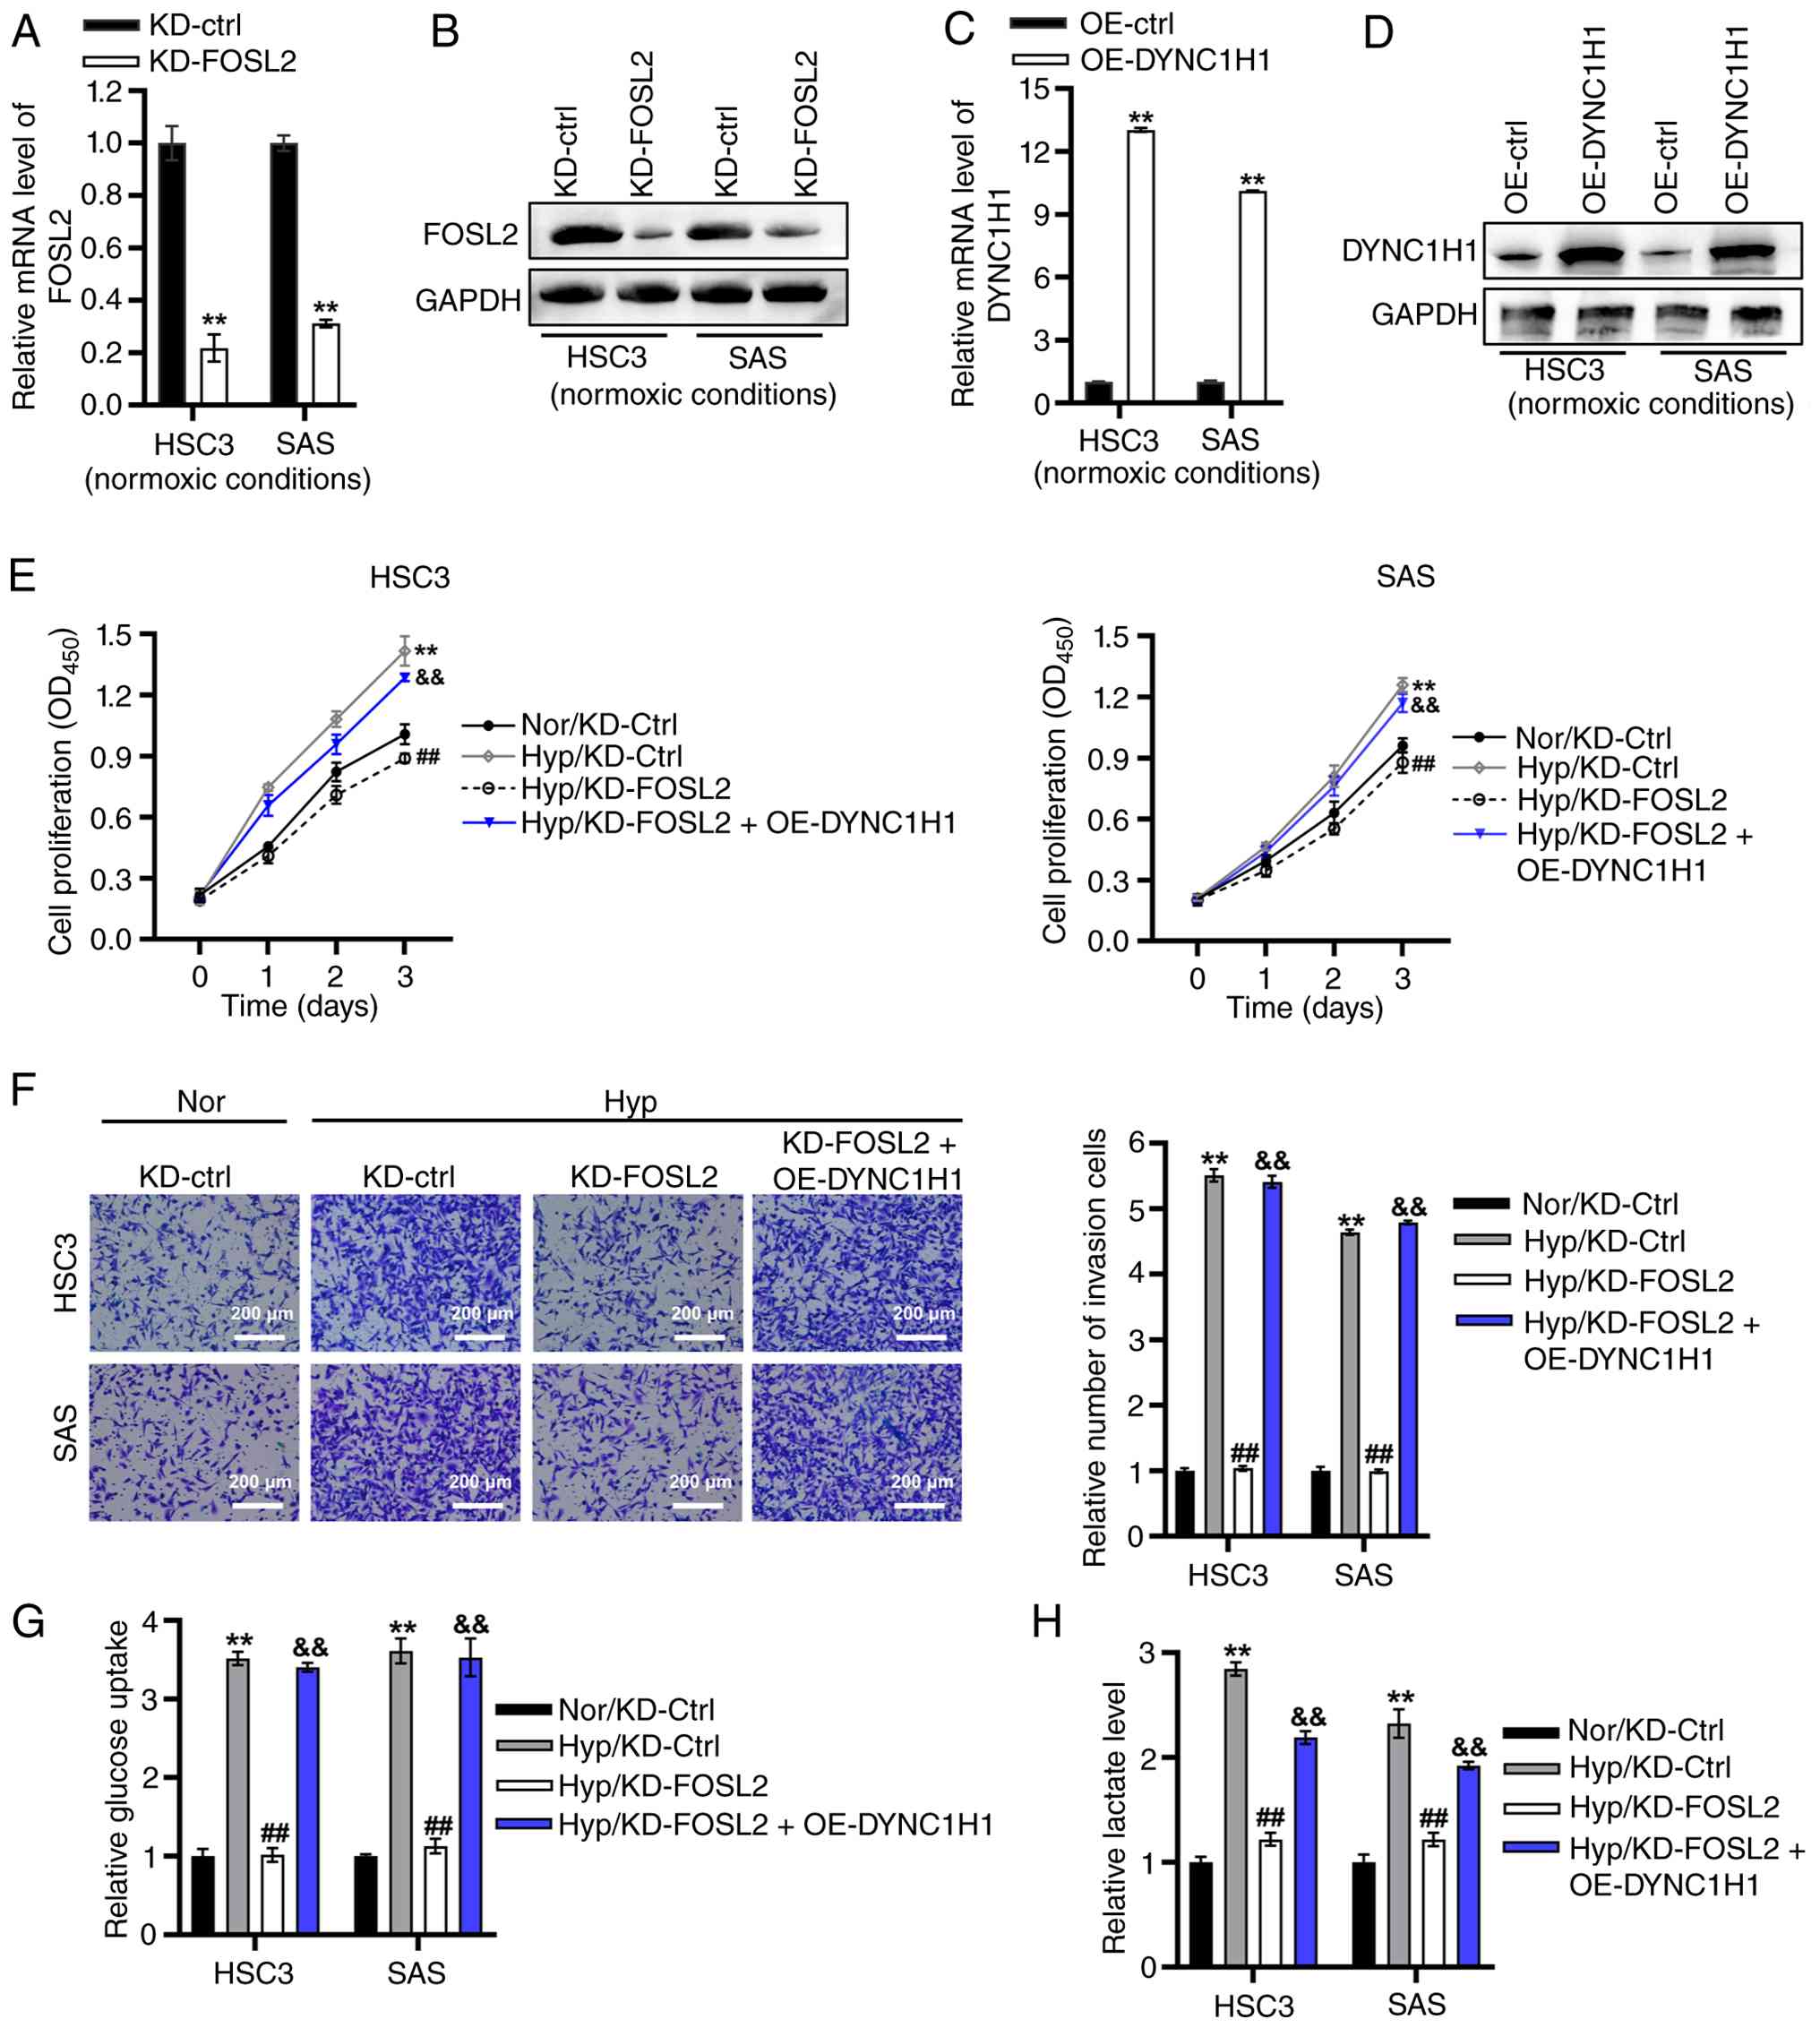 | Figure 6.FOSL2/DYNC1H1 axis drives
hypoxia-induced proliferation, invasion, glucose uptake and lactate
production in oral squamous cell carcinoma cells. FOSL2 KD
efficiency was assessed using (A) qPCR and (B) western blotting.
**P<0.01 vs. KD-ctrl. (C) DYNC1H1 OE efficiency was assessed
using qPCR and (D) western blotting. **P<0.01 vs. OE-ctrl. (E)
Cell proliferation was analyzed using a Cell Counting Kit-8 assay.
**P<0.01 vs. Nor/KD-ctrl, ##P<0.01 vs. Hyp/KD-ctrl
and &&P<0.01 vs. Hyp/KD-FOSL2. (F) Cell
invasion was measured using a Transwell assay. Scale bar, 200 µm.
**P<0.01 vs. Nor/KD-ctrl; ##P<0.01 vs.
Hyp/KD-ctrl; &&P<0.01 vs. Hyp/KD-FOSL2. (G)
Relative glucose uptake and (H) lactate production in HSC3 and SAS
cells. **P<0.01 vs. Nor/KD-ctrl, ##P<0.01 vs.
Hyp/KD-ctrl and &&P<0.01 vs. Hyp/KD-FOSL2.
DYNC1H1, dynein cytoplasmic 1 heavy chain 1; qPCR, quantitative
PCR; OD, optical density; KD, knockdown; OE, overexpression; Nor,
normoxic conditions; Hyp, hypoxic conditions; ctrl, control; FOSL2,
FOS-like 2. |
The glucose uptake and lactate production in HSC3
and SAS cells was further quantified. FOSL2 KD nearly completely
attenuated hypoxia-stimulated glucose uptake, with inhibition rates
of 99% in HSC3 cells and 95% in SAS cells (Fig. 6G). DYNC1H1 OE almost completely
rescued the inhibitory effect of FOSL2 KD on glucose uptake under
hypoxic conditions, with a rescue rate of 96% in both cell lines
(Fig. 6G). Similarly, FOSL2 KD
partially reduced hypoxia-stimulated lactate generation, with
inhibition rates of 88% in HSC3 cells and 84% in SAS cells
(Fig. 6H). Under hypoxic
conditions, the reduction in lactate generation caused by FOSL2 KD
was partially reversed by DYNC1H1 OE, with reversal rates of 60% in
HSC3 cells and 64% in SAS cells (Fig.
6H).
Collectively, these results indicated that the
FOSL2/DYNC1H1 axis drove hypoxia-induced proliferation, invasion,
glucose uptake and lactate production in OSCC cells.
Discussion
The present study revealed that the FOSL2/DYNC1H1
axis critically regulated hypoxic adaptation in OSCC. The
SE-regulated gene DYNC1H1, associated with hypoxia and
glycolysis, was transcriptionally activated by FOSL2, which
promoted the hypoxia-induced malignant phenotypes of OSCC.
Hypoxia is a hallmark feature of solid malignancies
that critically drives tumorigenesis. Heterogeneous intra-tumoral
oxygen distribution and heightened oxygen consumption collectively
establish hypoxic microenvironments (33,34).
Tumor hypoxia has emerged as a pivotal target for novel therapeutic
developments as an independent prognostic factor for various types
of cancer (33,35). The present study established
hypoxia as a potential risk factor for worse prognosis in OSCC.
Beyond driving key malignant phenotypes, including proliferation,
migration and invasion, hypoxia critically reprograms tumor cell
metabolism, notably augmenting glycolytic flux (10,13).
Consistent with this, the present study revealed immediate
adjacency between the ‘hypoxia’ and ‘glycolysis’ hallmarks.
Although elevated glycolysis scores were not significantly
associated with RFS in OSCC, a consistent trend toward a worse
prognosis was observed.
Hypoxia triggers epigenetic, transcriptomic and
proteomic remodeling to drive malignant tumor phenotypes (13,36–38).
For instance, hypoxia upregulates the transcription factor CEBPD,
promoting cell invasion by activating extracellular matrix-integrin
mediated EGFR/PI3K signaling in glioblastoma (39). Hypoxia facilitates immune evasion
in triple-negative breast cancer by inducing HIF1α-dependent
epigenetic vulnerabilities (40).
In OSCC, hypoxia downregulates the expression of critical tight
junction components, including Par3, TJP1 and claudins, thereby
enhancing cell migration and invasion (41). Additionally, hypoxia promotes
proliferation and suppresses apoptosis in OSCC cells by
upregulating TPD52 expression (42). However, the comprehensive molecular
mechanisms governing hypoxia-driven progression in OSCC remain
largely unknown. In the present study, malignant epithelial cell
populations in OSCC were identified. A total of 104 hypoxia- and
glycolysis-associated genes were identified in malignant epithelial
cells. To identify core hypoxia- and glycolysis-associated genes
robustly, the Mime algorithm framework was implemented. Mime is a
high-performance open-source R package that integrates 10 distinct
machine learning algorithms, streamlining the development of
prognostic models from transcriptomic data, while enabling deep
feature mining (25). An optimal
prognostic model was established [‘StepCox (backward) + Enet
(α=0.8)’] based on four key genes (HSPG2, IGSF3, DUS1L and
DYNC1H1) screened from 104 hypoxia- and
glycolysis-associated candidates. Higher risk scores significantly
predicted adverse RFS, confirming the detrimental role of these
pathways in OSCC. This optimized model serves as a robust
stratification tool, allowing clinicians to identify high-risk
patients with distinct hypoxic/glycolytic profiles, who may benefit
from more aggressive adjuvant therapies or closer clinical
monitoring.
Epigenetic remodeling plays a critical role in
hypoxia-driven tumor malignancy (43,44).
As key epigenetic regulatory elements, SEs (usually spanning 8–20
kb) robustly activate target gene transcription through
high-density enrichment of master transcription factors (16,45).
In the present study, DYNC1H1 was identified as a
hypoxia-responsive SE-regulated gene. DYNC1H1 is a
microtubule-activated ATPase, which plays central roles in multiple
intracellular processes, such as protein sorting, spindle dynamics
and molecular motors (46,47). As the heavy chain subunit of
cytoplasmic dynein-1, DYNC1H1 binds to the dynein complex while
also recognizing and associating with cargoes via its N-terminus;
its C-terminus contains a motor domain responsible for driving the
movement of the complex along microtubules (48,49).
The function of DYNC1H1 has garnered increasing attention in
cancer. It has been shown that loss of DYNC1H1 in non-small cell
lung cancer cells reduces proliferation, migration and invasion,
and induces cell-cycle arrest (50). Downregulation of DYNC1H1 inhibits
tumor stemness in ovarian cancer (51). Furthermore, DYNC1H1 has been
reported to be a biomarker for colorectal cancer and nasopharyngeal
carcinoma (52,53). The protumorigenic effects of
DYNC1H1 are likely closely linked to its molecular functions. As a
transport motor, it may directionally deliver cargoes such as the
epidermal growth factor receptor and invasion-associated factors to
specific subcellular locations, thereby regulating cell
proliferation and invasion (46).
It influences chromosome segregation and supports rapid tumor cell
proliferation by modulating mitotic spindle dynamics (47,54).
Furthermore, through spatially coordinated movement along
microtubules, DYNC1H1 can affect the translocation and activation
of key signaling molecules, such as STATs, ultimately regulating
downstream gene expression and cellular behavior (46,50).
However, the functional significance of DNYC1H1 in OSCC progression
remains unknown. In the present study, DYNC1H1 KD significantly
attenuated hypoxia-induced malignant phenotypes of OSCC, including
proliferation, invasion, glucose uptake and lactate production.
These findings established that DYNC1H1 is a regulator of hypoxic
adaptation in OSCC.
SEs orchestrate transcriptional programs through
cooperative interactions with transcription factors, with their
activity dynamically modulated by transcription factor enrichment
(17). In the present study, FOSL2
drove DYNC1H1 transcriptional activation via specific
binding to both TE and SE regions. Hypoxia significantly
upregulated FOSL2 expression in OSCC cells. FOSL2, also known as
FRA2 or ACED, is a key subunit of the AP-1 complex and is involved
in mediating cellular responses to external stimuli, stress signals
and internal perturbations (55–57).
In hypoxic microenvironments, FOSL2 activation can be induced via
the JNK and p38/MAPK pathways. Upon activation, FOSL2 forms AP-1
complexes by dimerizing with Jun proteins (such as c-Jun, JunB and
JunD), which then recognize specific genomic response-elements and
regulate downstream gene expression (55,57).
It has been reported that hypoxia promotes the natural evolution
signature transition in glioblastoma through the HIF1A/FOSL2 axis
(58). In OSCC, inhibition of
FOSL2 downregulates AP-1 target genes such as MMP9 and cyclin-D1,
while upregulating Fra-1 and p53 expression, thereby suppressing
tumor cell migration and cell-cycle progression (59). However, the precise role of FOSL2
in the hypoxic microenvironment of OSCC and how upstream hypoxia
signals precisely regulate its transcriptional activity and
downstream network remain unclear. In the present study, it was
demonstrated that FOSL2 KD significantly suppressed hypoxia-induced
malignant phenotypes in OSCC, whereas DYNC1H1 OE reversed this
phenotypic rescue. These findings indicate that the FOSL2/DYNC1H1
axis is a key regulatory mechanism driving hypoxic adaptation in
OSCC. Targeting the epigenetic machinery that governs this axis is
a novel therapeutic strategy. Agents that inhibit SE components,
such as BET and JQ1, or CDK7 inhibitors, can block the
FOSL2/DYNC1H1 signaling cascade. Such precise interventions would
specifically target ‘hypoxia-addicted’ tumor cells without broadly
impacting housekeeping gene expression, highlighting a potential
avenue for treating SE-driven OSCC.
The present study has several limitations. First,
although the findings established that the FOSL2/DYNC1H1 axis is a
critical regulator of hypoxic adaptation in OSCC, the conclusions
were primarily derived from in vitro models. Future
validation studies using in vivo models and larger clinical
cohorts are required. Secondly, the multi-omics analysis initially
identified several core genes, including HSPG2, IGSF3 and
DUS1L, whose roles in hypoxic OSCC remain unclear. Third,
the specific cofactors and chromatin remodelers that facilitate
FOSL2-mediated activation in the DYNC1H1 TE and SE regions are
unknown. Finally, targeting this pathway, potentially through
inhibitors of AP-1 activity or dynein function, may offer a novel
intervention strategy for patients with OSCC and hypoxic tumors, a
direction that merits future preclinical exploration.
In conclusion, DYNC1H1 was identified as an
SE-regulated gene that displayed hypoxia-responsive upregulation in
OSCC. FOSL2 bound the TE and SE regions of DYNC1H1 to drive
its transcriptional activation. The FOSL2/DYNC1H1 axis drove
hypoxia-induced malignant phenotypes in OSCC cells, including
proliferation, invasion, glucose uptake and lactate production.
These findings identify the FOSL2/DYNC1H1 axis as a regulatory hub
for hypoxic adaptation in OSCC and suggest it as a potential
therapeutic target.
Supplementary Material
Supporting Data
Supporting Data
Acknowledgements
Not applicable.
Funding
The present study was supported by Hebei Natural Science
Foundation (grant. no. H2024206476) and Medical Science Research
Project of Hebei (grant. no. 20240580).
Availability of data and materials
The data generated in the present study may be
requested from the corresponding author.
Authors' contributions
YQ conceived the study and wrote the article and was
involved in data analysis and interpretation. LJ and JZ performed
the experiments, were involved in data analysis and wrote the
article. WW and NZ were involved in data analysis and performed the
experiments and wrote the article. YL, AT and WY performed the
experiments. All authors read and approved the final version of the
manuscript. YQ and LJ confirm the authenticity of all the raw
data.
Ethics approval and consent to
participate
Not applicable.
Patient consent for publication
Not applicable.
Competing interests
The authors declare that they have no competing
interests.
Glossary
Abbreviations
Abbreviations:
|
OSCC
|
oral squamous cell carcinoma
|
|
CCK-8
|
Cell Counting Kit-8
|
|
ChIP-qPCR
|
Chromatin immunoprecipitation
followed by qPCR
|
|
C-index
|
concordance index
|
|
DMEM
|
Dulbecco's Modified Eagle Medium
|
|
Enet
|
elastic network
|
|
FOSL2
|
FOS-like 2
|
|
GEO
|
Gene Expression Omnibus
|
|
H3K27ac
|
histone-3 lysine-27 acetylation
|
|
hdWGCNA
|
high-dimensional weighted gene
co-expression network analysis
|
|
KD
|
knockdown
|
|
Lasso
|
least absolute shrinkage and
selection operator
|
|
OE
|
overexpression
|
|
qPCR
|
quantitative PCR
|
|
RFS
|
recurrence-free survival
|
|
scRNA-seq
|
single-cell RNA sequencing
|
|
SEs
|
super-enhancers
|
|
ssGSEA
|
single-sample gene set enrichment
analysis
|
|
StepCox
|
stepwise Cox
|
|
TEs
|
typical enhancers
|
|
TCGA
|
The Cancer Genome Atlas
|
|
UMAP
|
Uniform Manifold Approximation and
Projection
|
References
|
1
|
Hu S, Lu H, Xie W, Wang D, Shan Z, Xing X,
Wang XM, Fang J, Dong W, Dai W, et al: TDO2+ myofibroblasts mediate
immune suppression in malignant transformation of squamous cell
carcinoma. J Clin Invest. 132:e1576492022. View Article : Google Scholar : PubMed/NCBI
|
|
2
|
Leemans CR, Braakhuis BJ and Brakenhoff
RH: The molecular biology of head and neck cancer. Nat Rev Cancer.
11:9–22. 2011. View Article : Google Scholar : PubMed/NCBI
|
|
3
|
Sequeira I, Neves JF, Carrero D, Peng Q,
Palasz N, Liakath-Ali K, Lord GM, Morgan PR, Lombardi G and Watt
FM: Immunomodulatory role of Keratin 76 in oral and gastric cancer.
Nat Commun. 9:34372018. View Article : Google Scholar : PubMed/NCBI
|
|
4
|
Pouyssegur J, Dayan F and Mazure NM:
Hypoxia signalling in cancer and approaches to enforce tumour
regression. Nature. 441:437–443. 2006. View Article : Google Scholar : PubMed/NCBI
|
|
5
|
Chen Z, Han F, Du Y, Shi H and Zhou W:
Hypoxic microenvironment in cancer: Molecular mechanisms and
therapeutic interventions. Signal Transduct Target Ther. 8:702023.
View Article : Google Scholar : PubMed/NCBI
|
|
6
|
Bhandari V, Hoey C, Liu LY, Lalonde E, Ray
J, Livingstone J, Lesurf R, Shiah YJ, Vujcic T, Huang X, et al:
Molecular landmarks of tumor hypoxia across cancer types. Nat
Genet. 51:308–318. 2019. View Article : Google Scholar : PubMed/NCBI
|
|
7
|
Abu El Maaty MA, Terzic J, Keime C, Rovito
D, Lutzing R, Yanushko D, Parisotto M, Grelet E, Namer IJ, Lindner
V, et al: Hypoxia-mediated stabilization of HIF1A in prostatic
intraepithelial neoplasia promotes cell plasticity and malignant
progression. Sci Adv. 8:eabo22952022. View Article : Google Scholar : PubMed/NCBI
|
|
8
|
Beasley NJ, Leek R, Alam M, Turley H, Cox
GJ, Gatter K, Millard P, Fuggle S and Harris AL: Hypoxia-inducible
factors HIF-1alpha and HIF-2alpha in head and neck cancer:
Relationship to tumor biology and treatment outcome in surgically
resected patients. Cancer Res. 62:2493–2497. 2002.PubMed/NCBI
|
|
9
|
Duan Y, Zhou M, Ye B, Yue K, Qiao F, Wang
Y, Lai Q, Wu Y, Cao J, Wu Y, et al: Hypoxia-induced miR-5100
promotes exosome-mediated activation of cancer-associated
fibroblasts and metastasis of head and neck squamous cell
carcinoma. Cell Death Dis. 15:2152024. View Article : Google Scholar : PubMed/NCBI
|
|
10
|
Bao MH and Wong CC: Hypoxia, metabolic
reprogramming, and drug resistance in liver cancer. Cells.
10:17152021. View Article : Google Scholar : PubMed/NCBI
|
|
11
|
Yang R, Chen H, Xing L, Wang B, Hu M, Ou
X, Chen H, Deng Y, Liu D, Jiang R and Chen J: Hypoxia-induced
circWSB1 promotes breast cancer progression through destabilizing
p53 by interacting with USP10. Mol Cancer. 21:882022. View Article : Google Scholar : PubMed/NCBI
|
|
12
|
Rey-Keim S and Schito L: Origins and
molecular effects of hypoxia in cancer. Semin Cancer Biol. 106–107.
166–178. 2024.PubMed/NCBI
|
|
13
|
Jing X, Yang F, Shao C, Wei K, Xie M, Shen
H and Shu Y: Role of hypoxia in cancer therapy by regulating the
tumor microenvironment. Mol Cancer. 18:1572019. View Article : Google Scholar : PubMed/NCBI
|
|
14
|
Ong CT and Corces VG: Enhancer function:
New insights into the regulation of tissue-specific gene
expression. Nat Rev Genet. 12:283–293. 2011. View Article : Google Scholar : PubMed/NCBI
|
|
15
|
Zabidi MA, Arnold CD, Schernhuber K,
Pagani M, Rath M, Frank O and Stark A: Enhancer-core-promoter
specificity separates developmental and housekeeping gene
regulation. Nature. 518:556–559. 2015. View Article : Google Scholar : PubMed/NCBI
|
|
16
|
Wang M, Chen Q, Wang S, Xie H, Liu J,
Huang R, Xiang Y, Jiang Y, Tian D and Bian E: Super-enhancers
complexes zoom in transcription in cancer. J Exp Clin Cancer Res.
42:1832023. View Article : Google Scholar : PubMed/NCBI
|
|
17
|
Jiang Y, Jiang YY and Lin DC:
Super-enhancer-mediated core regulatory circuitry in human cancer.
Comput Struct Biotechnol J. 19:2790–2795. 2021. View Article : Google Scholar : PubMed/NCBI
|
|
18
|
Jiang YY, Lin DC, Mayakonda A, Hazawa M,
Ding LW, Chien WW, Xu L, Chen Y, Xiao JF, Senapedis W, et al:
Targeting super-enhancer-associated oncogenes in oesophageal
squamous cell carcinoma. Gut. 66:1358–1368. 2017. View Article : Google Scholar : PubMed/NCBI
|
|
19
|
Tang F, Yang Z, Tan Y and Li Y:
Super-enhancer function and its application in cancer targeted
therapy. NPJ Precis Oncol. 4:22020. View Article : Google Scholar : PubMed/NCBI
|
|
20
|
Gao Q, Yang L, Lu M, Jin R, Ye H and Ma T:
The artificial intelligence and machine learning in lung cancer
immunotherapy. J Hematol Oncol. 16:552023. View Article : Google Scholar : PubMed/NCBI
|
|
21
|
Swanson K, Wu E, Zhang A, Alizadeh AA and
Zou J: From patterns to patients: Advances in clinical machine
learning for cancer diagnosis, prognosis, and treatment. Cell.
186:1772–1791. 2022. View Article : Google Scholar : PubMed/NCBI
|
|
22
|
Kourou K, Exarchos TP, Exarchos KP,
Karamouzis MV and Fotiadis DI: Machine learning applications in
cancer prognosis and prediction. Comput Struct Biotechnol J.
13:8–17. 2014. View Article : Google Scholar : PubMed/NCBI
|
|
23
|
Boehm KM, Khosravi P, Vanguri R, Gao J and
Shah SP: Harnessing multimodal data integration to advance
precision oncology. Nat Rev Cancer. 22:114–126. 2022. View Article : Google Scholar : PubMed/NCBI
|
|
24
|
Issa NT, Stathias V, Schürer S and
Dakshanamurthy S: Machine and deep learning approaches for cancer
drug repurposing. Semin Cancer Biol. 68:132–142. 2021. View Article : Google Scholar : PubMed/NCBI
|
|
25
|
Liu H, Zhang W, Zhang Y, Adegboro AA,
Fasoranti DO, Dai L, Pan Z, Liu H, Xiong Y, Li W, et al: Mime: A
flexible machine-learning framework to construct and visualize
models for clinical characteristics prediction and feature
selection. Comput Struct Biotechnol J. 23:2798–2810. 2024.
View Article : Google Scholar : PubMed/NCBI
|
|
26
|
Chu Y, Dai E, Li Y, Han G, Pei G, Ingram
DR, Thakkar K, Qin JJ, Dang M, Le X, et al: Pan-cancer T cell atlas
links a cellular stress response state to immunotherapy resistance.
Nat Med. 29:1550–1562. 2023. View Article : Google Scholar : PubMed/NCBI
|
|
27
|
Quah HS, Cao EY, Suteja L, Li CH, Leong
HS, Chong FT, Gupta S, Arcinas C, Ouyang JF, Ang V, et al: Single
cell analysis in head and neck cancer reveals potential immune
evasion mechanisms during early metastasis. Nat Commun.
14:16802023. View Article : Google Scholar : PubMed/NCBI
|
|
28
|
Bill R, Wirapati P, Messemaker M, Roh W,
Zitti B, Duval F, Kiss M, Park JC, Saal TM, Hoelzl J, et al:
CXCL9:SPP1 macrophage polarity identifies a network of cellular
programs that control human cancers. Science. 381:515–524. 2023.
View Article : Google Scholar : PubMed/NCBI
|
|
29
|
Wichmann G, Rosolowski M, Krohn K, Kreuz
M, Boehm A, Reiche A, Scharrer U, Halama D, Bertolini J, Bauer U,
et al: The role of HPV RNA transcription, immune response-related
gene expression and disruptive TP53 mutations in diagnostic and
prognostic profiling of head and neck cancer. Int J Cancer.
137:2846–2457. 2015. View Article : Google Scholar : PubMed/NCBI
|
|
30
|
Saito T, Asai S, Tanaka N, Nohata N,
Minemura C, Koma A, Kikkawa N, Kasamatsu A, Hanazawa T, Uzawa K and
Seki N: Genome-Wide super-enhancer-based analysis: Identification
of prognostic genes in oral squamous cell carcinoma. Int J Mol Sci.
23:91542022. View Article : Google Scholar : PubMed/NCBI
|
|
31
|
Livak KJ and Schmittgen TD: Analysis of
relative gene expression data using real-time quantitative PCR and
the 2(−Delta Delta C(T)) Method. Methods. 25:402–408. 2001.
View Article : Google Scholar : PubMed/NCBI
|
|
32
|
Meng X, Lou QY, Yang WY, Wang YR, Chen R,
Wang L, Xu T and Zhang L: The role of non-coding RNAs in drug
resistance of oral squamous cell carcinoma and therapeutic
potential. Cancer Commun (Lond). 41:981–1006. 2021. View Article : Google Scholar : PubMed/NCBI
|
|
33
|
Wu Q, You L, Nepovimova E, Heger Z, Wu W,
Kuca K and Adam V: Hypoxia-inducible factors: Master regulators of
hypoxic tumor immune escape. J Hematol Oncol. 15:772022. View Article : Google Scholar : PubMed/NCBI
|
|
34
|
Nasri D, Manwar R, Kaushik A, Er EE and
Avanaki K: Photoacoustic imaging for investigating tumor hypoxia: A
strategic assessment. Theranostics. 13:3346–3367. 2023. View Article : Google Scholar : PubMed/NCBI
|
|
35
|
Balamurugan K: HIF-1 at the crossroads of
hypoxia, inflammation, and cancer. Int J Cancer. 138:1058–1066.
2016. View Article : Google Scholar : PubMed/NCBI
|
|
36
|
Kopecka J, Salaroglio IC, Perez-Ruiz E,
Sarmento-Ribeiro AB, Saponara S, De Las Rivas J and Riganti C:
Hypoxia as a driver of resistance to immunotherapy. Drug Resist
Updat. 59:1007872021. View Article : Google Scholar : PubMed/NCBI
|
|
37
|
Roma-Rodrigues C, Mendes R, Baptista PV
and Fernandes AR: Targeting tumor microenvironment for cancer
therapy. Int J Mol Sci. 20:8402019. View Article : Google Scholar : PubMed/NCBI
|
|
38
|
Wang W, Han Y, Jo HA, Lee J and Song YS:
Non-coding RNAs shuttled via exosomes reshape the hypoxic tumor
microenvironment. J Hematol Oncol. 13:672020. View Article : Google Scholar : PubMed/NCBI
|
|
39
|
Mao XG, Xue XY, Lv R, Ji A, Shi TY, Chen
XY, Jiang XF and Zhang X: CEBPD is a master transcriptional factor
for hypoxia regulated proteins in glioblastoma and augments hypoxia
induced invasion through extracellular matrix-integrin mediated
EGFR/PI3K pathway. Cell Death Dis. 14:2692023. View Article : Google Scholar : PubMed/NCBI
|
|
40
|
Ma S, Zhao Y, Lee WC, Ong LT, Lee PL,
Jiang Z, Oguz G, Niu Z, Liu M, Goh JY, et al: Hypoxia induces
HIF1α-dependent epigenetic vulnerability in triple negative breast
cancer to confer immune effector dysfunction and resistance to
anti-PD-1 immunotherapy. Nat Commun. 13:41182022. View Article : Google Scholar : PubMed/NCBI
|
|
41
|
Kim S, Park S, Moon EH, Kim GJ and Choi J:
Hypoxia disrupt tight junctions and promote metastasis of oral
squamous cell carcinoma via loss of par3. Cancer Cell Int.
23:792023. View Article : Google Scholar : PubMed/NCBI
|
|
42
|
Abe Y, Mukudai Y, Kurihara M, Houri A,
Chikuda J, Yaso A, Kato K, Shimane T and Shirota T: Tumor protein
D52 is upregulated in oral squamous carcinoma cells under hypoxia
in a hypoxia-inducible-factor-independent manner and is involved in
cell death resistance. Cell Biosci. 11:1222021. View Article : Google Scholar : PubMed/NCBI
|
|
43
|
Schito L and Semenza GL: Hypoxia-inducible
factors: Master regulators of cancer progression. Trends Cancer.
2:758–770. 2016. View Article : Google Scholar : PubMed/NCBI
|
|
44
|
Lin YT and Wu KJ: Epigenetic regulation of
epithelial-mesenchymal transition: Focusing on hypoxia and TGF-beta
signaling. J Biomed Sci. 27:392020. View Article : Google Scholar : PubMed/NCBI
|
|
45
|
Calo E and Wysocka J: Modification of
enhancer chromatin: What, how, and why? Mol Cell. 49:825–837. 2013.
View Article : Google Scholar : PubMed/NCBI
|
|
46
|
Driskell OJ, Mironov A, Allan VJ and
Woodman PG: Dynein is required for receptor sorting and the
morphogenesis of early endosomes. Nat Cell Biol. 9:113–120. 2007.
View Article : Google Scholar : PubMed/NCBI
|
|
47
|
Merdes A, Ramyar K, Vechio JD and
Cleveland DW: A complex of NuMA and cytoplasmic dynein is essential
for mitotic spindle assembly. Cell. 87:447–458. 1996. View Article : Google Scholar : PubMed/NCBI
|
|
48
|
Roossien DH, Miller KE and Gallo G:
Ciliobrevins as tools for studying dynein motor function. Front
Cell Neurosci. 9:2522015. View Article : Google Scholar : PubMed/NCBI
|
|
49
|
Ramos RL, De Heredia MMB, Zhang Y, Stout
RF, Tindi JO, Wu L, Schwartz GJ, Botbol YM, Sidoli S, Poojari A, et
al: Patient-specific mutation of Dync1h1 in mice causes brain and
behavioral deficits. Neurobiol Dis. 199:1065942024. View Article : Google Scholar : PubMed/NCBI
|
|
50
|
Pan H, Chai W, Liu X, Yu T, Sun L and Yan
M: DYNC1H1 regulates NSCLC cell growth and metastasis by
IFN-gamma-JAK-STAT signaling and is associated with an aberrant
immune response. Exp Cell Res. 409:1128972021. View Article : Google Scholar : PubMed/NCBI
|
|
51
|
Ling L, Wen Y, Chen H, Xiong Y, Liu X,
Chen J, Liu T and Zhang B: miR-134-3p driven by anisomycin impairs
ovarian cancer stem cell activity through inhibiting GPR137
expression. J Cancer. 14:3404–3415. 2023. View Article : Google Scholar : PubMed/NCBI
|
|
52
|
Palaniappan A, Ramar K and Ramalingam S:
Computational identification of novel stage-specific biomarkers in
colorectal cancer progression. PLoS One. 11:e01566652016.
View Article : Google Scholar : PubMed/NCBI
|
|
53
|
Wu ZH, Zhou T and Sun HY: DNA
methylation-based diagnostic and prognostic biomarkers of
nasopharyngeal carcinoma patients. Medicine (Baltimore).
99:e206822020. View Article : Google Scholar : PubMed/NCBI
|
|
54
|
Zheng Z, Wan Q, Liu J, Zhu H, Chu X and Du
Q: Evidence for dynein and astral microtubule-mediated cortical
release and transport of Gαi/LGN/NuMA complex in mitotic cells. Mol
Biol Cell. 24:901–913. 2013. View Article : Google Scholar : PubMed/NCBI
|
|
55
|
Gazon H, Barbeau B, Mesnard JM and
Peloponese JM Jr: Hijacking of the AP-1 signaling pathway during
development of ATL. Front Microbiol. 8:26862018. View Article : Google Scholar : PubMed/NCBI
|
|
56
|
Carthy JM, Sundqvist A, Heldin A, van Dam
H, Kletsas D, Heldin CH and Moustakas A: Tamoxifen inhibits
TGF-β-mediated activation of myofibroblasts by blocking non-smad
signaling through ERK1/2. J Cell Physiol. 230:3084–3092. 2015.
View Article : Google Scholar : PubMed/NCBI
|
|
57
|
Rampioni Vinciguerra GL, Capece M,
Scafetta G, Rentsch S, Vecchione A, Lovat F and Croce CM: Role of
Fra-2 in cancer. Cell Death Differ. 31:136–149. 2024. View Article : Google Scholar : PubMed/NCBI
|
|
58
|
Wu L, Wu W, Zhang J, Zhao Z, Li L, Zhu M,
Wu M, Wu F, Zhou F, Du Y, et al: Natural coevolution of tumor and
immunoenvironment in glioblastoma. Cancer Discov. 12:2820–2837.
2022. View Article : Google Scholar : PubMed/NCBI
|
|
59
|
Gupta S, Kumar P, Kaur H, Sharma N, Saluja
D, Bharti AC and Das BC: Selective participation of c-Jun with
Fra-2/c-Fos promotes aggressive tumor phenotypes and poor prognosis
in tongue cancer. Sci Rep. 5:168112015. View Article : Google Scholar : PubMed/NCBI
|