Introduction
Major depressive disorder (MDD) is a common
psychiatric disorder characterized by persistent low mood, a loss
of interest or pleasure in previously enjoyable activities, and
recurrent thoughts of death. According to the World Health
Organization, >300 million people worldwide experience a form of
depression to varying degrees, representing ~20% of the population
and imposing a substantial socioeconomic burden (1). Since Smith first proposed the
neuroinflammation hypothesis of depression in 1991 (2), accumulating evidence has highlighted
a critical role for neuroinflammation in the pathophysiology of
depression. The prefrontal cortex, particularly the medial
prefrontal cortex (mPFC), plays a central role in social cognition
and socio-emotional processing (3). Lipopolysaccharide (LPS)-induced
inflammation reduces the number of GABAergic interneuron in the
mouse hippocampus and prefrontal cortex (4).
Microglia are the primary immune sentinels of the
central nervous system and contribute to neuronal homeostasis,
immune surveillance, and the resolution of inflammatory responses
(5). Preclinical studies have
shown that intraperitoneal administration of LPS induces IL-1β
cleavage and increases the expression of nod-like receptor pyrin
domain-containing 3 (NLRP3) in the hippocampus (6). Immunofluorescence analyses further
demonstrated that NLRP3 expression is predominantly localized to
Iba-1 positive microglia compared with control animals. Therefore,
microglial activation in the mPFC represents an important target
for investigating the mechanisms underlying LPS-induced
depressive-like behavior. Accordingly, suppressing
neuroinflammation and limiting microglial activation may represent
effective strategies for alleviating depression.
The complement system is a critical component of
innate immunity that facilitates the recognition, surveillance, and
clearance of exogenous and endogenous danger signals derived from
pathogens or damaged and dying cells, including pathogen-associated
molecular patterns and damage-associated molecular patterns
(7). Complement C3 serves as the
central convergence point of the complement cascade and integrates
the three major complement activation pathways. Activation of these
pathways generates, C3 convertases, which cleave C3 into C3a and
C3b, two key-mediators of immune activation and neuroinflammation
(8). Previous studies have shown
that C3 deficiency in neuron-glial cultures and mouse brains
significantly attenuates LPS-induced oxidative damage and
neurodegeneration (9). Although
C3/C3aR signaling has traditionally been viewed as a pro-
inflammatory pathway, emerging evidence suggests that it also
regulates cellular metabolism (10,11).
Notably, C3ar1-deficient microglia exhibit resistance to metabolic
alterations induced by hypoxia mimetics and display reduced
expression of hypoxia-inducible factor-1 α (HIF-1α) (12).
Current antidepressant therapies are largely based
on the monoamine hypothesis. However, ~20–30% of patients with
depression fail to respond adequately to pharmacological treatment.
Consequently, recent drug discovery efforts have focused on
identifying novel antidepressant agents, particularly nutritional
supplements and traditional herbal medicines, because of their
favorable safety profiles, improved tolerability and reduced
adverse effects (13). Sedanolide
(SD) (C12H18O2; PubChem CID,
5018391) also known as 5-butyl-3-hydroxy-2(5H)-furanone, is a
naturally occurring compound found in several Umbelliferae species
and traditional Chinese medicinal plants, including Ligusticum
chuanxiong Hort., Cnidium monnieri (L.) Cuss., and
Apium graveolens L (14).
The structural feature comprises the double ring fusion of
γ-lactone (A ring) and benzene (B ring), demonstrating notable
anti-inflammatory properties and antioxidant properties (15). Studies have shown that
supercritical carbon dioxide extracts of Chuanxion from volatile
oil, which contain 6.31% SD, significantly improve cognitive
function and reduce infarct volume in cerebral ischemia-reperfusion
injury models. These neuroprotective effects are associated with
reduced levels of nitric oxide and malondialdehyde, along with
increased superoxide dismutase activity (16). In addition, SD enhances cell
viability and acts as a novel natural inhibitor of human monoamine
oxidase B in 6-hydroxydopamine-induced SH-SY5Y cell injury models
(17). SD also markedly attenuates
colonic inflammation by reducing the mRNA expression of
pro-inflammatory cytokines, including IL-1β, IL-6 and TNF-α
(18). Based on these findings, it
was hypothesized that SD may alleviate LPS-induced
neuroinflammation. In the present study, it was revealed that SD
ameliorates LPS-induced depressive-like behaviors. Furthermore, the
present results demonstrated that the inhibitory effects of SD on
inflammatory response and aerobic glycolysis in microglial cells
are critically dependent on the C3a/C3aR signaling axis. Together,
these findings identify that SD as a potential therapeutic
candidate for the treatment of neuroinflammation-associated
depressive-like behaviors.
Materials and methods
Reagents
LPS (Escherichia coli O55:B5; purity ≥97%, purified
by phenol extraction; specific activity ≥500,000 EU/mg) was
obtained from Beijing Solarbio Science & Technology Co., Ltd.
(cat. no. L8880), was diluted in sterile phosphate-buffered saline
(PBS) to prepare the stock solution of the 10 mg/ml concentration
and stored at −20°C.
Animals
All animal experiments were performed in strict
accordance with the laboratory animal testing guidelines of
Zhejiang University and the Guide for the Care and Use of
Laboratory Animals published by the National Institutes of Health.
The primary experimental protocols were reviewed and approved by
the Laboratory Animal Welfare and Ethics Review Committee, Zhejiang
University (Hangzhou, China; approval no. ZJU20220307). The
supplementary in vivo receptor-antagonism control procedures
(LPS+SB290157 cohort) were independently authorized and approved by
Animal Experimental Ethical Inspection of the Sir Run Run Shaw
Hospital, Zhejiang University School of Medicine (Hangzhou, China;
approval no. SRRSH2026-0041). The 6-week-old mice (weight, 20–22 g)
were provided by Zhejiang Vital River Laboratory Animal Technology
Co., Ltd. Alongside a 12/12-h light/dark cycle, the trial
maintained a consistent temperature of 22°C. A standard animal care
facility supplied food and water for the mice throughout the week.
The fewest number of animals possible were employed to minimize
their suffering.
Animal treatment
A total of 144 male C57BL/6 mice were successfully
utilized, evaluated, and euthanized in the present study, with zero
premature mortality recorded. Pre-defined humane endpoints were
established based on rigorous animal welfare criteria, including a
body weight loss exceeding 20%, severe prolonged lethargy, or
visible respiratory distress; notably, no animals reached these
thresholds during the experimental timelines. The dosage and
pre-treatment timeline of SD were selected based on previous in
vivo studies (18) and
optimized through preliminary pilot experiments. The in vivo
phase comprised two distinct procedural blocks: i) The primary
therapeutic evaluation cohort, wherein mice received daily
intragastric gavage of SD (20 mg/kg) or vehicle for 8 consecutive
days starting 3 days prior to a 5-day daily lipopolysaccharide
(LPS; 1 mg/kg, i.p.) challenge (19,20),
followed by sequential behavioral testing spanning 11 days; and ii)
the C3aR inhibition paradigm, where animals were pre-treated with
the selective C3aR antagonist SB290157 trifluoroacetate (30 mg/kg,
i.p.) every alternate day beginning 2 days prior to any other
interventions, followed by an 8-day concurrent SD/LPS regimen and a
subsequent 9-day behavioral assessment matrix. At the scheduled
experimental endpoints, deep anesthesia was initiated via the
inhalation of 4% isoflurane inside a dedicated induction chamber
for rapid induction and subsequently maintained at 2% isoflurane
during the procedural verification. Anesthetic depth was strictly
validated by the complete loss of the pedal withdrawal (toe-pinch)
reflex prior to the procedure. Humane euthanasia was sequentially
executed via cervical dislocation under this deep anesthetic state.
Absolute death was clinically verified by the permanent cessation
of cardiac impulses and respiratory movements prior to anatomical
tissue harvesting.
To optimize the preventative timing of SD prior to
acute LPS challenge, a preliminary pilot study was conducted
utilizing smaller animal cohorts (n=3-4 mice per group) using 19
mice. The protective phenotypes were systematically evaluated when
mice were administered with SD (20 mg/kg, i.g.) daily for either 1,
2, or 3 consecutive days before the acute systemic challenge, which
was subsequently maintained throughout the 5-day repetitive LPS
regimen. Pilot behavioral observations indicated that a 3-day
pre-treatment regimen offered the most stable, robust, and
statistically significant positive effects in safeguarding against
LPS-driven behavioral deficits compared with the 1- or 2-day
groups. The results of preliminary pilot behavior tests were
presented in Fig. S1.
Open field test (OFT)
The OFT was conducted following established
protocols (21). Prior to the
studies, mice were acclimatized to the testing environment and
lighting conditions for 30 min. Each mouse was individually placed
in a square arena (dimensions: 45×45×45 cm3) and allowed
to explore freely for 15 min. After each test, the open field arena
was sanitized with 75% ethanol. The locomotor and exploratory
behaviors of the mice were recorded using ANY-maze software during
the test.
Elevated plus maze (EPM)
The EPM test was conducted following previously
established techniques (21). The
maze consisted of two open arms and two closed arms, elevated above
the floor. Mice were placed individually at the center of the maze,
facing one of the open arms, and their physical activity was
recorded for a period of 5 min. Before testing the next mouse, the
maze was cleaned with 75% ethanol. The movements of the mice were
tracked and measured using ANY-maze software.
Marble burying test
The buried marble test relies on documenting the
number of marbles buried at the end of the experiment. The test was
originally designed to assess anxiety-like behavior. It is
conducted in a polypropylene mouse cage measuring 42×24×12 cm,
which has a metal grid on the top. The floor of the cage is covered
with 5 cm of sawdust, and 20 clean glass marbles (1.5 cm in
diameter) are evenly distributed across the surface. During the
test, the marbles are arranged with uniform spacing. Mice are
placed in this enclosure for 30 min. ~24 h after initial training
on the testing day, 15 marbles are distributed evenly within the
test cage. The mice are exposed to the marbles for 3 min while
being recorded on video. The number of buried marbles is
subsequently calculated.
Tail suspension test (TST)
The TST was conducted as outlined in previous
research (22). ~1/3 of the
mouse's tail was secured and suspended from a base, with the head
positioned 20 cm above the ground. Animal activity was recorded
from a lateral perspective. The mice were suspended for a total of
6 min, during which an observer, unaware of the treatment the
animals received, timed their immobility during the last 4-min
assessment. Animals were deemed motionless when they exhibited no
body movements and remained passively suspended.
Forced swimming test (FST)
The mice were placed in a glass chamber (35 cm in
height, 30 cm in diameter) filled with warm water. The water
temperature was maintained between 22 and 24°C, with a depth of 20
centimeters. The water depth was calibrated to prevent the animals
from contacting the substrate using their tails or hind limbs.
Animal behaviors were recorded via videotape from a lateral
perspective. The rodents were allowed to swim freely for 6 min, and
an observer blinded to the treatment conditions recorded the
duration of the immobility during the final 4-min assessment.
Immobility was defined as the time when the animals remained
stationary or afloat, displaying only the movements necessary to
maintain their balance in the water.
Sucrose preference test (SPT)
The mice were housed individually and acclimated
with two bottles of water for two days, followed by two bottles of
2% sucrose for another two days. After a period of 24 h without
water, the mice were provided with one bottle of 2% sucrose and one
bottle of water for 2 h during the dark phase. During the 2-h test,
the positions of the bottles were swapped after 1 h. The total
consumption of each fluid was recorded, and sucrose preference was
determined by calculating the average sucrose consumption ratio
over the first 2 h. The sucrose intake ratio was computed by
dividing total sucrose consumption by the combined intake of water
and sucrose.
Reverse transcription-quantitative PCR
(RT-qPCR)
Total RNA was extracted from the mPFC using the
FastPure Cell/Tissue Total RNA Extraction Kit V2 (Vazyme Biotech
Co., Ltd.). The quality and quantity of the RNA were assessed with
a NanoDrop spectrophotometer (Thermo Fisher Scientific, Inc.).
Subsequently, cDNA was synthesized from the RNA using the First
Strand cDNA Synthesis Kit (Monad Biotech Co., Ltd.) according to
the manufacturer's instructions. qPCR was then performed using SYBR
Green I (Foregene Co., Ltd) on an A&B Applied Biosystems
device. The thermocycling conditions were as follows: Initial
denaturation at 95°C for 30 sec, followed by 40 cycles of
denaturation at 95°C for 10 sec and annealing/extension at 60°C for
30 sec. The expression levels of the target genes were normalized
to GAPDH using the 2−ΔΔCq approach (23). The nucleotide sequences of the
primers used in RT-qPCR were: TNF-α forward,
5′-CCCTCACACTCAGATCATCTTCT-3′ and reverse,
5′-GCTACGACGTGGGCTACAG-3′; IL-6 forward,
5′-TAGTCCTTCCTACCCCAATTTCC-3′ and reverse,
5′-TTGGTCCTTAGCCACTCCTTC-3′; IL-1β forward,
5′-GCAACTGTTCCTGAACTCAACT-3′ and reverse,
5′-ATCTTTTGGGGTCCGTCAACT-3′; LCN2 forward,
5′-TGGCCCTGAGTGTCATGTG-3′ and reverse,
5′-CTCTTGTAGCTCATAGATGGTGC-3′; C3 forward,
5′-CCAGCTCCCCATTAGCTCTG-3′ and reverse,
5′-GCACTTGCCTCTTTAGGAAGTC-3′; S100a8 forward,
5′-AAATCACCATGCCCTCTACAAG-3′ and reverse,
5′-CCCACTTTTATCACCATCGCAA-3′; matrix metalloproteinase-9 (MMP9)
forward, 5′-CTGGACAGCCAGACACTAAAG-3′ and reverse,
5′-CTCGCGGCAAGTCTTCAGAG-3′; Itgal forward,
5′-CCAGACTTTTGCTACTGGGAC-3′ and reverse,
5′-GCTTGTTCGGCAGTGATAGAG-3′; Clec14a forward,
5′-CTTCACCACGCTACCTTCAAG-3′ and reverse,
5′-AAACCCCTTAAAGGCTCTTTCTC-3′; Myo1g forward,
5′-GGCCCTGAGTATGGGAAACC-3′ and reverse,
5′-GATACGAGCACCTCACCAATG-3′; Cybb forward,
5′-TGTGGTTGGGGCTGAATGTC-3′ and reverse,
5′-CTGAGAAAGGAGAGCAGATTTCG-3′; Frg forward,
5′-CGGCTGAAGAACGCTATTACC-3′ and reverse,
5′-GGGCGACGAATATGGTCACTC-3′; Adh1 forward,
5′-GCAAAGCTGCGGTGCTATG-3′ and reverse, 5′-TCACACAAGTCACCCCTTCTC-3′;
GAPDH forward, 5′-AGGTCGGTGTGAACGGATTTG-3′ and reverse,
5′-GGGGTCGTTGATGGCAACA-3′.
Western blot analysis
Mice were subjected to deep anesthesia and
subsequently processed according to a previously established
methodology (24) to obtain mPFC
tissue. After homogenizing the tissues in ice-cold RIPA Lysis and
Extraction buffer (cat. no. 89900; Thermo Fisher Scientific, Inc.)
solution containing PMSF, they were centrifuged for 15 min at 4°C
at 11,200 × g. The BCA assay (cat. no. P0011; Beyotime Institute of
Biotechnology) was utilized to measure concentrations following the
manufacturer's instructions. Equal amounts of protein (20 µg per
lane) were separated on 4–20% gradient SDS-polyacrylamide gels.
SDS-PAGE was performed to separate the proteins, which were then
transferred to PVDF membranes. The primary antibodies used included
LCN2 (1:1,000; cat. no. A2092), Itgal (1:1,000; cat. no. A23960),
Complement C3 (1:1,000; cat. no. A26625PM), MMP9 (1:1,000; cat. no.
A0289) and β-actin (1:3,000; cat. no. AC026; all from ABclonal
Biotech Co., Ltd.). These antibodies were incubated on membranes
with 5% non-fat milk in PBST (0.1% Tween-20) for 1 h at room
temperature, followed by overnight incubation at 4°C. The membranes
were then allowed to equilibrate at room temperature for 1 h while
being treated with the appropriate secondary antibodies (Goat
anti-Rabbit IgG (H+L) Secondary Antibody, HRP: 1:5,000; catalog no.
31460; Thermo Fisher Scientific, Inc.; and Goat anti-Mouse IgG
(H+L) Secondary Antibody, HRP: 1:5,000; catalog no. 31430; Thermo
Fisher Scientific, Inc.). Super ECL Detection Reagent (catalog no.
36208ES76; Shanghai Yeasen Biotechnology Co., Ltd.) was employed
for visualization, and images were captured using the ChemiDoc
Touch Imaging System (Bio-Rad Laboratories, Inc.). Band intensities
were analyzed using ImageJ software (version 1.54p; National
Institutes of Health).
Immunostaining
In accordance with the methodology detailed in
previous studies, serial cryostat sections with a thickness of 25
µm were prepared (15,16). The sections underwent treatment
with 5% donkey serum (catalog no. 36136ES60; Shanghai Yeasen
Biotechnology Co., Ltd.) and 0.3% Triton X-100 for 1 h at room
temperature. This was followed by overnight incubation at 4°C with
an antibody diluent containing goat antibodies against Iba-1
(1:200; cat. no. ab178846; Abcam). Subsequently, the sections were
washed with PBS at three 10-min intervals. After washing, they were
incubated at room temperature for 1 h with Alexa Fluor 594 goat
anti-rabbit antibody (1:1,000; catalog no. ab150080; Abcam).
Fluorescent images were captured using a Nikon A1 confocal
microscope. Image acquisition was conducted using Image-Pro Plus
5.0 software (Media Cybernetics, Inc.), ensuring that all
parameters remained consistent throughout the process.
Morphometric analysis for
microglia
The approach (25)
was followed to conduct a morphometric evaluation of the microglia.
High-resolution images with distinct cellular architecture were
obtained using confocal fluorescence microscopy (Nikon
Corporation). To analyze the target region layer by layer, an ×40
objective was employed. Additionally, multi-plane virtual-Z mode
was used to reconstruct the cellular architecture in three
dimensions after the analysis. At least five Iba1+ cells
were present in each location, and 10 images of individual
microglia were captured from each mouse studied. Following the
examination of the images, skeletonization was performed using
ImageJ's skeleton analysis. The terminal positions of the microglia
were counted, and the maximal branch length of the microglia was
determined. Sholl analysis was conducted on binary images by
utilizing the Sholl analysis tools available in ImageJ. An
assessment of the cellular complexity was carried out by counting
the number of intersections where concentric circles
overlapped.
BV-2 cell culture
The BV-2 cell line, obtained from OriCell, was
cultured in DMEM basic (1X) media (cat. no. C11995500BT; Gibco;
Thermo Fisher Scientific, Inc.) supplemented with 10% fetal bovine
serum (FBS; catalog no. A5209402; Gibco; Thermo Fisher Scientific,
Inc.) and 1% penicillin/streptomycin (cat. no. 240004004; Beijing
Solarbio Science & Technology Co., Ltd.) in a
humidity-controlled incubator at 37°C with 5% CO2.
BV-2 cell treatment
The BV-2 cell line, maintained under optimal
conditions, was inoculated into multi-well plates. The experiment
began once the cells reached ~70–80% confluence in medium devoid of
FBS. The cells underwent pre-treatment with SD (50 µM) for 2 h.
Following pre-treatment, LPS (100 ng/ml) was immediately added to
the culture medium for stimulation. Regarding SB290157
trifluoroacetate treatment, either dimethyl sulfoxide (DMSO) or 10
µM SB290157 was introduced to the BV-2 cell 1 h prior to the
administration of SD (26). Cells
were harvested 6 h after stimulation for RT-qPCR assays. Samples
were collected 24 h after treatment for western blot analysis and
metabolic extracellular flux assays.
For the concentrate of C3a by ELISA assay BV-2
microglial cells were cultured until achieving ~70–80% confluence,
after which the culture medium was replenished with serum-free
medium. To evaluate the regulatory effect of SD on complement C3
cleavage, cells were pre-treated with SD (50 µM) for 2 h. A total
of 1 h prior to LPS stimulation, recombinant full-length mouse C3
protein (2 µg/ml; cat. no. HY-P78247; MedChemExpress) was
introduced into the medium as an exogenous substrate. Subsequently,
cells were administrated with LPS (100 ng/ml) to initiate the
complement activation cascade. Following a 24-h incubation period,
the cell culture supernatants were meticulously collected and
centrifuged at 1,000 × g for 10 min at 4°C to remove cellular
debris. The concentration of active C3a fragment in the clarified
supernatants was quantitatively determined using a commercial Mouse
C3a Enzyme-Linked Immunosorbent Assay (ELISA) kit according to the
manufacturer's instructions. Concurrently, the adherent cells were
washed with ice-cold PBS and lysed using RIPA buffer. The total
protein concentration of each well was measured via a BCA protein
assay kit.
BV-2 microglial cells were cultured until achieving
~70–80% confluence, after which the culture medium was replenished
with serum-free medium. Cells were pre-treated with SD (50 µM) for
2 h. A total of 1 h prior to LPS stimulation, recombinant mouse C3a
protein (1 µg/ml; cat. no. HY-P7863; MedChemExpress) was introduced
into the medium. Subsequently, cells were administrated with LPS
(100 ng/ml) to initiate the inflammation activation cascade.
Following a 24-h incubation period, the whole cell harvested and
lysed using RIPA buffer. The total protein concentration of each
well was measured via a BCA protein assay kit.
Estimating metabolic extracellular
flux
The ideal cell density was selected, and the
experiments were conducted (27).
Quadruplicates or quintuplicates of BV-2 cell lines were cultured
on XF-96 plates with LPS and SD. Microglia were washed and assessed
in XF Running buffer A (10 mM glucose, 1 mM sodium pyruvate, and 2
mM L-glutamine) for oxygen consumption rate (OCR) or extracellular
acidification rate (ECAR) at designated intervals. Measurements
were received in real-time before and after pharmacological
interventions, including the MitoStress assay with 1 µM oligomycin,
1 µM FCCP and 1 µM rotenone, as well as the glycolysis stress
experiment with 10 mM glucose, 1 µM oligomycin, and 50 mM 2-DG.
When glucose was supplemented, ECAR measures reflected the basal
ECAR, while OCR measures indicated the basal OCR. The difference
between basal OCR and the peak OCR following FCCP treatment
represented mitochondrial respiration capacity and ATP production.
Glycolytic reserve (GR) was calculated as the difference between
basal and peak ECAR after oligomycin administration.
Next generation sequencing
The RNA-Seq investigation involved collecting mPFC
tissues harvested from the CTRL (n=4), LPS (n=5), SDN (n=5) and
LPS+SDN (n=5) groups. The RNA sequencing process encompasses
several key steps: Extracting RNA, constructing a library,
sequencing, checking quality, mapping reads, analyzing differential
expression, and performing functional enrichment. Following the
manufacturer's instructions, TRIzol® Reagent was
utilized to extract total RNA from the tissue samples.
Subsequently, the 5300 Bioanalyzer (Agilent) was employed to assess
the purity of the RNA, while the ND-2000 (NanoDrop Technologies;
Thermo Fisher Scientific, Inc.) was used for quantification. For
sequencing library creation, only RNA samples meeting strict
quality criteria (OD260/280=1.8- 2.2, OD260/230 ≥2.0, RIN ≥6.5,
28S:18S ≥1.0,>1 µg) were selected. RNA purification, reverse
transcription, library building, and sequencing were performed by
Shanghai Majorbio Bio-pharm Biotechnology Co., Ltd. in accordance
with the manufacturer's guidelines (Illumina, Inc.). The
Illumina® Stranded mRNA Prep, Ligation from (Illumina,
Inc.) was used to generate the mPFC RNA-seq transcriptome library.
A total of 1 µg of total RNA for the experiment. The polyA
selection method was employed with oligo(dT) beads to isolate
messenger RNA, which was subsequently fragmented using a
fragmentation buffer. Following this, the SuperScript
double-stranded cDNA synthesis kit (Invitrogen; Thermo Fisher
Scientific, Inc.) was used to generate double-stranded cDNA with
random hexamer primers (Illumina, Inc.). In accordance with
Illumina's library construction protocol, the synthesized cDNA was
subjected to end repair, phosphorylation, and the addition of an
‘A’ base. Libraries were then size-selected for cDNA target
fragments of 300 bp using 2% low-range ultra-agarose. Next, the
fragments were amplified by PCR with Phusion DNA polymerase (New
England BioLabs, Inc.) for 15 cycles. After quantification with the
Qubit 4.0, the paired-end RNA-seq sequencing library was sequenced
on the NovaSeq 6000 sequencer, which produces reads of 2×150 bp.
The raw paired-end readings were reduced and fastp was used with
the default settings to assess their quality. Subsequently, HISAT2
software (28) was employed to
align the cleaned reads to the reference genome in oriented mode.
StringTie (29) was utilized to
generate mapped reads for each sample in a reference-based manner.
To identify differentially expressed genes (DEGs) across two
distinct samples, we quantified the expression level of each
transcript using the transcripts per million reads methodology.
RSEM was employed to measure gene abundances (30). For the differential expression
analysis, either DESeq2 (31) or
DEGseq (32) were used. DEGs were
identified with |log2FC|>1 and a false discovery rate
(FDR) ≤0.05 using DESeq2, or with an FDR <0.001 using DEGseq.
Additionally, functional enrichment analysis was performed,
including Gene Ontology (GO) and Kyoto Encyclopedia of Genes and
Genomes (KEGG) pathways, to identify DEGs that were significantly
enriched in GO terms and metabolic pathways, with a
Bonferroni-corrected P≤0.05 compared with the whole transcriptome
background. GOATOOLS (https://github.com/tanghaibao/goatools) was used for
GO functional enrichment analysis, and KOBAS (http://kobas.cbi.pku.edu.cn) was used for KEGG pathway
analysis.
Mouse C3a ELISA assays
The concentration of active C3a fragment in the
clarified supernatants was quantitatively determined using a
commercial Mouse C3a ELISA kit (cat. no. NBP2-70037; Novus
Biologicals, LLC) according to the manufacturer's instructions. To
ensure experimental rigor and eliminate variations in cell density,
the absolute concentrations of C3a obtained from the ELISA were
normalized against the total protein content of the respective cell
lysates and expressed as pg/mg total protein.
Statistical analysis
All data were collected and analyzed blindly. Data
are presented as the mean ± SEM. Single comparisons were determined
using a two-tailed Student's t-test. Two-way ANOVA with Tukey's
multiple comparisons test was applied for multiple comparisons.
Sample sizes were based on our previous study and relevant
literature to ensure reliable measurements. Statistical analyses
were conducted using GraphPad Prism 8.0 (GraphPad Software;
Dotmatics). P<0.05 was considered to indicate a statistically
significant difference. All statistical analyses are detailed in
the figure legends and Table
SI.
Results
SD alleviates LPS-induced depressive
disorder
Adult wide-type C57BL/6 mice received with LPS (1
mg/kg) daily for 5 consecutive days. Mice were pretreated with SD
(20 mg/kg, i.g.) for 3 days before LPS administration and continued
to receive SD for a total of 8 consecutive days (Fig. 1A). LPS treatment reduced body
weight compared with the sham group, whereas SD significantly
increased body weight in LPS-treated mice (Fig. 1B). Neither LPS nor SD affected
locomotor activity, as indicated by the absence of significant
differences in the total distance traveled during the OFT (Fig. 1C). Similarly, no significant
difference was observed in the center time of the OFT test or in
the time spent in the open arms of the EPM test among the
experimental groups (Fig. 1C-E).
The number of buried marbles also remained unchanged across all
four groups (Fig. 1F). These
findings indicate that neither LPS nor SD induced anxiety-like
behavior. In the SPT, LPS-treated mice exhibited a significant
reduction in sucrose preference, indicating the development of
anhedonia-like behavior. SD treatment markedly increased the
sucrose preference in the LPS-treated mice (Fig. 1G). In addition, LPS administration
significantly increased immobility time in both the TST and FST
compared with the control groups, indicating the induction of
depressive-like behaviors. SD treatment effectively reversed these
behavioral deficits (Fig. 1H and
I). Collectively, these results demonstrate that SD alleviates
LPS-induced depressive-like behaviors.
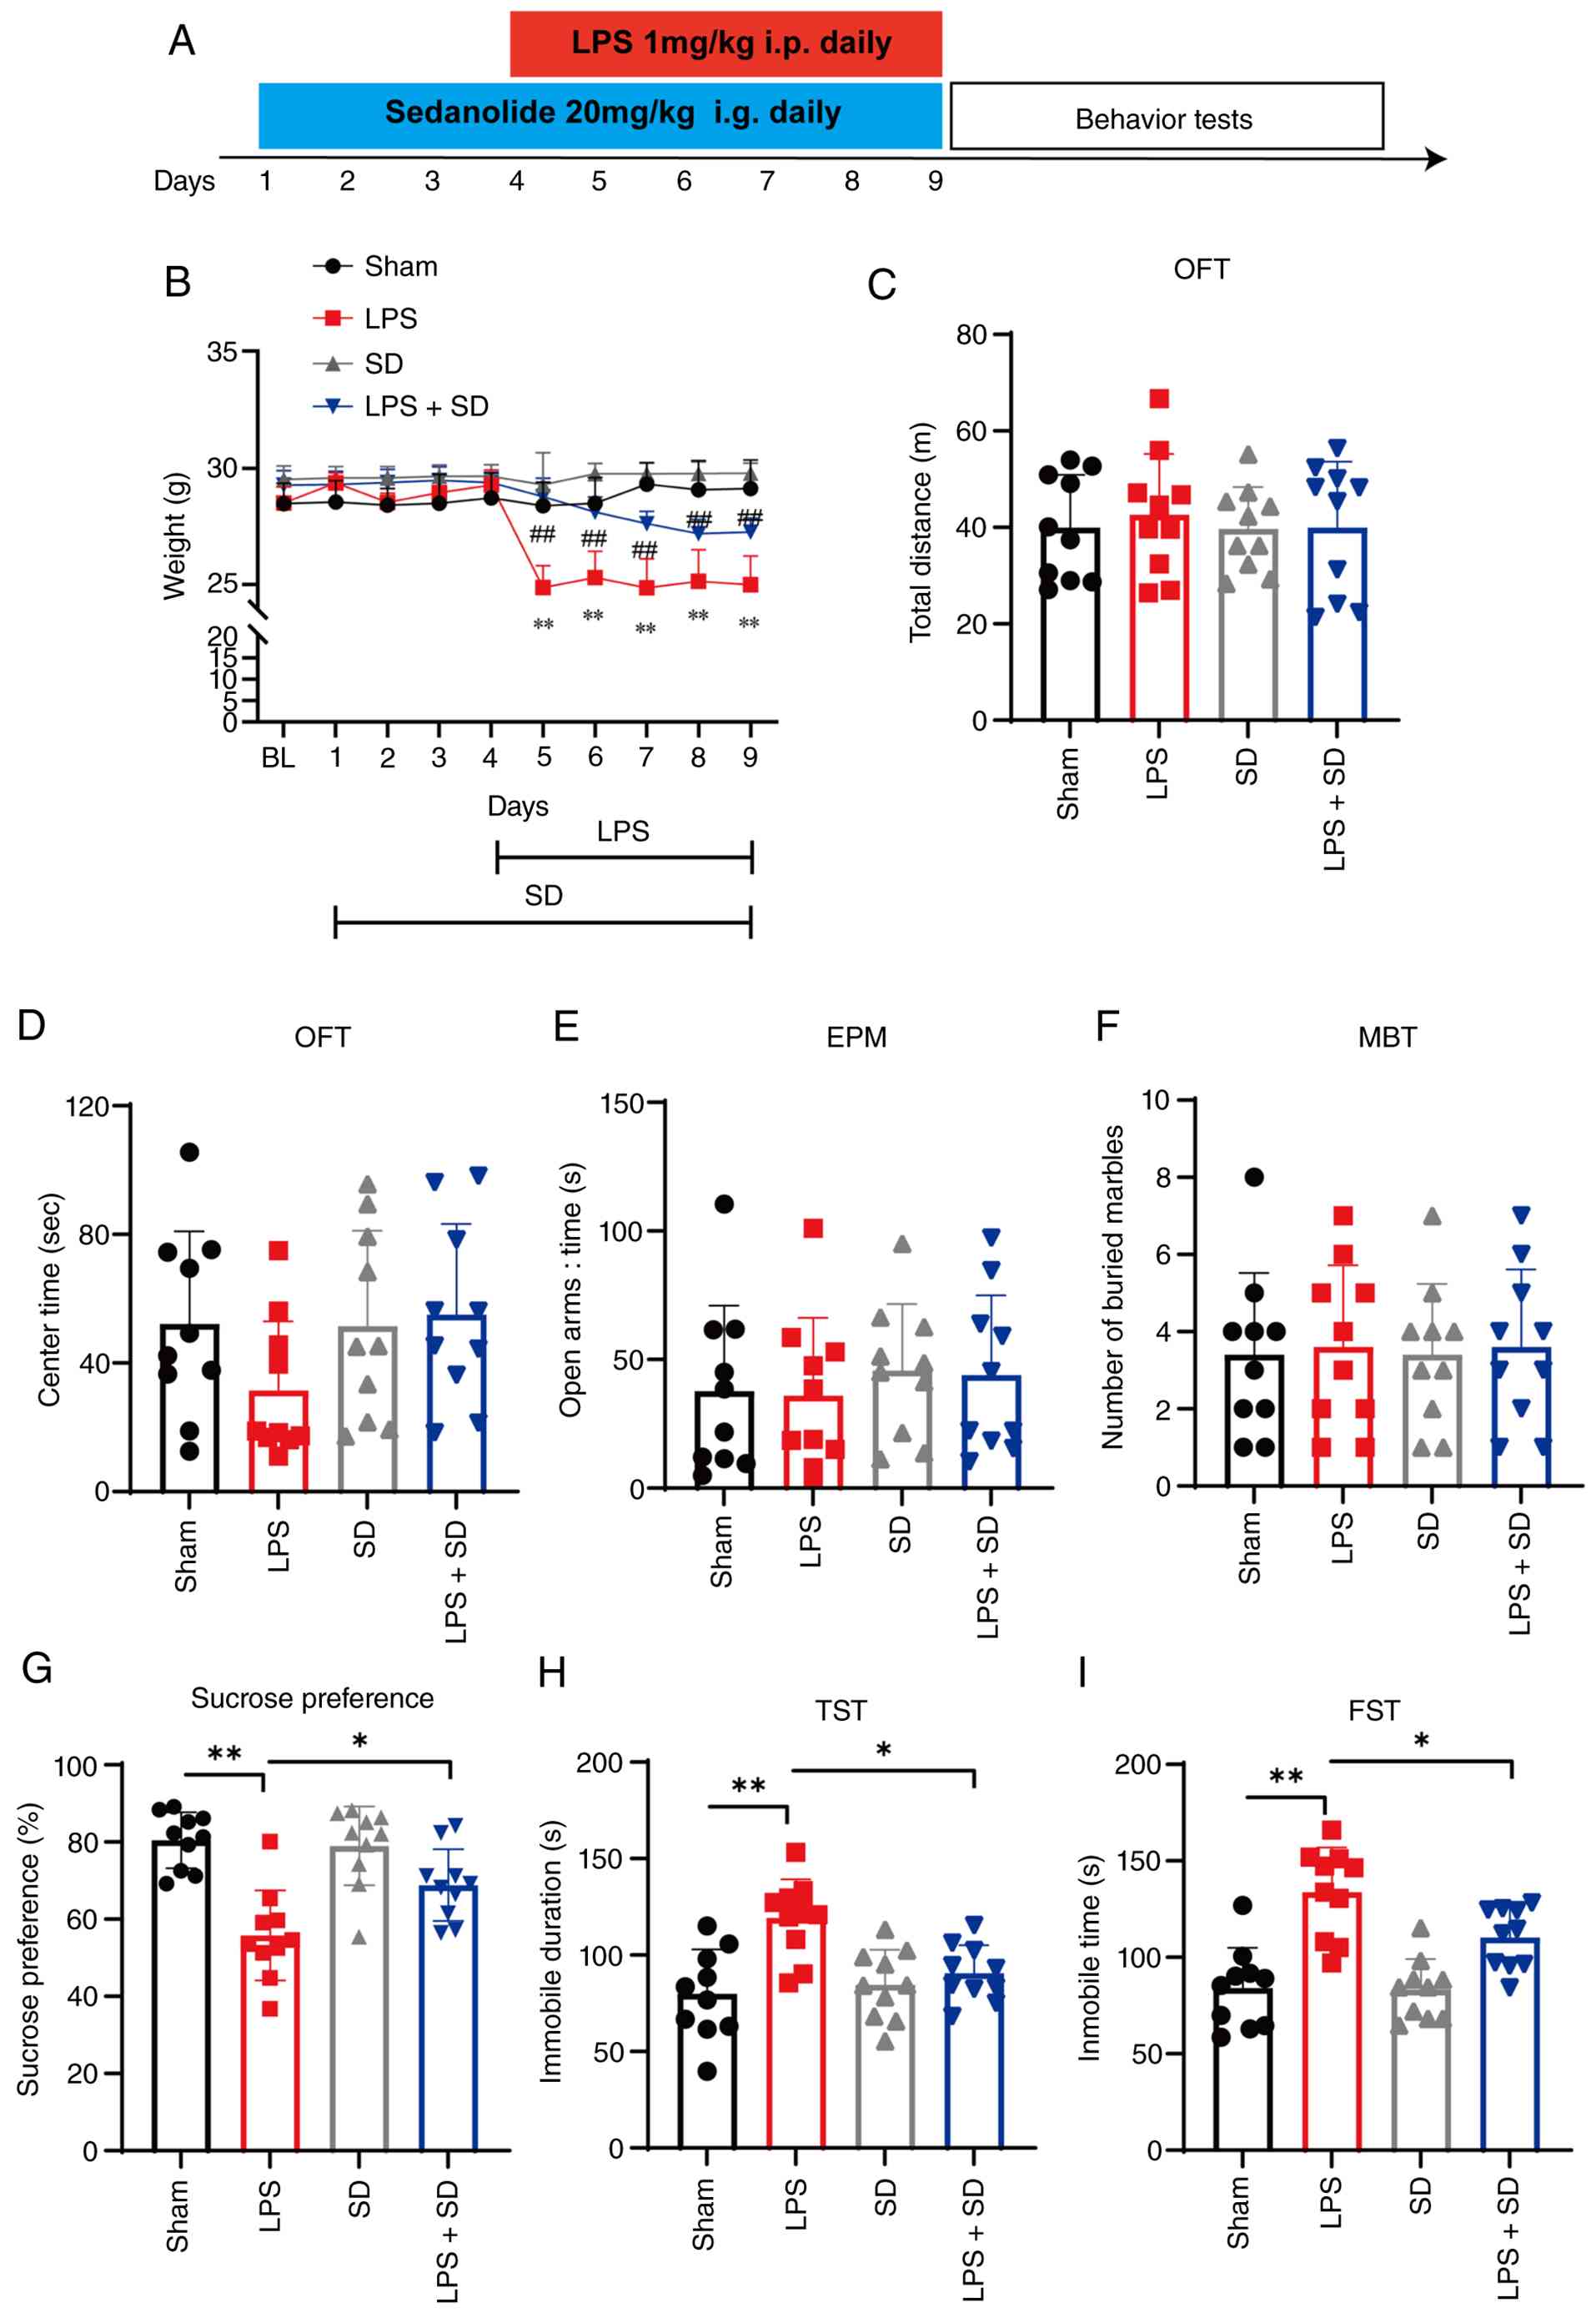 | Figure 1.SD alleviates LPS-induced depressive
disorder. (A) Schematic diagram of the experimental protocol. (B)
Body weight of the LPS mice after SD treatment. Two-way ANOVA and
Tukey's multiple comparisons test (n=10 mice per group). (C) Total
distance traveled of all the mice in the OFT. Ordinary one-way
ANOVA and Tukey's multiple comparisons test (n=10 mice per group).
Sham vs. LPS: P=0.9549; sham vs. SD: P>0.9999; LPS vs. LPS + SD:
P=0.9561. (D) The stay time in the central area of the OFT.
Ordinary one-way ANOVA and Tukey's multiple comparisons test (n=10
mice per group). Sham vs. LPS: P=0.3386; Sham vs. SD P>0.9999;
LPS vs. LPS + SD: P=0.2311. (E) The stay time in the open arms in
the EPM. Ordinary one-way ANOVA and Tukey's multiple comparisons
test (n=10 mice per group). Sham vs. LPS, P=0.9992; sham vs. SD,
P=0.9338; LPS vs. LPS + SD, P=0.9363. (F) The number of buried
marbles in the MBT. Ordinary one-way ANOVA and Tukey's multiple
comparisons test (n=10 mice per group). Sham vs. LPS, P=0.9961;
sham vs. SD, P>0.9999; LPS vs. LPS + SD, P>0.9999. (G) The
sucrose preference in the sucrose preference test. Ordinary one-way
ANOVA and Tukey's multiple comparisons test (n=10 mice per group).
Sham vs. LPS, P<0.0001; sham vs. SD, P=0.9864; LPS vs. LPS + SD,
P<0.0001. (H) The immobile time in the TST. Ordinary one-way
ANOVA and Tukey's multiple comparisons test (n=10 mice per group).
Sham vs. LPS, P=0.0003; sham vs. SD, P=0.9458; LPS vs. LPS + SD,
P=0.0102. (I) The immobile time in the FST. Ordinary one-way ANOVA
and Tukey's multiple comparisons test (n=10 mice per group). Sham
vs. LPS, P<0.0001; sham vs. SD P=0.9998; LPS vs. LPS + SD,
P=0.0452. Data are presented as the mean ± SEM (n=10). *P<0.05
and **P<0.01. Sham vs. LPS: **P<0.01; LPS vs LPS + SD:
##P<0.01 in the (B). SD, sedanolide; LPS,
lipopolysaccharide; OFT, open field test; EPM, elevated plus maze;
FST, forced swimming test; MBT, marble burying test. |
SD releases LPS-induced inflammatory
responses
To evaluate the effects of SD on LPS-induced
neuroinflammation, the mRNA expression levels of the
pro-inflammatory cytokines, tumor necrosis factor α (TNF-α),
interleukin-6 (IL-6) and interleukin-1β (IL-1β) were measured in
the mPFC. RT-qPCR analysis showed that the mRNA levels of TNF-α,
IL-6 and L-1β were significantly increased in the LPS-treated mice
compared with sham mice controls (Fig.
2A). SD treatment led to a substantial reduction of these
inflammatory cytokines in LPS-treated mice (Fig. 2A). To further examine microglial
activation, morphometric analyses of microglia were performed in
the mPFC. The representative images of immunofluorescence of Iba1
were shown in Fig. 2B. LPS-treated
mice exhibited increased soma size and greater maximum branch
length, morphological features indicative of microglial activation.
SD treatment significantly attenuated these changes (Fig. 2C and D). Together, these results
demonstrate that SD suppresses LPS-induced neuroinflammatory
responses and microglial activation in the mPFC.
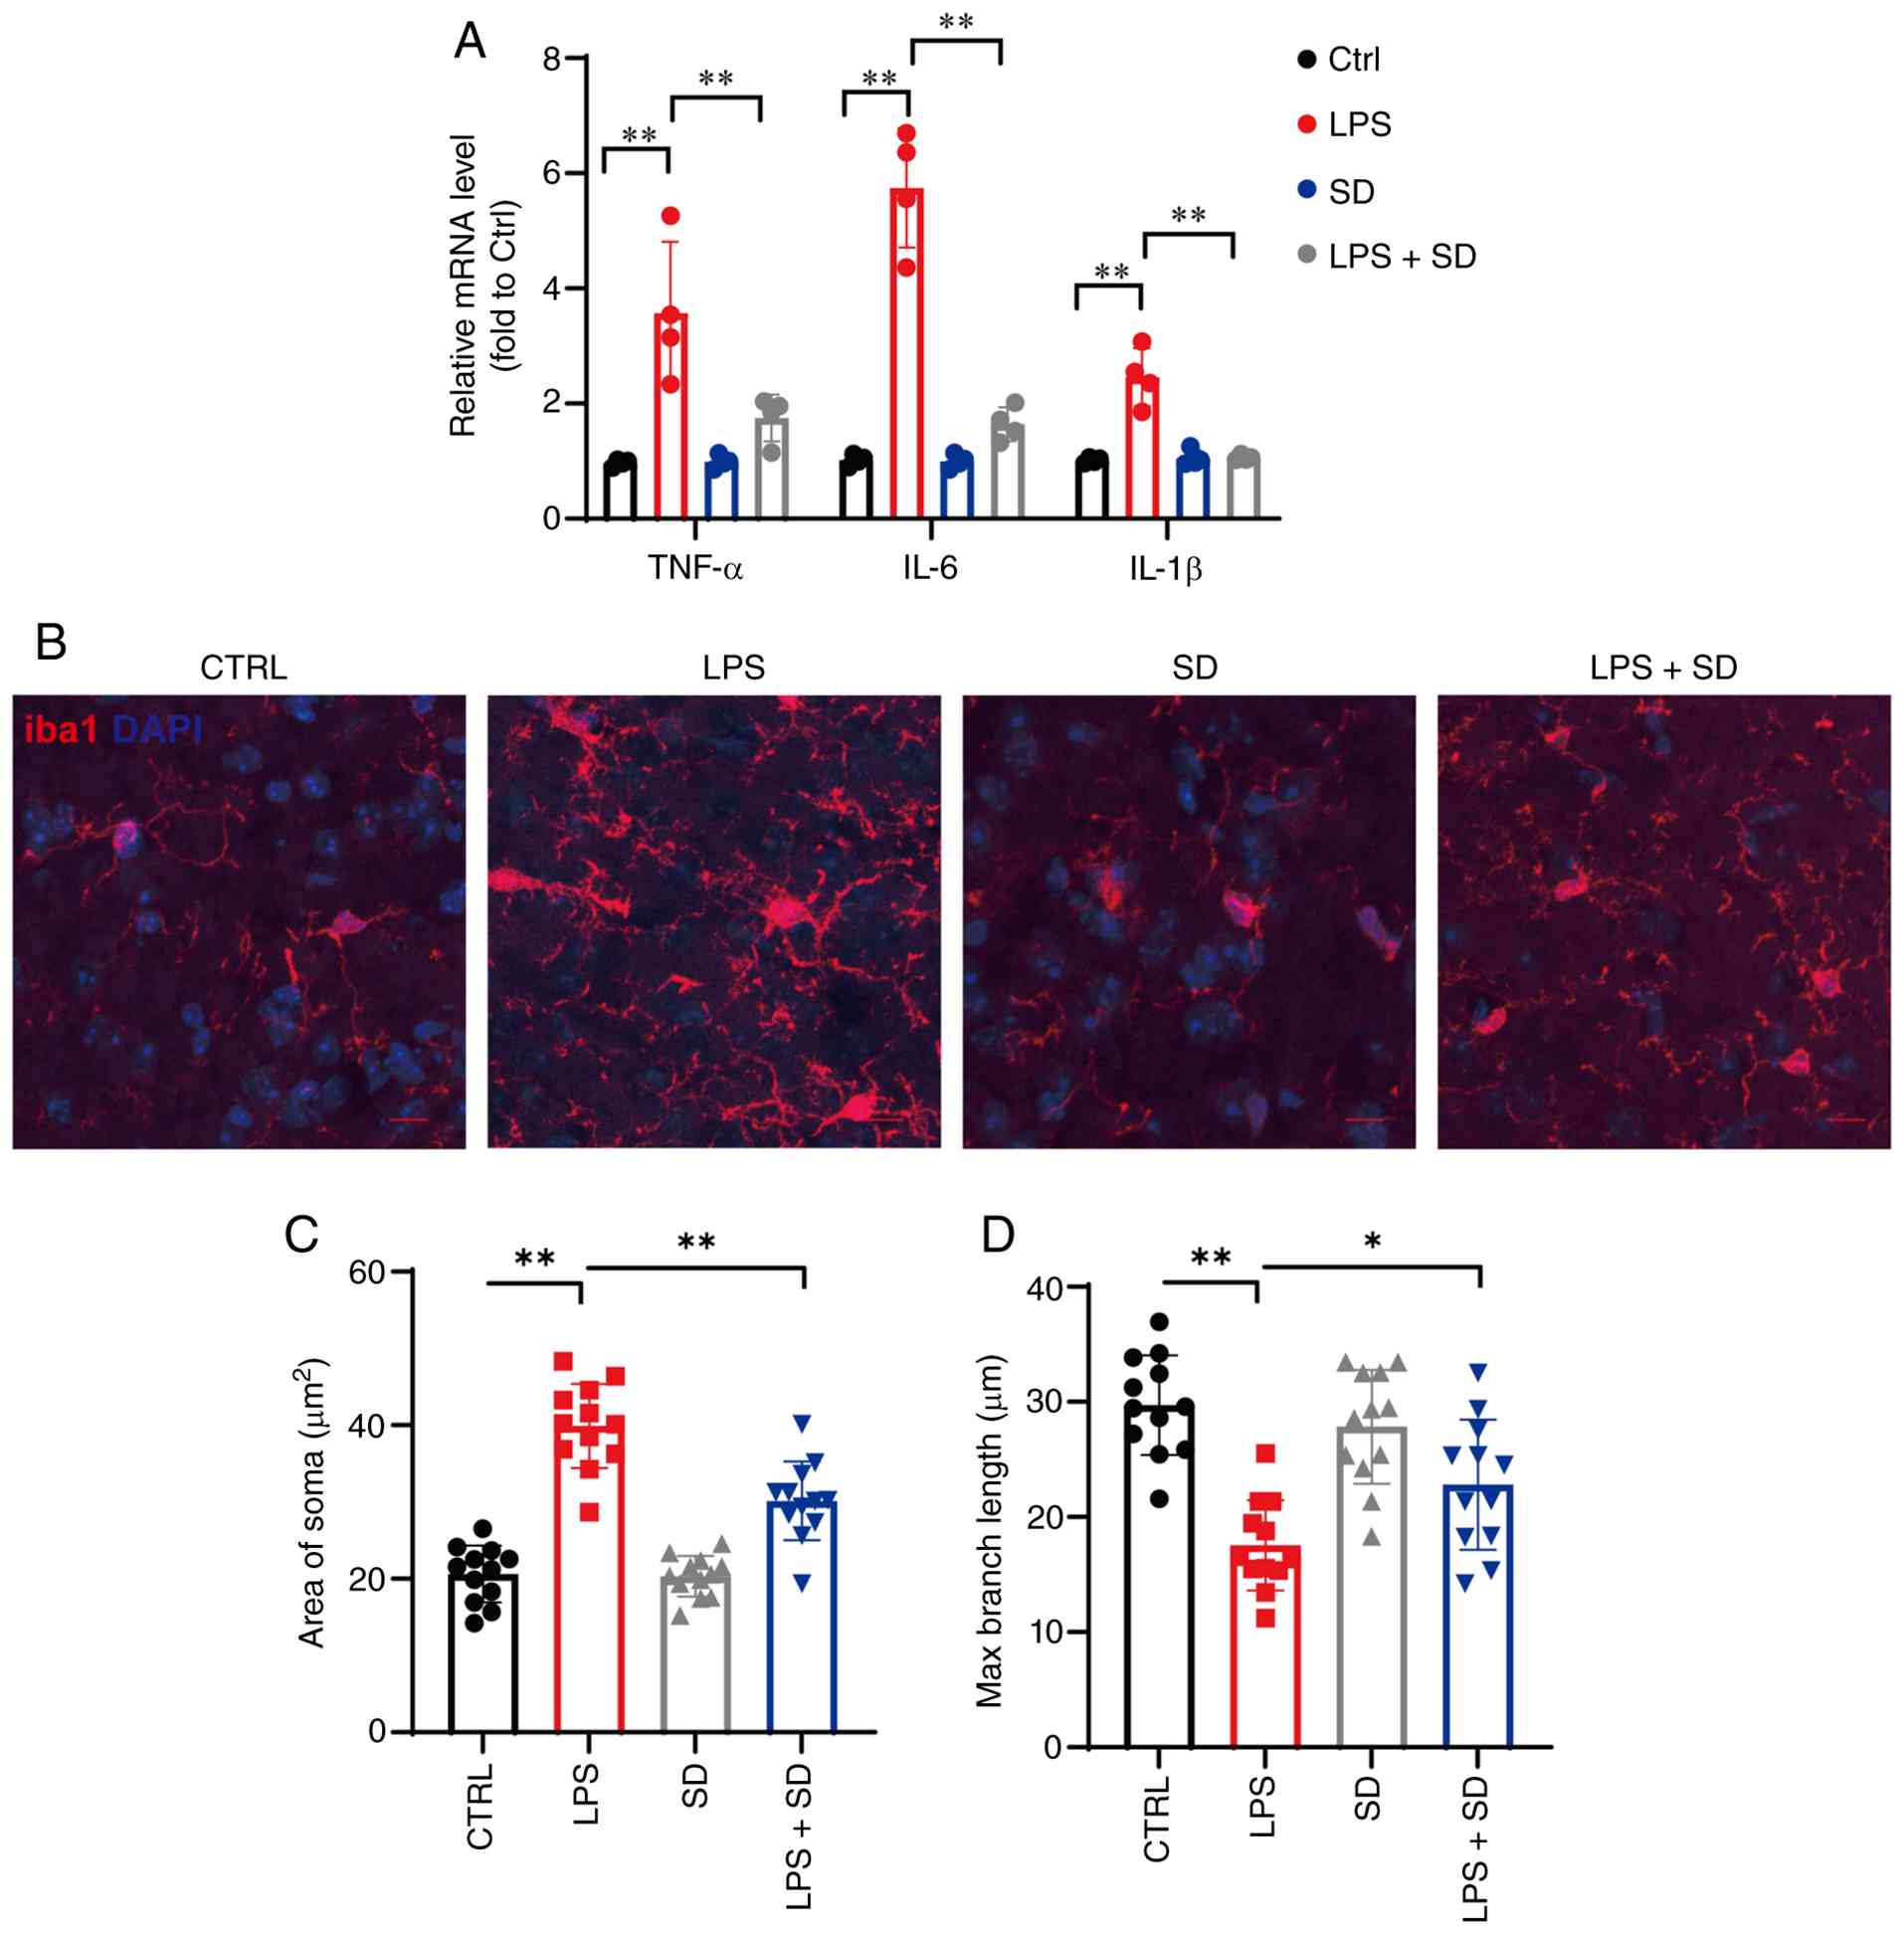 | Figure 2.SD releases LPS-induced inflammatory
responses. (A) The mRNA levels of TNFα, IL-6 and IL-1β after SD
treatment in LPS mice. Two-way ANOVA and Tukey's multiple
comparisons test (n=4 mice per group). Ctrl vs. LPS: TNF-a,
P<0.0001; IL-6, P<0.0001; IL-1β, P=0.0018; LPS vs. LPS + SD:
TNF-a, P<0.0001; IL-6, P<0.0001; IL-1β, P=0.0026. (B)
Representative images of immunofluorescence of Iba1 (red). DAPI
staining represents for nuclear staining (Blue). Sholl analysis of
microglia, (C) Analysis of the area of the soma of microglia.
Ordinary one-way ANOVA and Tukey's multiple comparisons test (n=3)
mice per group. CTRL vs. LPS, P<0.0001; LPS vs. LPS + SD,
P<0.0001. (D) Analysis of the max branch length of microglia.
Ordinary one-way ANOVA and Tukey's multiple comparisons test (n=3
mice per group): CTRL vs. LPS, P<0.0001; LPS vs. LPS + SD,
P=0.0452. More than 30 images were analyzed for each group. Data
are expressed as the mean ± SEM. *P<0.5 and **P<0.01. SD,
sedanolide; LPS, lipopolysaccharide. |
mRNA profile of SD on the LPS-induced
mice
The prefrontal cortex, particularly the mPFC, plays
a critical role in social cognition and socio-emotional processing
(3). To examine the
transcriptional changes associated with the effects of SD on
LPS-induced depressive-like behaviors, high-throughput RNA
sequencing of the mPFC was performed as an unbiased transcriptomic
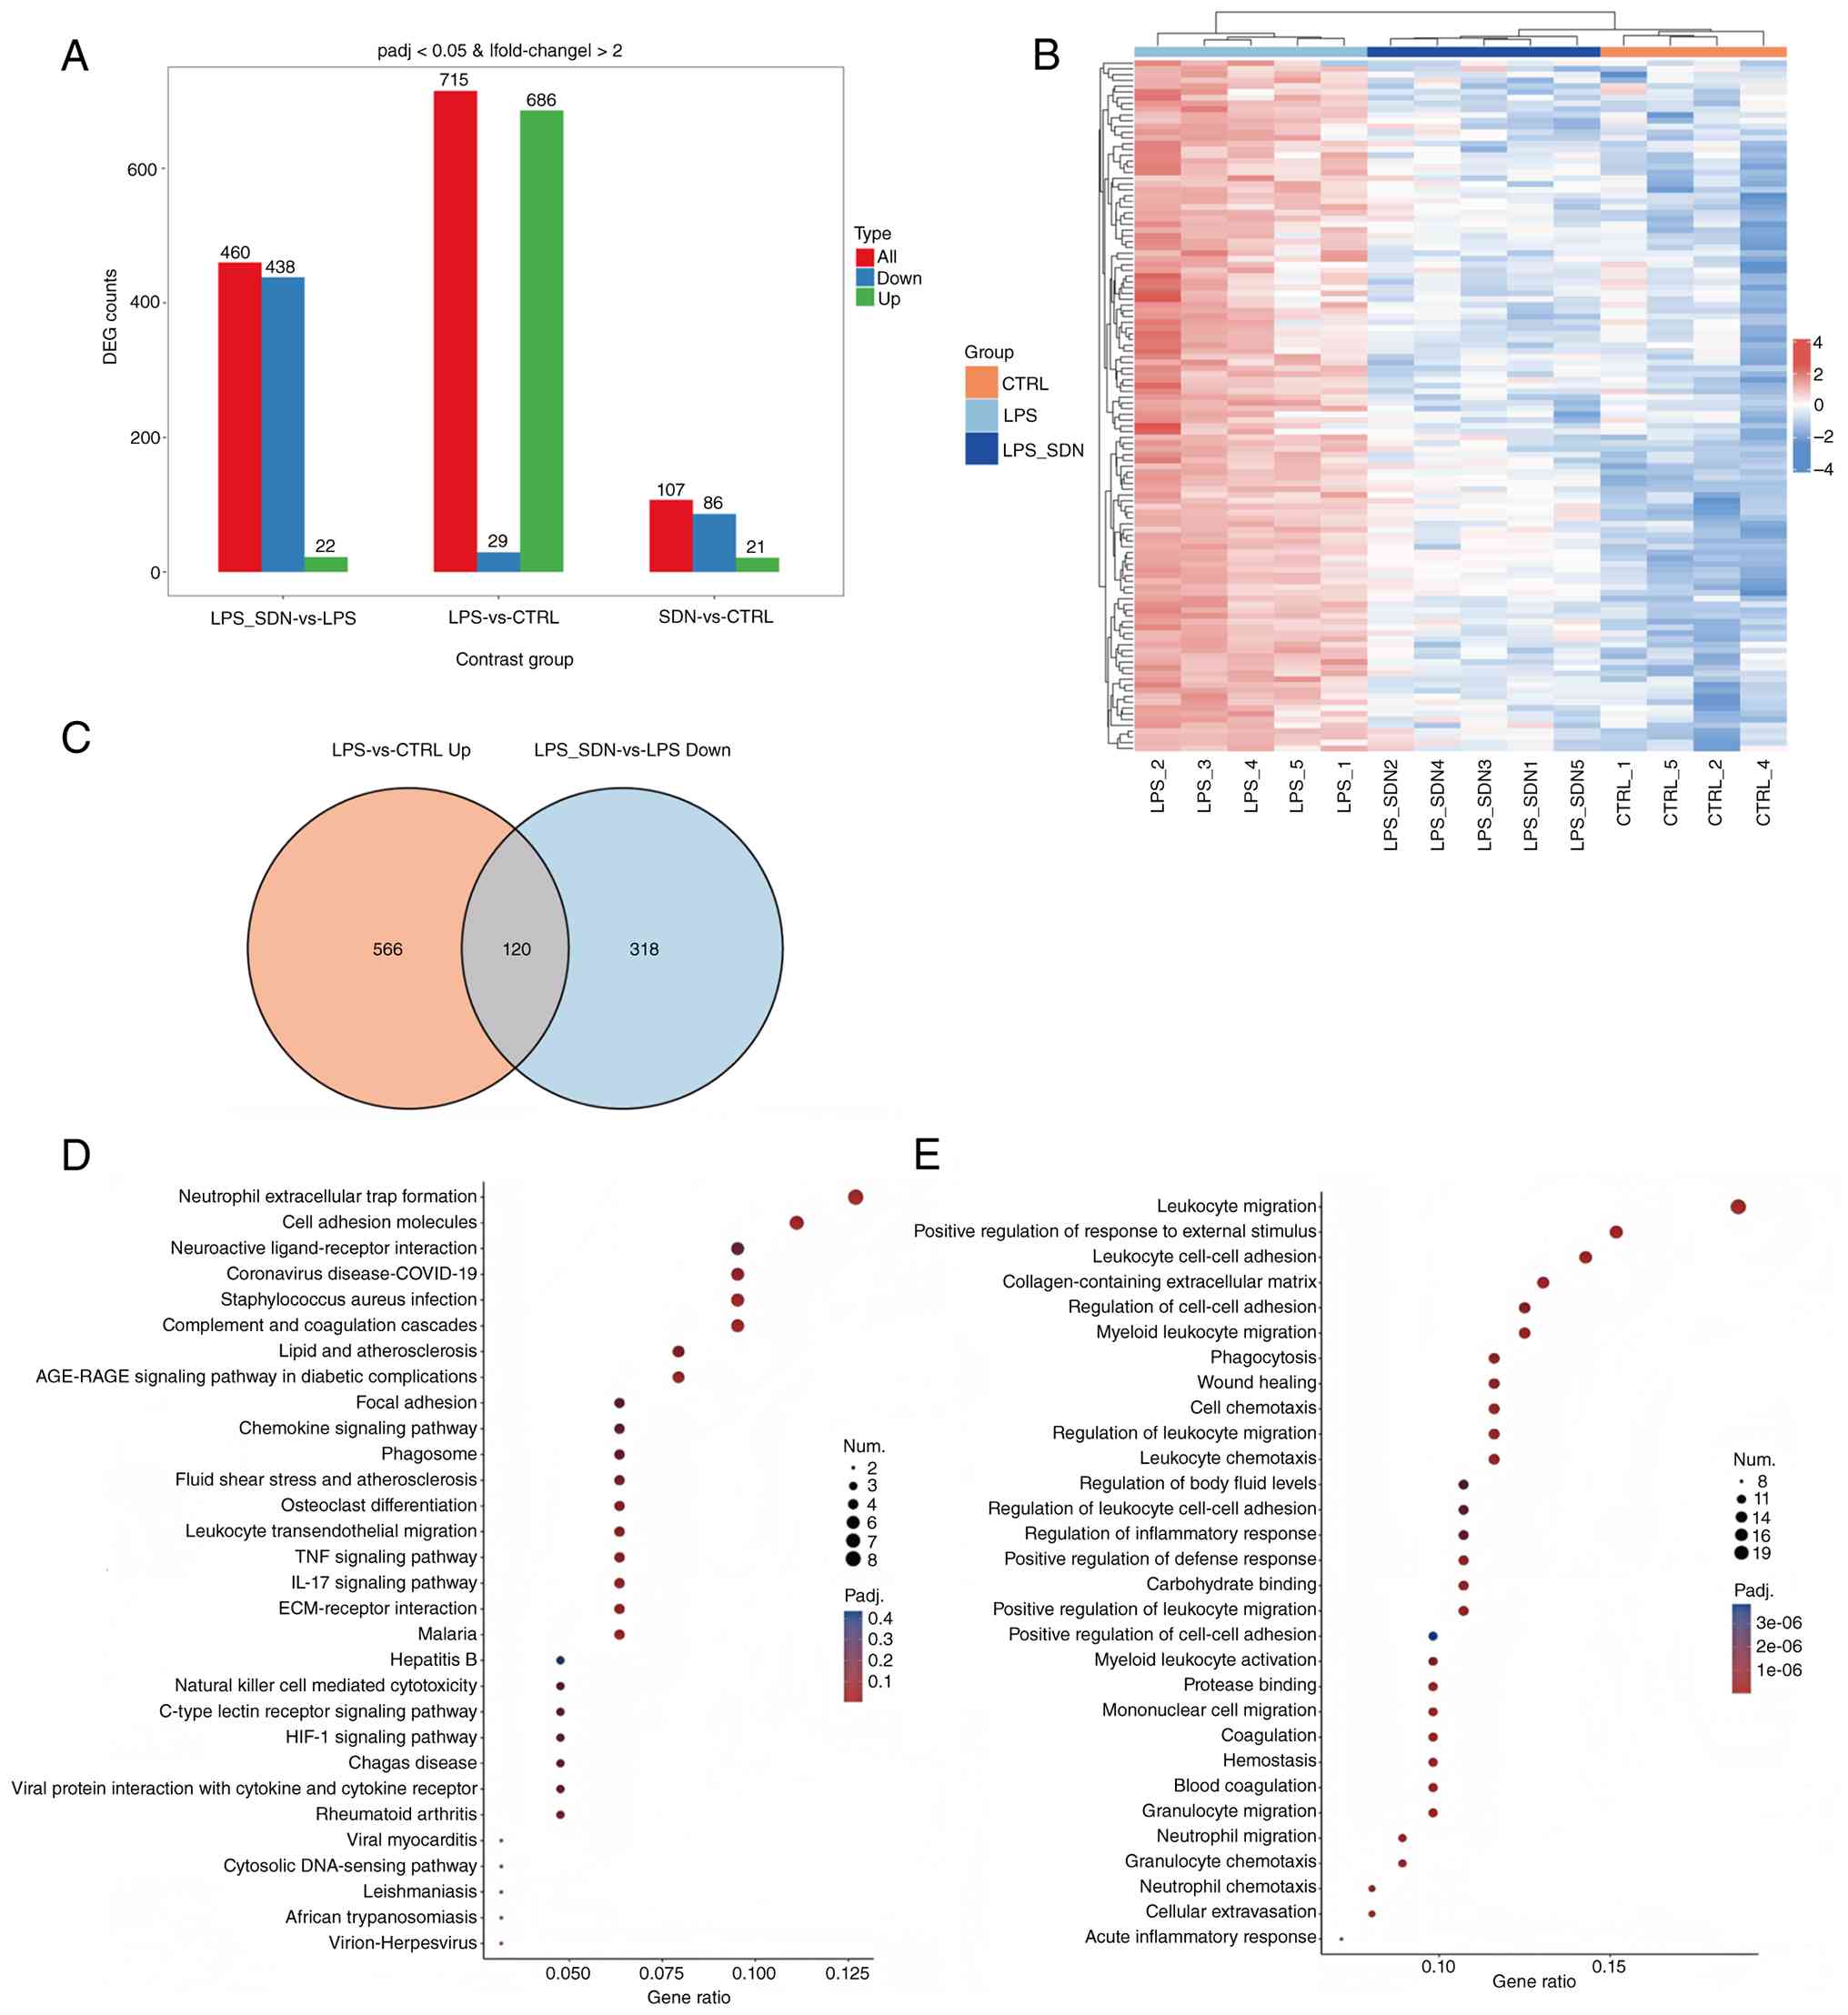
screening approach to identify DEGs. The DEG analysis identified
468 genes that were significantly altered between the LPS + SDN
mice and LPS groups using a cutoff value of a fold change >2.0
and P<0.05. Among these genes, 22 were upregulated and 438 were
downregulated. Compared with the CTRL group, LPS treatment
increased the expression of 686 genes and decreased the expression
of 29 genes in the mPFC. By contrast, comparison of the SDN and
CTRL groups identified 107 altered genes, including 21 upregulated
and 86 downregulated genes (Fig.
3A). The heatmap analysis revealed marked alterations in the
mPFC transcriptomic profile following LPS treatment, whereas SD
largely reversed the LPS-induced upregulation of gene expression
(Fig. 3B). Consistently, the Venn
diagram showed an overlap between genes upregulated in the LPS
versus CTRL comparison and genes downregulated in the LPS + SDN
versus LPS comparison (Fig. 3C).
KEGG pathway enrichment analysis of the 120 overlapping genes
provided preliminary insight into the molecular pathways underlying
the effects of SD on LPS-induced depressive-like behaviors.
Enriched pathways included ‘Neutrophil extracellular trap
formation’, ‘Cell adhesion molecules’, ‘Neuractive ligand-receptor
interaction’ and ‘Coronavirus disease’ (Fig. 3D). GO analysis further indicated
enrichment in biological processes and cellular components related
to ‘Leukocyte migration’, ‘Positive regulation of response to
external stimulus’, ‘Leukocyte cell’, ‘Collagen’ and ‘Regulation of
cell’ (Fig. 3E). These findings
suggest that immune- and inflammation-related pathways contribute
to the protective effects of SD against LPS-induced depressive-like
behaviors.
Elevated C3 and MMP9 are involved in
the effect of SD on the LPS-induced depressive-like behaviors
To further validate the transcriptomic findings, the
10 most significantly altered DEGs among the 120 overlapping genes
identified in the mPFC were examined using RT-qPCR. LPS treatment
significantly increased the mRNA level of LCN2, C3, S100a8, MMP9,
Itgal, Myo1g, Cybb and Fgr. SD treatment significantly reduced the
mRNA levels of LCN2, C3, Itgal and MMP9 in LPS-treated mice
(Fig. 4A). The protein expression
of LCN2, C3, Itgal and MMP9 was next assessed by western blot
analysis. Among these candidates, C3 and MMP9 protein levels were
significantly elevated following LPS administration. SD treatment
effectively suppressed the LPS-induced upregulation of both C3 and
MMP9 (Fig. 4B and C). These
unbiased transcriptomic analyses identified C3 and MMP9 as key
candidate targets associated with the effects of SD.
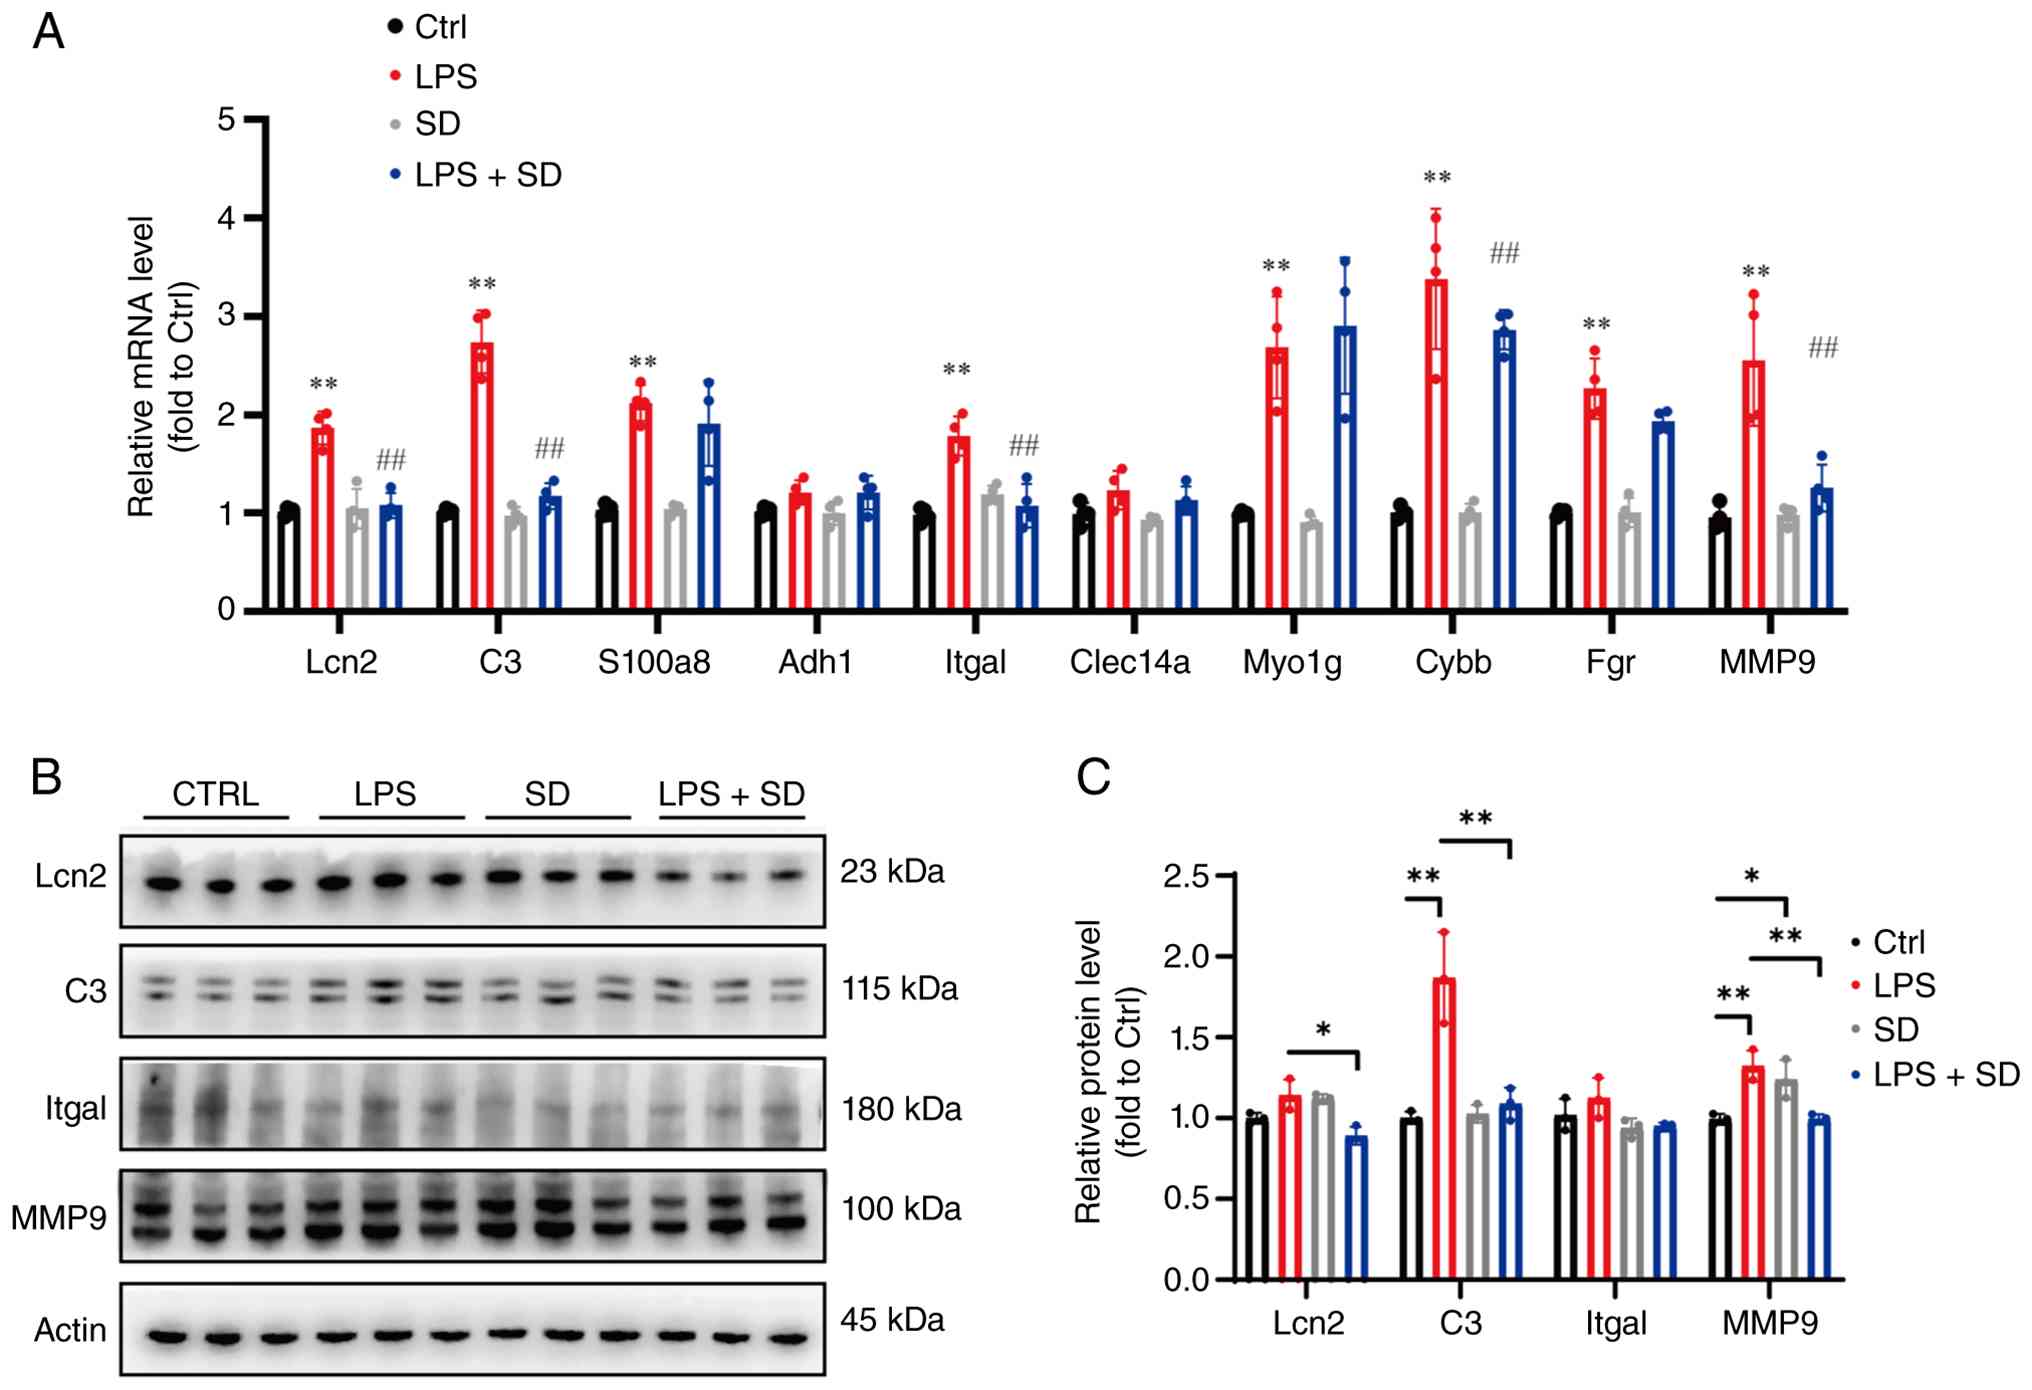 | Figure 4.Validation of the RNA-Seq analysis in
medial prefrontal cortex. (A) The mRNA levels of the top 10
differentially expressed genes in the inner genes. Two-way ANOVA
and Tukey's multiple comparisons test (n=4 mice per group). Ctrl
vs. LPS: **P<0.01; LCN2, P<0.0001; C3, P<0.0001; s100a8,
P<0.0001; Adh1, P=0.7158; Itgal, P=0.0001; Clec14a, P=0.5539;
Myo1g, P<0.0001; Cybb, P<0.0001; Fgr, P<0.0001; and MMP9,
P<0.0001. LPS vs. LPS + SD: ##P<0.01; LCN2,
P=0.0002; C3, P<0.0001; s100a8, P=0.6557; Adh1, P>0.9999;
Itgal, P=0.0009; Clec14a, P=0.9403; Myo1g, P=0.6125; Cybb,
P=0.0267; Fgr, P=0.2757; MMP9, P<0.0001. (B) Representative
bands of western blotting for Lcn2, C3, Itgal and MMP9 in mice
after LPS and SD treatment. (C) Quantitative analysis of the
relative expression of Lcn2, C3, Itgal and MMP9. Two-way ANOVA and
Tukey's multiple comparisons test (n=3 mice per group). Ctrl vs.
LPS: LCN2, P=0.3075; C3, P<0.0001; Itgal, P=0.5615; and MMP9,
P=0.0015. LPS vs. LPS + SD: LCN2, P=0.0197; C3, P<0.0001; Itgal,
P=0.1562; and MMP9, P=0.0016. Data are expressed as the mean ± SEM.
*P<0.05 and **P<0.01. SD, sedanolide; LPS,
lipopolysaccharide. |
The consistent changes observed at both the mRNA and
protein levels further support the involvement of C3 and MMP9 in
the protective actions of SD against LPS-induced pathological
alterations.
Role of SD on inflammation and aerobic
glycolysis in BV-2 cell lines
To further validate the RNA-sequencing results, an
in vitro BV-2 microglial cell model was established and the
effects of LPS and SD treatment were examined. RT-qPCR analysis
indicated that SD significantly attenuated the LPS-induced
upregulation of pro-inflammatory cytokines in the BV-2 cells
(Fig. 5A). Consistent with the
transcriptomic findings, SD also reversed the LPS-induced increases
in C3 and MMP9 expression (Fig. 5B and
C). Glycolysis provides a rapid source of energy to support
microglial proliferation, migration, chemotaxis, and other cellular
functions during inflammatory responses (33). To determine whether SD affects
microglial metabolic reprogramming, the ECAR and OCR in BV-2 cells
were measured following LPS and SD treatment. LPS stimulation
significantly increased basal glycolysis and GR, as reflected by
elevated ECAR values (Fig. 5D and
E). By contrast, LPS significantly reduced basal respiration,
maximal respiration and ATP production, as indicated by OCR
analysis, compared with untreated control cells (Fig. 5F and G). These findings demonstrate
that LPS promotes a metabolic shift toward aerobic glycolysis in
microglia, which is closely associated with inflammatory
activation. Notably, SD significantly suppressed the LPS-induced
increases in basal glycolysis and GR. Moreover, SD restored basal
and maximal OCR and improved ATP production in LPS-treated BV-2
cells (Fig. 5D-G). Together, these
results indicate that SD attenuates LPS-induced inflammatory
activation and metabolic reprogramming in microglia.
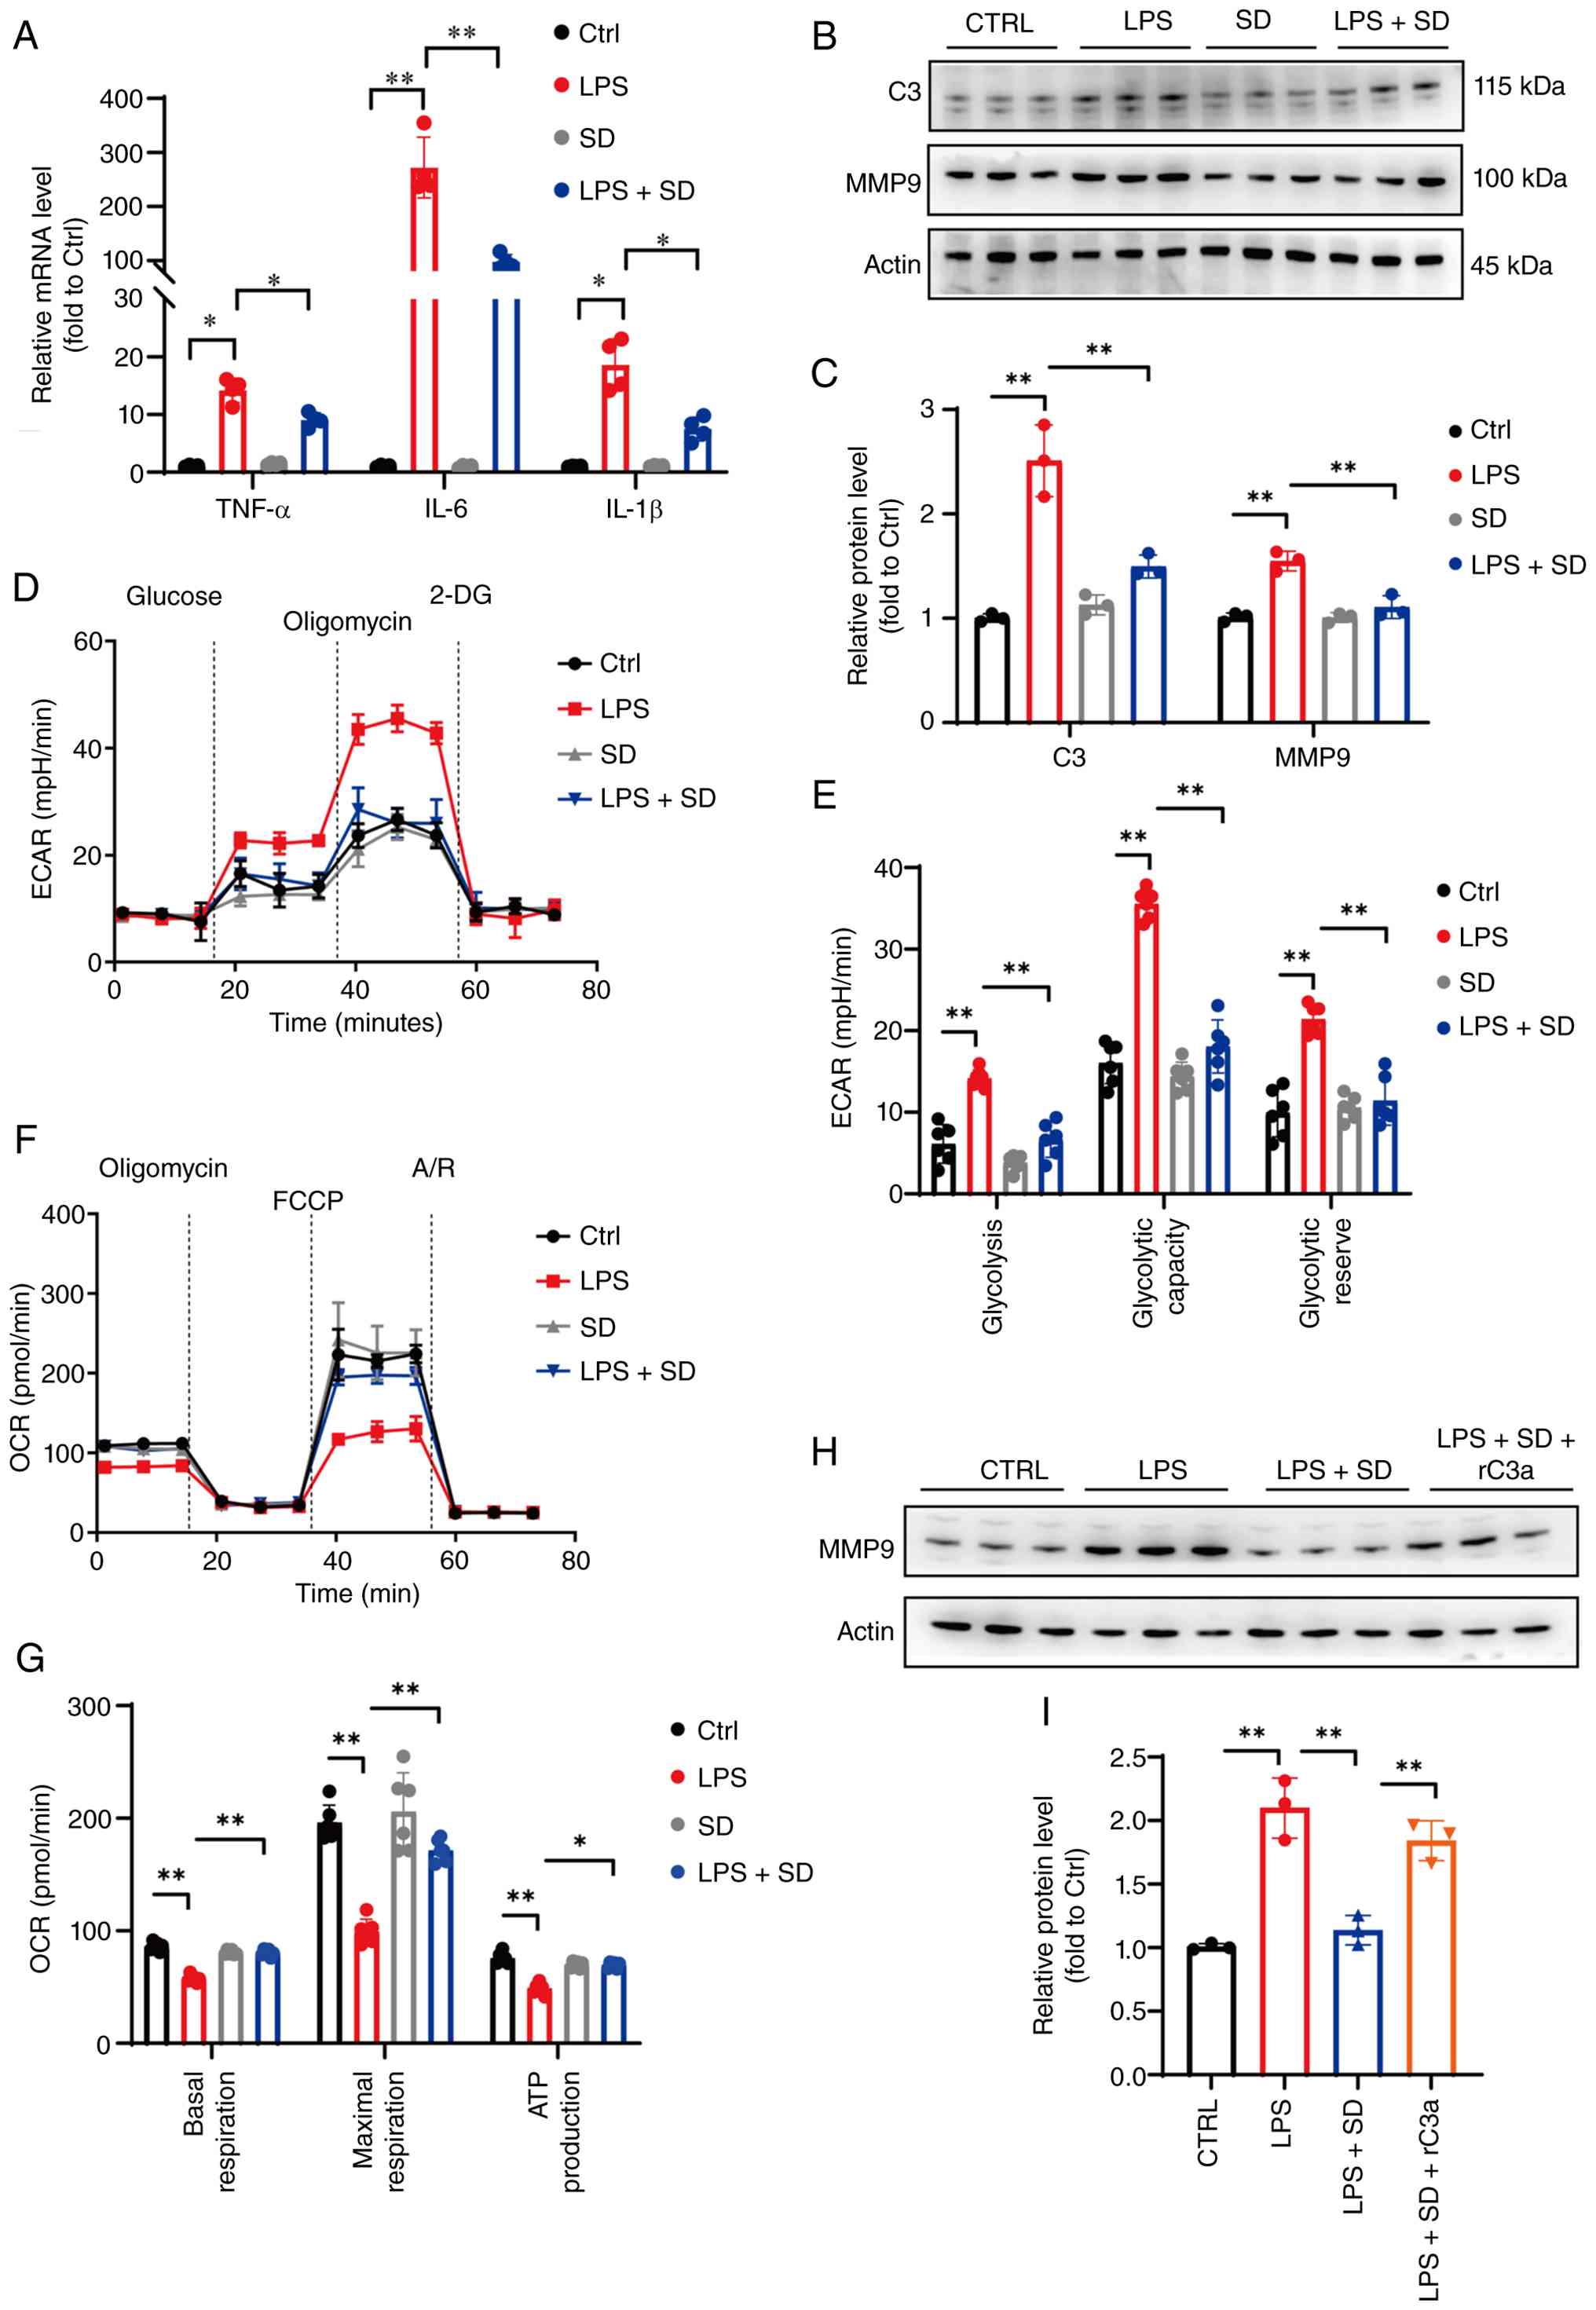 | Figure 5.Effect of SD on Complement C3 and
aerobic glycolysis in the LPS-induced BV2 cell lines. (A) The mRNA
levels of TNFα, IL-6 and IL-1β after LPS and SD treatment in BV-2
cell lines. Two-way ANOVA and Tukey's multiple comparisons test.
Ctrl vs. LPS: TNF-a, P=0.021; IL-6, P<0.0001; and IL-1β,
P=0.045. LPS vs. LPS + SD: TNF-a, P=0.036; IL-6, P<0.0001 and
IL-1β, P=0.042. (B) Representative bands of western blot for C3 and
MMP9 in BV2 cell lines after LPS and SD treatment. (C) Quantitative
analysis of the relative expression of C3 and MMP9 (n=3). Two-way
ANOVA and Tukey's multiple comparisons test, Ctrl vs. LPS: C3,
P<0.0001; MMP9, P=0.0013. LPS vs. LPS + SD: C3, P<0.0001;
MMP9, P=0.0071. (D and E) The experimental program of the ECAR of
BV-2 measured by Seahorse XFe96 Extracellular Flux Analyzer.
Two-way ANOVA and Tukey's multiple comparisons test (n=6 dishes),
Ctrl vs LPS: Glycolysis, P<0.0001; glycolytic capacity,
P<0.0001; GR, P<0.0001. LPS vs. LPS + SD: Glycolysis,
P<0.0001; glycolytic capacity, P<0.0001; GR, P<0.0001. (F
and G) OCR of BV-2 measured by Seahorse XFe96 Extracellular Flux
Analyzer. Ctrl vs LPS: Basal respiration, P=0.0006; maximal
respiration, P<0.0001; ATP production, P=0.017. LPS vs. LPS +
SD: Basal respiration, P=0.0085; maximal respiration, P<0.0001;
ATP production, P=0.0231. (H) Representative bands of western
blotting for MMP9 in Bv2 cell lines after administration of
exogenous active C3a ligand and SD treatment in the LPS challenge.
(I) Quantitative analysis of the relative expression of MMP9 (n=3).
Ordinary one-way ANOVA and Tukey's multiple comparisons test, Ctrl
vs. LPS: P=0.0001. LPS vs. LPS + SD: P=0.0003. LPS + SD vs. LPS +
SD + rC3a: P=0.0023. Data are expressed as the mean ± SEM.
*P<0.5 and **P<0.01. SD, sedanolide; LPS, lipopolysaccharide;
ECAR, extracellular acidification rate; OCR, oxygen consumption
rate; GR, glycolytic reserve; MMP9, matrix metalloproteinase 9. |
To determine whether MMP9 expression is regulated by
upstream complement activation, an in vitro rescue
experiment was performed in BV-2 cells using exogenous recombinant
mouse C3a protein. Western blot analysis showed that SD
significantly suppressed the LPS-induced increase in MMP9
expression. However, treatment with exogenous C3a effectively
reversed this inhibitory effect and restored MMP9 protein
expression despite the presence of SD (Fig. 5H and I). These findings provide
direct evidence that C3a signaling acts upstream of MMP9 and
regulates its expression.
Collectively, the results suggest that the
protective effects of SD on neuroinflammation and microglial
metabolic reprogramming are closely associated with modulation of
the C3a/C3aR signaling pathway and its downstream target, MMP9.
Suppressive effects of SD on C3
expression and C3a generation
To determine whether SD regulates C3 expression or
its downstream activation through proteolytic cleavage, additional
in vitro and in vivo ELISA assays were performed to
quantify C3a levels.
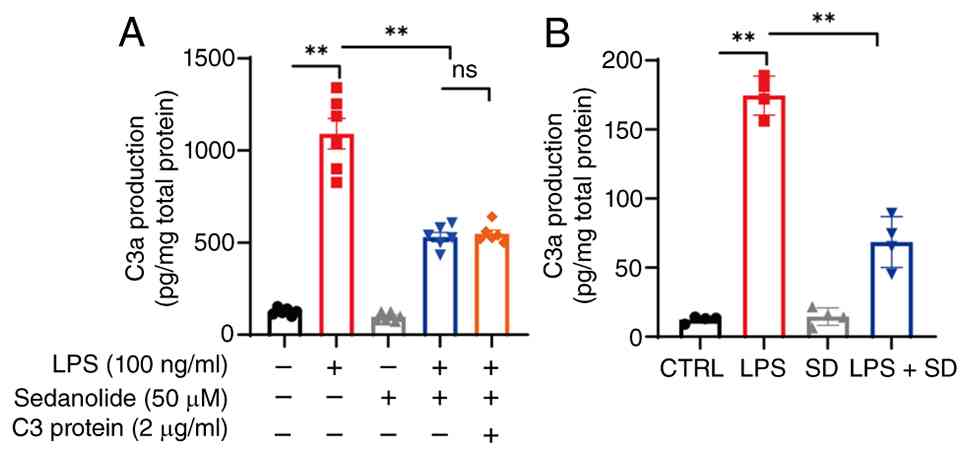
For the in vitro assay, BV-2 cells were
pretreated with SD (50 µM) for 2 h. Recombinant full-length mouse
C3 protein (2 µg/ml) was added to the culture medium 1 h before LPS
stimulation to provide an exogenous C3 substrate. Cells were then
exposed to LPS (100 ng/ml) to activate the complement cascade.
After 24 h, C3a levels in the culture supernatants were measured by
ELISA. LPS stimulation significantly increased C3a production,
indicating enhanced cleavage of C3 into its active fragment. SD
significantly reduced C3a generation in response to LPS.
Importantly, this inhibitory effect persisted even in the presence
of excess exogenous full-length C3 protein, demonstrating that SD
continued to suppress C3a production despite substrate
replenishment (Fig. 6A). These
findings suggest that SD interferes with the activation process of
the complement cascade by inhibiting C3 cleavage rather than simply
reducing endogenous C3 availability.
To validate these findings in vivo, C3a
levels in mPFC tissues from the Ctrl, LPS, SD, and LPS + SD groups
were quantified. ELISA analysis showed that 5 consecutive days of
LPS administration significantly increased C3a levels in the mPFC,
whereas SD treatment significantly attenuated this elevation
(Fig. 6B). When considered
together with the total C3 and MMP9 expression data presented in
Fig. 4, these ELISA results
indicate that SD exerts its protective effects by suppressing both
C3 expression and the subsequent activation of the C3a signaling
pathway.
SD fails to restore LPS-induced
depressive disorder after C3aR inhibitor treatment
Complement activation is centered on complement
component C3 (C3), which undergoes proteolytic processing to
generate several biologically active fragments, including C3a. As
an active complement peptide, C3a exerts antimicrobial effects and
regulates inflammatory responses .SB290157 trifluoroacetate is a
selective antagonist of the C3a receptor (C3aR). Supplementary data
showed that SB290157 alone did not significantly affect sucrose
preference in LPS-treated mice. Similarly, no significant
differences in immobility time during the TST or FST were observed
between the LPS and LPS + SB290157 groups (Fig. S2A-C). According to the
experimental design shown in Fig.
7A, mice received SB290157 trifluoroacetate (30 mg/kg, i.p.)
for two days before SD and LPS administration. SD partially
reversed the body weight loss induced by LPS. However, this
protective effect was abolished following SB290157 treatment
(Fig. 7B). Likewise, no
significant difference in sucrose preference was observed between
the LPS and LPS + SD + SB290157 groups (Fig. 7C). In addition, SD failed to reduce
the LPS-induced increase in immobility time in both the FST and TST
when SB290157 administration occurred (Fig. 7D and E). Western blot assays showed
that SD mitigated the LPS-induced upregulation of C3 and MMP9.
However, this effect was no longer observed in mice treated with
SB290157 (Fig. 7F and G).
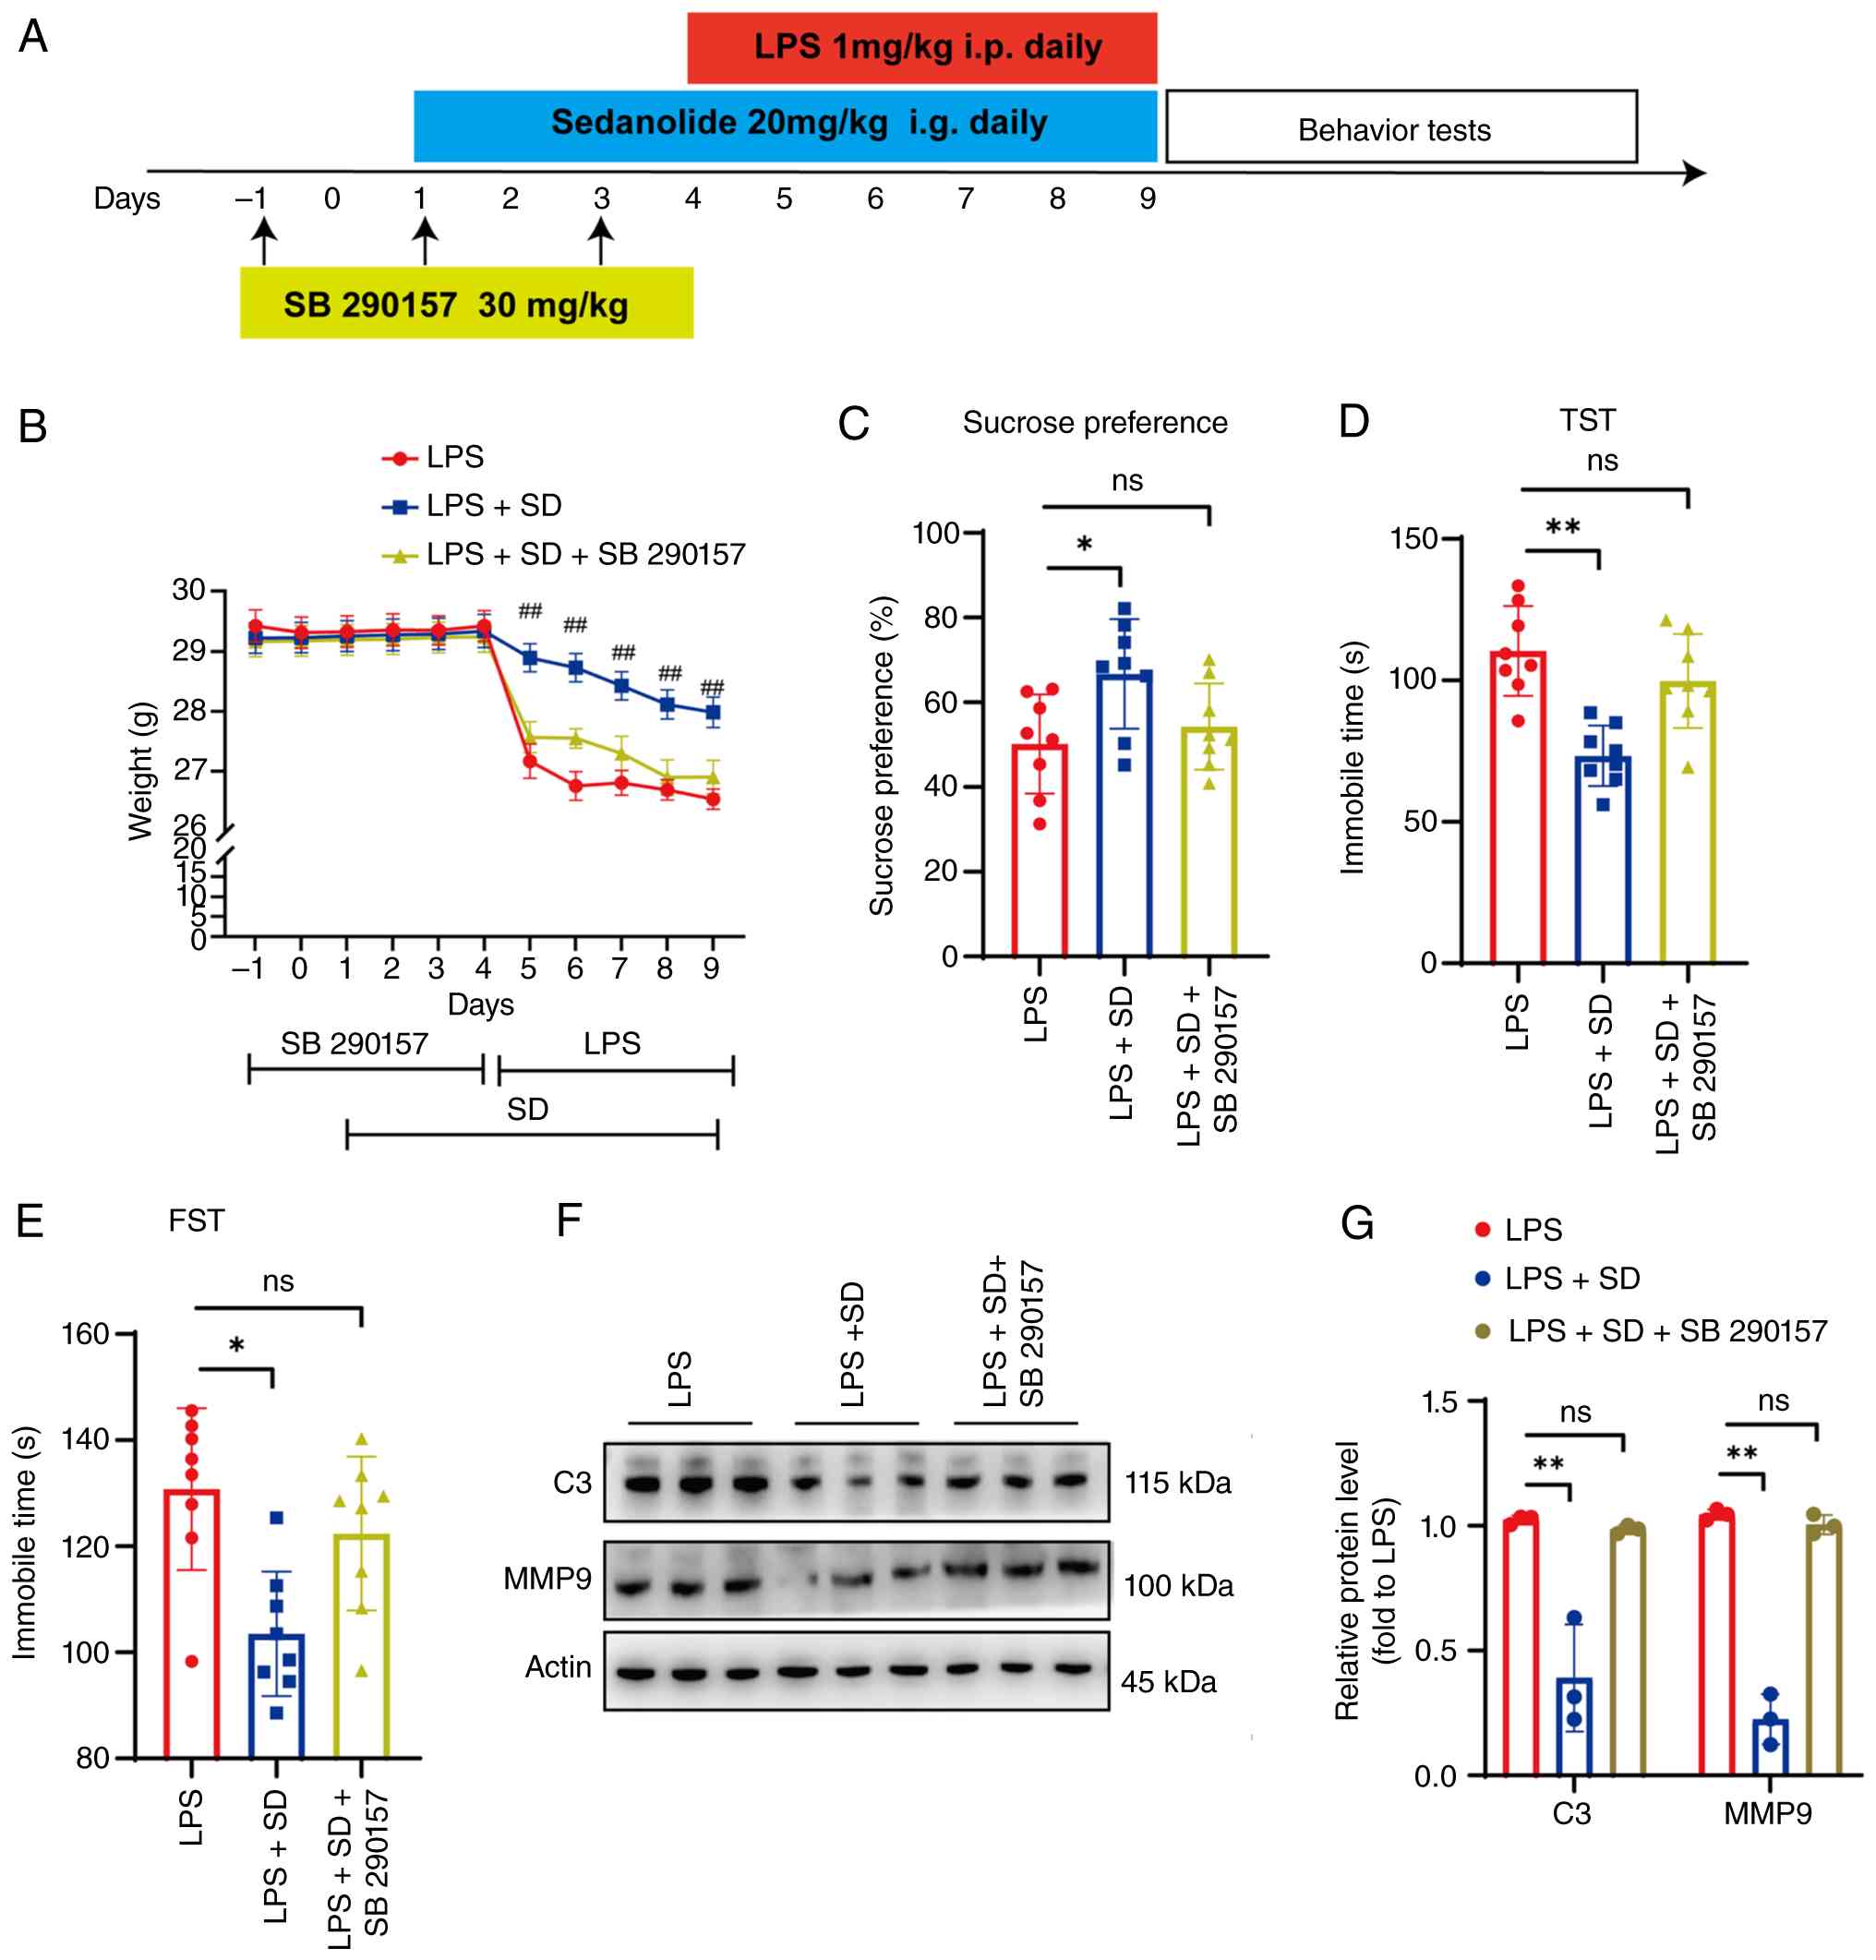 | Figure 7.SD fails to restore LPS-induced
depressive disorder in the injection of a C3a receptor inhibitor.
(A) Schematic diagram of the experimental protocol. (B) Body weight
of the LPS mice after SD and SB 290157 treatment. Two-way ANOVA and
Tukey's multiple comparisons test, LPS vs. LPS + SD: 5,
P<0.0001; 6, P<0.0001; 7, P<0.0001; 8, P=0.0002; 9,
P=0.0002. (C) The sucrose preference in the sucrose preference
test. Ordinary one-way ANOVA and Tukey's multiple comparisons test
(n=8 mice per group). LPS vs. LPS + SD, P=0.0257; LPS + SD vs. LPS
+ SD + SB 290157, P=0.7655. (D) The immobile time in the TST.
Ordinary one-way ANOVA and Tukey's multiple comparisons test (n=8
mice per group): LPS vs. LPS + SD, P=0.0001; LPS + SD vs. LPS + SD
+ SB 290157, P=0.3311. (E) The immobile time in the FST. Ordinary
one-way ANOVA and Tukey's multiple comparisons test (n=8 mice per
group). LPS vs. LPS + SD, P=0.0022; LPS + SD vs. LPS+SD+SB 290157,
P=0.4642. (F) Representative bands of western blotting for C3 and
MMP9 in LPS mice after SD and SB 290157 treatment. (G) Quantitative
analysis of the relative expression of C3 and MMP9. Two-way ANOVA
and Tukey's multiple comparisons test (n=3 mice per group), LPS vs.
LPS + SD: C3, P<0.0001; MMP9, P<0.0001. LPS + SD vs. LPS + SD
+ SB 290157: C3, P=0.8865; MMP9, P=0.8728. Data are presented as
the mean ± SEM. *P<0.5 and **P<0.01. LPS vs. LPS + SD:
##P<0.01. LPS, lipopolysaccharide; SD, sedanolide;
TST, tail suspension test; FST, forced swimming test; ns, not
significant. |
Together, these findings indicate that the
antidepressant-like and anti-inflammatory effects of SD depend on
an intact C3a/C3aR signaling pathway, which acts upstream of MMP9
regulation.
SD partly fails to restore
inflammation and aerobic glycolysis in BV-2 cell lines after C3aR
inhibitor treatment
The effects of SD on inflammation and aerobic
glycolysis were further examined following C3aR inhibition using
the BV-2 cell model. SD significantly reduced the LPS-induced
increase in pro-inflammatory cytokine expression. However, after
treatment with SB290157 trifluoroacetate, SD no longer restored
cytokine levels in LPS-stimulated BV-2 cells (Fig. 8A). Similarly, the inhibitory
effects of SD on the LPS-induced upregulation of C3 and MMP9
expression were abolished following SB290157 administration
(Fig. 8B and C). Metabolic
analysis further showed that SD failed to suppress the LPS-induced
increases in basal glycolysis and GR, as measured by ECAR, in the
presence of SB290157 (Fig. 8D and
E). Likewise, in OCR assays, SD lost its ability to restore
basal respiration and ATP consumption after C3aR inhibition
(Fig. 8F and G). Notably, although
SD partially preserved its effect on maximal oxygen consumption, it
largely failed to reverse LPS-induced inflammatory responses and
metabolic reprogramming following SB290157 treatment.
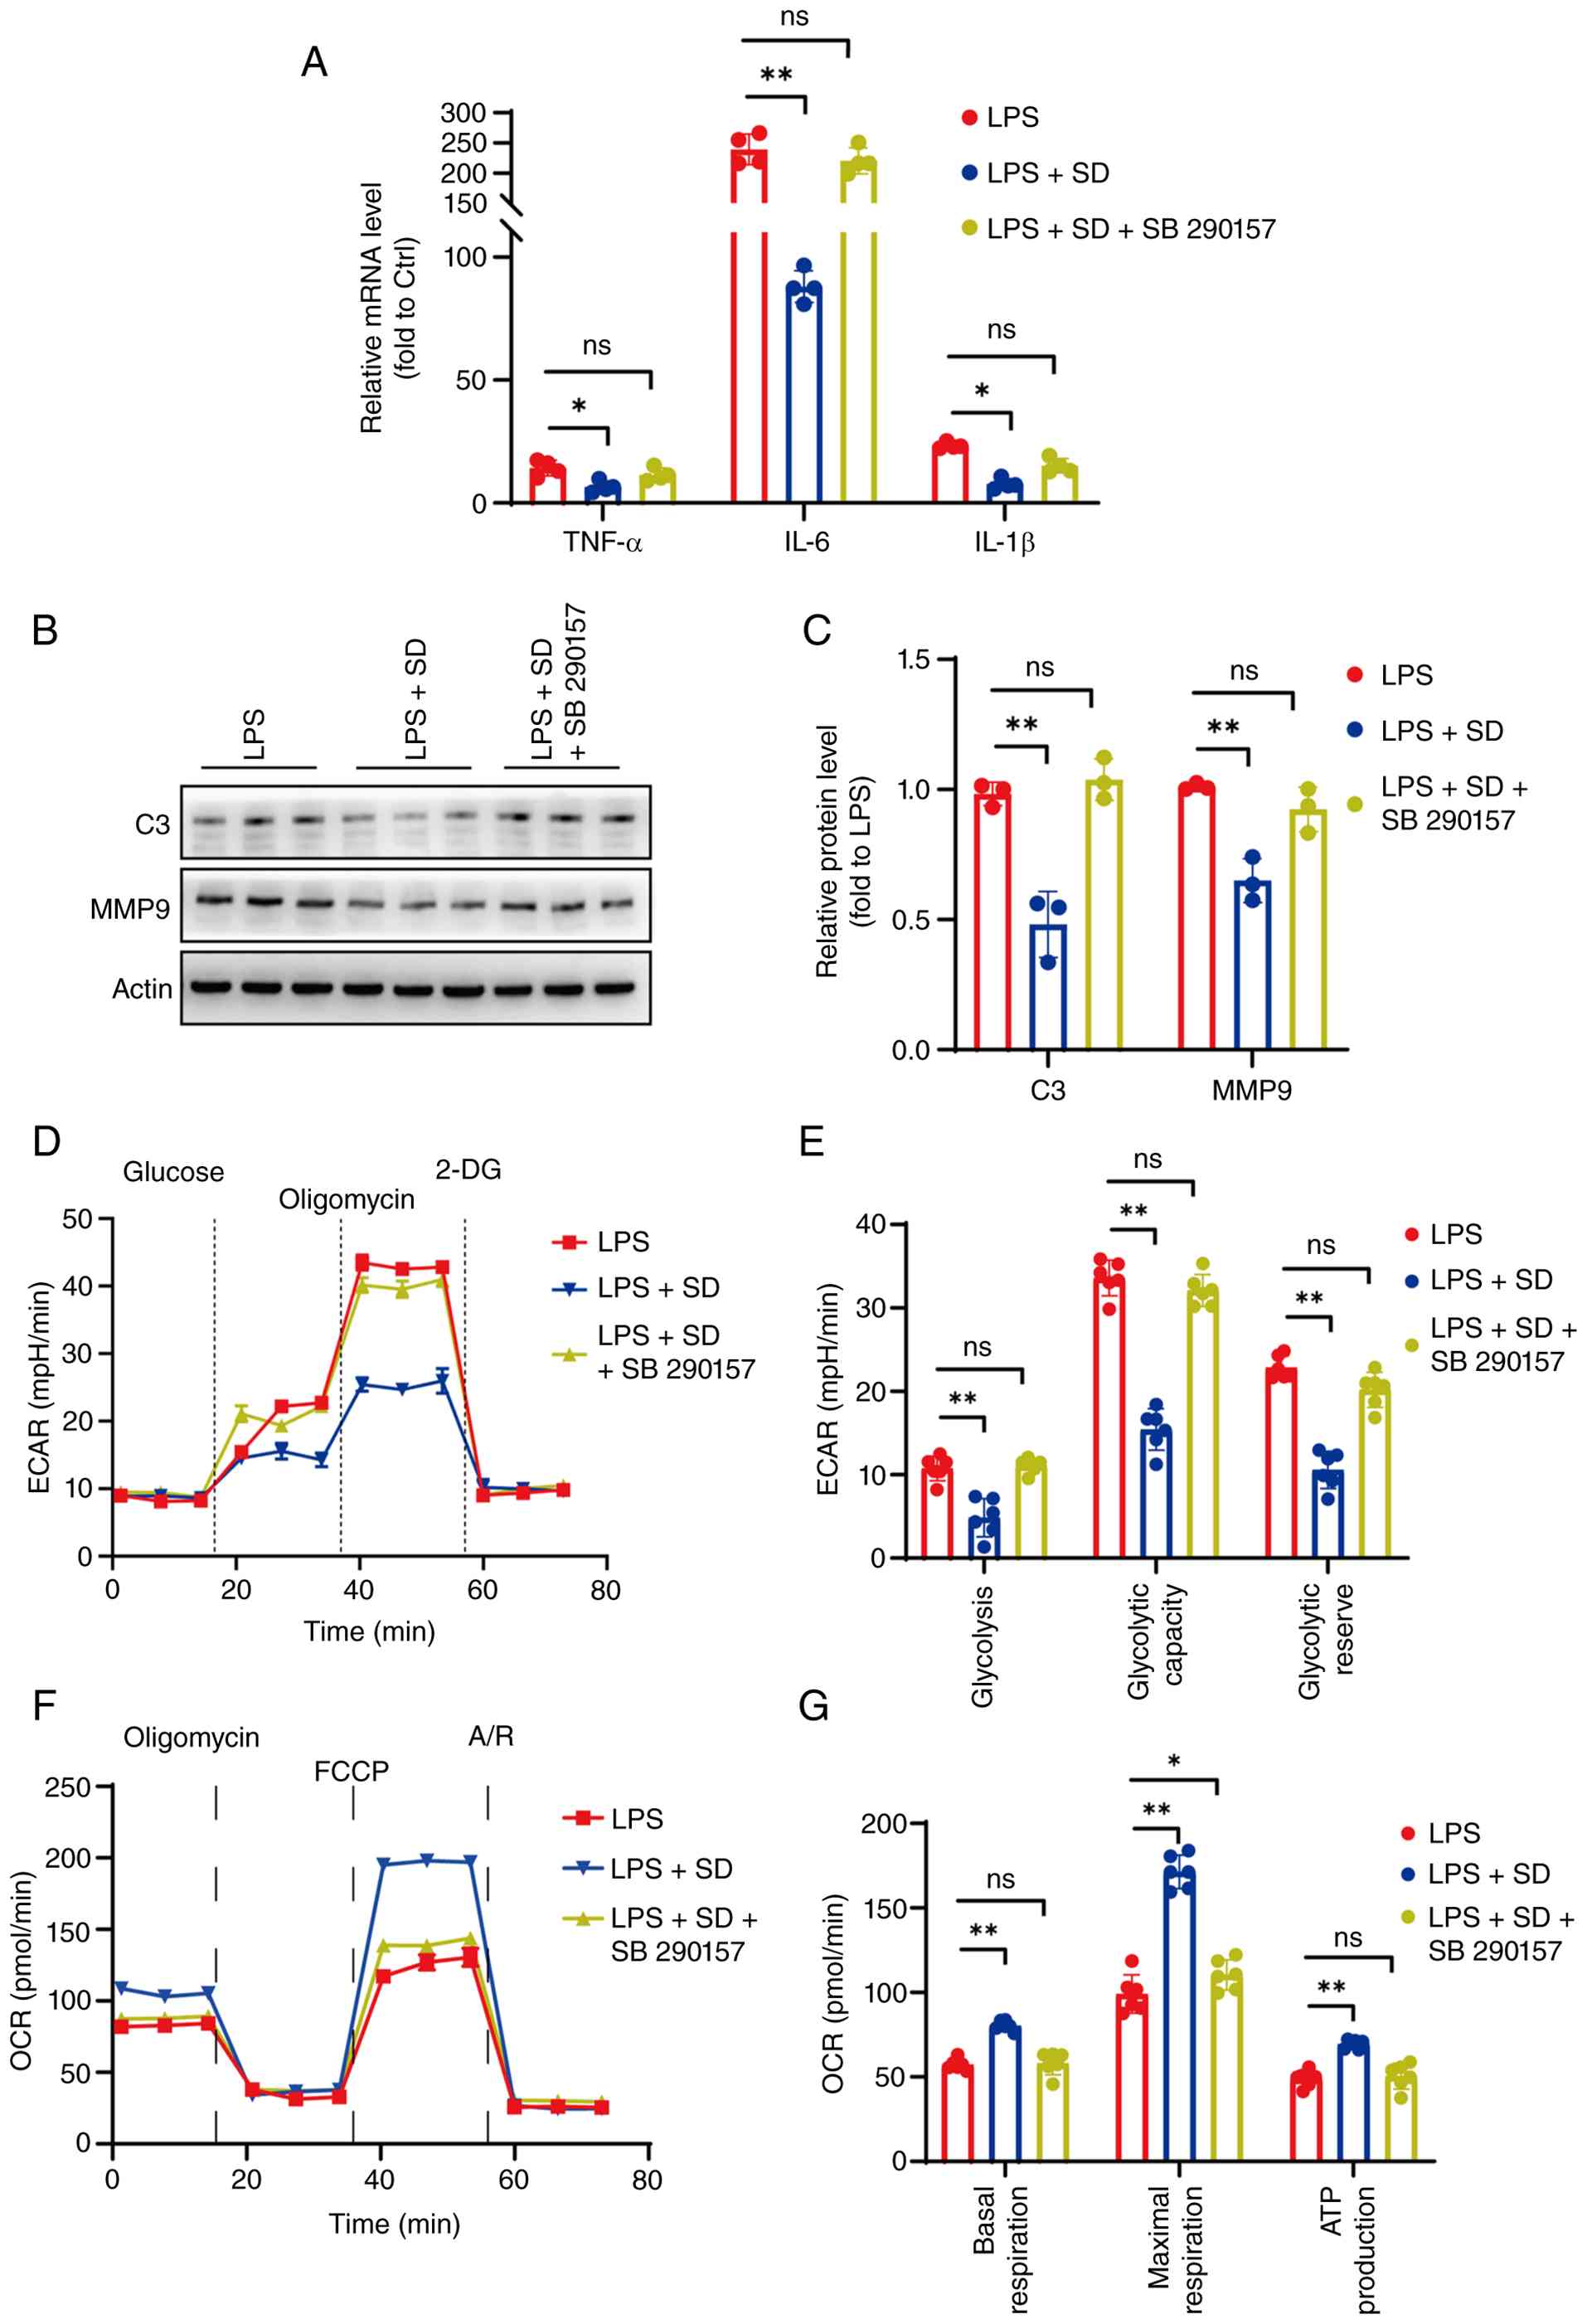 | Figure 8.SD partly fails to restore
inflammation and aerobic glycolysis in BV-2 cell lines after C3aR
inhibitor treatment. (A) The mRNA levels of TNFα, IL-6 and IL-1β
after SD and SB 290157 treatment in LPS-induced BV-2 cell lines.
Two-way ANOVA and Tukey's multiple comparisons test, LPS vs. LPS +
SD: TNF-a, P=0.034; IL-6, P<0.0001; and IL-1β, P=0.041. LPS + SD
vs. LPS + SD + SB 290157: TNF-a, P=0.9388; IL-6, P=0.0736; and
IL-1β, P=0.5727. (B) Representative bands of western blot for C3
and MMP9 after SD and SB 290157 treatment in LPS-induced BV-2 cell
lines. (C) Quantitative analysis of the relative expression of C3
and MMP9 (n=3). Two-way ANOVA and Tukey's multiple comparisons
test, LPS vs. LPS + SD: C3, P<0.0001; MMP9, P=0.0004. LPS + SD
vs. LPS + SD + SB 290157: C3, P=0.6908; MMP9, P=0.4098. (D and E)
The experimental program of the ECAR of BV-2 was measured by
Seahorse XFe96 Extracellular Flux Analyzer. Two-way ANOVA and
Tukey's multiple comparisons test (n=6 dishes), LPS vs. LPS + SD:
Glycolysis, P<0.0001; glycolytic capacity, P<0.0001; GR,
P<0.0001. LPS + SD vs. LPS + SD + SB 290157: Glycolysis,
P=0.9526; glycolytic capacity, P=0.3825; GR, P=0.0556. (F and G)
OCR of BV-2 measured by Seahorse XFe96 Extracellular Flux Analyzer.
LPS vs. LPS + SD: Basal respiration, P=0.0006; Maximal respiration,
P<0.0001; ATP production, P=0.017. LPS + SD vs. LPS + SD + SB
290157: Basal respiration, P=0.9748; Maximal respiration, P=0.0233;
ATP production, P=0.9301. Data are expressed as the mean ± SEM.
*P<0.5 and **P<0.01. LPS, lipopolysaccharide; SD, sedanolide;
ECAR, extracellular acidification rate; OCR, oxygen consumption
rate; GR, glycolytic reserve; ns, not significant. |
These findings further demonstrate that the
anti-inflammatory and anti-glycolytic effects of SD under LPS
stimulation are predominantly mediated through the C3a/C3aR
signaling pathway.
Discussion
In the present study, it was demonstrated that SD
significantly alleviates LPS-induced depressive-like behaviors by
suppressing neuroinflammation and microglial activation in the
mPFC. Mechanistically, SD inhibited complement activation by
reducing the proteolytic cleavage of C3 into the active fragment
C3a, thereby attenuating abnormal microglial aerobic glycolysis.
Furthermore, pharmacological blockade of C3aR abolished the
protective effects of SD on behavioral deficits, inflammatory
responses and metabolic reprogramming. Collectively, these findings
indicate that the antidepressant-like effects of SD are mediated
through the C3a/C3aR signaling pathway and support its potential as
a therapeutic candidate for neuroinflammation-associated depressive
disorders.
SD is a naturally occurring phthalide compound
isolated from the seed oil of plants belonging to the Umbelliferae
family. Owing to its unique biological properties and potential
therapeutic value, SD has attracted considerable research interest
in recent decades. Previous studies have demonstrated that SD
possesses a wide range of pharmacological activities, including
anti-inflammatory, hepatoprotective, antitumor and cardioprotective
effects against myocardial injury (34). Its antitumor activity has been
attributed to multiple mechanisms, including the regulation of
cellular autophagy and enhancement of antioxidant defenses.
Notably, SD has been shown to increase cellular resistance to
oxidative stress through activation of the Kelch-like
ECH-associated protein 1 (KEAP1)-NFE2L2 signaling pathway (35). In addition, SD exerts
anti-inflammatory effects by suppressing inflammatory signaling
pathways, modulating downstream proteins expression, and
interfering with the activity of several inflammation-related
targets, including COX-2, ERK2, PKC, PI3Kα, PI3Kγ, JAK1, JAK2,
JAK3, IKK β and TNF α (36).
In the present study, it was demonstrated that SD
significantly alleviates LPS-induced depressive-like behavior. In
studies using systemic LPS-induced depression models, it is
important to distinguish true antidepressant-like effects from
nonspecific improvements in sickness-related behaviors, such as
malaise, weight loss, reduced activity, or physical exhaustion. In
the present study, neither repeated LPS administration nor SD
treatment significantly affected total locomotor activity in the
OFT. This essential baseline validation shows that the mice
retained fully intact voluntary locomotor capacity at the time of
evaluation. Therefore, the prolonged immobility in the TST and FST,
together with the anhedonic behavior in the SPT, truly reflects
psychological behavioral despair and emotional deficits rather than
debilitating physical fatigue (Fig. 1G
and H). By selectively reversing these core emotional and
motivational deficits while leaving basal movement unchanged, SD
demonstrates a specific and genuine antidepressant-like therapeutic
profile.
Intriguingly, although SD strongly corrected
depression-related indexes, it did not produce noticeable changes
in anxiety-related parameters, as shown by the unchanged center
stay time in the OFT and the open-arm exploration time in the EPM.
This clear phenotypic dissociation was attributed to the
chronological design and circuit specificity of the present
paradigm. Because the depressive-like phenotypic deficits
represented the most reliable and prominent readouts in this model,
mechanistic investigation focused on how SD alleviates
depression-related neuroinflammation and metabolic reprogramming
through the C3a/C3aR axis. Whether SD also has anti-anxiety
efficacy in a dedicated anxiety-dominant paradigm remains to be
determined.
The complement system can be activated through the
classical, lectin, or alternative pathways. These pathways converge
at complement C3, a central mediator of the complement cascade,
which is cleaved into two biologically active fragments: C3a, a
potent anaphylatoxin, and C3b, which promotes further complement
activation (8). Following its
release, C3a acts as a chemoattractant and binds to the C3aR
expressed on various cell types, including microglia. C3aR is a G
protein-coupled receptor that undergoes conformational changes upon
ligand binding, leading to activation of intracellular G proteins,
primarily the Gαi and Gαq subunits (37). Activation of C3aR initiates several
downstream signaling pathways, including the phospholipase C,
MAPK/ERK, PI3K/Akt and NF-κB pathways (38). Through coordinated signaling
involving PKC and PI3K, NF-κB becomes activated and translocates
from the cytoplasm to the nucleus (39). Nuclear NF-κB subsequently binds to
regulatory regions within the MMP9 promoter, thereby promoting MMP9
transcription and protein synthesis.
Cells initially synthesize MMP9 as an inactive
zymogen, pro-MMP9, which undergoes extracellular proteolytic
processing by enzymes such as plasmin or activated MMPs to generate
enzymatically active MMP9. To delineate the molecular sequence
underlying the effects of SD, complementary biochemical analyses
and in vitro ligand-replenishment experiments were conducted
to define the relationship between complement activation and MMP9.
This integrated approach enabled us to distinguish the effects of
SD at multiple levels of the signaling cascade, including total C3
expression, C3 activation through C3a generation, and downstream
C3aR-dependent signaling.
At both the transcriptional and protein levels, the
present transcriptomic analyses (Fig.
3), together with subsequent western blot validation (Fig. 4), demonstrated that SD suppresses
the expression of full-length C3 in both mPFC tissue and BV-2
microglial cells. Specifically, SD reduced C3 transcription and
translation, indicating that it decreases the overall availability
of C3 and thereby limits the upstream substrate pool required for
complement activation. To determine whether SD also regulates
complement activation independently of its effects on total C3
expression, in vitro substrate-replenishment ELISA assays
were performed. Remarkably, supplementation with excess recombinant
full-length C3 protein, provided as an exogenous substrate for
cleavage, failed to restore C3a generation in SD-pretreated cells,
and SD continued to markedly suppress C3a production (Fig. 6). These findings indicate that the
actions of SD extend beyond the inhibition of C3 expression and
include suppression of the proteolytic activation process
responsible for generating biologically active C3a. Consistent with
these in vitro observations, in vivo ELISA analyses
further demonstrated that SD significantly reduced active C3a
accumulation in mPFC tissue (Fig.
6).
The relationship between complement activation and
MMP9 expression was next examined. MMP9 is a zinc-dependent
endopeptidase that plays a critical role in inflammatory responses
and extracellular matrix remodeling (40). To determine whether MMP9 is
regulated downstream of C3a signaling, SD-pretreated,
LPS-stimulated BV-2 cells were treated with exogenous recombinant
C3a. Western blot analysis showed that exogenous C3a effectively
reversed the inhibitory effect of SD and restored MMP9 protein
expression (Fig. 5H and I). This
gain-of-function experiment provides direct evidence that C3a
signaling acts upstream of MMP9. Collectively, these findings
support a sequential signaling cascade in which LPS stimulation
increases C3 expression and promotes C3 cleavage, leading to
elevated C3a production. C3a subsequently activates C3aR signaling,
which induces MMP9 expression and contributes to microglial
activation and neuroinflammatory responses. SD interrupts this
cascade by suppressing both C3 expression and C3 activation,
thereby limiting downstream C3a/C3aR signaling and MMP9
induction.
Glycolysis plays a critical role in regulating
neuroinflammation. Under inflammatory and stress conditions,
microglia undergo metabolic reprogramming and shift from
mitochondrial oxidative phosphorylation to aerobic glycolysis
(27). Previous studies have
showed that glycolytic metabolites promote the production of
pro-inflammatory cytokines, including TNF-α, IL-6 and IL-1β. In
addition, inhibition of PKM2-dependent aerobic glycolysis reduces
microglial C1q, TNF-α and IL-1α levels, leading to decreased C3
expression (41). Transcriptomic
analyses of C3aR-positive microglia in APP-KI rats have further
demonstrated metabolic alterations characterized by increased HIF-1
signaling and dysregulated lipid metabolism compared with the
wild-type controls. Consistent with these findings, Alzheimer's
disease has been associated with activation of the C3aR/HIF-1α
signaling axis, which influences lipid homeostasis and microglial
metabolism (12). Consistent with
previous reports, the present Seahorse extracellular flux analyses
showed that LPS stimulation significantly increased basal
glycolysis and glycolytic capacity while reducing basal respiration
and ATP production. SD effectively reversed these metabolic changes
by suppressing excessive aerobic glycolysis and restoring
mitochondrial oxidative phosphorylation in microglia (Fig. 5D-G).
To determine whether the metabolic effects of SD
depend on complement signaling, the selective C3aR antagonist
SB290157 was used to block downstream C3a/C3aR signaling. Notably,
pharmacological inhibition of C3aR completely abolished the ability
of SD to suppress LPS-induced microglial glycolysis and restore ATP
production in vitro (Fig.
8). These cellular findings were consistent with our in
vivo results, in which co-administration of SB290157 eliminated
the beneficial effects of SD on behavioral despair, anhedonia, and
neuroinflammation in the prefrontal cortex (Fig. 7). Importantly, the additional
control experiments of the present study demonstrated that SB290157
alone did not significantly alter sucrose preference or immobility
time in LPS-treated mice (Fig.
S2). These findings indicate that inhibition of C3aR is not
sufficient to directly modify the depressive-like phenotype under
the present experimental conditions. Rather, the C3a/C3aR signaling
pathway appears to be essential for the therapeutic actions of SD.
Collectively, these results demonstrate that the anti-inflammatory,
anti-glycolytic, and antidepressant-like effects of SD are
dependent on an intact C3a/C3aR signaling axis.
Several methodological and conceptual limitations
should be considered when interpreting the findings of the present
study. First, all behavioral and biochemical experiments were
performed exclusively in male mice. Because sex differences can
substantially influence microglial responses and complement system
activation during inflammatory challenges, the absence of female
animals limits the generalizability of the prsent findings. Future
studies should therefore validate these results in female cohorts.
Second, the 5-day LPS paradigm used in the present study represents
a subacute model of neuroinflammation-induced depressive-like
behavior. Although this model is well established and highly
reproducible for investigating inflammation-related mechanisms, it
does not fully capture the complex, chronic, and multifactorial
nature of human MDD. Notably, within this experimental paradigm, SD
effectively improved behavioral despair and anhedonia but did not
significantly alter anxiety-related behaviors in the OFT or EPM.
This behavioral dissociation suggests that the present model
predominantly induces depressive-like rather than anxiety-like
phenotypes. Whether SD exerts anxiolytic effects under dedicated
anxiety models requires further investigation. Third, mechanistic
studies were conducted primarily in the BV-2 microglial cell line.
Although BV-2 cells provide a convenient and reproducible model for
examining inflammatory and metabolic responses, they are
immortalized cells and therefore do not fully replicate the
physiological characteristics of primary microglia or
tissue-resident brain immune cells. Consequently, future studies
using primary microglia and additional in vivo approaches
will be necessary to further validate the mechanisms identified in
the present study. Future studies using primary microglia or in
vivo cell-sorting approaches are needed to further validate the
metabolic alterations identified in the present study. Fourth,
although pharmacological loss-of-function experiments using
SB290157 and in vitro ligand-replenishment assays strongly
support the dependence of SD on C3a/C3aR signaling, it was not
directly examined whether SD physically interacts with complement
components or other molecular targets within this pathway.
Therefore, additional target-validation studies, including surface
plasmon resonance, cellular thermal shift assays, and other
biochemical binding approaches, will be required to define the
direct molecular targets and mechanism of action of SD.
In conclusion, the present study investigated the
therapeutic effects of SD and its underlying mechanisms in an
LPS-induced mouse model of depressive-like behaviors. The results
of the present study demonstrate that SD effectively alleviates
behavioral despair and anhedonia induced by systemic inflammatory
challenge. Mechanistically, LPS activates complement C3 signaling,
promotes MMP9 expression, and induces microglial metabolic
reprogramming characterized by enhanced aerobic glycolysis. SD
suppresses C3 activation, reduces downstream MMP9 expression,
attenuates neuroinflammation, and restores microglial metabolic
homeostasis. Importantly, pharmacological inhibition of C3aR
completely abolishes the beneficial effects of SD on
depressive-like behaviors, neuroinflammatory responses, and
metabolic dysfunction.
Collectively, these findings indicate that SD
mitigates neuroinflammation-associated depressive-like behaviors
through a mechanism that depends on the C3a/C3aR signaling
pathway.
Supplementary Material
Supporting Data
Supporting Data
Acknowledgements
The authors express gratitude to Dr Sanhua Fang and
Dr Jiajia Wang of the Core Facilities at Zhejiang University School
of Medicine for their invaluable technical assistance.
Funding
The present study was supported by the National Natural Science
Foundation of China (grant no. 82001424).
Availability of data and materials
The sequencing data generated in the present study
may be found in the NCBI Gene Expression Omnibus database under the
accession number GSE335983 or at the following URL: https://www.ncbi.nlm.nih.gov/geo/query/acc.cgi?acc=GSE335983.
The other data generated in the present study may be requested from
the corresponding author.
Authors' contributions
YC and SL conceptualized the study. SL and FL
conducted statistical analysis, ImageJ quantification and GO/KEGG
analysis, and interpreted the results. SL, FL, NC and GS performed
animal experiments, cell culture, molecular biology experiments,
immunostaining and behavioral tests. SL, FL, NC and GS collected,
organized, verified and managed the experimental datasets and raw
data. SL and YC edited the manuscript and prepared the original
draft. YC and SL confirm the authenticity of all the raw data. YC
wrote, reviewed and edited the manuscript, supervised the study,
conducted project administration and acquired funding. All authors
read and approved the final version of the manuscript.
Ethics approval and consent to
participate
All animal experiments were performed in accordance
with the animal testing guidelines of Zhejiang University and the
Guide for the Care and Use of Laboratory Animals published by the
National Institutes of Health. Experimental protocols were reviewed
and approved by the Animal Care and Use Committee of Zhejiang
University (Hangzhou, China; approval no. ZJU20220307). The
supplementary in vivo receptor-antagonism control procedures
(LPS + SB290157 cohort) were independently authorized and approved
by Animal Experimental Ethical Inspection of the Sir Run Run Shaw
Hospital, Zhejiang University School of Medicine (Hangzhou, China;
approval no. SRRSH2026-0041).
Patient consent for publication
Not applicable.
Competing interests
The authors declare that they have no competing
interests.
References
|
1
|
Mathers CD and Loncar D: Projections of
global mortality and burden of disease from 2002 to 2030. PLoS Med.
3:e4422006. View Article : Google Scholar : PubMed/NCBI
|
|
2
|
Smith RS: The macrophage theory of
depression. Med Hypotheses. 35:298–306. 1991. View Article : Google Scholar : PubMed/NCBI
|
|
3
|
Ge C, Chen W, Zhang L, Ai Y, Zou Y and
Peng Q: Chemogenetic activation of the HPC-mPFC pathway improves
cognitive dysfunction in lipopolysaccharide -induced brain injury.
Theranostics. 13:2946–2961. 2023. View Article : Google Scholar : PubMed/NCBI
|
|
4
|
Rezaei S, Prévot TD, Vieira E and Sibille
E: LPS-induced inflammation reduces GABAergic interneuron markers
and brain-derived neurotrophic factor in mouse prefrontal cortex
and hippocampus. Brain Behav Immun Health. 38:1007612024.
View Article : Google Scholar : PubMed/NCBI
|
|
5
|
Maziz MNH, Chakravarthi S, Aung T, Htoo
PM, Shwe WH, Gupalo S, Udayah MW, Singh H, Kabir MS, Thangarajan R
and Kodali M: Microglia-mediated neuroinflammation through
phosphatidylinositol 3-kinase signaling causes cognitive
dysfunction. Int J Mol Sci. 26:72122025. View Article : Google Scholar : PubMed/NCBI
|
|
6
|
Arioz BI, Tastan B, Tarakcioglu E, Tufekci
KU, Olcum M, Ersoy N, Bagriyanik A, Genc K and Genc S: Melatonin
attenuates LPS-induced acute depressive-like behaviors and
microglial NLRP3 inflammasome activation through the SIRT1/Nrf2
pathway. Front Immunol. 10:15112019. View Article : Google Scholar : PubMed/NCBI
|
|
7
|
Korol' SA: Complement system. Fiziol Zh.
23:408–416. 1977.(In Ukrainian). PubMed/NCBI
|
|
8
|
Stephan AH, Barres BA and Stevens B: The
complement system: An unexpected role in synaptic pruning during
development and disease. Annu Rev Neurosci. 35:369–389. 2012.
View Article : Google Scholar : PubMed/NCBI
|
|
9
|
Zhou R, Chen SH, Zhao Z, Tu D, Song S,
Wang Y, Wang Q, Feng J and Hong JS: Complement C3 enhances
LPS-elicited neuroinflammation and neurodegeneration via the
Mac1/NOX2 pathway. Mol Neurobiol. 60:5167–5183. 2023. View Article : Google Scholar : PubMed/NCBI
|
|
10
|
Kolev M, Le Friec G and Kemper C:
Complement-tapping into new sites and effector systems. Nat Rev
Immunol. 14:811–820. 2014. View
Article : Google Scholar : PubMed/NCBI
|
|
11
|
Hess C and Kemper C: Complement-mediated
regulation of meta-bolism and basic cellular processes. Immunity.
45:240–254. 2016. View Article : Google Scholar : PubMed/NCBI
|
|
12
|
Gedam M, Comerota MM, Propson NE, Chen T,
Jin F, Wang MC and Zheng H: Complement C3aR depletion reverses
HIF-1α-induced metabolic impairment and enhances microglial
response to Aβ pathology. J Clin Invest. 133:e1675012023.
View Article : Google Scholar : PubMed/NCBI
|
|
13
|
Sun XP, Shi Z, Pan RL, Qin C, Zhang YL, Li
YH, Qu LN, Li TF and Liu XM: Antidepressant-like effects and
mechanism of action of SYG in depression model in rats. Neuro
Endocrinol Lett. 35:129–136. 2014.PubMed/NCBI
|
|
14
|
Wei Q, Yang J, Li L, Su Y and Wang A:
Novel phthalide dimers from the aerial parts of Ligusticum sinense
Oliv cv. Chaxiong. Fitoterapia. 137:1041742019. View Article : Google Scholar : PubMed/NCBI
|
|
15
|
Chen Y, Cheng Q, Lv S, Kang Z and Zeng S:
Advances in the phytochemistry and pharmacology of plant-derived
phthalides. Heliyon. 9:e229572023. View Article : Google Scholar : PubMed/NCBI
|
|
16
|
Ling J, Deng W, Zhang J and Yang F: The
protective effect of Chuanxiong Oil on focal cerebral reperfusion
injury in rat. Pharmacol Clin Chin Mat Med. 24:39–41. 2008.(In
Chinese).
|
|
17
|
Fan Y, Wang J, Jian J, Wen Y, Li J, Tian
H, Crommen J, Bi W, Zhang T and Jiang Z: High-throughput discovery
of highly selective reversible hMAO-B inhibitors based on at-line
nanofractionation. Acta Pharm Sin B. 14:1772–1786. 2024. View Article : Google Scholar : PubMed/NCBI
|
|
18
|
Li S, Zhuge A, Chen H, Han S, Shen J, Wang
K, Xia J, Xia H, Jiang S, Wu Y and Li L: Sedanolide alleviates
DSS-induced colitis by modulating the intestinal FXR-SMPD3 pathway
in mice. J Adv Res. 69:413–426. 2025. View Article : Google Scholar : PubMed/NCBI
|
|
19
|
Singh P and Mohanty B: Mechanisms of
repetitive LPS exposure-induced toxicity in murine model via
toll-like receptor 4 mediated NF-κB/NLRP3/COX-2 signalling: An in
vivo and in silico analysis. Food Chem Toxicol. 206:1157852025.
View Article : Google Scholar : PubMed/NCBI
|
|
20
|
Wang X, Weng G, Gao Y, Wang Y and Zhang C:
Quercetin ameliorates chronic restraint stress- and LPS-induced
anxiety-like behaviors by modulating neuroinflammation in the
lateral hypothalamus. Psychopharmacology (Berl). 242:2063–2076.
2025. View Article : Google Scholar : PubMed/NCBI
|
|
21
|
Hu Q, Cai H, Ke X, Wang H, Zheng D, Chen
Y, Wang Y and Chen G: The lateral septum partakes the regulation of
propofol-induced anxiety-like behavior. Eur J Pharmacol.
977:1767562024. View Article : Google Scholar : PubMed/NCBI
|
|
22
|
Chen Y, Zheng D, Wang H, Zhang S, Zhou Y,
Ke X and Chen G: Lipocalin 2 in the paraventricular thalamic
nucleus contributes to DSS-induced depressive-like behaviors.
Neurosci Bull. 39:1263–1277. 2023. View Article : Google Scholar : PubMed/NCBI
|
|
23
|
Livak KJ and Schmittgen TD: Analysis of
relative gene expression data using real-time quantitative PCR and
the 2(−Delta Delta C(T)) method. Methods. 25:402–408. 2001.
View Article : Google Scholar : PubMed/NCBI
|
|
24
|
Song S, Zhao W, Ji Y, Huang Q, Li Y, Chen
S, Yang J and Jin X: SHANK2 protein contributes to
sevoflurane-induced developmental neurotoxicity and cognitive
dysfunction in C57BL/6 male mice. Anesthesiol Perioper Sci.
1:22023. View Article : Google Scholar
|
|
25
|
Zheng XZ, Yu HY, Chen YR and Fang JS:
Aucubin mitigates the elevation of microglial aerobic glycolysis
and inflammation in diabetic neuropathic pain via aldose reductase.
World J Diabetes. 16:1039152025. View Article : Google Scholar : PubMed/NCBI
|
|
26
|
Li S, Liu H, Lv P, Yao Y, Peng L, Xia T,
Yan C, Ma Z, Chen ZP, Zhao C and Gu X: Microglia mediate memory
dysfunction via excitatory synaptic elimination in a fracture
surgery mouse model. J Neuroinflammation. 21:2272024. View Article : Google Scholar : PubMed/NCBI
|
|
27
|
Hu Y, Mai W, Chen L, Cao K, Zhang B, Zhang
Z, Liu Y, Lou H, Duan S and Gao Z: mTOR-mediated metabolic
reprogramming shapes distinct microglia functions in response to
lipopolysaccharide and ATP. Glia. 68:1031–1045. 2020. View Article : Google Scholar : PubMed/NCBI
|
|
28
|
Kim D, Langmead B and Salzberg SL: HISAT:
A fast spliced aligner with low memory requirements. Nat Methods.
12:357–360. 2015. View Article : Google Scholar : PubMed/NCBI
|
|
29
|
Pertea M, Pertea GM, Antonescu CM, Chang
TC, Mendell JT and Salzberg SL: StringTie enables improved
reconstruction of a transcriptome from RNA-seq reads. Nat
Biotechnol. 33:290–295. 2015. View Article : Google Scholar : PubMed/NCBI
|
|
30
|
Li B and Dewey CN: RSEM: Accurate
transcript quantification from RNA-Seq data with or without a
reference genome. BMC Bioinformatics. 12:3232011. View Article : Google Scholar : PubMed/NCBI
|
|
31
|
Love MI, Huber W and Anders S: Moderated
estimation of fold change and dispersion for RNA-seq data with
DESeq2. Genome Biol. 15:5502014. View Article : Google Scholar : PubMed/NCBI
|
|
32
|
Wang L, Feng Z, Wang X, Wang X and Zhang
X: DEGseq: An R package for identifying differentially expressed
genes from RNA-seq data. Bioinformatics. 26:136–138. 2010.
View Article : Google Scholar : PubMed/NCBI
|
|
33
|
Li Y, Kong E, Ding R, Chu R, Lu J, Deng M,
Hua T, Yang M, Wang H, Chen D, et al: Hyperglycemia-induced Sirt3
downregulation increases microglial aerobic glycolysis and
inflammation in diabetic neuropathic pain pathogenesis. CNS
Neurosci Ther. 30:e149132024. View Article : Google Scholar : PubMed/NCBI
|
|
34
|
Xie Q, Zhang X, Zhao S, Chen S, Liu M, Zhu
C, Zhao Y, Gui Y and Ma R: Sedanolide: A review on its chemical
compounds, mechanisms and functions. Fitoterapia. 185:1067322025.
View Article : Google Scholar : PubMed/NCBI
|
|
35
|
Tabei Y, Abe H, Suzuki S, Takeda N, Arai
JI and Nakajima Y: Sedanolide activates KEAP1-NRF2 pathway and
ameliorates hydrogen peroxide-induced apoptotic cell death. Int J
Mol Sci. 24:165322023. View Article : Google Scholar : PubMed/NCBI
|
|
36
|
Ma N, Fan S, Li X, et al: Screening of
anti-inflammatory substances of Chuanxiong Rhizoma and analysis of
its mechanism. Chin J Exp Tradit Med Formulae. 24:140–146. 2018.(In
Chinese).
|
|
37
|
Gedam M and Zheng H: Complement C3aR
signaling: Immune and metabolic modulation and its impact on
Alzheimer's disease. Eur J Immunol. 54:e23508152024. View Article : Google Scholar : PubMed/NCBI
|
|
38
|
Yan H, Zhang JL, Leung KT, Lo KW, Yu J, To
KF and Kang W: An update of G-protein-coupled receptor signaling
and its deregulation in gastric carcinogenesis. Cancers (Basel).
15:7362023. View Article : Google Scholar : PubMed/NCBI
|
|
39
|
Rothwarf DM and Karin M: The NF-kappa B
activation pathway: A paradigm in information transfer from
membrane to nucleus. Sci STKE. 1999:RE11999. View Article : Google Scholar : PubMed/NCBI
|
|
40
|
Wang Y, Jiao L, Qiang C, Chen C, Shen Z,
Ding F, Lv L, Zhu T, Lu Y and Cui X: The role of matrix
metalloproteinase 9 in fibrosis diseases and its molecular
mechanisms. Biomed Pharmacother. 171:1161162024. View Article : Google Scholar : PubMed/NCBI
|
|
41
|
Li X, Zhou R, Peng H, Peng J, Li Q and Mei
M: Microglia PKM2 mediates neuroinflammation and neuron loss in
mice epilepsy through the astrocyte C3-neuron C3R signaling
pathway. Brain Sci. 13:2622023. View Article : Google Scholar : PubMed/NCBI
|