Introduction
Esophageal cancer is one of the most difficult
malignancies to cure, and the prognosis for these patients is poor
(1–3). Although surgery is the main curative
treatment for these tumors, chemoradiotherapy (CRT) was identified
as a viable option for the treatment of esophageal carcinoma. The
Radiation Therapy Oncology Group (RTOG) 8501 trial showed that CRT
is superior to radiotherapy alone as primary treatment (4). However, a number of studies
demonstrated that the patterns of failure observed following
definitive CRT showed that locoregional failure is frequent, with
approximately 50% of patients experiencing local failure (4,5). The
identification of predictive markers for the response to CRT may
improve patient selection and allow for response modifications such
as more intensive treatments for poor responders.
Glucose-transporter-1 (GLUT-1) is a membrane
receptor that mediates the passive export of glucose across plasma
membranes and its expression increases in hypoxic conditions due to
reduced oxidative phosphorylation and hypoxia inducible factor-1
(HIF-1) induction (6). GLUT-1
facilitates the metabolic adaptation of cells to hypoxia and is
essential for survival and proliferation of glycolytic metabolism
(7,8). Therefore, GLUT-1 expression may be a
suitable marker of hypoxia and glucose metabolism, measured simply
and cost-effectively as part of the routine histological assessment
of tumors (9,10). GLUT-1 has been immunohistochemically
detected in a variety of malignant tissues, including tumors of the
breast, thyroid, head and neck, bladder and lung (11–15).
In all cases, the tumor expression was increased as compared to
that of the corresponding normal tissues. The over-expression of
GLUT-1 in tumors was reported to be a marker for poor prognosis in
colorectal, ovarian and non-small cell lung cancers (16–18).
In esophageal cancer, a number of studies showed that GLUT-1
over-expression was associated with tumor aggressiveness and poor
prognosis in patients with esophageal cancer treated with surgical
resection (19,20). However, little information is
available on the clinical significance of GLUT-1 expression in
patients with esophageal cancer treated with concurrent CRT.
In the current study, GLUT-1 expression was
retrospectively semiquantitated. Moreover, whether or not these
levels were associated with clinicopathological characteristics and
the clinical outcomes in patients with esophageal cancer treated
with concurrent CRT was investigated.
Materials and methods
Patients and sample collection
Between 1997 and 2002, 37 patients with esophageal
cancer were treated with concurrent CRT at the University of the
Ryukyus Hospital, Japan. The study comprised primary esophageal
carcinoma specimens from pretreatment biopsies obtained from 25
patients. The disease characteristics of the 25 patients, including
tumor stage and tumor sites, were not significantly different
compared to those of the 12 patients from which carcinoma specimens
were not obtained. The histopathological diagnosis of the 25
patients was squamous cell carcinoma. No patients received
chemotherapy or radiotherapy prior to the biopsy. The carcinoma
specimens were obtained from the tumor edge, thereby avoiding the
necrotic center. The specimens were immediately fixed in 10%
buffered formalin.
The patient characteristics of the 25 patients are
shown in Table I. Of the 25
patients, 1 was female and 24 were male, and the ages ranged from
45–78 years (median 62). The study was performed according to the
guidelines approved by the institutional review board of our
institution, and written informed consent was obtained from the 25
patients.
 | Table IGLUT-1 expression and
clinicopathological characteristics in 25 patients with esophageal
cancer treated with concurrent chemoradiotherapy. |
Table I
GLUT-1 expression and
clinicopathological characteristics in 25 patients with esophageal
cancer treated with concurrent chemoradiotherapy.
| | GLUT-1
expression | |
|---|
| |
| |
|---|
| Variable | No. of patients | Negative | Positive | P-value |
|---|
| Gender |
| Male | 24 | 18 | 6 | 0.1017 |
| Female | 1 | 0 | 1 | |
| Age (years) |
| <60 | 8 | 4 | 4 | 0.1663 |
| ≥60 | 14 | 11 | 3 | |
| Clinical T stage
(UICC 2002) |
| T1–3 | 15 | 13 | 2 | 0.0454 |
| T4 | 10 | 5 | 5 | |
| Clinical N stage
(UICC 2002) |
| N0 | 8 | 8 | 0 | 0.0324 |
| N1 | 17 | 10 | 7 | |
| Clinical M stage
(UICC 2002) |
| M0 | 20 | 16 | 4 | 0.0747 |
| M1 | 5 | 2 | 3 | |
| KPS (%) |
| 100–70 | 23 | 17 | 6 | 0.4701 |
| ≤60 | 2 | 1 | 1 | |
| Tumor site |
| Ce or Ut | 12 | 8 | 4 | 0.5682 |
| Mt or Lt | 13 | 10 | 3 | |
| Total radiation
dose |
| <60 Gy | 3 | 2 | 1 | 0.8264 |
| ≥60 Gy | 22 | 16 | 6 | |
| No. of chemotherapy
courses |
| 1 | 7 | 4 | 3 | 0.3021 |
| 2 | 18 | 14 | 4 | |
Concurrent chemoradiotherapy
External beam radiotherapy (EBRT) was administered
with megavoltage equipment of photon energies ≥4 MeV. The total
doses of EBRT ranged from 40–66.6 Gy with a single fraction of
1.8–2 Gy 5 days per week. The median total dose of the 25 patients
was 66.6 Gy, and 22 of 25 patients (88.0%) were treated with a
total dose of ≥60 Gy. The treatment field of EBRT consisted of a
localized field in 4 of 25 patients (16%), and the primary tumor
plus regional lymph nodes in the remaining 21 (84%). In the
majority of patients, computed tomography (CT)-based treatment
planning and conformal radiotherapy were used. Initially,
anterior-posterior opposed fields were employed at doses of 32.4–40
Gy, and a booster dose of 14–34.2 Gy was administered, using
bilateral oblique or multiple fields. The clinical target volume
for the primary tumor was defined as the gross tumor volume plus 3
cm craniocaudally. The planning target volumes for the primary
tumor and the metastatic lymph nodes were determined with 1 to 1.5
cm margins to compensate for set-up variations and internal organ
motion. Lung heterogeneity corrections were not used.
Chemotherapy was administered concurrently with
radiotherapy. One course of chemotherapy consisted of cisplatin (80
mg/m2 on day 1) and 5-fluorouracil (800 mg/m2
on days 2–6), with 3- to 4-week intervals for a total of 1–2
courses. The patients received antiemetics with granisetron and
metoclopramide prior to chemotherapy administration.
Immunohistochemical staining for
glucose-transporter-1 and evaluation of staining
Formalin-fixed, paraffin-embedded tumor sections
were dewaxed in xylene and dehydrated using a series of ethanol
solutions of increasing dilution. Staining for GLUT-1 was then
perfromed using the Envision Dual link. This protocol uses a
3,3′-diaminobenzidine substrate system that enabled visualization
of the GLUT-1 protein as a brown stain. For GLUT-1 staining, a
1/100 (10 mg/ml protein) concentration of affinity-pure rabbit
antihuman GLUT-1 (Chemicon Europe) was utilized. An incubation time
was performed overnight at 4°C for the primary antibody steps,
whereas an incubation time of 30 min at room temperature was
selected for each secondary antibody. The negative controls were
prepared by omitting the primary antibodies. Following staining,
sections were rinsed with water, counterstained with Gill’s
hematoxylin and cover-slipped using an aqueous mountant.
Two independent pathologists blinded to the
clinico-pathological data performed the scoring of the
immunohistochemical staining. The percentage of positive tumor
cells was semiquantitatively determined by assessing the whole
biopsy specimen, and the mean percentage of positive tumor cells
was calculated by the two pathologists. In the current study, each
sample was characterized as either 1, low (0–30%); or 2, high
(31–100%).
Statistical analysis
The median follow-up of 9 surviving patients was
57.8 months (range 2.8–107.7). In the current study, the initial
response of the primary tumor was evaluated using the criteria of
the Japanese Society for Esophageal Disease, which were based on
findings from esophagograms and esophagoscopies (21). In brief, complete response (CR) was
defined as the complete disappearance of tumor and no appearance of
new lesions at least 4 weeks after treatment. Partial response (PR)
was defined as a >50% reduction in the product of the
perpendicular diameters of the tumor and no appearance of new
lesions at least 4 weeks after treatment. Progressive disease (PD)
was defined as a >25% increase in the product of the
perpendicular diameters of the tumor or any new tumor. Any further
conditions were defined as no change (NC). Disease recurrence was
defined as recurrence or progression of the initial disease or the
occurrence of new disease following CRT detected by a CT scan
and/or esophagoscopy, which were performed every 3–4 months for 2
years and then twice a year. Overall survival (OS), recurrence-free
survival (RFS) and local control (LC) rates were calculated
actuarially according to the Kaplan-Meier method (22), and were measured from the first day
of CRT. Differences between the groups were estimated using the
Chi-square and generalized Wilcoxon tests (23). Multivariate analysis was performed
using the Cox regression model (24). P=0.05 was considered to be
statistically significant. Statistical analysis was performed with
the SPSS software package (version 6.1; SPSS, Inc., Chicago, IL,
USA).
Results
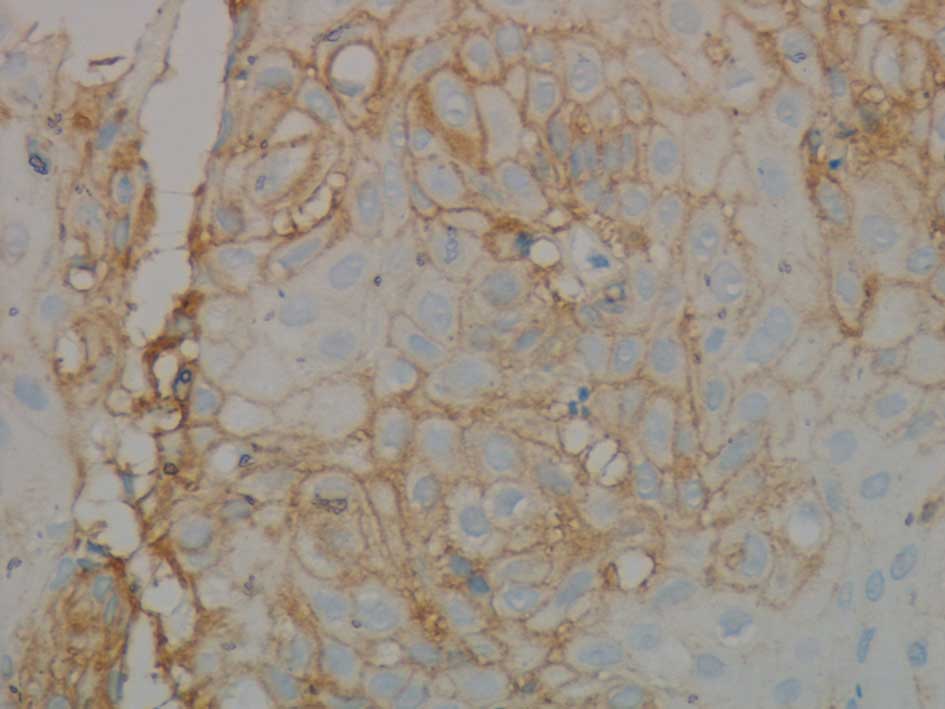
Representative examples of high or low GLUT-1
expression by immunohistochemical analysis are shown in Fig. 1. In the current study, a high GLUT-1
expression was observed in 7 of 25 (28%) patients, and the patients
were divided into low and high GLUT-1 expression groups. Table I shows the clinical data and GLUT-1
expression in the tumor biopsies of the 25 patients. The proportion
of patients with T4 tumors was significantly higher (p=0.0454) in
the high GLUT-1 expression group than that of patients with low
GLUT-1 expression. Moreover, the proportion of patients with N1
tumor was significantly higher (p=0.0324) in the high GLUT-1
expression group than that of patients with low GLUT-1 expression.
Other characteristics, such as age and gender, did not correlate
with the GLUT-1 expression.
Table II shows
GLUT-1 expression and the initial response in 25 patients. A total
of 12 of 13 patients (92.3%) exhibited a CR response in the low
GLUT-1 expression group, while 6 of 12 patients (50.0%) exhibited a
CR response in the high GLUT-1 expression group. Significant
differences were noted between the low and high GLUT-1 expression
groups regarding the initial response to concurrent CRT
(p=0.0185).
| Table IIGLUT-1 expression and initial
response in 25 patients with esophageal cancer treated with
concurrent chemoradiotherapy. |
Table II
GLUT-1 expression and initial
response in 25 patients with esophageal cancer treated with
concurrent chemoradiotherapy.
| Initial
response | No. of
patients | GLUT-1
expression | P-value |
|---|
|
|---|
| Low (%) | High (%) |
|---|
| CR | 13 | 12 (92.3) | 1 (7.7) | 0.0185 |
| PR or NC | 12 | 6 (50.0) | 6 (50.0) | |
At the time of this study, 16 patients (91.0%) had
disease recurrences (local, 6 patients; regional lymph nodes, 2;
distant metastasis, including bone or lung, 4; and multiple sites,
4 patients). Of the 16 patients with multiple recurrences, 2
patients had simultaneous local recurrence. Local recurrence
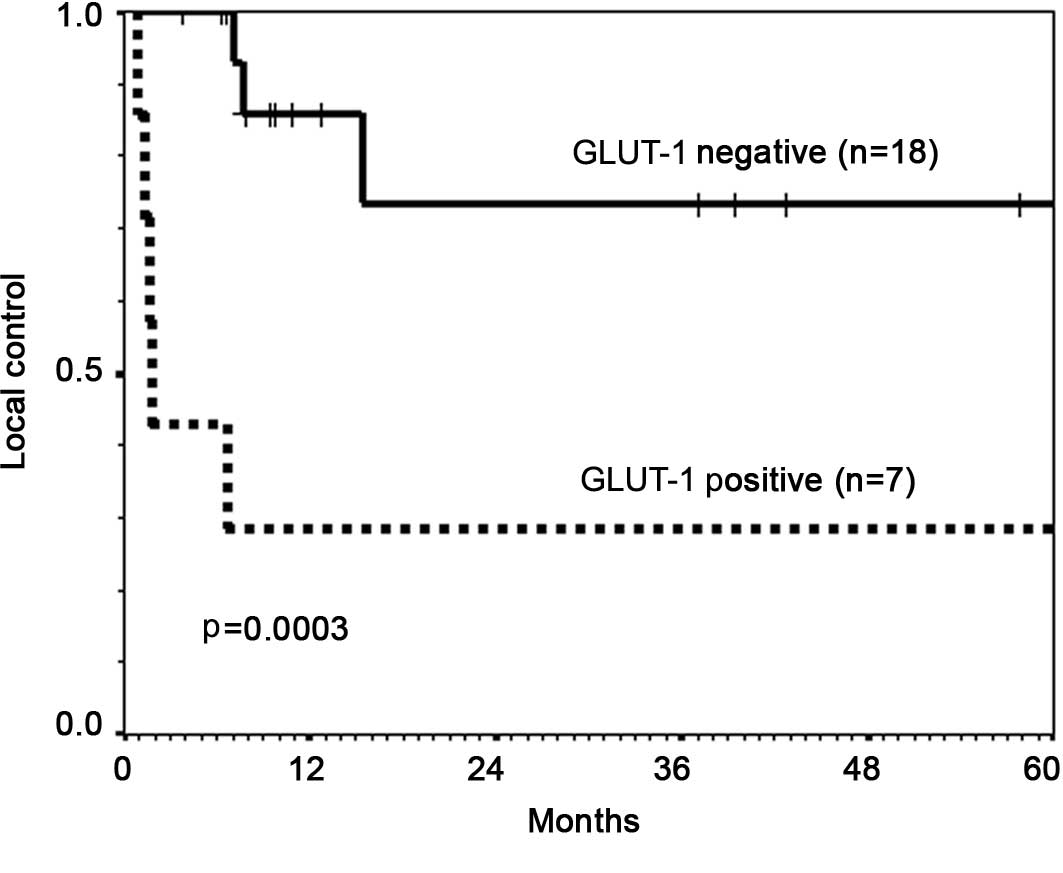
occurred in 8 patients (32.0%) in total. The 5-year actuarial LC
rate in the 25 patients was 61.9%. Fig.
2 shows the LC curves according to the GLUT-1 expression.
Patients with high GLUT-1 expression had a significantly poorer LC
(5-year LC; 28.6%) than those with low GLUT-1 expression (5-year
LC; 73.4%; p<005). The univariate analysis showed that GLUT-1
expression, the number of chemotherapy courses, total radiation
dose and clinical M stage had a significant impact on LC (Table III), while the multivariate
analysis showed that GLUT-1 expression and the number of
chemotherapy courses were independent prognostic factors for LC
(Table IV).
| Table IIIUnivariate analysis of various
potential prognostic factors for LC in patients with esophageal
cancer treated with concurrent chemoradiotherapy. |
Table III
Univariate analysis of various
potential prognostic factors for LC in patients with esophageal
cancer treated with concurrent chemoradiotherapy.
| | Univariate
analysis | |
|---|
| |
|
|
|---|
| No. of
patients | LC, 5-year rate
(%) | P-value |
|---|
| Gender |
| Male | 24 | 59.7 | 0.5065 |
| Female | 1 | 100 | |
| Age (years) |
| <60 | 8 | 62.5 | 0.3847 |
| ≥60 or more | 14 | 59.6 | |
| Clinical T stage
(UICC 2002) |
| T1–3 | 15 | 63.3 | 0.2851 |
| T4 | 10 | 60.0 | |
| Clinical N stage
(UICC 2002) |
| N0 | 8 | 60.0 | 0.4436 |
| N1 | 17 | 66.7 | |
| Clinical M stage
(UICC 2002) |
| M0 | 20 | 68.1 | 0.0067 |
| M1 | 5 | 40.0 | |
| KPS (%) |
| 100–70 | 23 | 62.3 | 0.1776 |
| ≤60 | 2 | 50.0 | |
| Tumor site |
| Ce or Ut | 12 | 71.4 | 0.8294 |
| Mt or Lt | 13 | 59.4 | |
| Total radiation
dose |
| <60 Gy | 3 | 33.3 | 0.0058 |
| ≥60 Gy | 22 | 66.1 | |
| No. of chemotherapy
courses |
| 1 | 7 | 19.5 | 0.0012 |
| 2 | 18 | 78.7 | |
| GLUT-1
expression |
| Low | 18 | 73.4 | 0.0003 |
| High | 7 | 28.5 | |
| Table IVMultivariate analysis of various
potential prognostic factors for LC in patients with esophageal
cancer treated with concurrent chemoradiotherapy. |
Table IV
Multivariate analysis of various
potential prognostic factors for LC in patients with esophageal
cancer treated with concurrent chemoradiotherapy.
| | Multivariate
analysis | |
|---|
| |
|
|
|---|
| | RR (95% CI) | P-value |
|---|
| GLUT-1 | (Low vs. high) | 0.047
(0.005–0.434) | 0.0070 |
| Chemotherapy
course | (1 course vs. 2
courses) | 29.598
(2.872–304.993) | 0.0040 |
| Clinical M
stage | (M0 vs. M1) | 0.260
(0.001–45.361) | 0.6090 |
| Total radiation
dose | (<60 Gy vs. ≥60
Gy) | 0.683
(0.000–3409.927) | 0.9300 |
Of the 25 patients, 16 (64.0%) succumbed to the
disease during this study. Of the 16 patients, 13 succumbed to
esophageal carcinoma and the remaining 3 patients succumbed without
any sign of clinical recurrence (1, radiation pneumonitis; 1,
pneumonia; and 1, unknown causes). The 5-year actuarial OS and RFS
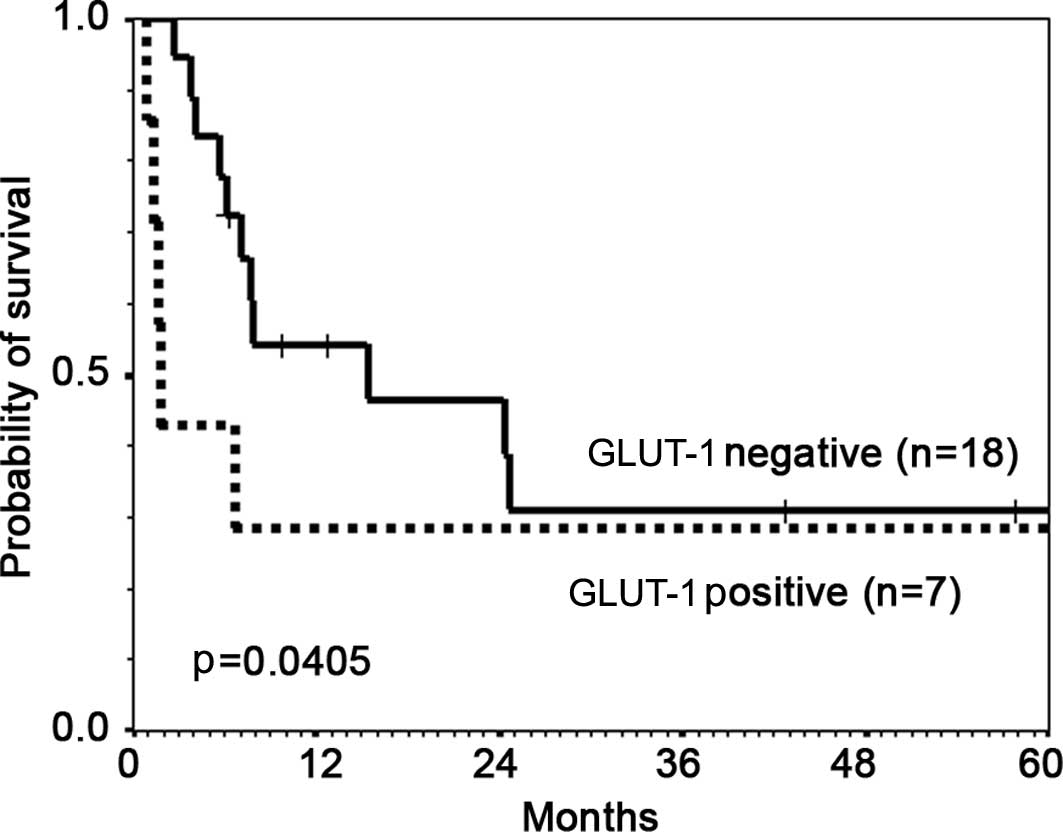
rate for the 25 patients was 27.3 and 31.3%, respectively. Fig. 3 shows the RFS curves according to
GLUT-1 expression. Patients with a high GLUT-1 expression had a
significantly lower RFS compared to those with a low GLUT-1
expression (p=0.0405). The univariate analysis showed that GLUT-1
expression, the number of chemotherapy courses and clinical M stage
had a significant impact on OS, while the multivariate analysis,
the three factors proved to be significant prognostic factors for
RFS (Tables V and VI).
| Table VUnivariate analysis of various
potential prognostic factors for RFS in patients with esophageal
cancer treated with concurrent chemoradiotherapy. |
Table V
Univariate analysis of various
potential prognostic factors for RFS in patients with esophageal
cancer treated with concurrent chemoradiotherapy.
| | Univariate
analysis | |
|---|
| |
|
|
|---|
| No. of
patients | RFS, 5-year rate
(%) | P-value |
|---|
| Gender |
| Male | 24 | 27.9 | 0.3125 |
| Female | 1 | 100 | |
| Age (years) |
| <60 | 8 | 25.0 | 0.3782 |
| ≥60 | 14 | 34.2 | |
| Clinical T stage
(UICC 2002) |
| T1–3 | 15 | 25.9 | 0.5743 |
| T4 | 10 | 40.0 | |
| Clinical N stage
(UICC 2002) |
| N0 | 8 | 60.0 | 0.0566 |
| N1 | 17 | 22.1 | |
| Clinical M stage
(UICC 2002) |
| M0 | 20 | 39.1 | <0.0001 |
| M1 | 5 | 0.0 | |
| KPS (%) |
| 100–70 | 23 | 31.6 | 0.4884 |
| ≤60 | 2 | 50.0 | |
| Tumor site |
| Ce or Ut | 12 | 35.9 | 0.5099 |
| Mt or Lt | 13 | 25.9 | |
| Total radiation
dose |
| <60 Gy | 3 | 33.3 | 0.0539 |
| ≥60 Gy | 22 | 32.4 | |
| No. of chemotherapy
courses |
| 1 | 7 | 0.0 | 0.0004 |
| 2 | 18 | 43.8 | |
| GLUT-1
expression |
| Low | 18 | 30.1 | 0.0405 |
| High | 7 | 28.5 | |
| Table VIMultivariate analysis of various
potential prognostic factors for DFS in patients with esophageal
cancer treated with concurrent chemoradiotherapy. |
Table VI
Multivariate analysis of various
potential prognostic factors for DFS in patients with esophageal
cancer treated with concurrent chemoradiotherapy.
| | Multivariate
analysis | |
|---|
| |
| |
|---|
| | RR (95% CI) | P-value |
|---|
| GLUT-1 | (Low vs. high) | 0.113
(0.019–0.668) | 0.0160 |
| Chemotherapy
course | (1 course vs. 2
courses) | 6.614
(1.473–25.797) | 0.0130 |
| Clinical M
stage | (M0 vs. M1) | 0.065
(0.008–0.513) | 0.0090 |
| Total radiation
dose | (<60 Gy vs. ≥60
Gy) | 2.580
(0.332–20.005) | 0.3650 |
| Clinical N
stage | (N0 vs. N1) | 4.474
(0.958–20.892) | 0.0570 |
Late complications of NCI-CTC Grade 4–5 were
observed in 2 patients (4.0%). One patient suffered grade 4
pericardical effusion requiring pericardial puncture 58 months
after the completion of CRT. The remaining patient suffered grade 5
radiation pneumonitis and succumbed to radiation pneumonitis 4
months after CRT. The 2 patients were treated with a total dose of
66.6 Gy radiotherapy and 2 courses of chemotherapies.
Discussion
The current study showed that GLUT-1 expression is
significantly correlated with clinical T and N stages in patients
with esophageal carcinoma. The percentage of patients with T4 tumor
was significantly higher in the high GLUT-1 expression group than
that of patients with low GLUT-1 expression. Moreover, the
percentage of patients with N1 tumor was significantly higher in
the high GLUT-1 expression group than that of patients with a low
GLUT-1 expression. A number of studies found an association between
GLUT-1 expression and tumor stage (19,20).
Tohma et al found that pathological T3–4 esophageal cancers
showed higher percentages of GLUT-1 strong positive cells than T1–2
cancers, and lesions exhibiting lymph node metastasis showed higher
percentages of GLUT-1 strong positive cells than lesions without
lymph node metastasis (19). Kato
et al showed that significant correlations between GLUT-1
expression and tumor stage were observed in patients with
esophageal squamous cell carcinoma (20). The results of these authors,
together with our results, proved that GLUT-1 expression is
correlated with tumor aggressiveness in patients with esophageal
carcinoma. GLUT-1 may be linked to invasiveness by supporting
glycosis, which enhances tumor cell viability and provides energy
for cell division and tumor growth (25).
The current study showed that GLUT-1 expression was
significantly correlated with initial response to concurrent CRT,
and patients with a high GLUT-1 expression had a significantly
poorer LC (5-year LC, 28.6%) than those with a low expression
(5-year LC, 73.4%; p<005). Multivariate analysis revealed that
GLUT-1 and the number of chemotherapy courses were independent
prognostic factors for LC. The relationship between GLUT-1
expression and the reduction in response to radiotherapy and
chemotherapy is explained by the fact that GLUT-1 expression is a
marker of cellular adaptive responses to hypoxia (26–28).
The biological effect of radiotherapy was reported to have
increased approximately 3-fold when irradiation was performed under
well-oxygenated conditions compared to anoxic ones (29). Regarding rectal cancers, Brophy
et al found that GLUT-1 expression was significantly
associated with a reduced response to CRT (26). These authors showed that GLUT-1
expression appears to be a surrogate for tumor response to CRT in
patients with esophageal carcinoma.
Regarding RFS, patients with a high GLUT-1
expression had significantly lower RFS compared to those with a low
GLUT-1 expression (p=0.0405). The multivariate analysis showed that
GLUT-1, the number of chemotherapy courses and clinical M stage
were independent prognostic factors for RFS. Previous studies found
that the GLUT-1 over-expression in esophageal carcinoma is a risk
factor for mortality (19,20) The results of these authors, together
with our results, suggest that GLUT-1 expression is predictive of
clinical outcomes in patients with esophageal carcinoma treated
with CRT.
It is well established that hypoxic conditions due
to reduced oxidative phosphorylation, which may be a consequence of
the increased proliferation observed in tumors, enhances GLUT-1
expression (6,30). GLUT-1 is considered to enhance
glycolytic metabolism which has been correlated with tumor
proliferative activity (8).
Therefore, GLUT-1 expression appears to be a surrogate marker for
not only hypoxia but also the metabolic activity of malignant
tumors (31). Since the presence of
hypoxia causes treatment resistance by radiotherapy and
chemotherapy, and the high metabolic activity causes a higher
proliferative activity in tumors, a high GLUT-1 expression may
result in poor treatment outcome in patients with malignant
tumors.
The increase in glucose transport noted in malignant
tumors has also been detected using 18-fluorodeoxyglucose positron
emission tomography (FDG-PET), which can quantify tumor glucose
consumption (32,33). Regarding esophageal carcinoma,
Taylor et al found that in patients undergoing surgical
resection, increasing standardized uptake values (SUVmax)
correlated with an increased GLUT-1 expression (34). GLUT-1 activity enhanced glycolytic
metabolism which has been correlated with tumor proliferative
activity (8). Westerterp et
al showed that in patients with esophageal carcinoma, a
significant correlation was found between FDG uptake and GLUT-1
expression (35). Kato et al
found that GLUT-1 expression was related to FDG uptake and
assessment of both FDG uptake and GLUT-1 expression may be useful
for providing prognostic data in patients with esophageal carcinoma
(36). However, GLUT-1 expression
is obtained from superficial biopsy tissues and may not be
representative of the tumor as a whole. Further studies are
therefore required to investigate the correlations of GLUT-1 and
FDG-PET in patients with esophageal carcinoma.
In conclusion, our results showed that GLUT-1
expression is significantly correlated with initial T and N stages,
and response to concurrent CRT. Moreover, GLUT-1 is predictive of
LC and DFS for patients with esophageal carcinoma treated with
concurrent CRT. These findings suggest a role for GLUT-1 as a new
prognostic biomarker for patients with esophageal cancer treated
with CRT, and may allow for the selection of patients most likely
to benefit from more intensive treatments. Furthermore,
understanding the biological role of GLUT-1 may allow for response
modification by targeting specific pathways. However, this study is
a retrospective study with a relatively limited number of patients.
Therefore further prospective studies are required to confirm our
results.
References
|
1
|
Roth JA, Putnum JB Jr, Rich TA and
Forastiere AA: Cancer of the esophagus. Cancer: Principles And
Practice Of Oncology. 5th edition. Devita VT Jr, Hellman S and
Rosenberg SA: Lippincott-Raven; PA: pp. 980–1021. 1997
|
|
2
|
Earlam R and Cunha-Melo JR: Oesophageal
squamous cell carcinoma: I. A critical review of surgery. Br J
Surg. 67:381–390. 1980. View Article : Google Scholar : PubMed/NCBI
|
|
3
|
Earlam R and Cunha-Melo JR: Oesophogeal
squamous cell carcinoms: II. A critical view of radiotherapy. Br J
Surg. 67:457–461. 1980. View Article : Google Scholar : PubMed/NCBI
|
|
4
|
Cooper JS, Guo MD, Herskovic A, et al:
Chemoradiotherapy of locally advanced esophageal cancer: long-term
follow-up of a prospective randomized trial (RTOG 85-01). Radiation
Therapy Oncology Group. JAMA. 281:1623–1627. 1999. View Article : Google Scholar : PubMed/NCBI
|
|
5
|
Minsky BD, Pajak TF, Ginsberg RJ, et al:
INT 0123 (Radiation Therapy Oncology Group 94-05) phase III trial
of combined-modality therapy for esophageal cancer: high-dose
versus standard-dose radiation therapy. J Clin Oncol. 20:1167–1174.
2002. View Article : Google Scholar : PubMed/NCBI
|
|
6
|
Behrooz A and Ismail-Beigi F: Dual control
of glut1 glucose transporter gene expression by hypoxia and by
inhibition of oxidative phosphorylation. J Biol Chem.
272:5555–5562. 1997. View Article : Google Scholar : PubMed/NCBI
|
|
7
|
Lin Z, Weinberg JM, Malhotra R, Merritt
SE, Holzman LB and Brosius FC III: GLUT-1 reduces hypoxia-induced
apoptosis and JNK pathway activation. Am J Physiol Endocrinol
Metab. 278:958–966. 2000.PubMed/NCBI
|
|
8
|
Pessin JE and Bell GI: Mammalian
facilitative glucose transporter family: structure and molecular
regulation. Annu Rev Physiol. 54:911–930. 1992. View Article : Google Scholar : PubMed/NCBI
|
|
9
|
Airley R, Loncaster J, Davidson S, Bromley
M, Roberts S, Patterson A, Hunter R, Stratford I and West C:
Glucose transporter glut-1 expression correlates with tumor hypoxia
and predicts metastasis-free survival in advanced carcinoma of the
cervix. Clin Cancer Res. 7:928–934. 2001.PubMed/NCBI
|
|
10
|
Airley RE, Loncaster J, Raleigh JA, et al:
GLUT-1 and CAIX as intrinsic markers of hypoxia in carcinoma of the
cervix: relationship to pimonidazole binding. Int J Cancer.
104:85–91. 2003. View Article : Google Scholar : PubMed/NCBI
|
|
11
|
Brown RS and Wahl RL: Overexpression of
Glut-1 glucose transporter in human breast cancer. Cancer.
72:2979–2985. 1993. View Article : Google Scholar : PubMed/NCBI
|
|
12
|
Haber RS, Weiser RL, Pritsker A, Reder I
and Burstein DE: Glut-1 glucose transporter in benign and malignant
thyroid nodules. Thyroid. 7:363–367. 1997. View Article : Google Scholar : PubMed/NCBI
|
|
13
|
Mellanen P, Minn H, Grenman R and Harkonen
P: Expression of glucose transporters in head and neck tumors. Int
J Cancer. 56:622–629. 1994. View Article : Google Scholar : PubMed/NCBI
|
|
14
|
Chang S, Lee S, Lee C, Kim JI and Kim Y:
Expression of the human erythrocyte glucose transporter in
transitional cell carcinoma of the bladder. Urology. 55:448–452.
2000. View Article : Google Scholar : PubMed/NCBI
|
|
15
|
Kurata T, Oguri T, Isobe T, Ishioka S and
Yamakido M: Differential expression of facilitative glucose
transporter (GLUT) genes in primary lung cancers and their liver
metastases. Jpn J Cancer Res. 90:1238–1243. 1999. View Article : Google Scholar : PubMed/NCBI
|
|
16
|
Haber RS, Rathan A, Weiser KR, et al:
GLUT-1 glucose transporter expression in colorectal carcinoma: a
marker for poor prognosis. Cancer. 83:34–40. 1998. View Article : Google Scholar : PubMed/NCBI
|
|
17
|
Cartiana G, Fagotti G, Megathaes A, et al:
Glut-1 expression in ovarian carcinoma: association with survival
and response to chemotherapy. Cancer. 92:1144–1150. 2001.
View Article : Google Scholar : PubMed/NCBI
|
|
18
|
Younes M, Brown RW, Stephenson M, Gondo M
and Cagle PT: Overexpression of Glut1 and Glut3 in stage 1 nonsmall
cell lung carcinoma is associated with poor survival. Cancer.
80:1046–1051. 1997. View Article : Google Scholar : PubMed/NCBI
|
|
19
|
Tohma T, Okazumi S, Makino H, et al:
Overexpression of glucose transporter 1 in esophageal squamous cell
carcinomas: a marker for poor prognosis. Dis Esophagus. 18:185–189.
2005. View Article : Google Scholar : PubMed/NCBI
|
|
20
|
Kato H, Takita J, Miyazaki T, et al:
Glut-1 glucose transporter expression in esophageal squamous cell
carcinoma is associated with tumor aggressiveness. Anticancer Res.
22:2635–2639. 2002.PubMed/NCBI
|
|
21
|
Japanese Society for Esophageal Disease.
Guide Lines For The Clinical And Pathologic Studies On Carcinoma Of
The Esophagus. 9th edition. Kanehara Shuppan; Tokyo: pp. 59–79.
1999
|
|
22
|
Kaplan EL and Meier P: Nonparametric
estimation from incomplete observations. J Am Stat Assoc.
53:457–481. 1958. View Article : Google Scholar
|
|
23
|
Gehan E: A generalized Wilcoxon test for
comparing arbitrarily single-censored samples. Biometrica.
52:203–224. 1965. View Article : Google Scholar : PubMed/NCBI
|
|
24
|
Cox DR: Regression models and life tables.
J R Stat Soc. 34:187–220. 1972.
|
|
25
|
Kawamura T, Kusakabe T, Sugino T, et al:
Expression of glucose transporter-1 in human gastric carcinoma:
association with tumor aggressiveness, metastasis, and patient
survival. Cancer. 92:634–641. 2001. View Article : Google Scholar : PubMed/NCBI
|
|
26
|
Brophy S, Sheehan KM, McNamara DA, Deasy
J, Bouchier-Hayes DJ and Kay EW: GLUT-1 expression and response to
chemoradiotherapy in rectal cancer. Int J Cancer. 125:2778–2782.
2009. View Article : Google Scholar : PubMed/NCBI
|
|
27
|
Hockel M, Schlenger K, Aral B, Mitze M,
Schaffer U and Vaupel P: Association between tumor hypoxia and
malignant progression in advanced cancer of the uterine cervix.
Cancer Res. 56:4509–4515. 1996.PubMed/NCBI
|
|
28
|
Airley RE, Phillips RM, Evans AE, et al:
Hypoxia-regulated glucose transporter Glut-1 may influence
chemosensitivity to some alkylating agents: Results of EORTC (First
Translational Award) study of the relevance of tumour hypoxia to
the outcome of chemotherapy in human tumour-derived xenografts. Int
J Oncol. 26:1477–1484. 2005.
|
|
29
|
Gray LH, Conger AD, Ebert M, Hornsey S and
Scott OC: The concentration of oxygen dissolved in tissues at the
time of irradiation as a factor in radiotherapy. Br J Radiol.
26:638–648. 1953. View Article : Google Scholar : PubMed/NCBI
|
|
30
|
Shetty M, Loeb JN, Vikstrom K and
Ismail-Beigi F: Rapid activation of GLUT-1 glucose transporter
following inhibition of oxidative phosphorylation in clone 9 cells.
J Biol Chem. 268:17225–17232. 1993.PubMed/NCBI
|
|
31
|
Warburg O: On the origin of cancer cells.
Science. 123:309–314. 1956. View Article : Google Scholar : PubMed/NCBI
|
|
32
|
Ogawa T, Inugami A, Hatazawa J, et al:
Clinical positron emission tomography for brain tumors: comparison
of fludeoxyglucose F 18 and L-methyl-(11)C-methionine. Am J
Neuroradiol. 17:345–353. 1996.PubMed/NCBI
|
|
33
|
Adams S, Baum R, Schumm-Drager P, Usadel K
and Hor G: Limited value of fluorine-18 fluorodeoxyglucose positron
emission tomography for the imaging of neuroendocrine tumors. Eur J
Nucl Med. 25:79–83. 1998. View Article : Google Scholar : PubMed/NCBI
|
|
34
|
Taylor MD, Smith PW, Brix WK, et al:
Correlations between selected tumor markers and fluorodeoxyglucose
maximal standardized uptake values in esophageal cancer. Eur J
Cardiothorac Surg. 35:699–705. 2009. View Article : Google Scholar
|
|
35
|
Westerterp M, Sloof GW, Hoekstra OS, et
al: 18FDG uptake in oesophageal adenocarcinoma: linking biology and
outcome. J Cancer Res Clin Oncol. 134:227–236. 2008. View Article : Google Scholar : PubMed/NCBI
|
|
36
|
Kato H, Takita J, Miyazaki T, et al:
Correlation of 18-F- fluorodeoxyglucose (FDG) accumulation with
glucose transporter (Glut-1) expression in esophageal squamous cell
carcinoma. Anticancer Res. 23:3263–3272. 2003.PubMed/NCBI
|